CODA DIGEST Q All-Causes Delay and Cancellations to Air Transport in Europe Q1 2018
|
|
|
- Meagan Holt
- 5 years ago
- Views:
Transcription

1 All-Causes Delay and Cancellations to Air Transport in Europe Q Edition Number : CDA_2018_001 Edition Validity Date : 31/07/2018
2 DOCUMENT CHARACTERISTICS Document Title Document Subtitle (optional) Edition Number Edition Validity Date Use pop-up to enter value. CDA_2018_001 31/07/2018 Abstract Author(s) Yves De Wandeler Contact Person(s) Tel/ Unit NMD/PFR/FNI STATUS AND ACCESSIBILITY Status Accessible via Working Draft Intranet Draft Extranet Proposed Issue Internet ( Released Issue TLP STATUS Intended for Detail Red Highly sensitive, non-disclosable information Amber Sensitive information with limited disclosure Green Normal business information White Public information 2018 The European Organisation for the Safety of Air Navigation (EUROCONTROL). This document is published by EUROCONTROL for information purposes. It may be copied in whole or in part, provided that EUROCONTROL is mentioned as the source and the extent justified by the non-commercial use (not for sale). The information in this document may not be modified without prior written permission from EUROCONTROL. Edition Validity Date: 31/07/2018 Edition: CDA_2018_001 Status: Released Issue i
3 DOCUMENT APPROVAL AUTHORITY (Name and function) D. Marsh Head of Forecasts & Network Intelligence Unit G. Boydell Head Performance, Forecasts and Relations a.i. SIGNATURE DATE J. Sultana Director Network Manager 14/08/2018 Edition History The following table records the complete history of the successive editions of the present document. Edition History Edition No. Edition Validity Date Author CDA_2018_001 CDA_2018_001 Y. De Wandeler Reason Edition Validity Date: 31/07/2018 Edition: CDA_2018_001 Status: Released Issue ii
4 Table of Contents DOCUMENT CHARACTERISTICS... I DOCUMENT APPROVAL... II EDITION HISTORY... II TABLE OF CONTENTS... III 1 EXECUTIVE SUMMARY TRAFFIC AND AVERAGE DELAY PER FLIGHT OVERVIEW Q MONTHLY SUMMARY AVERAGE DELAY PER DELAYED FLIGHT (DEPARTURE) AVERAGE DELAY PER DELAYED FLIGHT (ARRIVAL) NM VERSUS AIRCRAFT OPERATOR EXPERIENCE OF DELAY DISTRIBUTION OF ALL FLIGHTS BY LENGTH OF DELAY (PUNCTUALITY) CODA OPERATIONAL FLIGHT CANCELLATION ANALYSIS CODA SCHEDULING INDICATORS CODA REACTIONARY DELAY ANALYSIS AVERAGE DEPARTURE DELAY PER FLIGHT BY HOUR AVERAGE DELAY PER DELAYED FLIGHT VS PERCENTAGE OF DELAYED FLIGHTS TOP 20 DELAY AFFECTED DEPARTURE AIRPORTS TOP 20 DELAY AFFECTED ARRIVAL AIRPORTS TOP 20 DELAY AFFECTED CITY PAIRS YEAR ON YEAR TRENDS IN ALL-CAUSES INDICATORS CODA DELAY GROUPINGS CORRELATION BETWEEN IATA DELAY CODES AND THE NM REGULATION CODES STANDARD IATA DELAY CODES (AHM 730) STANDARD IATA DELAY CODE SUB-CODES (AHM 731) GLOSSARY OF TERMS AND ABBREVIATIONS CODA COVERAGE OF IFR FLIGHTS IN ECAC REGION Q Edition Validity Date: 31/07/2018 Edition: CDA_2018_001 Status: Released Issue iii

5 Q12018 Departure Delay (from all causes) 12.3 mins/flight +1.9 vs. Q12017 Arrival Punctuality 79% -3%pt vs. Q12018 Flights arriving > 15 minutes ahead of schedule Early Arrivals 11% Main Delay Causes Q12018 in mins/flight Reactionary 5.5 Airline 3.4 ATFM En-Route Executive Summary Operational data received directly from airlines describing delays from all-causes for Q illustrated a story of significantly increased delays translating to an average all-causes departure delay of 12.3 minutes per flight, up 1.9 minutes per flight on Q Q saw much poorer punctuality to that of Q with 79% punctual arrivals compared to 82% in Q Winter weather conditions impacted operations throughout the quarter. A strong increase in daily flights of 3.5% in ECAC for the quarter is a common underlying factor in the main reported causes. Reactionary (knock-on) delay increased by 1.0 minutes per flight on Q and contributed 5.5 minutes to the 12.3 minutes average delay per flight due to an increase in primary delays. Delays due to airline operations remained the main cause of primary delay, contributing 3.4 minutes to the average delay per flight, a 0.5 minutes per flight increase compared to Q Aircraft de-icing contributed to the 0.3 minutes per flight increase of Other Weather delays to 1.0 minute per flight during Q1 2018, with remote de-icing potentially having a stronger impact on the arrival punctuality than the departure punctuality. Airlines reported that en-route ATFM delays remained stable at 0.5 minutes per flight, with airport ATFM delays increasing slightly to 0.8 minutes per flight. Operational cancellations increased to 2.1% of planned flights (up from 1.4% in Q1 2017) with winter storm Emma and a French ATC industrial action contributing to this increase. Edition Validity Date: 31/07/2018 Edition: CDA_2018_001 Status: Released Issue 1
. Figure 2.")
6 2 Traffic and Average Delay per Flight Overview Figure 1. Total Flights per Day in ECAC European flights (ECAC) in average daily terms increased by 3.5% in Q compared with Q Further information regarding traffic and forecasts can be found on the STATFOR website and via the STATFOR Interactive Dashboard (SID). Figure 2. Breakdown of the Average Delay per Delay Flight Q vs. Q Q saw an average departure delay per flight of 12.3 minutes for all-causes delay, an increase of 18% in comparison to Q Analysis of the delay reasons shows that reactionary delays contributed the most to the average delay with 5.5 minutes per flight. Airline-related delays increased by 0.5 minutes per flight. Seasonal weather impacted operations at several airports throughout the quarter, notably at London/Heathrow, Istanbul/Atatürk, Stockholm/Arlanda & Amsterdam. ATFM en-route delay remained stable at 0.5 minutes per flight, with ATC staffing issues in Karlsruhe UAC and a French ATC industrial action from 21 to 23 March. ATFM airport delay had the fourth highest contribution with 0.8 minutes per flight up by 0.1 minutes per flight. Edition Validity Date: 31/07/2018 Edition: CDA_2018_001 Status: Released Issue 2
. Figure 4.")
7 Figure 3. Primary Delay Causes Q vs. Q Total ATFM delays (airport, en-route and weather delay) reported by airlines remained stable at 1.5 minutes per flight. Winter weather conditions resulted in an increase of Other Weather delays (aircraft de-icing). Figure 4. Long Departure Delays >60 Minutes In Q1 2018, longer delays (those greater than 60 mins in orange) increased when compared to Q with 4.2% of flights experiencing long delays compared to 3.3% in Q February (4.1%) and March (5.0%) saw a peak in delays as winter weather conditions impacted airline operations significantly. Edition Validity Date: 31/07/2018 Edition: CDA_2018_001 Status: Released Issue 3
8 3 Q Monthly Summary Section 3 provides a month-by-month view for Q1 2018, highlighting the particular locations, causes of delay or disruption in further detail. January Q Seasonal weather impacted operations strongly at Amsterdam/Schiphol, London/Heathrow and Oslo/Gardermoen airports and, to a lesser extent, at Istanbul/Atatürk, London/Stansted, Madrid/Barajas, Frankfurt, Porto, Zurich and Stockholm/Arlanda airports. ATC staffing issues generated ATFM en-route delays in Karlsruhe UAC (Upper Area Control centre). February Q Seasonal weather impacted operations at London/Heathrow, Barcelona, Istanbul/Atatürk, Paris/Orly, Stockholm/Arlanda and Zurich airports. Severe weather conditions (snowstorms) in UK, Ireland and across Western Europe throughout the month led to multiple flight cancellations. ATC staffing issues generated ATFM en-route delays in Karlsruhe UAC. March Q Seasonal weather impacted operations at Istanbul/Atatürk, Amsterdam/Schiphol, London/Heathrow and Geneva airports. There were capacity issues at Istanbul/Atatürk and Amsterdam/Schiphol airports. ATC staffing issues generated ATFM en-route delays in Karlsruhe UAC (Upper Area Control centre). An Italian ATC industrial action on 08 March and a French ATC industrial action from 21 March to 23 March generated additional ATFM en-route delays and caused an increase in flight cancellations. Edition Validity Date: 31/07/2018 Edition: CDA_2018_001 Status: Released Issue 4
 driving this increase.")
 for Departures Figure 6.")
9 4 Average Delay per Delayed Flight (Departure) The average delay per delayed departure (ADD) increased by 2.2 minutes to 29.9 minutes per flight in Q with the higher delays during February and March (seasonal weather) driving this increase. The percentage of flights (PDF) delayed on departure (>=5 minutes) also increased, these up to 43.1% in Q from 38.5% in Q and was the highest Q1 PDF in the last 5 years. Figure 5. Average Delay per Flight (All-Causes) for Departures Figure 6. Average Delay per Delayed Flight (All-Causes) for Departures Figure 7. Percentage of Delayed Flights (All-Causes) for Departures Edition Validity Date: 31/07/2018 Edition: CDA_2018_001 Status: Released Issue 5

 for Arrivals Figure 9.")
10 5 Average Delay per Delayed Flight (Arrival) The average delay per delayed flight on arrival shows a similar trend to that of the departure delay with 30.9 minutes per flight, an increase of 2.1 minutes per flight when compared to Q The percentage of delayed arrivals also increased, this by 4.7 percentage point to 39.3% The use of schedule buffering can be observed when comparing Figures 7 and 10, with the difference between the percentage of delayed arrivals and delayed departures of 3.8 percentage points, this increasing year on year from 1.7% in Q to 3.8% in Q Figure 8. Average Delay per Flight (All-Causes) for Arrivals Figure 9. Average Delay per delayed Flight (All-Causes) for Arrivals Figure 10. Percentage of Delayed Flight (All-Causes) for Arrivals Edition Validity Date: 31/07/2018 Edition: CDA_2018_001 Status: Released Issue 6
 This section presents the air transport delay situation as seen from the airline and passenger viewpoint (the difference between the scheduled time of departure and the actual time")
 planned delays based on restrictions applied; the airlines report the actual experienced ATFCM delay on departure.")

11 6 NM Versus Aircraft Operator Experience of Delay Figure 11. Breakdown of Average Delay per Flight Q vs. Q (Network Manager vs. Aircraft Operator) This section presents the air transport delay situation as seen from the airline and passenger viewpoint (the difference between the scheduled time of departure and the actual time of departure from the gate). Data coverage is 71% of commercial flights in the ECAC region for Q ATFM delays calculated by NM are the (flight) planned delays based on restrictions applied; the airlines report the actual experienced ATFCM delay on departure. For instance, a flight with an ATFM restriction may also have a handling delay absorbed within the ATFM restriction. For the airline, a part of this delay is the ATFM delay and the rest is the handling delay. In the event of a longer duration delay an example being during ATC industrial action, a flight may keep its original schedule however when its flight plan is submitted for example a day later any ATFM delay allocated may be lower or zero, in this case airline reported delay will exceed NM reported ATFM delay. Further analysis of airline data shows that the average en-route ATFM delay from allcauses was 0.45 minutes per flight, this was stable when compared to the NM recorded average en-route ATFM delay per flight for the year of 0.48 minutes per flight. As reported by the airlines, primary delays (e.g. passenger and ramp handling delays) counted for 55% (6.8 min/flt) of which (0.45 min/flt) was attributed to en-route ATFM restrictions, with reactionary delays representing the remaining share of 45% of (5.5 min/flt). This resulted in an average departure delay per flight of 12.3 minutes per flight as reported in previous sections. Edition Validity Date: 31/07/2018 Edition: CDA_2018_001 Status: Released Issue 7

12 7 Punctuality In Q overall departure punctuality levels deteriorated with 39.5% of flights departing within the 5 minute threshold before or after the scheduled departure time (STD). Flights delayed >30 minutes from all-causes increased by 2.2 percentage point during the quarter to 10.9%. Airline arrival punctuality also fell, with 78.7% of flights arriving within 15 minutes or earlier than their scheduled arrival time (STA), compared to 82.2% in Q Figure 12. All-Causes Departure and Arrival Punctuality Q vs. Q Flights arriving >15 minutes ahead of schedule remained stable at 11%. This high share may affect airport stand availability and air traffic flow management operations (demand shifts) in the event of aircraft frequently arriving excessively ahead of their schedule. Edition Validity Date: 31/07/2018 Edition: CDA_2018_001 Status: Released Issue 8
13 Figure 13. Top 50* Airlines by Arrival On-Time Performance Q *The top 50 airlines reporting to CODA by number of flights. Arrival punctuality is calculated as the share of flights arriving within 15 minutes of the scheduled time (time of arrival at gate) Figure 14. Top 50* Airlines by Arrival On-Time Performance Q During the quarter fewer airlines were able to maintain 15 minute arrival punctuality above 85%. A total of 9 airlines saw more than 85% of their flights arrive within 15 minutes of the scheduled time of arrival vs. 12 airlines in Q Edition Validity Date: 31/07/2018 Edition: CDA_2018_001 Status: Released Issue 9
14 8 Operational Flight Cancellations These results are based on operational cancellation data supplied by 30 European coordinated airports reporting to CODA under EC Regulation N 390/2013. Albeit based on data supplied by a restricted list (see the conditions below) of major European airports, these results already give a good indication of trends and effects of Network events like industrial actions or extreme weather. The IFR flight coverage at the individual airports included in this analysis is 100%. Those airports currently unable to report operational cancellations in the required data format or those not meeting all of the criteria for operational cancellations were excluded from the analysis. According to Annex IV of EC Regulation N 390/2013 an Operational Cancellation means an arrival or departure scheduled flight to which the following conditions apply: The flight received an airport slot, and The flight was confirmed by the air carrier the day before operations and/or it was contained in the daily list of flight schedules produced by the airport operator the day before of operations, but The actual landing or take-off never occurred. Therefore this section of the CODA Digest reports on monthly and daily shares of operational cancellations of the total planned flights at day -1. Like delays, operational cancellations provide an insight into the impact of network events and associated disruption; e.g. industrial action or extreme weather events. Figure 15. Monthly Rate of Operational Cancellations Q Edition Validity Date: 31/07/2018 Edition: CDA_2018_001 Status: Released Issue 10
15 Figure 16. Average Daily Cancellation Q Figure 15 on the previous page shows the monthly rate of operational cancellations and Figure 16 provides the detail of cancellations by day from January 2017 to the end of Q It should be noted that initial cancellations count as operational cancellations under the terms of the regulation. In Q the operational cancellation rate was 2.1% compared to 1.4% in Q Severe weather conditions (snowstorms) in UK, Ireland and across Western Europe throughout February and March (including winter storm Emma between 26 February and 05 March 2018) led to widespread flight cancellations. An Italian ATC industrial action on 08 March and a French ATC industrial action from 21 March to 23 March caused an increase in flight cancellations. Edition Validity Date: 31/07/2018 Edition: CDA_2018_001 Status: Released Issue 11

16 9 Scheduling Indicators Scheduling correctly is a difficult art: if too long a time is blocked for a flight, the airline will not be able to make best use of resources - staff, airframes, infrastructure. But too short a time can arguably be worse as late flights generate rotational delay with late incoming aircraft and passengers from previous flights having to be accommodated. When flights leave on time but arrive after the scheduled time of arrival they cause reactionary delays. Schedule padding is essential for air carriers in order to find schedules which work with the typical patterns of delay, so that they can deliver passengers on time, and get maximum use out of their aircraft. Consequently when delays decrease it takes one or two (IATA) seasons for the airline to adapt its schedule accordingly. Two CODA scheduling indicators help airline schedulers determine the optimal schedule based on historical flight data: The Delay Difference Indicator - Flight (DDI-F) or the difference between departure and arrival punctuality expressed in minutes. This can be indicated as a positive or negative figure, for example a flight departing with 20 minutes delay and arriving with 30 minutes arrival delay will have a DDI-F of +10 minutes. The European DDI-F in Q was -3.8 minutes, this was a decrease of 0.1 minutes of schedule buffering per flight when compared to Q The Block Time Overshoot (BTO) is the percentage of flights with an actual block time which exceeds the scheduled block time. The European BTO in Q was 30%, this was an increase compared to Q where the BTO was 29%, indicating that on average a fewer number of flights had an actual block time exceeding their scheduled block time during the year. Figure 17. Block Time Overshoot (BTO) and Delay Difference Indicator - Flight (DDI-F) 2018 Edition Validity Date: 31/07/2018 Edition: CDA_2018_001 Status: Released Issue 12
17 10 Reactionary Delay Analysis In Q the share of reactionary delay (IATA delay codes 91-96) was 45% of delay minutes contributing 5.5 minutes per flight. Reactionary delays are generated as a result of an aircraft s late arrival from a previous flight which in turn affects the punctuality of its next flight with the same aircraft, as well as potentially delaying connecting passengers. See IATA Standard Delay Codes section for an overview of the IATA reactionary delay codes. Subsequently there are two types of reactionary delays: firstly as a result of the same aircraft being delayed on its next flight (rotational delay) and secondly when another aircraft is delayed as a result of another aircraft typically through passengers, crew and load connection (non-rotational delays). This section concentrates on IATA delay code 93 rotational delays, as these have a significant share of overall reactionary delays (approximately 90%) and the largest effect on network performance and passenger experience. In Figure 18 analysis shows that the median number of scheduled flights per sequence for an aircraft in Q was 4, up from 3 during Q The first and third quartile remained similar to to the previous winter season. A sequence combines flights operated by the same aircraft with a normal planned ground time between flights. A sequence will end when the aircraft remains on the ground for a longer time compared to a normal turn-around time, e.g. night stop, maintance slots etc. An increase in the scheduled sequence depth may also drive an increase in reactionary delays. Figure 18. Median Scheduled Flight Sequence Depth and Share of Reactionary Departure Delay on Intra European Flights: Q1. Edition Validity Date: 31/07/2018 Edition: CDA_2018_001 Status: Released Issue 13
18 11 Average Departure Delay per Flight by Hour Figure 19. Breakdown of the Average Departure Delay per Flight by Hour of the Day Q (top) vs (bottom) During the first rotation hours (between 0300 and 0900 UTC) Figure 19 shows a higher share of airline related delay when compared to Q The peak share of airline delays was reached at 05000utc and remained stable until 0700utc when it started to reduce. Reactionary delays show a similar pattern compared to Q with the share exceeding 60% by 2100UTC during Q Edition Validity Date: 31/07/2018 Edition: CDA_2018_001 Status: Released Issue 14
19 12 Average Delay per Delayed Flight vs Percentage of Delayed Flights Figure 20. ADD vs. PDF on Departure In Q1 2018, the percentage of flights delayed on departure (>=5 minutes) increased to 43.1%. The average delay per delayed (ADD) flight was 29.9 minutes, an increase of 2.2 minutes. Noticeable is the increased delay situation during March 2018 compared to March Figure 21. ADD vs. PDF on Arrival The average delay per delayed flight on arrival from all-causes was 30.9 minutes per flight Q an increase of 2.1 minutes per flight. The percentage of delayed arrivals also increased, this by 4 percentage point to 39.3% in comparison Q Edition Validity Date: 31/07/2018 Edition: CDA_2018_001 Status: Released Issue 15
 Delay Change Average delay per delayed departure Percentage delayed departures Average")
20 13 Top 20 Delay Affected Departure Airports Figure 22. All-Causes Delay. Top 20 Affected Departure Airports Q Rank departure airport ICAO Code Average delay per departure (mins) Delay Change Average delay per delayed departure Percentage delayed departures Average Reactionary Delay Per Departure (Mins) 1 ISTANBUL-ATATURK LTBA % % LONDON/LUTON EGGW % % STOCKHOLM-ARLANDA ESSA % % LONDON/STANSTED EGSS % % PARIS CH DE GAULLE LFPG % % KOELN-BONN EDDK % % LISBOA LPPT % % PARIS ORLY LFPO % % GENEVE COINTRIN LSGG % % BIRMINGHAM EGBB % % BRUSSELS NATIONAL EBBR % % FRANKFURT MAIN EDDF % % FERIHEGY-BUDAPEST LHBP % % MANCHESTER EGCC % % TEL AVIV/BEN GURION LLBG % PORTO LPPR % % LAS PALMAS GCLP % % LYON SATOLAS LFLL % % LONDON/GATWICK EGKK % % OTOPENI-INTL. LROP % % 4.4 Istanbul-Atatürk ranked first in the top 20 affected airports with flights departing from the airport suffering from airport delay, airline as well as weather delays. London-Luton airport ranked 2 nd with an average delay per flight of 17.2 mins, with airlines suffering from reactionary and airport delays. Airlines with flights departing from Stockholm-Arlanda suffered from airline and reactionary delays. Flights departing London-Stansted were affected by airport and airline delays. Figure 23. Main Delay Causes at the Top 10 Affected Departure Airports Edition Validity Date: 31/07/2018 Edition: CDA_2018_001 Status: Released Issue 16
 Delay Change Average delay per delayed arrival Percentage delayed arrivals Average Reactionary")

21 14 Top 20 Delay Affected Arrival Airports Figure 24. All-Causes Delay. Top 20 Affected Arrival Airports Q Rank arrival airport ICAO Code Average delay per arrival (mins) Delay Change Average delay per delayed arrival Percentage delayed arrivals Average Reactionary Delay Per Arrival (Mins) 1 STOCKHOLM-ARLANDA ESSA % % LONDON/STANSTED EGSS % % LONDON/LUTON EGGW % % ANKARA-ESENBOGA LTAC % % LISBOA LPPT % % PORTO LPPR % % KOELN-BONN EDDK % % OSLO/GARDERMOEN ENGM % % OTOPENI-INTL. LROP % % DUESSELDORF EDDL % % BIRMINGHAM EGBB % % ISTANBUL-ATATURK LTBA % % LONDON/GATWICK EGKK % % MANCHESTER EGCC % % HELSINKI-VANTAA EFHK % % ISTANBUL/SABIHA LTFJ % % LAS PALMAS GCLP % % PARIS CH DE GAULLE LFPG % % GENEVE COINTRIN LSGG % % FERIHEGY-BUDAPEST LHBP % % 6.3 Stockholm-Arlanda ranked worst for arrival delays in Q1 2018, with an average delay per flight on arrival of 16.1 minutes, with reactionary delays, airport and weather contributing to this figure. Flights to Ankara recorded high shares of reactionary delays. Figure 25. Main Delay Causes at the Top 10 Affected Arrival Airports Edition Validity Date: 31/07/2018 Edition: CDA_2018_001 Status: Released Issue 17
22 15 Top 20 Delay Affected City Pairs Rank Figure 26. All-Causes Delay Situation for the 20 Most Delayed Airport Pairs Q Departure Airport Arrival Airport Average Delay Per Departur e Change since Previous Period Average Delay Per Delayed Departure Percentage Delayed Departures 1 ISTANBUL-ATATURK ADANA-SAKIRPASA % % 2 ISTANBUL-ATATURK ANTALYA % % 3 STOCKHOLM-ARLANDA LULEA/KALLAX % % 4 STOCKHOLM-ARLANDA OSLO/GARDERMOEN % % 5 STOCKHOLM-ARLANDA GOTEBORG/LANDVETTER % % 6 GOTEBORG/LANDVETTER STOCKHOLM-ARLANDA % % 7 PORTO LISBOA % % 8 NEW YORK LONDON/HEATHROW % % 9 GENEVE COINTRIN LONDON/GATWICK % % 10 STOCKHOLM-ARLANDA MALMOE/STURUP % % 11 TROMSO/LANGNES OSLO/GARDERMOEN % % 12 SCHIPHOL AMSTERDAM PARIS CH DE GAULLE % % 13 LISBOA PORTO % % 14 PARIS CH DE GAULLE SCHIPHOL AMSTERDAM % % 15 LULEA/KALLAX STOCKHOLM-ARLANDA % % 16 STOCKHOLM-ARLANDA HELSINKI-VANTAA % % 17 LISBOA AEROPORTO DA MADEIRA % % 18 OSLO/GARDERMOEN TROMSO/LANGNES % % 19 PARIS CH DE GAULLE GENEVE COINTRIN % % 20 GENEVE COINTRIN LONDON/HEATHROW % % Some Turkish domestic routes ranked in top in the most delayed airport pairs for Q Some intra-scandinavian routes also ranked high mainly driven by winter weather conditions throughout Q Edition Validity Date: 31/07/2018 Edition: CDA_2018_001 Status: Released Issue 18
23 16 Year on Year Trends in All-Causes Indicators This section summarises the year-on-year trends in the main indicators of delay from all-causes. A flight is considered delayed from 5 minutes. This is based on CODA data covering 71% of commercial flights in the ECAC region in Q Figure 27 Average all-causes delay/delayed flight (departures top, arrivals bottom) Figure 28. Percentage of flights delayed for all-causes delay (departures top, arrivals bottom) Edition Validity Date: 31/07/2018 Edition: CDA_2018_001 Status: Released Issue 19
24 Figure 29. Percentage of flights delayed >15mins for all-causes (departures top, arrivals bottom) Edition Validity Date: 31/07/2018 Edition: CDA_2018_001 Status: Released Issue 20
25 17 CODA Delay Groupings CODA CAUSE Description IATA Code Passenger and Baggage Cargo and Mail Aircraft and Ramp Handling Airline Technical and Aircraft Equipment Damage to Aircraft & EDP/Automated Equipment Failure Primary Delay Causes Airport Flight Operations and Crewing Other Airline Related Causes Others ATFM due to Restriction at Destination Airport 83 Airport Facilities 87 Restrictions at Airport of Destination 88 En-Route Restrictions at Airport of Departure 89 ATFM due to ATC En-Route Demand / Capacity 81 ATFM due to ATC Staff / Equipment En-Route 82 Governmental Security and Immigration Weather Weather (other than ATFM) ATFM due to Weather at Destination 84 Miscellaneous Miscellaneous Reactionary Late Arrival of Aircraft, Crew, Passengers or Load Edition Validity Date: 31/07/2018 Edition: CDA_2018_001 Status: Released Issue 21


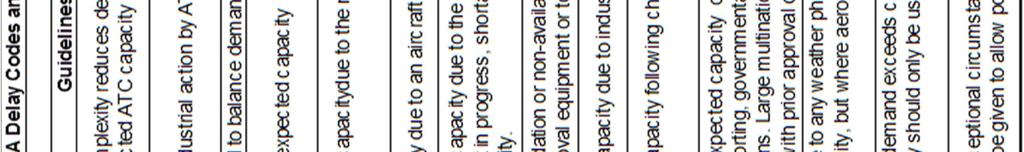
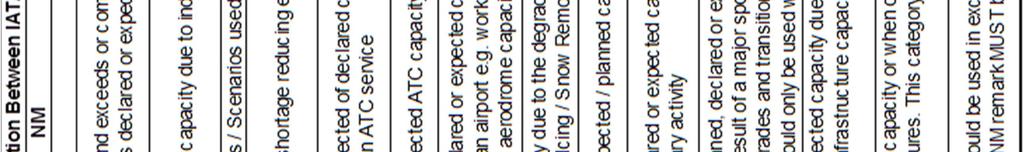
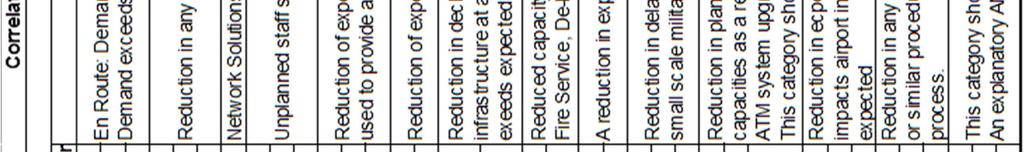
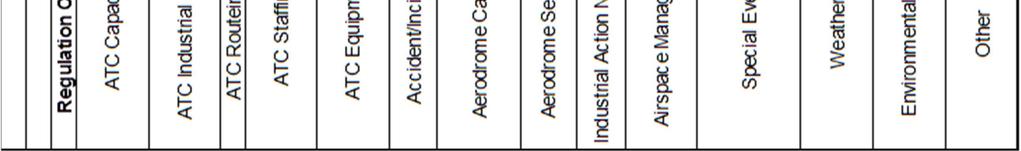
26 Network Manager 18 Correlation between IATA Delay Codes and the NM Regulation Codes Note: updated version published in the ATFCM Users Manual Edition Validity Date: 31/07/2018 Edition: CDA_2018_001 Status: Released Issue 22
27 19 Standard IATA Delay Codes (AHM 730) Others AIRLINE INTERNAL CODES 06 (OA) NO GATE/STAND AVAILABILITY DUE TO OWN AIRLINE ACTIVITY Including Early Arrivals 09 (SG) SCHEDULED GROUND TIME LESS THAN DECLARED MINIMUM GROUND TIME Passenger and Baggage 11 (PD) LATE CHECK-IN, acceptance after deadline 12 (PL) LATE CHECK-IN, congestions in check-in area 13 (PE) CHECK-IN ERROR, passenger and baggage 14 (PO) OVERSALES, booking errors 15 (PH) BOARDING, discrepancies and paging, missing checked-in passenger 16 (PS) COMMERCIAL PUBLICITY/PASSENGER CONVENIENCE, VIP, press, ground meals and missing personal items 17 (PC) CATERING ORDER, late or incorrect order given to supplier 18 (PB) BAGGAGE PROCESSING, sorting etc. 19 (PW) REDUCED MOBILITY, boarding / deboarding of passengers with reduced mobility. Cargo and Mail 21 (CD) DOCUMENTATION, errors etc. 22 (CP) LATE POSITIONING 23 (CC) LATE ACCEPTANCE 24 (CI) INADEQUATE PACKING 25 (CO) OVERSALES, booking errors 26 (CU) LATE PREPARATION IN WAREHOUSE 27 (CE) DOCUMENTATION, PACKING etc (Mail Only) 28 (CL) LATE POSITIONING (Mail Only) 29 (CA) LATE ACCEPTANCE (Mail Only) Aircraft and Ramp Handling 31 (GD) AIRCRAFT DOCUMENTATION LATE/INACCURATE, weight and balance, general declaration, pax manifest, etc. 32 (GL) LOADING/UNLOADING, bulky, special load, cabin load, lack of loading staff 33 (GE) LOADING EQUIPMENT, lack of or breakdown, e.g. container pallet loader, lack of staff 34 (GS) SERVICING EQUIPMENT, lack of or breakdown, lack of staff, e.g. steps 35 (GC) AIRCRAFT CLEANING 36 (GF) FUELLING/DEFUELLING, fuel supplier 37 (GB) CATERING, late delivery or loading 38 (GU) ULD, lack of or serviceability 39 (GT) TECHNICAL EQUIPMENT, lack of or breakdown, lack of staff, e.g. pushback Technical and Aircraft Equipment 41 (TD) AIRCRAFT DEFECTS. 42 (TM) SCHEDULED MAINTENANCE, late release. 43 (TN) NON-SCHEDULED MAINTENANCE, special checks and/or additional works beyond normal maintenance schedule. 44 (TS) SPARES AND MAINTENANCE EQUIPMENT, lack of or breakdown. 45 (TA) AOG SPARES, to be carried to another station. 46 (TC) AIRCRAFT CHANGE, for technical reasons. 47 (TL) STAND-BY AIRCRAFT, lack of planned stand-by aircraft for technical reasons. 48 (TV) SCHEDULED CABIN CONFIGURATION/VERSION ADJUSTMENTS. Damage to Aircraft & EDP/Automated Equipment Failure 51 (DF) DAMAGE DURING FLIGHT OPERATIONS, bird or lightning strike, turbulence, heavy or overweight landing, collision during taxiing 52 (DG) DAMAGE DURING GROUND OPERATIONS, collisions (other than during taxiing), loading/offloading damage, contamination, towing, extreme weather conditions 55 (ED) DEPARTURE CONTROL 56 (EC) CARGO PREPARATION/DOCUMENTATION 57 (EF) FLIGHT PLANS 58 (EO) OTHER AUTOMATED SYSTEM Flight Operations and Crewing 61 (FP) FLIGHT PLAN, late completion or change of, flight documentation 62 (FF) OPERATIONAL REQUIREMENTS, fuel, load alteration Edition Validity Date: 31/07/2018 Edition: CDA_2018_001 Status: Released Issue 23
28 63 (FT) LATE CREW BOARDING OR DEPARTURE PROCEDURES, other than connection and standby (flight deck or entire crew) 64 (FS) FLIGHT DECK CREW SHORTAGE, sickness, awaiting standby, flight time limitations, crew meals, valid visa, health documents, etc. 65 (FR) FLIGHT DECK CREW SPECIAL REQUEST, not within operational requirements 66 (FL) LATE CABIN CREW BOARDING OR DEPARTURE PROCEDURES, other than connection and standby 67 (FC) CABIN CREW SHORTAGE, sickness, awaiting standby, flight time limitations, crew meals, valid visa, health documents, etc. 68 (FA) CABIN CREW ERROR OR SPECIAL REQUEST, not within operational requirements 69 (FB) CAPTAIN REQUEST FOR SECURITY CHECK, extraordinary Weather 71 (WO) DEPARTURE STATION 72 (WT) DESTINATION STATION 73 (WR) EN ROUTE OR ALTERNATE 75 (WI) DE-ICING OF AIRCRAFT, removal of ice and/or snow, frost prevention excluding unserviceability of equipment 76 (WS) REMOVAL OF SNOW, ICE, WATER AND SAND FROM AIRPORT 77 (WG) GROUND HANDLING IMPAIRED BY ADVERSE WEATHER CONDITIONS Air Traffic Flow Management Restrictions 81 (AT) ATFM due to ATC EN-ROUTE DEMAND/CAPACITY, standard demand/capacity problems 82 (AX) ATFM due to ATC STAFF/EQUIPMENT EN-ROUTE, reduced capacity caused by industrial action or staff shortage, equipment failure, military exercise or extraordinary demand due to capacity reduction in neighbouring area 83 (AE) ATFM due to RESTRICTION AT DESTINATION AIRPORT, airport and/or runway closed due to obstruction, industrial action, staff shortage, political unrest, noise abatement, night curfew, special flights 84 (AW) ATFM due to WEATHER AT DESTINATION Airport and Government Authorities 85 (AS) MANDATORY SECURITY 86 (AG) IMMIGRATION, CUSTOMS, HEALTH 87 (AF) AIRPORT FACILITIES, parking stands, ramp congestion, lighting, buildings, gate limitations, etc. 88 (AD) RESTRICTIONS AT AIRPORT OF DESTINATION, airport and/or runway closed due to obstruction, industrial action, staff shortage, political unrest, noise abatement, night curfew, special flights 89 (AM) RESTRICTIONS AT AIRPORT OF DEPARTURE WITH OR WITHOUT ATFM RESTRICTIONS, including Air Traffic Services, start-up and pushback, airport and/or runway closed due to obstruction or weather 2, industrial action, staff shortage, political unrest, noise abatement, night curfew, special flights Reactionary 91 (RL) LOAD CONNECTION, awaiting load from another flight 92 (RT) THROUGH CHECK-IN ERROR, passenger and baggage 93 (RA) AIRCRAFT ROTATION, late arrival of aircraft from another flight or previous sector 94 (RS) CABIN CREW ROTATION, awaiting cabin crew from another flight 95 (RC) CREW ROTATION, awaiting crew from another flight (flight deck or entire crew) 96 (RO) OPERATIONS CONTROL, re-routing, diversion, consolidation, aircraft change for reasons other than technical Miscellaneous 97 (MI) INDUSTRIAL ACTION WITH OWN AIRLINE 98 (MO) INDUSTRIAL ACTION OUTSIDE OWN AIRLINE, excluding ATS 99 (MX) OTHER REASON, not matching any code above SOURCE: IATA Airport Handling Manual (730 & 731) 2 Restriction due to weather in case of ATFM regulation only, else refer to code 71 (WO) Edition Validity Date: 31/07/2018 Edition: CDA_2018_001 Status: Released Issue 24
29 20 Standard IATA Delay Code Sub-Codes (AHM 731) 73 (WR) WEATHER: EN ROUTE OR ALTERNATE Z OUTSIDE AIRCRAFT LIMITS Y OUTSIDE CREW LIMITS X ETOPS 81 (AT) ATFM DUE TO ATC EN-ROUTE DEMAND/CAPACITY, standard demand/capacity problems Z ATC ROUTEING Y HIGH DEMAND OR CAPACITY X ENVIRONMENTAL W WEATHER G OTHER 82 (AX) ATFM DUE TO ATC STAFF/EQUIPMENT EN-ROUTE, reduced capacity caused by industrial action or shortage or equipment failure, extraordinary demand due to capacity reduction in neighbouring area Z INDUSTRIAL ACTION Y EQUIPMENT FAILURE X STAFF SHORTAGE W MILITARY ACTIVITY V SPECIAL EVENT 83 (AE) ATFM DUE TO RESTRICTION AT DESTINATION AIRPORT, airport and/or runway closed due to obstruction, industrial action, staff shortage, political unrest, noise abatement, night curfew, special flights Z HIGH DEMAND / ATC CAPACITY Y INDUSTRIAL ACTION X EQUIPMENT FAILURE W STAFF SHORTAGE V ACCIDENT / INCIDENT U MILITARY ACTIVITY T SPECIAL EVENT S NOISE ABATEMENT/NIGHT CURFEW P HIGH DEMAND/AIRPORT FACILTIES 85 (AS) MANDATORY SECURITY Z MANDATORY SECURITY CHECK Y SECURITY CONTROL CHECKPOINTS X BAGGAGE/AVI SECURITY W BAGGAGE IDENTIFICATION/UNLOADING/INTENDED V AIRPORT/TERMINAL SECURITY U AIRLINE/AIRCRAFT SECURITY CHECK T EXTRAORDINARY SECURITY EVENTS G OTHER 86 (AG) IMMIGRATION, CUSTOMS, HEALTH Z IMMIGRATION/EMMIGRATION Y CUSTOMS X HEALTH G OTHER 87 (AF) AIRPORT FACILITIES, parking stands, ramp congestion, lighting, buildings, gate limitations, etc. Z PARKING STANDS LIMITATION/NO PARKING STANDS AVAILABLE, EXCLUDING EARLY ARRIVALS Y RAMP CONGESTION, ABNORMAL STAND ACCESS LIMITATION (NON-ATC) X BUILDINGS W GATE LIMITATION / NO GATE AVAILABLE EXCLUDING EARLY ARRIVALS V BAGGAGE SORTING SYSTEM DOWN / SLOW U NO PUSH BACK CLEARANCE DUE TO INFRASTRUCTURE (NON-ATC) T JET BRIDGE INOPERATIVE S LACK OF CHECK IN COUNTERS R AIRFIELD ELECTRICAL SYSTEM FAILURE P PASSENGER TRANSPORT SYSTEM FAILURE N PUBLIC ADDRESS/FLIGHT INFORMATION DISPLAY SYSTEM FAILURE M INSUFFICIENT FIRE COVER J LATE POSITIONING OF AIRCRAFT (WHEN RESPONSIBILITY OF AIRPORT) I SERVICE ROAD RESTRICTION H LATE ARRIVAL OR LACK OF FOLLOW ME VEHICLE G ANY OF THE ABOVE AT THE DESTINATION AIRPORT Edition Validity Date: 31/07/2018 Edition: CDA_2018_001 Status: Released Issue 25
30 89 (AM) RESTRICTIONS AT AIRPORT OF DEPARTURE WITH OR WITHOUT ATFM RESTRICTIONS, including Air Traffic Services, start-up and pushback, airport and/or runway closed due to obstruction or weather. Z ATC CAPACITY Y ATC INDUSTRIAL ACTION X ATC STAFFING W ATC EQUIPMENT V ATC ACCIDENT/INCIDENT U MILITARY ACTIVITY/SPECIAL FLIGHTS/VIP T ATC SPECIAL EVENT S ATC WEATHER O ENVIRONMENTAL BENEFIT, DELAYED START-UP/PUSHBACK DUE TO USE OF REDUCED STANDARD TAXI TIMES R ATC RESTRICTIONS DUE TO CURFEW P ATC POLITICAL UNREST N ATC ENVIRONMENTAL M AIRPORT CLOSURE L RUNWAY CLOSURE K MISCELLANEOUS START-UP DELAY (LOCAL ATC) J LOST FLIGHT PLAN BY ATC I LATE PUSHBACK GIVEN DUE TO OTHER REASONS THAN INFRASTRUCTURE H CONSTRUCTION WORK/MAINTENENCE G OTHER 93 (RA) AIRCRAFT ROTATION, late arrival of aircraft from another flight Z LATE ARRIVAL DUE DEPARTURE DELAY AT PREVIOUS STATION Y LATE ARRIVAL DUE ENROUTE DELAY X LATE ARRIVAL DUE DELAY AFTER LANDING W LATE ARRIVAL DUE TO HIGH DEMAND FOR DESTINATION STATION V LATE ARRIVAL DUE TO WEATHER AT DESTINATION U LATE ARRIVAL DUE TO TECHNICAL REASONS Edition Validity Date: 31/07/2018 Edition: CDA_2018_001 Status: Released Issue 26
31 21 Glossary of Terms and Abbreviations ACC ADD AHM AIBT AOBT ATFCM ATFM ATS BTO CODA DDI-F ECAC FIR IATA ICAO IFR NM NM NMOC PDF STA STD TDF TDM TTF Area Control Centre Average Delay per Delayed Flight Airport Handling Manual Actual In Block Time Actual Off Block Time Air Traffic Flow and Capacity Management Air Traffic Flow Management (used by IATA in the Standard IATA Delay Codes) Air Traffic Services Block Time Overshoot Central Office for Delay Analysis Delay Difference Indicator Flight European Civil Aviation Conference Flight Information Region International Air Transport Association International Civil Aviation Organization Instrument Flight Rules Network Manager Network Manager Network Manager Operations Centre Percentage of Delayed Flights Scheduled Time of Arrival Scheduled Time of Departure Total Delayed Flights Total Delay in Minutes Total Flights Edition Validity Date: 31/07/2018 Edition: CDA_2018_001 Status: Released Issue 27
32 Network Manager 22 CODA Coverage of IFR Flights in Q EUROCONTROL Member States and Partner Countries Edition Validity Date: 31/07/2018 Edition: CDA_2018_001 Status: Released Issue 28
33 DOCUMENT FINAL PAGE Edition Validity Date: 31/07/2018 Edition: CDA_2018_001 Status: Released Issue 29
CODA DIGEST Q All-Causes Delay and Cancellations to Air Transport in Europe Q Edition Validity Date
 All-Causes Delay and Cancellations to Air Transport in Europe Q1 2016 Edition Number Edition Validity Date : CDA_2016_001 : Use 16/08/2016 pop-up to enter value. DOCUMENT CHARACTERISTICS Document Title
CODA DIGEST Q All-Causes Delay and Cancellations to Air Transport Europe Q : Use pop-up to enter value. Edition Validity Date
 CODA DIGEST Q2 2016 All-Causes Delay and Cancellations to Air Transport Europe Q2 2016 Edition Number Edition Validity Date : CDA_2016_002 : Use pop-up to enter value. 14/11/2016 DOCUMENT CHARACTERISTICS
CODA DIGEST Q All-Causes Delay and Cancellations to Air Transport in Europe Q2 2018
 All-Causes Delay and Cancellations to Air Transport in Europe Q2 2018 Edition Number : CDA_2018_002 Edition Validity Date : 31/10/2018 DOCUMENT CHARACTERISTICS Document Title Document Subtitle (optional)
CODA DIGEST Q All-Causes Delay and Cancellations to Air Transport in Europe Quarter
 CODA DIGEST Q1 2017 All-Causes Delay and Cancellations to Air Transport in Europe Quarter 1 2017 Edition Number : CDA_2017_001 Edition Validity Date : 01/06/2017 DOCUMENT CHARACTERISTICS Document Title
CODA DIGEST Q All-Causes Delay and Cancellations to Air Transport in Europe - Q3 2017
 CODA DIGEST Q3 2017 All-Causes Delay and Cancellations to Air Transport in Europe - Q3 2017 Edition Number : CDA_2017_003 Edition Validity Date : 22/12/2017 DOCUMENT CHARACTERISTICS Document Title Document
CODA Digest All- Causes Delay and Cancellations to Air Transport in Europe Quarter
 CODA Digest All-Causes Delay and Cancellations to Air Transport in Europe Quarter 3 2014 FOREWORD This report gives an overview of the delay situation in the European Civil Aviation Conference Area. This
CODA Digest All- Causes Delay and Cancellations to Air Transport in Europe Quarter
 CODA Digest All-Causes Delay and Cancellations to Air Transport in Europe Quarter 4 2014 FOREWORD This report gives an overview of the delay situation in the European Civil Aviation Conference Area. This
CODA DIGEST Q All-Causes Delay and Cancellations to Air Transport in Europe Q3 2015
 CODA DIGEST Q3 2015 All-Causes Delay and Cancellations to Air Transport in Europe Q3 2015 Edition Number : CDA_2015_003 Edition Validity Date : 16/12/2015 DOCUMENT CHARACTERISTICS Document Title Document
CODA DIGEST All-Causes and Cancellations to Air Transport in Europe
 CODA DIGEST 2016 All-Causes and Cancellations to Air Transport in Europe - 2016 Edition Number : CDA_2017_005 Edition Validity Date : 07/04/2017 DOCUMENT CHARACTERISTICS Document Title Document Subtitle
Delays decreased in August 2012, with airline delay data for all causes showing an average delay per delayed flight of 25 minutes, this was a
 Delays decreased in August 2012, with airline delay data for all causes showing an average delay per delayed flight of 25 minutes, this was a decrease of 9.8% in comparison to the delays observed in August
CODA DIGEST Q All-Causes Delay and Cancellations to Air Transport in Europe - Q2 2015
 All-Causes Delay and Cancellations to Air Transport in Europe - Q2 2015 Edition Number : CDA_2015_002 Edition Validity Date : 18/08/2015 DOCUMENT CHARACTERISTICS Document Title Document Subtitle (optional)
CODA DIGEST. All-Causes Delay and Cancellations to Air Transport in Europe 2014
 CODA DIGEST All-Causes Delay and Cancellations to Air Transport in Europe 2014 Edition Number : CDA_2014_005 Edition Validity Date : 09/04/2015 DOCUMENT CHARACTERISTICS Document Title Document Subtitle
CODA DIGEST All-Causes Delay and Cancellations to Air Transport in Europe Annual 2015
 All-Causes Delay and Cancellations to Air Transport in Europe Annual 2015 Edition Number : CDA_2015_005 Edition Validity Date : 30/05/2016 INTENTIONALLY BLANK PAGE Edition Validity Date: 30/05/2016 Edition:
Delays decreased slightly in July 2012, with airline delay data for all causes showing an average delay per delayed flight of 27 minutes, this was a
 Delays decreased slightly in July 2012, with airline delay data for all causes showing an average delay per delayed flight of 27 minutes, this was a decrease of 5% in comparison to the delays observed
Delays decreased in May 2012, with airline delay data for all-causes showing an average delay per delayed flight of 25 minutes, which is a decrease
 Delays decreased in May 2012, with airline delay data for all-causes showing an average delay per delayed flight of 25 minutes, which is a decrease of 3.5% in comparison to the delays observed in May 2011.
Delays decreased in September 2012, with airline delay data for all causes showing an average delay per delayed flight of 25 minutes, this was a
 Delays decreased in September 2012, with airline delay data for all causes showing an average delay per delayed flight of 25 minutes, this was a decrease of 9% in comparison to the delays observed in September
Digest Delays to Air Transport in Europe June 2011
 FOREWORD This report gives an overview of the delay situation in the European Civil Aviation Conference Area. This report has been prepared by the Central Office for Delay Analysis (CODA), a service of
Digest Delays to Air Transport in Europe November 2011
 FOREWORD This report gives an overview of the delay situation in the European Civil Aviation Conference Area. This report has been prepared by the Central Office for Delay Analysis (CODA), a service of
Digest Delays to Air Transport in Europe August 2011
 FOREWORD This report gives an overview of the delay situation in the European Civil Aviation Conference Area. This report has been prepared by the Central Office for Delay Analysis (CODA), a service of
Ground Handling Manual
 Page: 1 8.0 Contents 8.0 Contents...1 8.1 General...3 8.1.1 Company Designators...3 8.2 - Movement Messages...3 8.2.1 General...3 8.2.2 Arrival...3 8.2.3 Departure...4 8.2.4 Departure with delay information...4
Digest Delays to Air Transport in Europe Summer 2011
 FOREWORD This report gives an overview of the delay situation in the European Civil Aviation Conference Area. This report has been prepared by the Central Office for Delay Analysis (CODA), a service of
Mumbai International Airport Pvt Ltd
 AIRLIN FLIGH T ON DELAY Min) DELAY PAENG ER & COD AIRCRAF T & HANDLI NG COD NUMBER OF DELAY DUE TO AIRLIN WEATHER ATC TECHNICA L, AUTOMAT EQUIPME NT FAILURE COD 41-48) OPERATIO N, CREW COD 61- REACTIONA
Digest Delays to Air Transport in Europe June This page has been deliberately left blank. EUROCONTROL 2 CODA
 This page has been deliberately left blank. EUROCONTROL 2 CODA FOREWORD This report gives an overview of the delay situation in the European Civil Aviation Conference Area. It is based on (1) the EUROCONTROL
Directorate Network Management Monthly Network Operations Report Analysis - March 2012
 Directorate Network Management Monthly Network Operations Report Analysis - March 212 TABLE OF CONTENTS 1. TOTAL TRAFFIC... 1 2. ATFM DELAY AND ATTRIBUTIONS... 4 3. EN-ROUTE ATFM DELAYS... 5 3.1. EN-ROUTE
Directorate Network Management Monthly Network Operations Report Analysis - May 2012
 Directorate Network Management Monthly Network Operations Report Analysis - May 212 TABLE OF CONTENTS 1. TOTAL TRAFFIC 1 2. ATFM DELAY AND ATTRIBUTIONS 4 3. EN-ROUTE ATFM DELAYS 5 4. AIRPORT/TMA ATFM DELAYS
Traffic, delays and forecasts European summer traffic falls outlook for modest long-term growth
 Skyway 17 Traffic, delays and forecasts European summer traffic falls outlook for modest long-term growth EUROCONTROL monitors the performance of Europe s wider air transport system and the more detailed
Directorate Network Management Monthly Network Operations Report Analysis - June 2012
 Directorate Network Management Monthly Network Operations Report Analysis - June 212 TABLE OF CONTENTS 1. TOTAL TRAFFIC 1 2. ATFM DELAY AND ATTRIBUTIONS 4 3. EN-ROUTE ATFM DELAYS 5 4. AIRPORT/TMA ATFM
Directorate Network Management Monthly Network Operations Report Analysis - April 2012
 Directorate Network Management Monthly Network Operations Report Analysis - April 212 TABLE OF CONTENTS 1. TOTAL TRAFFIC 1 2. ATFM DELAY AND ATTRIBUTIONS 4 3. EN-ROUTE ATFM DELAYS 5 4. AIRPORT/TMA ATFM
NETWORK OPERATIONS REPORT OCTOBER 2011
 OBER. TRAFFIC TOTAL FLIGHTS Last months average daily traffic 8 6 4 8 6 79 5 97 44 5684 694 8786 4 4 9974 589 84 Traffic increased by.% compared to October. Compared to September, the traffic was 8. lower.
Directorate Network Management Monthly Network Operations Report Analysis November 2012
 Directorate Network Management Monthly Network Operations Report Analysis November 212 TABLE OF CONTENTS 1. TOTAL TRAFFIC... 1 2. ATFM DELAY AND ATTRIBUTIONS... 4 3. EN-ROUTE ATFM DELAYS... 5 4. AIRPORT/TMA
Directorate Network Management Monthly Network Operations Report Analysis February 2013
 Directorate Network Management Monthly Network Operations Report Analysis February 213 TABLE OF CONTENTS 1. TOTAL TRAFFIC... 2 2. ATFM DELAY AND ATTRIBUTIONS... 5 3. ATFM DELAYS... 6 4. AIRPORT/TMA ATFM
Monthly Network Operations Report
 Monthly Network Operations Report Analysis July 213 TABLE OF CONTENTS 1. TOTAL TRAFFIC... 2 2. ATFM DELAY AND ATTRIBUTIONS... 5 3. EN-ROUTE ATFM DELAYS... 6 4. AIRPORT/TMA ATFM DELAYS... 1 5. DAILY EVOLUTION...
Monthly Network Operations Report
 Monthly Network Operations Report Analysis August 213 TABLE OF CONTENTS 1. TOTAL TRAFFIC... 2 2. ATFM DELAY AND ATTRIBUTIONS... 5 3. EN-ROUTE ATFM DELAYS... 6 4. AIRPORT/TMA ATFM DELAYS... 1 5. DAILY EVOLUTION...
NETWORK OPERATIONS REPORT September 2011
 September 20. TRAFFIC TOTAL FLIGHTS 32000 Last 3 months average daily traffic 30000 28000 Traffic increased by 2.7% compared to September 200. 26000 24000 22000 Compared to August 20, the traffic was 2.%
Monthly Network Operations Report
 Monthly Network Operations Report Analysis March 213 TABLE OF CONTENTS 1. TOTAL TRAFFIC... 2 2. ATFM DELAY AND ATTRIBUTIONS... 5 3. ATFM DELAYS... 6 4. AIRPORT/TMA ATFM DELAYS... 1 5. DAILY EVOLUTION...
PERFORMANCE REPORT CAPACITY
 PERFORMANCE REPORT 2015-2019 CAPACITY June 2018 Contents Description & Analysis 3 FABEC TRAFFIC DEVELOPMENT (en-route) 4 FABEC TRAFFIC DEVELOPMENT (arrival) 5 KPI #1: En-route ATFM delay per controlled
PERFORMANCE REPORT CAPACITY
 PERFORMANCE REPORT 2015-2019 CAPACITY December 2018 Contents Description & Analysis 3 FABEC TRAFFIC DEVELOPMENT (en-route) 4 FABEC TRAFFIC DEVELOPMENT (arrival) 5 KPI #1: En-route ATFM delay per controlled
Monthly Network Operations Report
 Monthly Network Operations Report Analysis January 218 NM Monthly Network Operations Report - Analysis January 218 TLP: GREEN Page 1 TABLE OF CONTENTS TABLE OF CONTENTS 2 NOTICE 2 1. TOTAL TRAFFIC 3 2.
NETWORK OPERATIONS REPORT Main Report - Draft for Consultation Draft for Consultation
 Draft for Consultation Edition Number: 1.0 20/04/2018 DOCUMENT CHARACTERISTICS Document Title Document Subtitle Edition Number Edition Validity Date NETWORK Main Report - Draft OPERATIONS 1.0 20/04/2018
Directorate Network Management Monthly Network Operations Report Analysis - August 2012
 Directorate Network Management Monthly Network Operations Report Analysis - August 212 TABLE OF CONTENTS 1. TOTAL TRAFFIC... 1 2. ATFM DELAY AND ATTRIBUTIONS... 4 3. EN-ROUTE ATFM DELAYS... 5 4. AIRPORT/TMA
PERFORMANCE REPORT CAPACITY
 PERFORMANCE REPORT 2015-2019 CAPACITY January 2019 Contents Description & Analysis 3 FABEC TRAFFIC DEVELOPMENT (en-route) 4 FABEC TRAFFIC DEVELOPMENT (arrival) 5 KPI #1: En-route ATFM delay per controlled
Monthly Network Operations Report
 Monthly Network Operations Report Analysis February 218 NM Monthly Network Operations Report - Analysis February 218 TLP: GREEN Page 1 TABLE OF CONTENTS TABLE OF CONTENTS 2 NOTICE 2 1. TOTAL TRAFFIC 3
Monthly Network Operations Report Analysis February 2019
 Monthly Network Operations Report Analysis February 219 NM Monthly Network Operations Report - Analysis February 219 TLP: WHITE Page 1 TABLE OF CONTENTS TABLE OF CONTENTS 2 NOTICE 2 TOTAL TRAFFIC 3 ATFM
Monthly Network Operations Report
 Monthly Network Operations Report Analysis December 217 NM Monthly Network Operations Report - Analysis December 217 TLP: GREEN Page 1 TABLE OF CONTENTS TABLE OF CONTENTS 2 NOTICE 2 1. TOTAL TRAFFIC 3
Monthly Network Operations Report Analysis January 2019
 Monthly Network Operations Report Analysis January 219 NM Monthly Network Operations Report - Analysis January 219 TLP: WHITE Page 1 TABLE OF CONTENTS TABLE OF CONTENTS 2 NOTICE 2 TOTAL TRAFFIC 3 ATFM
Network Operations Performance
 User Forum 2013 Network Operations Performance Operations performance in 2012 Ged Boydell Head Operational Analysis & Reporting 23 January 2013 Traffic and Capacity/Delay headlines 32000 30000 28000 26000
Monthly Network Operations Report
 Monthly Network Operations Report Analysis - December 213 TABLE OF CONTENTS 1. TOTAL TRAFFIC... 2 2. ATFM DELAY AND ATTRIBUTIONS... 5 3. EN-ROUTE ATFM DELAYS... 6 4. AIRPORT/TMA ATFM DELAYS... 1 5. DAILY
Monthly Network Operations Report
 Monthly Network Operations Report Analysis January 217 NM Monthly Network Operations Report - Analysis January 217 Page 1 TABLE OF CONTENTS TABLE OF CONTENTS 2 NOTICE 2 1. TOTAL TRAFFIC 3 2. ATFM DELAY
ANNUAL NETWORK OPERATIONS REPORT Annex III - Airports Final Edition
 Edition Number: 1.0 Edition Validity Date: 18/05/2016 Edition Validity Date: 18/05/2016 Edition: 1.0 Status: Final ii DOCUMENT CHARACTERISTICS Document Title ANNUAL NETWORK OPERATIONS REPORT Document Subtitle
Monthly Network Operations Report Analysis December 2018
 Monthly Network Operations Report Analysis December 218 NM Monthly Network Operations Report - Analysis December 218 TLP: WHITE Page 1 TABLE OF CONTENTS TABLE OF CONTENTS 2 NOTICE 2 TOTAL TRAFFIC 3 ATFM
ANNUAL NETWORK OPERATIONS REPORT Main Report
 ANNUAL NETWORK OPERATIONS REPORT Edition Number: 1.0 08/05/2017 DOCUMENT CHARACTERISTICS Document Title Document Subtitle Edition Number Edition Validity Date ANNUAL NETWORK 1.0 08/05/2017 OPERATIONS REPORT
Directorate Network Management Monthly Network Operations Report Analysis - July 2012
 Directorate Network Management Monthly Network Operations Report Analysis - July 212 TABLE OF CONTENTS 1. TOTAL TRAFFIC... 1 2. ATFM DELAY AND ATTRIBUTIONS... 4 3. EN-ROUTE ATFM DELAYS... 5 4. AIRPORT/TMA
Monthly Network Operations Report
 Monthly Network Operations Report Analysis - February 2014 TABLE OF CONTENTS 1. TOTAL TRAFFIC... 2 2. ATFM DELAY AND ATTRIBUTIONS... 5 3. EN-ROUTE ATFM DELAYS... 6 4. AIRPORT/TMA ATFM DELAYS... 10 5. DAILY
Monthly Network Operations Report Analysis November 2018
 Monthly Network Operations Report Analysis November 218 NM Monthly Network Operations Report - Analysis November 218 TLP: WHITE Page 1 TABLE OF CONTENTS TABLE OF CONTENTS 2 NOTICE 2 1. TOTAL TRAFFIC 3
Monthly Network Operations Report
 Monthly Network Operations Report Analysis November 217 NM Monthly Network Operations Report - Analysis November 217 TLP: GREEN Page 1 TABLE OF CONTENTS TABLE OF CONTENTS 2 NOTICE 2 1. TOTAL TRAFFIC 3
Monthly Network Operations Report
 Monthly Network Operations Report Analysis - November 213 TABLE OF CONTENTS 1. TOTAL TRAFFIC... 2 2. ATFM DELAY AND ATTRIBUTIONS... 5 3. EN-ROUTE ATFM DELAYS... 6 4. AIRPORT/TMA ATFM DELAYS... 1 5. DAILY
Monthly Network Operations Report
 Monthly Network Operations Report Analysis - November 215 TABLE OF CONTENTS Table of Contents 1 Notice 1 1. TOTAL TRAFFIC 2 2. ATFM DELAY AND ATTRIBUTIONS 5 3. EN-ROUTE ATFM DELAYS 6 EN-ROUTE ATFM DELAY
Follow up to the implementation of safety and air navigation regional priorities XMAN: A CONCEPT TAKING ADVANTAGE OF ATFCM CROSS-BORDER EXCHANGES
 RAAC/15-WP/28 International Civil Aviation Organization 04/12/17 ICAO South American Regional Office Fifteenth Meeting of the Civil Aviation Authorities of the SAM Region (RAAC/15) (Asuncion, Paraguay,
Monthly Network Operations Report Analysis December 2015
 Monthly Network Operations Report Analysis December 215 NM Monthly Network Operations Report - Analysis - December 215 Page 1 TABLE OF CONTENTS TABLE OF CONTENTS 2 NOTICE 2 1. TOTAL TRAFFIC 3 2. ATFM DELAY
Monthly Network Operations Report
 Monthly Network Operations Report Analysis May 218 NM Monthly Network Operations Report - Analysis May 218 TLP: GREEN Page 1 TABLE OF CONTENTS TABLE OF CONTENTS 2 NOTICE 2 1. TOTAL TRAFFIC 3 2. ATFM DELAY
Aviation Trends Quarter
 Aviation Trends Quarter 4 214 Contents Introduction... 2 1. Historical overview of traffic see note 5 on p.15... 3 a. Terminal passengers... 4 b. Commercial flights... 5 c. Cargo tonnage... 6 2. Terminal
Aviation Trends. Quarter Contents
 Aviation Trends Quarter 3 2014 Contents Introduction... 2 1. Historical overview of traffic... 3 a. Terminal passengers... 4 b. Commercial flights... 5 c. Cargo tonnage... 6 2. Terminal passengers at UK
Monthly Network Operations Report
 Monthly Network Operations Report Analysis March 218 NM Monthly Network Operations Report - Analysis March 218 TLP: GREEN Page 1 TABLE OF CONTENTS TABLE OF CONTENTS 2 NOTICE 2 1. TOTAL TRAFFIC 3 2. ATFM
Monthly Network Operations Report
 Monthly Network Operations Report Analysis - May 215 Table of Contents 1. TOTAL TRAFFIC 2 2. ATFM DELAY AND ATTRIBUTIONS 5 3. EN-ROUTE ATFM DELAYS 6 EN-ROUTE ATFM DELAY PER LOCATION 6 EN-ROUTE ATFM DELAY
Monthly Network Operations Report
 Monthly Network Operations Report Analysis April 217 NM Monthly Network Operations Report - Analysis April 217 Page 1 TABLE OF CONTENTS TABLE OF CONTENTS 2 NOTICE 2 1. TOTAL TRAFFIC 3 2. ATFM DELAY AND
Monthly Network Operations Report
 Monthly Network Operations Report Analysis March 2015 1. TOTAL TRAFFIC 2 2. ATFM DELAY AND ATTRIBUTIONS 5 3. EN-ROUTE ATFM DELAYS 6 EN-ROUTE ATFM DELAY PER LOCATION 6 EN-ROUTE ATFM DELAY PER DELAY GROUP
Aviation Trends. Quarter Contents
 Aviation Trends Quarter 1 2013 Contents Introduction 2 1 Historical overview of traffic 3 a Terminal passengers b Commercial flights c Cargo tonnage 2 Terminal passengers at UK airports 7 3 Passenger flights
Monthly Network Operations Report Analysis September 2018
 Monthly Network Operations Report Analysis September 218 NM Monthly Network Operations Report - Analysis September 218 TLP: WHITE Page 1 TABLE OF CONTENTS TABLE OF CONTENTS 2 NOTICE 2 1. TOTAL TRAFFIC
Monthly Network Operations Report
 Monthly Network Operations Report Analysis - July 215 Table of Contents NOTICE 1 1. TOTAL TRAFFIC 2 2. ATFM DELAY AND ATTRIBUTIONS 5 3. EN-ROUTE ATFM DELAYS 6 EN-ROUTE ATFM DELAY PER LOCATION 6 EN-ROUTE
ANNUAL NETWORK OPERATIONS REPORT Main Report Final Edition
 Edition Number: 1.0 Edition Validity Date: 18/05/2016 DOCUMENT CHARACTERISTICS Document Title ANNUAL NETWORK OPERATIONS REPORT Document Subtitle (optional) Main Report Final Edition Abstract Edition Number
Monthly Network Operations Report
 Monthly Network Operations Report Analysis October 217 NM Monthly Network Operations Report - Analysis October 217 TLP: GREEN Page 1 TABLE OF CONTENTS TABLE OF CONTENTS 2 NOTICE 2 1. TOTAL TRAFFIC 3 2.
Network Manager nominated by the European Commission EUROCONTROL. Network Operations Report 2013
 Network Manager nominated by the European Commission EUROCONTROL Network Operations Report 2013 TABLE OF CONTENTS EXECUTIVE SUMMARY...1 INTRODUCTION & SCOPE...2 REFERENCES...2 1. NETWORK OVERVIEW...3 1.1.
Monthly Network Operations Report
 Monthly Network Operations Report Analysis September 217 TLP: GREEN NM Monthly Network Operations Report - Analysis September 217 TLP: GREEN Page 1 TABLE OF CONTENTS TABLE OF CONTENTS 2 NOTICE 2 1. TOTAL
Monthly Network Operations Report
 Monthly Network Operations Report Analysis September 216 NM Monthly Network Operations Report - Analysis - September 216 Page 1 TABLE OF CONTENTS TABLE OF CONTENTS 2 NOTICE 2 1. TOTAL TRAFFIC 3 2. ATFM
Delays to Air Transport in Europe. February CODA Central Office for Delay Analysis CODA. February 2004
 Central Office for Delay Analysis Delays to Air Transport in Europe February 2004 February 2004 Comparison of Delay Indicators (all Causes) between February 2004 and February 2003 Total Flights 1.1% %
Hosted by General Civil Aviation Authority (GCAA)
") ICAO ATFM Seminar Hosted by General Civil Aviation Authority (GCAA) DFS experience related to ATFM from an individual state point of view Integration with the Network Manager Operation Center (NMOC, former
ICAO ATFM Seminar Hosted by General Civil Aviation Authority (GCAA) DFS experience related to ATFM from an individual state point of view Integration with the Network Manager Operation Center (NMOC, former
ATM Network Performance Report
 ATM Network Performance Report 2019 Page 1 of 20 Table of contents Summary... 3 Network Wide Performance... 4 Airborne delay... 4 Sydney... 7 Airborne delay... 7 Notable events... 7 CTOT (Calculated take
INTERNATIONAL VOLCANIC ASH TASK FORCE (IVATF)
") IVATF/1-IP/21 23/7/10 INTERNATIONAL VOLCANIC ASH TASK FORCE (IVATF) FIRST MEETING Montréal, 27 to 30 July 2010 Agenda Item 3: Results of the EUR/NAT VATF Meeting (Plenary) 3.1: Evaluation of the Eyjafjallajokul
IVATF/1-IP/21 23/7/10 INTERNATIONAL VOLCANIC ASH TASK FORCE (IVATF) FIRST MEETING Montréal, 27 to 30 July 2010 Agenda Item 3: Results of the EUR/NAT VATF Meeting (Plenary) 3.1: Evaluation of the Eyjafjallajokul
FRA CDM. Airport Collaborative Decision Making (A-CDM) Flight Crew Briefing FRANKFURT AIRPORT. German Harmonisation
 Flight Crew Briefing FRANKFURT AIRPORT. German Harmonisation") Airport Collaborative Decision Making (A-CDM) CDM Airport @ FRA Flight Crew FRANKFURT AIRPORT Table of contents: 1. General... 3 2. Target Off Block Time (TOBT)... 4 2.1 Automatically generated TOBT...
Airport Collaborative Decision Making (A-CDM) CDM Airport @ FRA Flight Crew FRANKFURT AIRPORT Table of contents: 1. General... 3 2. Target Off Block Time (TOBT)... 4 2.1 Automatically generated TOBT...
Performance Planning Operations: Environment. Bernhard Mayr, CM TF Performance, MoT Germany 20 May 2011
 Performance Planning Operations: Environment Bernhard Mayr, CM TF Performance, MoT Germany 20 May 2011 1 Environment: Overview EU-wide KPI FABEC KPI/PI To Be Developed Average horizontal en-route flight
COMMISSION REGULATION (EU) No 255/2010 of 25 March 2010 laying down common rules on air traffic flow management
 No 255/2010 of 25 March 2010 laying down common rules on air traffic flow management") L 80/10 Official Journal of the European Union 26.3.2010 COMMISSION REGULATION (EU) No 255/2010 of 25 March 2010 laying down common rules on air traffic flow management (Text with EEA relevance) THE EUROPEAN
L 80/10 Official Journal of the European Union 26.3.2010 COMMISSION REGULATION (EU) No 255/2010 of 25 March 2010 laying down common rules on air traffic flow management (Text with EEA relevance) THE EUROPEAN
Aviation Trends. Quarter Contents
 Aviation Trends Quarter 3 215 Contents Introduction... 2 1. Historical overview of traffic... 3 a. Terminal passengers... 4 b. Commercial flights... 5 c. Cargo tonnage... 6 2. Terminal passengers at UK
Network Manager Adding value to the Network 29 September 2011
 Network Manager Adding value to the Network 29 September 2011 Alain FOURNIE Head of Operational Monitoring & Reporting Directorate Network Management EUROCONTROL The European Organisation for the Safety
Appendix B Ultimate Airport Capacity and Delay Simulation Modeling Analysis
 Appendix B ULTIMATE AIRPORT CAPACITY & DELAY SIMULATION MODELING ANALYSIS B TABLE OF CONTENTS EXHIBITS TABLES B.1 Introduction... 1 B.2 Simulation Modeling Assumption and Methodology... 4 B.2.1 Runway
The Commission invited respondents to comment on the The assumptions, conclusions, analysis and factual basis of the SH & E report.
 Our Ref: PM/u pmdf\2001\1405011 4 th June 2001 Mr C Guiomard Head of Economic Affairs Commission for Aviation Regulation 36 Upper Mount Street Dublin 2 IRELAND Head Office Axis House 242 Bath Road Hayes
From Planning to Operations Dr. Peter Belobaba
 From Planning to Operations Dr. Peter Belobaba Istanbul Technical University Air Transportation Management M.Sc. Program Network, Fleet and Schedule Strategic Planning Module 16 : 13 March 2014 Lecture
Performance Planning Environment. Bernhard Mayr, CM Financial and Performance Committee, 23 May 2014
 Performance Planning Environment Bernhard Mayr, CM Financial and Performance Committee, 23 May 2014 0 Agenda Report Performance Environment RP 1 Environment KPI #1 RP 2 FABEC Target RP 2 FABEC Airspace
Aviation Trends. Quarter Contents
 Aviation Trends Quarter 3 217 Contents Introduction... 2 1. Historical overview of traffic... 3 a. Terminal passengers... 4 b. Commercial flights... 5 c. Cargo tonnage... 6 2. Terminal passengers at UK
EUROCONTROL EUROPEAN AVIATION IN 2040 CHALLENGES OF GROWTH. Annex 4 Network Congestion
 EUROCONTROL EUROPEAN AVIATION IN 2040 CHALLENGES OF GROWTH Annex 4 Network Congestion 02 / EUROPEAN AVIATION IN 2040 - CHALLENGES OF GROWTH - NETWORK CONGESTION IN 2040 ///////////////////////////////////////////////////////////////////
Implementation, goals and operational experiences of A-CDM system
 Implementation, goals and operational experiences of A-CDM system A-CDM Airport Collaborative Decision Making Increasing airport effectiveness Decreasing delays Forecast of flight events Optimization of
GENERAL 1. What is Airport CDM? 2. What is the aim of A-CDM? 3. Why has A-CDM been implemented at Amsterdam Airport Schiphol?
 GENERAL 1. What is Airport CDM? A-CDM stands for Airport Collaborative Decision Making and means that joint decisions are made by all operational partners the airport, air traffic control, the airlines,
Annual Report 2017 KPI
 Annual Report 2017 KPI Version History: Version Date Remark Author 0.1 16/02/18 Initial Draft Barboff 0.2 22/02/18 Data analysis, first conclusions Editorial Board 0.3 23/02/18 Inserted first charts Barboff
EUROCONTROL Low-Cost Carrier Market Update
 EUROCONTROL Low-Cost Carrier Market Update June 2007 EUROCONTROL/STATFOR/Doc257 v1.0 12/09/07 EUROCONTROL Low-Cost Carrier Market Update June 2007 Summary: The market share of low-cost carriers in Europe
ATM Network Performance Report
 ATM Network Performance Report 2018. Page 1 of 16 Table of contents Summary... 3 Network Wide Performance... 4 Airborne delay... 4 Sydney... 6 Airborne delay... 6 Notable events... 6 Melbourne... 9 Airborne
Summary. Air transport movements. Passengers. Freight. Other Airports. Infrastructure. Definitions. Traffic Review 2016
 2016 TRAFFIC REVIEW Foreword The 2016 Traffic Review provides an extensive overview of Amsterdam Airport Schiphol s key traffic and transport figures. For information about previous years, please visit
Monthly Network Operations Report Analysis June 2018
 Monthly Network Operations Report Analysis June 218 NM Monthly Network Operations Report - Analysis June 218 TLP: WHITE Page 1 TABLE OF CONTENTS TABLE OF CONTENTS 2 NOTICE 2 1. TOTAL TRAFFIC 3 2. ATFM
Monthly Network Operations Report Analysis July 2018
 Monthly Network Operations Report Analysis July 218 NM Monthly Network Operations Report - Analysis July 218 TLP: WHITE Page 1 TABLE OF CONTENTS TABLE OF CONTENTS 2 NOTICE 2 1. TOTAL TRAFFIC 3 2. ATFM
Aviation Trends. Quarter Contents
 Aviation Trends Quarter 2 217 Contents Introduction... 2 1. Historical overview of traffic... 3 a. Terminal passengers... 4 b. Commercial flights... 5 c. Cargo tonnage... 6 2. Terminal passengers at UK
Monthly Network Operations Report
 Monthly Network Operations Report Analysis June 217 NM Monthly Network Operations Report - Analysis June 217 Page 1 TABLE OF CONTENTS TABLE OF CONTENTS 2 NOTICE 2 1. TOTAL TRAFFIC 3 2. ATFM DELAY AND ATTRIBUTIONS
Monthly Network Operations Report
 Monthly Network Operations Report Analysis May 217 NM Monthly Network Operations Report - Analysis May 217 Page 1 TABLE OF CONTENTS TABLE OF CONTENTS 2 NOTICE 2 1. TOTAL TRAFFIC 3 2. ATFM DELAY AND ATTRIBUTIONS