INTERNATIONAL VOLCANIC ASH TASK FORCE (IVATF)
|
|
|
- Byron Stevens
- 5 years ago
- Views:
Transcription
 SUMMARY This paper includes the presentation which sets out how")
1 IVATF/1-IP/21 23/7/10 INTERNATIONAL VOLCANIC ASH TASK FORCE (IVATF) FIRST MEETING Montréal, 27 to 30 July 2010 Agenda Item 3: Results of the EUR/NAT VATF Meeting (Plenary) 3.1: Evaluation of the Eyjafjallajokul eruption and lesson learned EUROCONTROL/CFMU VOLCANIC ASH CRISIS REPORT (Presented by Eurocontrol) SUMMARY This paper includes the presentation which sets out how the Eyjafjallajökul eruption evolved into a European aviation crisis, what measures were taken to unlock it and highlights some open issues that still need to be resolved to ensure an effective operational response to future volcanic ash events. (30 pages) IVATF.1.IP en.doc


2 Presentation to the ICAO IVATF Montréal, 27 th 30 th July 2010 EUROCONTROL/CFMU VOLCANIC ASH CRISIS REPORT Žarko SIVČEV EUROCONTROL/CFMU Network Operations European Organisation for the Safety of Air Navigation
3 It all started on 14 th April th April 28 th April 2. European coordination 3. 3 rd May to 23 rd May 4. Volcanic ash solutions sought 5. What if an eruption starts tomorrow?
4 1.14 th April 28 th April From contingency to crisis
5 VAAC London - First Volcanic Ash Advisory - 14 th April

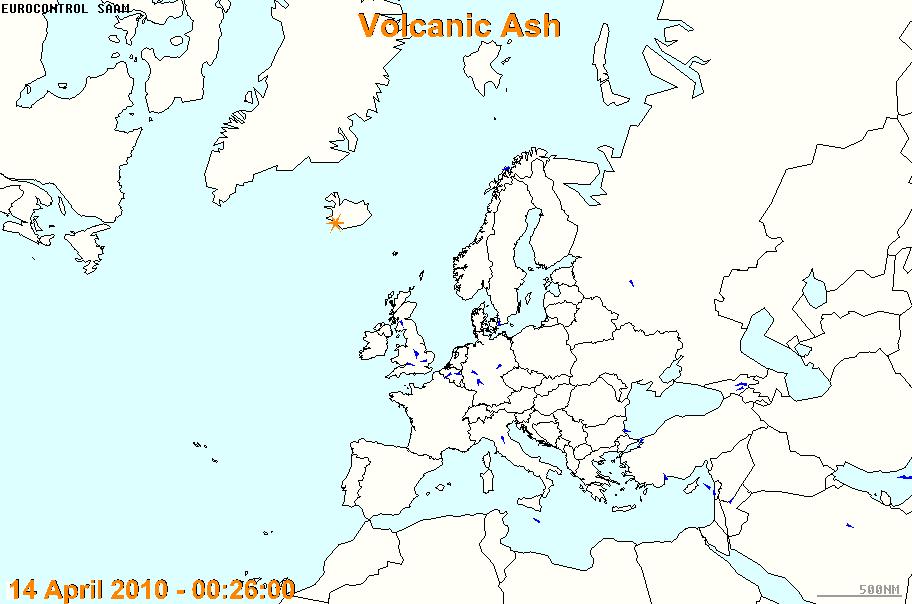
6 VAAC London - First Volcanic Ash Advisory - 14 th April CFMU activates its volcanic ash contingency procedure Early warning issue information on volcanic ash activity On request of national ATC providers : CFMU Applies measures Facilitate information exchange organise teleconferences Europe enters an ash aviation crisis on Thursday 15 April

7 14 th April :00

8 18 th April :00
9 Impact on the European traffic 15 April 21 April Daily Traffic per Volcano Activity Week THU FRI SAT SUN M ON TUE WED 54% of flights not operated More than 100,000 flights 1% of annual traffic W W201016
10 Impact on Airports (traffic) 15 April 21 April Outside of the area directly affected by the ash 23% reduction GENEVA MILANO MALPENSA ATHINAI/ELEFTHERIOS VENIZELOS STOCKHOLM-ARLANDA BRUSSELS NATIONAL DUESSELDORF OSLO/GARDERMOEN PARIS ORLY W W ZURICH COPENHAGEN KASTRUP ISTANBUL-ATATURK WIEN SCHWECHAT BARCELONA ROME FIUMICINO SCHIPHOL AMSTERDAM MUENCHEN 2 MADRID BARAJAS LONDON/HEATHROW FRANKFURT MAIN PARIS CH DE GAULLE In the area directly affected by the ash 70% reduction
11 Impact on Aircraft Operators (traffic) 15 April 21 April OLYMPIC AIRLINES LOT POLISH AIRLINES VUELING AIRLINES TAP PORTUGAL WIDEROES FLYVESELSKAP NORWEGIAN AIR SHUTTLE AIR NOSTRUM SWISS INTERNATIONAL AIR LINES AUSTRIAN AIRLINES IBERIA AIRLINES BRITISH AIRWAYS ALITALIA KLM ROYAL DUTCH AIRLINES TURKISH AIRLINES AIR BERLIN SCANDINAVIAN AIRLINES SYSTEM AIR FRANCE EASYJET RYANAIR LUFTHANSA W W In the area directly affected by the ash average reduction of 67% Outside affected areas - average reduction of 20% Several airlines lost more than 80% of foreseen traffic
12 UNLOCKING THE CRISIS: 19 TH APRIL 2. European Coordination
13 Unlocking the crisis: 19 th April Close coordination EC & EUROCONTROL EC political leadership EUROCONTROL network management expertise EUROCONTROL proposes three options Teleconference of the EUROCONTROL Provisional Council (AM) & EU Council of Ministers (PM) option 3

14 OPTION 3 - NO FLY ZONE - Contaminated Zone - Ash Free Zone States to decide on NO FLY ZONE Buffer 60NM
15 NEW ROLE FOR EUROCONTROL/CFMU Early warning issue information on volcanic ash activity On request of national ATC providers : CFMU applies measures Facilitate information exchange teleconferences Publish charts to assist states in deciding on NO FLY ZONE

16 EUROCONTROL - NO FLY ZONE Proposal April 20th 28th
17 NO ASH IN EUROCONTROL ZONE April 28 th May 3 rd BUT 3. 3 rd May to 23 rd May
18 3 rd May Volcanic ash procedures restarted Closures in UK and Ireland, then Portugal, Spain, Italy, Morocco 11 th May UK CAA/Met Office remove the 60NM buffer following a safety assessment - States retain prerogative to add the 60NM buffer 18 th May - UK CAA/Met Office issue a new CHART: black, grey, red 21 st May EASA issue a Safety Information Bulletin: NO FLY ZONE, ENHANCED PROCEDURES ZONE: GREY AND RED, NORMAL ZONE

19 NEW VAAC LONDON CHART

20 EUROCONTROL CHARTS May 3rd 23rd
21 4. Volcanic ash solutions sought


22 Lessons learned AOs Regulators CFMU ANSPs VAACs IVATF
23 Lessons learned - AOs

24 CFMU Network Operations Portal (NOP) million hits in one day!
 EC & EUROCONTROL created a European Aviation Crisis Coordination Cell (EACCC)")
25 Lessons learnt - Crisis EC, EUROCONTROL, EASA working together EUROCONTROL/CFMU facilitated: Information sharing, Pan-European coordination and Implementation of appropriate network solutions (as foreseen for the future European Network Manager) EC & EUROCONTROL created a European Aviation Crisis Coordination Cell (EACCC)
26 European Aviation Crisis Coordination Cell Main role: to facilitate the management of crisis situations affecting aviation in the European (ECAC) region Activated when circumstances beyond the normal environment of operations are evident Responsibilities: alert, take initiatives, propose measures to manage the crisis, coordinate the implementation of these measures, ensure that an external communication policy is properly executed EC & EUROCONTROL EASA, AO, ANSP, Airports ICAO, regulators & NSA Military, acft manuf


27 Volcanic ash solutions sought ATM or airworthiness Enhanced information exchange IVATF Harmonised approach in states Dispersion model validation Threshold
28 5. What if an eruption starts tomorrow? Contingency or crisis?

29 Alert: Icelandic MWO VAAC CFMU Crisis Cell Information: VAAC VAA Ash conc. Measures: States CFMU Information exchange: teleconferences Danger Areas??? State B High Medium State C? Low MWO/SIGMET NOF/NOTAM NOP Porta l Harmonised approach! State A
30 EUROCONTROL THANK YOU!
Building the future on lessons learned from Eyjafjallajökull
 Building the future on lessons learned from Eyjafjallajökull Bo Redeborn Director Cooperative Network Design (CND), EUROCONTROL The European Organisation for the Safety of Air Navigation Two different
Aviation Crisis Management in Europe
 2 nd International Conference on Cyber Crisis Cooperation and Exercises Athens, 23-24 September 2013 Aviation Crisis Management in Europe Cyber Attack Exercise CYBER 13 Žarko Sivčev Advisor to the Director
Eyjafjallajökull - What have we learnt?
 Eyjafjallajökull - What have we learnt? Aviation Crisis Management Workshop Brussels, 22-23 May 2012 Joe Sultana Chief Operating Officer Directorate Network Management The European Organisation for the
European aviation sector reactions on the Ebola threat
 Cairo, 17 - November 2014 European aviation sector reactions on the Ebola threat Perspective of the European Aviation Crisis Coordination Cell (EACCC) Marc van Oudheusden Sr. Political Advisor Crisis Management
Global Aviation Monitor (GAM)
") Global Aviation Monitor (GAM) Analysis and Short Term Outlook of Global, European and German Air Transport Main Results of Global Air Transport Supply Analysis and Outlook Background: Covers about 3,500
Global Aviation Monitor (GAM) Analysis and Short Term Outlook of Global, European and German Air Transport Main Results of Global Air Transport Supply Analysis and Outlook Background: Covers about 3,500
Volcanic Ash Operations Workshop
 Volcanic Ash Operations Workshop John Vincent Deputy Director for Strategic Safety European Aviation Safety Agency EASA 20 January 2011 Cologne Outline Introduction Key activities Yesterday Today Tomorrow
Global Aviation Monitor (GAM)
") Global Aviation Monitor (GAM) Analysis and Short Term Outlook of Global, European and German Air Transport Main Results of Global Air Transport Supply Analysis and Outlook Background: Covers about 3,500
Global Aviation Monitor (GAM) Analysis and Short Term Outlook of Global, European and German Air Transport Main Results of Global Air Transport Supply Analysis and Outlook Background: Covers about 3,500
Intra-European Seat Capacity. January February March April May June July August September October November December. Intra-European Sectors Flown
 ASK's (Million) Sectors Departing Seats 80,000,000 Intra-European Seat Capacity 70,000,000 60,000,000 50,000,000 40,000,000 30,000,000 20,000,000 10,000,000 0 January February March April May June July
Global Aviation Monitor (GAM)
") Global Aviation Monitor (GAM) Analysis and Short Term Outlook of Global, European and German Air Transport Main Results of Global Air Transport Supply Analysis and Outlook Background: Covers about 3,500
Global Aviation Monitor (GAM) Analysis and Short Term Outlook of Global, European and German Air Transport Main Results of Global Air Transport Supply Analysis and Outlook Background: Covers about 3,500
Global Aviation Monitor (GAM)
") Global Aviation Monitor (GAM) Analysis and Short Term Outlook of Global, European and German Air Transport Main Results of Global Air Transport Supply Analyses and Outlook Background: Covers about 3.5
Global Aviation Monitor (GAM) Analysis and Short Term Outlook of Global, European and German Air Transport Main Results of Global Air Transport Supply Analyses and Outlook Background: Covers about 3.5
Global Aviation Monitor (GAM)
") Global Aviation Monitor (GAM) Analysis and Short Term Outlook of Global, European and German Air Transport Main Results of Global Air Transport Supply Analysis and Outlook Background: Covers about 3,500
Global Aviation Monitor (GAM) Analysis and Short Term Outlook of Global, European and German Air Transport Main Results of Global Air Transport Supply Analysis and Outlook Background: Covers about 3,500
Global Aviation Monitor (GAM)
") Global Aviation Monitor (GAM) Analysis and Short Term Outlook of Global, European and German Air Transport Main Results of Global Air Transport Supply Analysis and Outlook Background: Covers about 3,500
Global Aviation Monitor (GAM) Analysis and Short Term Outlook of Global, European and German Air Transport Main Results of Global Air Transport Supply Analysis and Outlook Background: Covers about 3,500
Traffic, delays and forecasts European summer traffic falls outlook for modest long-term growth
 Skyway 17 Traffic, delays and forecasts European summer traffic falls outlook for modest long-term growth EUROCONTROL monitors the performance of Europe s wider air transport system and the more detailed
Directorate Network Management Monthly Network Operations Report Analysis - March 2012
 Directorate Network Management Monthly Network Operations Report Analysis - March 212 TABLE OF CONTENTS 1. TOTAL TRAFFIC... 1 2. ATFM DELAY AND ATTRIBUTIONS... 4 3. EN-ROUTE ATFM DELAYS... 5 3.1. EN-ROUTE
User Forum FPL adherence campaign Lessons learned & discussion. Chris BOUMAN, Head of Network Development Unit EUROCONTROL Network Management
 User Forum 2011 FPL adherence campaign Lessons learned & discussion Chris BOUMAN, Head of Network Development Unit EUROCONTROL Network Management The European Organisation for the Safety of Air Navigation
Ash cloud of April and May 2010: Impact on Air Traffic
 Ash cloud of April and May 2010: Impact on Air Traffic Eyjafjallajökull volcano, Iceland Celso Figueiredo Regional Officer, Air Navigation Systems Implementation (Air Traffic Management) ICAO EUR/NAT Regional
WORKING PAPER IVATF/2-WP/21 10/6/11. International UPDATEDD ASH RELATED SUMMARY. At the 1.1. to 30. first meeting. Coordination Group to. (e.g. 1.
 International Civil Aviation Organization IVATF/2-WP/21 10/6/11 WORKING PAPER INTERNATIONAL VOLCANIC ASH TASK FORCE (IVATF) SECOND MEETING Montréal, 11 to 15 July 2011 Agenda Item 5: Report of the International
Directorate Network Management Monthly Network Operations Report Analysis - May 2012
 Directorate Network Management Monthly Network Operations Report Analysis - May 212 TABLE OF CONTENTS 1. TOTAL TRAFFIC 1 2. ATFM DELAY AND ATTRIBUTIONS 4 3. EN-ROUTE ATFM DELAYS 5 4. AIRPORT/TMA ATFM DELAYS
Directorate Network Management Monthly Network Operations Report Analysis November 2012
 Directorate Network Management Monthly Network Operations Report Analysis November 212 TABLE OF CONTENTS 1. TOTAL TRAFFIC... 1 2. ATFM DELAY AND ATTRIBUTIONS... 4 3. EN-ROUTE ATFM DELAYS... 5 4. AIRPORT/TMA
NETWORK OPERATIONS REPORT OCTOBER 2011
 OBER. TRAFFIC TOTAL FLIGHTS Last months average daily traffic 8 6 4 8 6 79 5 97 44 5684 694 8786 4 4 9974 589 84 Traffic increased by.% compared to October. Compared to September, the traffic was 8. lower.
Network Management, building on our experience of flow management and network planning.
 Network Management, building on our experience of flow management and network planning. Giovanni Lenti Head of Network Operation Services The European Organisation for the Safety of Air Navigation Air
Directorate Network Management Monthly Network Operations Report Analysis - April 2012
 Directorate Network Management Monthly Network Operations Report Analysis - April 212 TABLE OF CONTENTS 1. TOTAL TRAFFIC 1 2. ATFM DELAY AND ATTRIBUTIONS 4 3. EN-ROUTE ATFM DELAYS 5 4. AIRPORT/TMA ATFM
What are the safety regulations regarding volcanic ash and why?
 International Civil Aviation Organization European and North Atlantic What are the safety regulations regarding volcanic ash and why? Atlantic Conference on Eyjafjallajökull and Aviation Keflavik, Iceland,
Punctuality for october 2017 per airline
 for october 2017 per airline Departures scheduled **) having less than 10 operations. Adria Airways 22 22 0 100% 5 77% 33 Aegean S.A. Aeroflot Russian 29 29 0 100% 7 76% 26 62 62 0 100% 9 85% 24 Air Baltic
NETWORK OPERATIONS REPORT September 2011
 September 20. TRAFFIC TOTAL FLIGHTS 32000 Last 3 months average daily traffic 30000 28000 Traffic increased by 2.7% compared to September 200. 26000 24000 22000 Compared to August 20, the traffic was 2.%
Punctuality for march 2014 per airline
 for march 2014 per airline Departures scheduled **) having less than 10 operations. Aer Lingus 30 30 0 100% 2 93% 68 Aeroflot Russian 63 62 1 98% 1 98% 19 Air Baltic 73 72 1 99% 1 99% 19 Air Berlin 167
Traffic Results January June 2010 by Chief Executive Officer Julian Jaeger
 January June 2010 by Chief Executive Officer Julian Jaeger 15 th July, 2010 Contents Traffic Results Forecast 2010 Concluding remarks Highlights January to June 2010 2010 2009 + / - % Change Passenger
Punctuality for june 2015 per airline
 for june 2015 per airline Departures scheduled Adria Airways 16 16 0 100% 6 63% 28 Aegean s S.A. 23 23 0 100% 3 87% 24 Aer Lingus 30 30 0 100% 13 57% 45 Aeroflot Russian s 60 60 0 100% 10 83% 43 Air Baltic
Global Seat Capacity July. May. June. Global Sectors Flown July. May. June %
 Jan-14 Feb-14 Mar-14 Apr-14 May-14 Jun-14 Jul-14 Aug-14 Sep-14 Oct-14 Nov-14 Dec-14 Jan-15 Feb-15 Mar-15 Apr-15 May-15 Low cost Oneworld Skyteam Star Alliance Other Billion ASKs - YTD January February
Half Year Traffic Highlights
 Half Year Traffic Highlights Presented by CEO, ALAN BORG 1 Presentation Contents 1. Traffic Highlights 2015 2. Route Development 2015 3. Industry Indicators 2015 4. Forecast 2015 5. Airport Investments
Network Operations Performance
 User Forum 2013 Network Operations Performance Operations performance in 2012 Ged Boydell Head Operational Analysis & Reporting 23 January 2013 Traffic and Capacity/Delay headlines 32000 30000 28000 26000
Directorate Network Management Monthly Network Operations Report Analysis - June 2012
 Directorate Network Management Monthly Network Operations Report Analysis - June 212 TABLE OF CONTENTS 1. TOTAL TRAFFIC 1 2. ATFM DELAY AND ATTRIBUTIONS 4 3. EN-ROUTE ATFM DELAYS 5 4. AIRPORT/TMA ATFM
EUROCONTROL. Eric MIART Manager - Airport Operations Programme (APR)
") Traffic Forecast for 20 Years Resulting Challenges for Airports Potential Solutions AIRNETH, The Hague 12 th of April 2007 EUROCONTROL Eric MIART Manager - Airport Operations Programme (APR) www.eurocontrol.int/airports
Traffic Forecast for 20 Years Resulting Challenges for Airports Potential Solutions AIRNETH, The Hague 12 th of April 2007 EUROCONTROL Eric MIART Manager - Airport Operations Programme (APR) www.eurocontrol.int/airports
Punctuality for february 2017 per airline
 for february 2017 per airline Departures scheduled **) having less than 10 operations. Aegean S.A. Aeroflot Russian 12 12 0 100% 1 92% 32 59 56 3 95% 8 86% 105 Air Baltic 84 83 1 99% 6 93% 76 Air Berlin
Punctuality for may 2014 per airline
 for may 2014 per airline Departures scheduled **) having less than 10 operations. Adria Airways 18 18 0 100% 3 83% 118 Aer Lingus 30 30 0 100% 7 77% 36 Aeroflot Russian 62 62 0 100% 4 94% 58 Air Baltic
Monthly Network Operations Report
 Monthly Network Operations Report Analysis - November 213 TABLE OF CONTENTS 1. TOTAL TRAFFIC... 2 2. ATFM DELAY AND ATTRIBUTIONS... 5 3. EN-ROUTE ATFM DELAYS... 6 4. AIRPORT/TMA ATFM DELAYS... 1 5. DAILY
Punctuality for july 2012 per airline
 for july 2012 per airline Departures scheduled **) having less than 10 operations. Adria Airways 32 31 1 97% 3 91% 46 Aeroflot Russian Aerosvit 62 61 1 98% 8 87% 25 31 30 1 97% 13 58% 78 Air Baltic 93
Global Seat Capacity May. June. July. Global Sectors Flown May. June. July
 Global Departing Seats (Millions) 5 45 4 35 3 25 2 15 5 4.6% 5.4% 6.3% 5.6% 5.4% 6.2% 6.8% 6.1% Global Seat Capacity 214 215 January February March April May June July August September October November
What Happened Winter A Network Perspective. Airports and Airlines Winter Operations. Directorate of Network Management
 What Happened Winter 2009-10 --------- A Network Perspective Airports and Airlines Winter Operations Brian Flynn Head Network Operations unit Directorate of Network Management EUROCONTROL The European
Punctuality for april 2018 per airline
 for april 2018 per airline Departures scheduled **) having less than 10 operations. Adria Airways 29 29 0 100% 10 66% 47 Aegean S.A. Aeroflot Russian 16 16 0 100% 0 100% 0 60 60 0 100% 2 97% 24 Air Baltic
Monthly Network Operations Report
 Monthly Network Operations Report Analysis August 213 TABLE OF CONTENTS 1. TOTAL TRAFFIC... 2 2. ATFM DELAY AND ATTRIBUTIONS... 5 3. EN-ROUTE ATFM DELAYS... 6 4. AIRPORT/TMA ATFM DELAYS... 1 5. DAILY EVOLUTION...
Global Seat Capacity July. May. June. Global Sectors Flown July. May. June %
 Jan-14 Feb-14 Mar-14 Apr-14 May-14 Jun-14 Jul-14 Aug-14 Sep-14 Oct-14 Nov-14 Dec-14 Jan-15 Low cost Oneworld Skyteam Star Alliance Other Billion ASKs - YTD January February March April May June July August
Monthly Network Operations Report
 Monthly Network Operations Report Analysis - December 213 TABLE OF CONTENTS 1. TOTAL TRAFFIC... 2 2. ATFM DELAY AND ATTRIBUTIONS... 5 3. EN-ROUTE ATFM DELAYS... 6 4. AIRPORT/TMA ATFM DELAYS... 1 5. DAILY
Punctuality for september 2013 per airline
 for september 2013 per airline Departures scheduled Adria Airways 17 17 0 100% 3 82% 20 Aer Lingus 26 26 0 100% 4 85% 22 Aeroflot Russian s 60 60 0 100% 9 85% 29 Air Baltic 85 84 1 99% 9 89% 32 Air Berlin
Punctuality for june 2014 per airline
 for june 2014 per airline Departures scheduled **) having less than 10 operations. Adria Airways 17 17 0 100% 4 76% 32 Aegean S.A. 12 12 0 100% 9 25% 39 Aer Lingus 30 30 0 100% 10 67% 34 Aeroflot Russian
Punctuality for july 2015 per airline
 for july 2015 per airline Departures scheduled **) having less than 10 operations. Acd/Ad Hoc 10 0 10 0% 0 100% 0 Adria Airways 18 18 0 100% 5 72% 25 Aegean S.A. 27 27 0 100% 12 56% 30 Aer Lingus 34 31
Directorate Network Management Monthly Network Operations Report Analysis February 2013
 Directorate Network Management Monthly Network Operations Report Analysis February 213 TABLE OF CONTENTS 1. TOTAL TRAFFIC... 2 2. ATFM DELAY AND ATTRIBUTIONS... 5 3. ATFM DELAYS... 6 4. AIRPORT/TMA ATFM
Punctuality for may 2018 per airline
 for may 2018 per airline Departures scheduled **) having less than 10 operations. Adria Airways 33 28 5 85% 9 73% 49 Aegean S.A. Aeroflot Russian 23 23 0 100% 5 78% 25 66 63 3 95% 10 85% 53 Air Baltic
Punctuality for october 2012 per airline
 for october 2012 per airline Departures scheduled **) having less than 10 operations. Adria Airways 12 12 0 100% 3 75% 45 Aeroflot Russian Aerosvit 62 61 1 98% 8 87% 33 23 23 0 100% 5 78% 26 Air Baltic
Monthly Network Operations Report
 Monthly Network Operations Report Analysis March 213 TABLE OF CONTENTS 1. TOTAL TRAFFIC... 2 2. ATFM DELAY AND ATTRIBUTIONS... 5 3. ATFM DELAYS... 6 4. AIRPORT/TMA ATFM DELAYS... 1 5. DAILY EVOLUTION...
Global September 2014
 Jan-13 Feb-13 Mar-13 Apr-13 May-13 Jun-13 Jul-13 Aug-13 Sep-13 Oct-13 Nov-13 Dec-13 Jan-14 Feb-14 Mar-14 Apr-14 May-14 Jun-14 Jul-14 Aug-14 Sep-14 Low cost Oneworld Skyteam Star Alliance Other Billion
Monthly Network Operations Report
 Monthly Network Operations Report Analysis July 213 TABLE OF CONTENTS 1. TOTAL TRAFFIC... 2 2. ATFM DELAY AND ATTRIBUTIONS... 5 3. EN-ROUTE ATFM DELAYS... 6 4. AIRPORT/TMA ATFM DELAYS... 1 5. DAILY EVOLUTION...
Directorate Network Management Monthly Network Operations Report Analysis - August 2012
 Directorate Network Management Monthly Network Operations Report Analysis - August 212 TABLE OF CONTENTS 1. TOTAL TRAFFIC... 1 2. ATFM DELAY AND ATTRIBUTIONS... 4 3. EN-ROUTE ATFM DELAYS... 5 4. AIRPORT/TMA
Travel Policy Fly America Act Compliance Presentation. Presented by: Travel Services
 Travel Policy Fly America Act Compliance Presentation Presented by: Travel Services Agenda Fly America Act Exceptions Open Skies Agreement Documentation Requirements Good News and Bad News CTP demo 3 Travel
Travel Policy Fly America Act Compliance Presentation. Presented by: Travel Services
 Travel Policy Fly America Act Compliance Presentation Presented by: Travel Services Travel on Federal Funds Federal regulations require (coach or equivalent), the lowest commercial discount airfare to
SCHEDULING LIMITS 2 SCHEDULE ADJUSTMENT 3 TOP AIRLINES ANALYSIS 4 TOP ROUTES ANALYSIS 5 TOP 10 AIRCRAFT TYPE 6
 WARSAW FREDERIC CHOPIN AIRPORT EPWA / WAW WINTER 214 START OF SEASON REPORT KEY STATISTICS Winter 214 Change from Winter 213 (Start of Season) Change from Winter 213 (End of Season ) Air Transport Movements
FLY AMERICA ACT WAIVER CHECKLIST
 FLY AMERICA ACT WAIVER CHECKLIST (To assist in determining qualification for a waiver of the restrictions of the Fly America Act under 41 CFR Part 301-10, check the applicable statement(s) below.) Use
KEFLAVÍK AIRPORT FROM A STROLL THROUGH CENTRAL PARK TO A SEAT ON THE LONDON EYE FACTS AND FIGURES 2017
 N 51 30 15.5052 W 0 4 34.2336 FROM A STROLL THROUGH CENTRAL PARK Wake up in New York and drink your morning coffee at the park before you get to work. TO A SEAT ON THE LONDON EYE Enjoy in the evening a
Punctuality for february 2018 per airline
 for february 2018 per airline Departures scheduled **) having less than 10 operations. Adria Airways 20 19 1 95% 0 100% 0 Aegean S.A. Aeroflot Russian 12 12 0 100% 4 67% 21 57 56 1 98% 8 86% 49 Air Baltic
Ash cloud of April and May 2010: Impact on Air Traffic
 Figure 1. Traffic in Europe 1 before and during the April crisis. Before After Summary: The airspace closures in Europe resulting from the eruption of the Eyjafjallajökull volcano from 14 April 2010 led
Punctuality for november 2018 per airline
 for november 2018 per airline Departures scheduled Aegean s S.A. Aeroflot Russian s 21 21 0 100% 4 81% 31 60 60 0 100% 5 92% 24 Air Baltic 86 86 0 100% 3 97% 58 Air Canada 14 14 0 100% 8 43% 49 Air China
The Single European Sky & the SESAR programme
 The Single European Sky & the SESAR programme EU-Africa Aviation Conference 2 & 3 April 2009 EUROPEAN COMMISSION EUROPEAN CONTEXT EUROPEAN COMMISSION FACTS & FIGURES IN EUROPE About 10 millions of flights
TABLE OF CONTENTS. Scheduling Limits 2. Air Transport Movements 3. Total Seats and Seats per Movement 4. Airline Analysis 5.
 HEATHROW WINTER 211/12 Start of Season Report KEY STATISTICS Air Transport Movements -.4% Total Seats -1.1% Seats per Air Transport Movement -.7% TABLE OF CONTENTS Page Scheduling Limits 2 Air Transport
Punctuality for june 2018 per airline
 Punctuality for june 2018 per airline Departures scheduled *) Delayed more than 15 minutes. **) s having less than 10 operations. Planned Cancelled Delayed *) Punctuality Avg. delay (min) Adria Airways
The SESAR contribution to the near and mid term Safety
 The SESAR contribution to the near and mid term Safety Final Optics Dissemination Event 12-13 June 2017 Pierre ANDRIBET R&D and SESAR Contribution Manager EUROCONTROL Directorate Air Traffic Management
Punctuality for august 2017 per airline
 for august 2017 per airline Departures scheduled **) having less than 10 operations. Acd/Ad Hoc 12 0 12 0% 0 100% 0 Adria Airways 21 21 0 100% 4 81% 26 Aegean S.A. Aeroflot Russian 19 19 0 100% 9 53% 22
Dublin Airport (DUB) Winter 2018/19 (W18) Start of Season Report Report Date: Thu 04-Oct-2018 Headlines W18 Start vs. W17 Start vs.
 Winter 2018/19 (W18) Start of Season Report Report Date: Thu 04-Oct-2018 Headlines W18 Start vs. W17 Start vs.") Dublin Airport (DUB) Winter 218/19 (W18) Start of Season Report Report Date: Thu 4-Oct-218 Headlines W18 Start vs. W17 Start vs. W17 End Total Air Transport Movements (Passenger & Freight) 86,83 6.% 9.4%
Dublin Airport (DUB) Winter 218/19 (W18) Start of Season Report Report Date: Thu 4-Oct-218 Headlines W18 Start vs. W17 Start vs. W17 End Total Air Transport Movements (Passenger & Freight) 86,83 6.% 9.4%
Towards a Global ATFM Manual. Brian Flynn Head Network Operations
 Towards a Global ATFM Manual Brian Flynn Head Network Operations ATM Structure in Europe 41 States One single ATFCM System over Europe >60 En-route centres = 1750 Sectors 1348 Aircraft Operators 450 Airports
Network Manager Adding value to the Network 29 September 2011
 Network Manager Adding value to the Network 29 September 2011 Alain FOURNIE Head of Operational Monitoring & Reporting Directorate Network Management EUROCONTROL The European Organisation for the Safety
EUROCONTROL. An introduction to the EUROCONTROL Network Manager Operations Centre
 EUROCONTROL An introduction to the EUROCONTROL Network Manager Operations Centre Since it started tactical operations in 1995*, the EUROCONTROL Network Manager is a key player in improving the overall
Punctuality for september 2018 per airline
 for september 2018 per airline Departures scheduled Adria Airways 31 29 2 94% 12 61% 57 Aegean s S.A. Aeroflot Russian s 24 24 0 100% 6 75% 28 60 60 0 100% 2 97% 24 Air Baltic 90 90 0 100% 6 93% 25 Air
STUDY OF THE OPTIMUM FLEET FOR A LCC (LOW-COST-CARRIER)
") DEGREE IN AEROSPACE VEHICLES ENGINEERING STUDY OF THE OPTIMUM FLEET FOR A LCC (LOW-COST-CARRIER) ANNEXES Student: Durán Gómez, Núria Director: Pérez Llera, Luís Manuel Delivery date: 12/06/2015 Index of
DEGREE IN AEROSPACE VEHICLES ENGINEERING STUDY OF THE OPTIMUM FLEET FOR A LCC (LOW-COST-CARRIER) ANNEXES Student: Durán Gómez, Núria Director: Pérez Llera, Luís Manuel Delivery date: 12/06/2015 Index of
VOLCANIC ASH INTERNATIONAL TELECONFERENCES April 2010
 VOLCANIC ASH INTERNATIONAL TELECONFERENCES 17-23 April 2010 INFORMATION NOTE REPORT OF PROCEEDINGS Padhraic Kelleher Head of Airworthiness UK Civil Aviation Authority Report of Proceedings FINAL: 5 May
Directorate Network Management Monthly Network Operations Report Analysis - July 2012
 Directorate Network Management Monthly Network Operations Report Analysis - July 212 TABLE OF CONTENTS 1. TOTAL TRAFFIC... 1 2. ATFM DELAY AND ATTRIBUTIONS... 4 3. EN-ROUTE ATFM DELAYS... 5 4. AIRPORT/TMA
Thomas Cook (option 3 or 4) 2
 2") Conference & Incentive travel office Malta Group Booking Phone Email Website 1 2 3 4 5 6 Air Malta 00 356 22 999 381 cit.airmalta@airmalta.com http://www.airmalta.com/groups-and-cit This office may be
Conference & Incentive travel office Malta Group Booking Phone Email Website 1 2 3 4 5 6 Air Malta 00 356 22 999 381 cit.airmalta@airmalta.com http://www.airmalta.com/groups-and-cit This office may be
Punctuality for july 2018 per airline
 Punctuality for july 2018 per airline Departures scheduled *) Delayed more than 15 minutes. **) having less than 10 operations. Planned Cancelled Delayed *) Punctuality Avg. delay (min) Adria Airways 31
Headlines W15 Start vs. W14 Start vs. W14 End
 Dublin Airport (DUB) Winter 2/16 (W) Start of Season Report Report Date: Mon 12Oct2 Headlines W Start vs. W14 Start vs. W14 End Total Air Transport Movements (Passenger & Freight) 74,66 9.% 1.6% Total
(Presented SUMMARY 1.1. The fourth meeting 1.2. by the Secretary) /7 meeting. the group on 1.3 IVATF/4 2. DISCUSSION. The appendix paper 2.
 /7 meeting. the group on 1.3 IVATF/4 2. DISCUSSION. The appendix paper 2.") 15/ 2/13 INTERNATIONAL AIRWAYS VOLCANO WATCH OPERATIONS GROUP (IAVWOPSG)) SEVENTH MEETING Bangkok, Thailand, 18 to 22 March 2013 Agenda Item 3: Follow-up of IAVWOPSG/6 conclusions STATUS OF FOLLOW-UP OF
15/ 2/13 INTERNATIONAL AIRWAYS VOLCANO WATCH OPERATIONS GROUP (IAVWOPSG)) SEVENTH MEETING Bangkok, Thailand, 18 to 22 March 2013 Agenda Item 3: Follow-up of IAVWOPSG/6 conclusions STATUS OF FOLLOW-UP OF
HEATHROW AIRPORT LHR Summer 2014 (S14) Start of Season
 Start of Season") HEATHROW AIRPORT LHR Summer 214 (S14) Start of Season KEY STATISTICS Summer 214 vs Summer 213 Air Transport Movements Allocated 282,172.6% Passenger Air Transport Movements Allocated 28,726.6% Total Seats
HEATHROW AIRPORT LHR Summer 214 (S14) Start of Season KEY STATISTICS Summer 214 vs Summer 213 Air Transport Movements Allocated 282,172.6% Passenger Air Transport Movements Allocated 28,726.6% Total Seats
Digest Delays to Air Transport in Europe November 2011
 FOREWORD This report gives an overview of the delay situation in the European Civil Aviation Conference Area. This report has been prepared by the Central Office for Delay Analysis (CODA), a service of
GATWICK AIRPORT LGW WINTER 2013/14 (W13) Start of season
 Start of season") GATWICK AIRPORT LGW WINTER 213/14 (W13) Start of season vs 212/13 Start vs 212/13 End KEY STATISTICS 213/14 Air Transport Movements 91,68 5.3% 8.8% Total Seats (m) 15.7 5.3% 8.4% Seats per Passenger ATM
GATWICK AIRPORT LGW WINTER 213/14 (W13) Start of season vs 212/13 Start vs 212/13 End KEY STATISTICS 213/14 Air Transport Movements 91,68 5.3% 8.8% Total Seats (m) 15.7 5.3% 8.4% Seats per Passenger ATM
LONDON CITY AIRPORT LCY Summer 12 START OF SEASON REPORT Change From KEY STATISTICS Summer 2012 Summer 2011 (End)
") LONDON CITY AIRPORT LCY Summer 12 START OF SEASON REPORT Change From KEY STATISTICS Summer 212 Summer 211 (End) Passenger Air Transport Movements 4,546 8.8% Total Seats 3,45,186 7.% Seats per Passenger
LONDON CITY AIRPORT LCY Summer 12 START OF SEASON REPORT Change From KEY STATISTICS Summer 212 Summer 211 (End) Passenger Air Transport Movements 4,546 8.8% Total Seats 3,45,186 7.% Seats per Passenger
Headlines S19 Start vs. S18 Start vs. S18 End
 Dublin Airport (DUB) Summer 219 (S19) Start of Season Report Report Date: Tue 26Mar219 Headlines S19 Start vs. S18 Start vs. S18 End Total Air Transport Movements (Passenger & Freight) 148,42 3.7%.% Total
The development of the information management, in the new scenario, of airspace contamination by volcanic ash.
 The development of the information management, in the new scenario, of airspace contamination by volcanic ash. ATM Expert Flavio Sgrò - ENAV Operational Department Workshop on Ash dispersal forecast and
Linking airports with European ATM
 Linking airports with European ATM Christian Faber ATFCM Expert - DNM Network Operations EUROCONTROL The European Organisation for the Safety of Air Navigation Overview Regulatory Framework ATM in Europe,
Gatwick Airport (LGW)
") Gatwick Airport (LGW) Winter 16/17 (W16) Start of Season Report Report Date: Mon 24Oct16 Headlines W16 Start vs. W Start vs. W End Total Air Transport Movements (Passenger & Freight) 99,93 4.4% 9.9% Total
Gatwick Airport (LGW) Winter 16/17 (W16) Start of Season Report Report Date: Mon 24Oct16 Headlines W16 Start vs. W Start vs. W End Total Air Transport Movements (Passenger & Freight) 99,93 4.4% 9.9% Total
Merge or Perish: Irish Aviation in a Rapidly Changing Global Market
 Merge or Perish: Irish Aviation in a Rapidly Changing Global Market Professor Aisling Reynolds-Feighan UCD School of Economics UL Kemmy Business School Third Annual Tourism Policy Workshop, November 2-4,
How IACA carriers do volcanic ash risk assessment. Erik Moyson Volcanic Ash Operations Workshop EASA, Cologne, 20 January 2011.
 How IACA carriers do volcanic ash risk assessment Erik Moyson Volcanic Ash Operations Workshop EASA, Cologne, 20 January 2011 IACA carriers 1 Profile of IACA carriers original low-cost carriers high seat
Start of Season Report Nice Côte d Azur Airport Winter Nice Côte d Azur Airport NCE/LFMN. Winter Start Of Season Report
 Nice Côte d Azur Airport NCE/LFMN Winter 2016 - Start Of Season Report Report data extraction date: 30 Octobre 2016 Table of contents Evolution of allocated slots at the Start Of Season (SOS)... 2 Total
Industry Monitor The EUROCONTROL bulletin on air transport trends
 EUROCONTROL 2010 Issue N 118. 30/04/10 Industry Monitor The EUROCONTROL bulletin on air transport trends European air traffic increased by 1.6% in March International air traffic grew 9% during the first
OAG FACTS January 2013
 OAG FACTS January 2013 OAG s latest airline capacity data shows that total scheduled airline capacity data is expected to increase by 3% in January 2013. Carriers globally will add 8.5 million extra seats
GATWICK AIRPORT LGW SUMMER 2013 (S13) Start of season
 Start of season") GATWICK AIRPORT LGW SUMMER 213 (S13) Start of season vs Summer 212 Start vs Summer 212 End KEY STATISTICS Summer 213 Air Transport Movements 161,19 1.8% 4.8% Total Seats (m) 28. 1.9% 4.7% Seats per Passenger
GATWICK AIRPORT LGW SUMMER 213 (S13) Start of season vs Summer 212 Start vs Summer 212 End KEY STATISTICS Summer 213 Air Transport Movements 161,19 1.8% 4.8% Total Seats (m) 28. 1.9% 4.7% Seats per Passenger
OAG FACTS April Western European Domestic Air Markets
 OAG FACTS April 2014 This month carriers will add 16.1 million seats to their networks compared to April 2013, an increase in seat capacity of 5%. Average aircraft size continues to grow as frequencies
AERONAUTICAL SERVICES ADVISORY MEMORANDUM (ASAM) Focal Point: ASD
 Focal Point: ASD") Page 1 of 8 1. Introduction This advisory memorandum provides guidance to Air Traffic Service Providers in respect of flights operating in the vicinity of volcanic ash. 2. Purpose The purpose of this memorandum
Page 1 of 8 1. Introduction This advisory memorandum provides guidance to Air Traffic Service Providers in respect of flights operating in the vicinity of volcanic ash. 2. Purpose The purpose of this memorandum
Punktlighed for august 2017 pr. flyselskab
 for august 2017 pr. flyselskab Afgange rute **) er med mindre end 10 operationer. Acd/Ad Hoc 12 0 12 0% 0 100% 0 Adria 21 21 0 100% 4 81% 26 Aegean S.A. Aeroflot Russian 19 19 0 100% 9 53% 22 62 62 0 100%