China 17% Foreign overnight stays 31% Domestic overnight stays 69% 8.3 MILLION FOREIGN VISITORS IN FINLAND IN 2017
|
|
|
- Arleen Baker
- 5 years ago
- Views:
Transcription

1

 OF FOREIGN VISITORS IN 217: 21.")


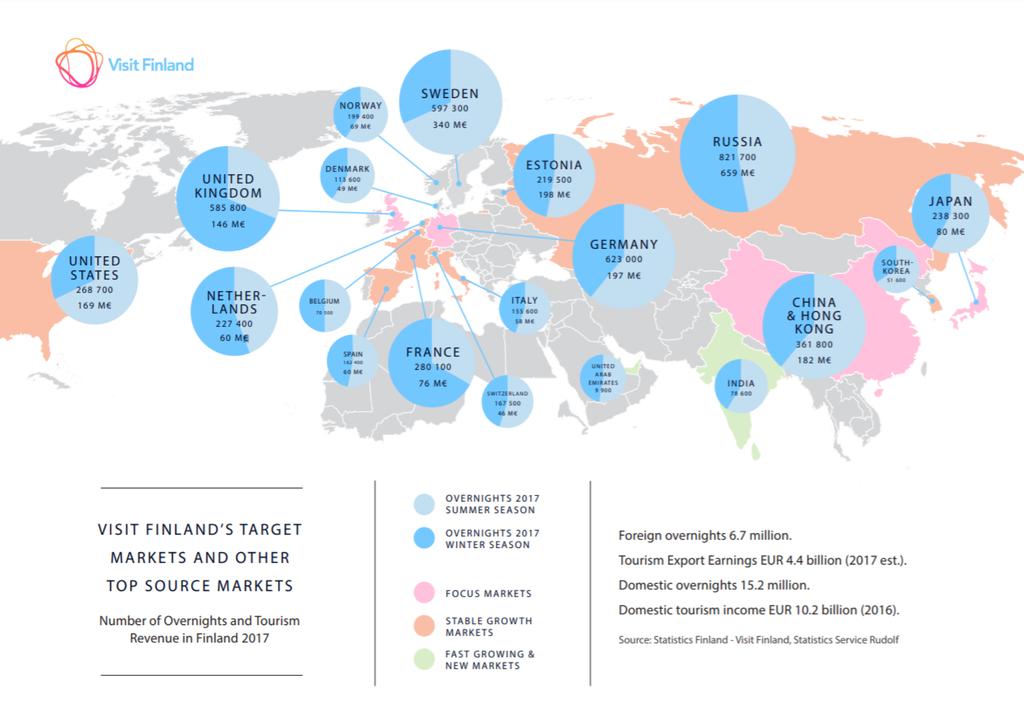
2 TOURISM IS A GROWING SOURCE OF EXPORT REVENUE AND A SIGNIFICANT EMPLOYMENT PROVIDER IN FINLAND TOURISM HAS A MULTIPLIER EFFECT ON OTHER SECTORS. 1 EURO IN TOURISM ADDS 56 CENTS VALUE TO THE OTHER SECTORS. OVERNIGHT STAYS (6.7 MILLION) OF FOREIGN VISITORS IN 217: 21.9 MILLION OVERNIGHT STAYS AT FINNISH ACCOMMODATION Russia 1 America 6% Other countries 13% EU-28 53% Foreign overnight stays 3 Asia 16% Domestic overnight stays 69% 8.3 MILLION FOREIGN VISITORS IN FINLAND IN 217 SPENDING PER VISIT IN China EUR 1, Spain EUR Belgium EUR France EUR India EUR USA EUR South Korea EUR Japan EUR Australia EUR Canada EUR 516 BREAKDOWN OF CONSUMPTION BY FOREIGN VISITORS IN 217 Other countries 33% Russia 24% China 17% Japan 3% Estonia 4% Sweden UK 4% Germany 6% Sources: Visit Finland, StatisticsFinland
3
4 China and Hong Kong Market Volume Population 1,4 billion people Outbound travel from China 93 million arrivals to all destinations in compared to 216 Ø Europe s share of Chinese outbound travel is 14% Ø Finland s share of Chinese outbound travel is,4% Travel expenditure (total outbound travel from China) 27 billion EUR Outbound travel from Hong Kong 36 million arrivals to all destinations in % compared to 216 Ø Europe s share of Hong Kongese outbound travel is 1,4% Ø Finland s share of Hong Kongese outbound travel is, Travel expenditure (total outbound travel from Hong Kong) 21 billion EUR Expenditure (billions)* Forecast for Global outbound travel and Expenditure from Mainland China to foreign countries 16% 1 6% 7% *Speding by residents on travel in foreign countries. EUR (billions) Arrivals (s) Arrivals (s) Chinese overnights and % change in Finland % 4% 29% % 5% 4% 3% 1% % Expenditure (billions)* Forecast for Global outbound travel and Expenditure from Hong Kong to foreign countries - - 7% 3% 4% 4% 6% 6% EUR (billions) Arrivals (s) *Speding by residents on travel in foreign countries Arrivals (s) Source UNWTO/Statistics Finland/Eurostat/IMF Balance of Payments, Rudolf data base, Statistics Finland
 - the world s growth driver in outbound")


 No.")


5 China (incl. Hong Kong) - the world s growth driver in outbound trips Year overnights, +33% Which part of China are the visitors from 24% Helsinki received more than two thirds of the registered Chinese overnights in 217, Lapland already every fifth and it is growing the most 24% Share of overnights by regions % Chinese visitor rankings in Finland in 217 No. 5 in overnights in 217 (361 8, +33%) No. 5 in travel receipts in 217 ( 182 million, +) Spending per trip 1, % 7% 2 Finland Top of mind Top words describing Finland s image in China. Sources: Visit Finland Statistics Service Rudolf, Statistics Finland Visit Finland Visitor Survey 217 Visit Finland Segmentation Survey 217, MyStay
: 146 4 (+66%) Summer (May-Oct): 25 (+23%) China &")
 Autumn season (9-11) 4")

6 Chinese overnights in Finland Winter and Summer 217 Winter (Nov-Apr): (+66%) Summer (May-Oct): 25 (+23%) China & Hong Kong High winter season (12-2) Spring season (3-5) 42 % 58 % 14 High summer season (6-8) Autumn season (9-11) 4 6% % Source: Visit Finland Statistics Service Rudolf, Statistics Finland
 overnights in")


 57 1 +37%")

 74 +27% Chinese")


7 Chinese (incl. Hong Kong) overnights in Finland Seasonal overnights in 217 Whole Finland No. of Chinese (incl. Hong Kong) overnights vs. 216 Winter (Dec-Feb) Spring (Mar-May) % Rovaniemi 47% Inari/Saariselkä 2 Kemi 1 Sodankylä 7% Summer (Jun-Aug) Autumn (Sep-Nov) % Chinese overnights in Finland by season in 217 Turku 14% Oulu 13% Lohja 9% Tampere 2 Sotkamo 1 Heinola 14% Savonlinna 6% Jyväskylä 6% Lahti Helsinki 6 Vantaa 3 Source: Rudolf data base, Statistics Finland
8 China (incl. Hong Kong) Chinese overnights in Finland by month January February March April May June July August September October November December 15% 1% 5% % -5% January Chinese overnights by monthly change % February March April May June July August September October November December Sources: Visit Finland Statistics Service Rudolf, Statistics Finland
 Nordic countries' share of Chinese")


9 China (incl. Hong Kong) Nordic countries' share of Chinese overnights 217 Iceland % Denmark % 5 45 Development of Chinese overnights Sweden* % Finland % Norway % Chinese overnights, change % Change 217/16 Average annual change Denmark Finland Norway Sweden* Iceland 49% 49% 15 33% % 13% 3% Denmark Finland Norway Sweden* Iceland
10 China (incl. Hong Kong) 3 Chinese overnights in the Nordic countries, winter season (Dec-Apr) Chinese overnights in the Nordic countries, summer season (Jun-Aug) Denmark Finland Norway Sweden* 25 2 Denmark Finland Norway Sweden* Corresponding seasonal overnights not available for Iceland Change of Chinese overnights by season 217/16 Winter (Dec-Apr) Summer (Jun-Aug) % Denmark Finland Norway Sweden Sources: Visit Finland Statistics Service Rudolf, Statistics Finland Statistics Sweden, Norway and Denmark 1
 Internet searches regarding Finnish tourism Chinese internet searches and overnights by month Online searches by Chinese regarding Finland 6 5 4 3 2 1 January 216 February 216 March 216")
11 China (incl. Hong Kong) Internet searches regarding Finnish tourism Chinese internet searches and overnights by month Online searches by Chinese regarding Finland January 216 February 216 March 216 April 216 May 216 June 216 July 216 August 216 September 216 October 216 November 216 December 216 January 217 February 217 March 217 April 217 May 217 June 217 July 217 August 217 September 217 October 217 November 217 December 217 Searches Overnights January February March April May June July August September October November December Graph indicating all Chinese overnights in Finland in relation to internet searches regarding Finland All travel and tourism related online searches conducted by Chinese regarding Finland Interest towards Finland Top 1 in 217 measured by online searches 1 Searches regarding Travel 2 Shopping in Finland Extraordinary accommodation such as igloos ice hotels, treehouse hotels 3 4 Winter sports, skiing 5 Finnish Sauna 6 Attractions in Finland 7 Museums 8 Husky & Reindeer Safaris 9 Spa & Beauty, Wellbeing 1 Hiking, Walking, National Parks, Natural Wonders Sources: Digital Demand, MyStay, Rudolf data base, Statistics Finland 11
 Extended family")


 21 % Accommodation Hotel or motel 53 % Chinese visitors activities and interests,")


12 Chinese visitors in Winter (Nov-April) Visiting friends or relatives 2 % Study or training 6 % Business trip 14 % Transit 2 % Immediate family (household with kids) Extended family (with family members outside the PURPOSE OF TRAVEL Holiday trip 55 % TRAVEL COMPANY Group of friends Alone Spouse/Partner only Other company 7% 1 23% 2 Other reason 3 % 34% Purchased trip as package 63% 6 days or more 31 % 4-5 days 2 % 33% Duration A Chinese traveler spends on average 756 per trip during winter. 1 day 12 % 3 days 14 % 3% No Yes Don't know 2 days 23 % 27% 29% Age group 3 3% over 64 Friends or relatives 3 % Other 12 % Camping area, hostel or rented cottage 11 % Rental flat (incl. Airbnb) 21 % Accommodation Hotel or motel 53 % Chinese visitors activities and interests, Winter (Nov-April) Experienced during the trip Buildings, castles, monuments, Other winter activities and Finnish sauna Walking, hiking, camping in nature Winter sports Shopping Cultural events National parks Finnish culinary experiences Concerts and music festivals Sport events Other outdoor activities Family destinations Finnish summer cottages Wellness services and treatments % 1 14% 4% 1 17% 19% 37% 3% 27% Biking, mountaing biking 4% 1 Interested but did not experience during the trip 1 4% 64% 27% % 1 17% 4% 27% 14% Note: the figures on this slide are not definite but directional figures. Winter N=289 Source: VF Visitor Survey 217
 Extended family (with family members Other reason 2 % Holiday")


13 Chinese visitors in Summer (May-Oct) Business trip 5 % Study or training 5 % PURPOSE OF TRAVEL Transit 1 % Spouse/Partner only Immediate family (household with kids) Extended family (with family members Other reason 2 % Holiday trip 74 % TRAVEL COMPANY Group of friends Alone Other company 13% 19% Visiting friends or relatives 4 % 23% days 17 % Purchased trip as package 6 6 days or more 16 % 4-5 days 9 % 37% 2 days 3 % Yes No Don't know Duration in Finland A Chinese traveler spends on average 1,817 per trip during summer. 1 day 28 % 16% Buildings, castles, monuments, Shopping Other winter activities and 3% Cultural events National parks over 64 Finnish culinary experiences Camping area, hostel or rented cottage 4 % Rental flat (incl. Airbnb) 12 % Friends or relatives 8 % Age group 29% 24% 1 Accommodation Other 4 % 7% Hotel or motel 72 % Note: the figures on this slide are not definite but directional figures. Chinese visitor s activities and interests, Summer (May-Oct) Experienced during the trip Walking, hiking, camping in nature Finnish sauna Other outdoor activities Concerts and music festivals Family destinations Winter sports Biking, mountaing biking Finnish summer cottages Wellness services and treatments Summer N=434 Interested but did not experience during the trip 9% 7% 16% 19% 1 14% 26% 13% 4% 4% 3 6% 1% 1% 56% 16% % Sport events 3% 4% Source: VF Visitor Survey 217 7%
America 6% Russia 12%
 TOURISM IS A GROWING SOURCE OF EXPORT REVENUE AND A SIGNIFICANT EMPLOYMENT PROVIDER IN FINLAND TOURISM HAS A MULTIPLIER EFFECT ON OTHER SECTORS. 1 EURO IN TOURISM ADDS 56 CENTS VALUE TO THE OTHER SECTORS.
Japan 3% Foreign overnight stays 31% Domestic overnight stays 69% 8.3 MILLION FOREIGN VISITORS IN FINLAND IN 2017
 TOURISM IS A GROWING SOURCE OF EXPORT REVENUE AND A SIGNIFICANT EMPLOYMENT PROVIDER IN FINLAND TOURISM HAS A MULTIPLIER EFFECT ON OTHER SECTORS. 1 EURO IN TOURISM ADDS 56 CENTS VALUE TO THE OTHER SECTORS.
Foreign overnight stays 31% Domestic overnight stays 69% 8.3 MILLION FOREIGN VISITORS IN FINLAND IN 2017
 TOURISM IS A GROWING SOURCE OF EXPORT REVENUE AND A SIGNIFICANT EMPLOYMENT PROVIDER IN FINLAND TOURISM HAS A MULTIPLIER EFFECT ON OTHER SECTORS. 1 EURO IN TOURISM ADDS 56 CENTS VALUE TO THE OTHER SECTORS.
Russia 12% Russia 24% Foreign overnight stays 31% Domestic overnight stays 69% 8.3 MILLION FOREIGN VISITORS IN FINLAND IN 2017
 TOURISM IS A GROWING SOURCE OF EXPORT REVENUE AND A SIGNIFICANT EMPLOYMENT PROVIDER IN FINLAND TOURISM HAS A MULTIPLIER EFFECT ON OTHER SECTORS. 1 EURO IN TOURISM ADDS 56 CENTS VALUE TO THE OTHER SECTORS.
Visit Tampere partners - verkosto Visit Finland Japan activities
 Visit Tampere partners - verkosto Visit Finland Japan activities 4.10.2018 VF main messages - Japan Northern lights and nature Northern Lights Soft activities in pure nature Finnish nature lifestyle Healing
South Korea. South-Korean Visitors in Finland Statistical Trends and Profile
 South Korea M A R K E T R E V I E W 2 0 1 5 South-Korean Visitors in Finland Statistical Trends and Profile 14.10.2016 STATISTICS ON KOREAN TOURISM IN FINLAND STATISTICAL TRENDS 3 Registered overnights
Belgium. Belgian Visitors in Finland Statistical Trends and Profile
 Belgium M A R K E T R E V I E W 2 0 1 5 Belgian Visitors in Finland Statistical Trends and Profile 24.10.2016 STATISTICS ON BELGIAN TOURISM IN FINLAND STATISTICAL TRENDS 3 Registered overnights 4 Number
Spain. Spanish Visitors in Finland Statistical Trends and Profile
 Spain M A R K E T R E V I E W 2 0 1 5 Spanish Visitors in Finland Statistical Trends and Profile 25.10.2016 STATISTICS ON SPANISH TOURISM IN FINLAND STATISTICAL TRENDS 3 Registered overnights 4 Number
Norway MARKET REVIEW Norwegian Visitors in Finland Statistical Trends and Profile
 Norway MARKET REVIEW 2015 Norwegian Visitors in Finland Statistical Trends and Profile 24.11.2016 STATISTICS ON NORWEGIAN TOURISM IN FINLAND STATISTICAL TRENDS 3 Registered overnights 4 Number of visitors
France. French Visitors in Finland Statistical Trends and Profile
 France M A R K E T R E V I E W 2 0 1 5 French Visitors in Finland Statistical Trends and Profile 14.10.2016 STATISTICS ON FRENCH TOURISM IN FINLAND STATISTICAL TRENDS 3 Registered overnights 4 Number of
Sweden. Swedish Visitors in Finland Statistical Trends and Profile
 Sweden M A R K E T R E V I E W 2 0 1 5 Swedish Visitors in Finland Statistical Trends and Profile 26.10.2016 STATISTICS ON SWEDISH TOURISM IN FINLAND STATISTICAL TRENDS 3 Registered overnights 4 Number
Visit Finland Visitor Survey 2017
 Visit Finland Visitor Survey 2017 Visit Finland Studies 9 Business Finland, Visit Finland Helsinki 2018 Foreign visitors in Finland in 2017 Contents Abstract 5 Introduction 7 Trips to Finland 10 Day and
Accommodation statistics 2016
 Transport and Tourism 2017 Accommodation statistics 2016 Demand for accommodation services grew by 3 per cent in 2016 In 2016, accommodation in Finland recorded 203 million overnight stays, of which domestic
THE GROWTH OF THE HOSPITALITY INDUSTRY IN DUBAI
 THE GROWTH OF THE HOSPITALITY INDUSTRY IN DUBAI THE DEFINITION OF TOURISM Tourism is travel for recreational, leisure or business purposes. The World Tourism Organization defines tourists as people "traveling
total - foreign overnights - domestic overnights
 TOURISM IN ESTONIA IN 214 TOURISM IN ESTONIA IN 214 (updated in Sept. 216) 1 In 214, 3.1 million foreign and domestic tourists stayed overnight in the accommodation establishments of Estonia (3.6% more
Foreign Overnights in Finland 2016
 Foreign Overnights in Finland 2016 June 14, 2017 First name Last name 2 Positive outlook for Finland growing flows of visitors from several markets FOREIGN OVERNIGHTS 2016 5.8 million +4.7% growth 2016
Accommodation statistics
 Transport and Tourism 201 Accommodation statistics 201, September Nights spent by foreign tourists in Finland up by 11.3 per cent in September 201 Nights spent by foreign tourists at Finnish accommodation
India Market Report. Visit Finland India. Kalsi Gurpreet November
 India Market Report Visit Finland India Kalsi Gurpreet November 2017 14.11.2017 Semiannual Report - INDIA Summer season 2017 and outlook for winter 2017-2018 CONTENTS What factors have affected the results
Accommodation statistics
 Transport and Tourism 201 Accommodation statistics 201, October Nights spent by non-resident tourists up by 12.3 per cent in October 201 Nights spent by foreign tourists at Finnish accommodation establishments
Tourism Snapshot A focus on the markets in which the CTC and its partners are active
 Tourism Snapshot A focus on the markets in which the CTC and its partners are active www.canada.travel/corporate January 214 Volume 1, Issue 1 Key highlights Total arrivals from CTC s international markets
Accommodation statistics
 Transport and Tourism 2018 Accommodation statistics 2018, January Nights spent by foreign tourists in Finland grew by 6.6 per cent in January 2018 Corrected on 8 March 2018. The corrected number is indicated
Tourist arrivals and overnight stays in collective accommodation 1 July 2017 (p)
") Jul-16 Aug-16 Sep-16 Oct-16 Nov-16 Dec-16 Jan-17 Feb-17 Mar-17 Apr-17 May-17 Jun-17 Jul-17 MONTENEGRO STATISTICAL OFFICE R E L E A S E No: 158 Podgorica, 31 August 2017 When using the data please name
Jul-16 Aug-16 Sep-16 Oct-16 Nov-16 Dec-16 Jan-17 Feb-17 Mar-17 Apr-17 May-17 Jun-17 Jul-17 MONTENEGRO STATISTICAL OFFICE R E L E A S E No: 158 Podgorica, 31 August 2017 When using the data please name
Survey on arrivals and overnight stays of tourists, total 2017
 MONTENEGRO STATISTICAL OFFICE R E L E A S E No: 34/2 Podgorica, 1 June 2018 When using the data please name the source Survey on arrivals and overnight stays of tourists, total In Montenegro, in, tourist
Accommodation statistics
 Transport and Tourism 20 Accommodation statistics 20 August Nights spent by foreign tourists in Finland increased by 14 per cent in August The number of recorded nights spent by foreign tourists at Finnish
Accommodation statistics
 Transport and Tourism 2012 Accommodation statistics 2012, October Nights spent by foreign tourists in Finland up by 36 per cent in October 2012 The number of recorded nights spent by foreign tourists at
Overview of tourism trends in Tallinn. First quarter report in 2018
 Overview of tourism trends in Tallinn First quarter report in 2018 Visits of foreign residents to Tallinn, January - March 2018 Residents of foreign countries made 780 338 visits to Tallinn, which means
An overview of Tallinn tourism trends
 An overview of Tallinn tourism trends August 2015 The data is collected from Statistics Estonia, Tallinn Airport and Port of Tallinn. In August 2015, 179,338 stayed overnight in Tallinn s accommodation
Tourism Snapshot A focus on the markets in which the CTC and its partners are active
 Tourism Snapshot A focus on the markets in which the CTC and its partners are active www.canada.travel/corporate June Volume 1, Issue 6 Key highlights CTC s overseas markets leaped 1% over the same month
U.S. Travel and Tourism Report
 2014/TWG44/010 Agenda Item: 18 U.S. Travel and Tourism Report Purpose: Information Submitted by: United States 44 th Tourism Working Group Meeting Cusco, Peru 9-10 April 2014 U.S. Travel and Tourism Report
INTERNATIONAL TRAVEL AND TOURISM
 INTERNATIONAL TRAVEL AND TOURISM YEAR 2014 1. INTRODUCTION This issue of the Economic and Social Indicators presents data on International Travel and Tourism for the year 2014. A brief on the compilation
MARKET NEWSLETTER No 57 January 2012
 OVERVIEW OF INTRA-EUROPEAN UNION TRADING BETWEEN 2007/08 AND 2010/11 The data on intra-eu trade reported in this month s newsletter have been taken from the EUROSTAT database. However, it is important
Chart 2. International Student Nights in NSW
 International Student Visitors to NSW Year Ended March 2017 INTRODUCTION The International Education segment in Australia and NSW has had a resurgence and is growing. According to the Department of Education
Asian stopovers in Nordic countries Optimistic perspectives. March 2018
 Asian stopovers in Nordic countries Optimistic perspectives March 2018 OUR COMMITMENT IS TO HAVE THE MOST PRECISE, UP-TO-DATE MARKETDATA ON TRAVELLERS JOURNEYS 30.238.647 Travellers monitored each day
International Visitation to the Northern Territory. Year ending March 2017
 International Visitation to the Northern Territory Year ending March 217 The following is a summary of information relevant to the Northern Territory tourism industry including visitation results from
AFTA Travel Trends. June 2017
 AFTA Travel Trends June 2017 AFTA Travel Trends Report 2017 Inbound and Outbound overview Introduction This snapshot provides an overview of the balance of trade between Inbound and Outbound Travel for
I T N E T R E N R A N T A I T ON O AL A L A R A R R I R VA V L A S L S A N A D N D D E D PA
 INTERNATIONAL ARRIVALS AND DEPARTURES July 2015 Government of Tonga SD18M-36 Statistical Bulletin Month of Change from Change from July 2015 Number previous month previous year All Arrivals 8,252-28.0
Steve Smith Director Cargo Supply Chain Management
 IATA e-freight project status Steve Smith Director Cargo Supply Chain Management Contents 1. Introduction: Vision and Board Mandate 2. Current Performance 3. 2010 progress to increasing e-freight capability:
Blue Mountains Visitors. International overnight, domestic overnight and domestic daytrip visitors. Sep-11. Jun-11. Sep-10. Dec-10. Dec-11.
 Dec-08 Mar-09 Jun-09 Sep-09 Dec-09 Mar-10 Jun-10 Sep-10 Dec-10 Mar-11 Jun-11 Sep-11 Dec-11 Mar-12 Jun-12 Sep-12 Dec-12 Mar-13 Jun-13 Sep-13 Dec-13 Mar-14 Jun-14 Sep-14 Visitors (000's) OVERVIEW LGA PROFILE
OVERVIEW Four year annual average to the year ending September 2014
 LGA PROFILE - OVERVIEW Total Visitors (overnight and domestic daytrip) (000's) 1,453 80,316 Total Overnight Visitors (000's) 749 28,105 Total Nights (000's) 2,728 154,563 Total Spend (overnight and domestic
AUCKLAND DESTINATION OVERVIEW
 AUCKLAND DESTINATION OVERVIEW JULY 218 An in-depth overview of Auckland s visitor economy from the latest arrival, accommodation, spend and cruise data through to past five-year commentary. Prepared August
Latest Tourism Trends. Humphrey Walwyn Head of VisitEngland Research
 Latest Tourism Trends Humphrey Walwyn Head of VisitEngland Research 1 Inbound Tourism 2 2003 2004 2005 2006 2007 2008 2009 2010 2011 2012 2013 2014 2015 2016 2017 UK inbound long term trend Spend per visit
AUCKLAND DESTINATION OVERVIEW
 AUCKLAND DESTINATION OVERVIEW JUNE 218 An in-depth overview of Auckland s visitor economy from the latest arrival, accommodation, spend and cruise data through to past five-year commentary. Prepared July
Nearly 2.5 million nights recorded in Foreigners' share of nights over 60% Record set in 2000 HELSINKI TOURISM STATISTICS
 Year HELSINKI TOURISM STATISTICS FIGURE 1. Monthly overnights in Helsinki Nearly 2.5 million nights recorded in Nights spent at registered accommodation establishments in Helsinki totalled nearly 2.5 million
AFTA Travel Trends. July 2017
 AFTA Travel Trends July 2017 AFTA Travel Trends Report 2017 Inbound and Outbound overview Introduction This snapshot provides an overview of the balance of trade between Inbound and Outbound Travel for
International Visitation to the Northern Territory. Year ending June 2017
 International Visitation to the Northern Territory Year ending June 217 The following is a summary of information relevant to the Northern Territory tourism industry including visitation results from Tourism
Tourism Statistics Region 1
 Tourism Statistics Region 1 Tourism Research Unit Winter 2011 1 Summary In 2008, there were 101.0 million visits in and visitors spent $17.6 billion residents account for the majority of visits and spending
OVERVIEW. Currently South Australia contributes $6.3 billion to the Australian tourism economy.
 OVERVIEW Currently contributes $6.3 billion to the Australian tourism economy. has achieved 79 per cent of its $8.0 billion maximum potential by 2020. $6.3b $6.5b $8b 2016 2017 2020 Annual Visitor Summary
International Visitation to the Northern Territory. Year ending September 2017
 International Visitation to the Northern Territory Year ending September 2017 The following is a summary of information relevant to the Northern Territory (NT) tourism industry including visitation results
Germany Market Report May Visit Finland Marketing Representative Jyrki Oksanen
 Germany Market Report May 2018 Visit Finland Marketing Representative Jyrki Oksanen Semiannual Report GERMANY Winter season 2017-18 and outlook for summer 2018 CONTENTS Factors affecting the results of
Tourism Snapshot A focus on the markets in which the CTC and its partners are active
 Tourism Snapshot A focus on the markets in which the CTC and its partners are active www.canada.travel/corporate April Volume 1, Issue 4 Key highlights Total arrivals from CTC s international markets improved
OVERVIEW Four year annual average to the year ending September 2014
 Dec-08 Mar-09 Jun-09 Sep-09 Dec-09 Mar-10 Jun-10 Sep-10 Dec-10 Mar-11 Jun-11 Sep-11 Dec-11 Mar-12 Jun-12 Sep-12 Dec-12 Mar-13 Jun-13 Sep-13 Dec-13 Mar-14 Jun-14 Sep-14 Visitors (000's) LGA PROFILE - Port
Global robot installations: high double digit growth rates
 ' of units Global robot installations: high double digit growth rates 5 45 4 35 3 25 2 15 1 5 113 6 Estimated annual worldwide supply of industrial robots 28-216 and 217-22* +15% on average per year 121
Tourism Snapshot. June 2015 Volume 11, Issue 6. A focus on the markets in which Destination Canada (DC) and its partners are active.
 and its partners are active.") Tourism Snapshot Tourism PEI / Paul Baglole A focus on the markets in which Destination Canada (DC) and its partners are active. www.destinationcanada.com June Volume 11, Issue 6 Key highlights Over the
Tourism Snapshot Tourism PEI / Paul Baglole A focus on the markets in which Destination Canada (DC) and its partners are active. www.destinationcanada.com June Volume 11, Issue 6 Key highlights Over the
OVERVIEW Four year annual average to the year ending September 2014
 Dec-08 Mar-09 Jun-09 Sep-09 Dec-09 Mar-10 Jun-10 Sep-10 Dec-10 Mar-11 Jun-11 Sep-11 Dec-11 Mar-12 Jun-12 Sep-12 Dec-12 Mar-13 Jun-13 Sep-13 Dec-13 Mar-14 Jun-14 Sep-14 Visitors (000's) LGA PROFILE - Great
Global Travel Trends 2005
 Preliminary World Travel Monitor Results from IPK international for the ITB Berlin Message, 03/10/06 Global Travel Trends 2005 Based on the new data from the 2005 World Travel Monitor, and as it does every
OVERVIEW Four year annual average to the year ending September 2014
 Dec-08 Mar-09 Jun-09 Sep-09 Dec-09 Mar-10 Jun-10 Sep-10 Dec-10 Mar-11 Jun-11 Sep-11 Dec-11 Mar-12 Jun-12 Sep-12 Dec-12 Mar-13 Jun-13 Sep-13 Dec-13 Mar-14 Jun-14 Sep-14 Visitors (000's) LGA PROFILE - Newcastle
International Visitation to the Northern Territory. Year ending December 2017
 International Visitation to the Northern Territory Year ending December 2017 The following is a summary of information relevant to the Northern Territory (NT) tourism industry including visitation results
OVERVIEW Four year annual average to the year ending September 2014
 Dec-08 Mar-09 Jun-09 Sep-09 Dec-09 Mar-10 Jun-10 Sep-10 Dec-10 Mar-11 Jun-11 Sep-11 Dec-11 Mar-12 Jun-12 Sep-12 Dec-12 Mar-13 Jun-13 Sep-13 Dec-13 Mar-14 Jun-14 Sep-14 Visitors (000's) LGA PROFILE - Snowy
Total expenditure by international tourists visiting Spain in August increases by 3.8% compared with the same month last year
 5 October 2016 Tourist Expenditure Survey August 2016. Provisional data Total expenditure by international tourists visiting Spain in August increases by 3.8% compared with the same month last year Average
Tourism Snapshot. A focus on the markets in which the CTC and its partners are active. February 2015 Volume 11, Issue 2.
 Tourism Snapshot Tourism Whistler/Mike Crane A focus on the markets in which the CTC and its partners are active www.canada.travel/corporate February Volume 11, Issue 2 Key highlights The strong beginning
Western Cape Destination Performance Report: April-June 2016
 Number of arrivals (millions) Western Cape Destination Performance Report: April-June 2016 Global Tourism Performance According to the United Nations World Tourism Organisation, international tourist arrivals
Digest of International Travel and Tourism Statistics 2017
 Vol. 44 Republic of Mauritius Digest of International Travel and Tourism Statistics 2017 Ministry of Finance and Economic Development Statistics Mauritius October 2018 (Price: Rs 75.00) DIGEST OF INTERNATIONAL
Tourism Snapshot A focus on the markets in which the CTC and its partners are active
 Tourism Snapshot A focus on the markets in which the CTC and its partners are active www.canada.travel/corporate May Volume 1, Issue 5 Key highlights Total arrivals from CTC s international markets improved
TOURISM FACTS Total Foreign Exchange Earnings ,065 4,057 3,989 3,935 3,637 3,115 2, ,000 2,000 3,000 4,000 5,000 6,000
 TOURISM FACTS 2008 Tourism Performance in 2008 Expenditure by visitors to Ireland (including receipts paid to Irish carriers by foreign visitors) was estimated to be worth 4.8 billion in 2008. Total Foreign
South Korea Market Report
 Visit Finland South Korea South Korea Market Report Jani Toivanen May 2018 30.5.2018 Semiannual Report SOUTH KOREA Winter season 2017-18 and outlook for summer 2018 CONTENTS Factors affecting the results
OVERVIEW Four year annual average to the year ending September 2014
 LGA PROFILE - Tweed OVERVIEW Total Visitors (overnight and domestic daytrip) (000's) 1,444 80,316 Total Overnight Visitors (000's) 534 28,105 Total Nights (000's) 2,054 154,563 Total Spend (overnight and
OVERVIEW Four year annual average to the year ending September 2014
 Dec-08 Mar-09 Jun-09 Sep-09 Dec-09 Mar-10 Jun-10 Sep-10 Dec-10 Mar-11 Jun-11 Sep-11 Dec-11 Mar-12 Jun-12 Sep-12 Dec-12 Mar-13 Jun-13 Sep-13 Dec-13 Mar-14 Jun-14 Sep-14 Visitors (000's) LGA PROFILE - Orange
MONTHLY NATURAL GAS SURVEY. November 2009
 MONTHLY NATURAL GAS SURVEY November 2009 INTERNATIONAL ENERGY AGENCY INTERNATIONAL ENERGY AGENCY Next Release: 12 March 2010 MONTHLY NATURAL GAS SURVEY - 1 CONTENTS TABLE 1 Natural Gas Balances in OECD
Total expenditure by international tourists visiting Spain in March rose by 10.0% compared with the same month last year 1
 5 May 2016 Tourist Expenditure Survey March 2016. Provisional data Total expenditure by international tourists visiting Spain in March rose by 10.0% compared with the same month last year 1 Average expenditure
Total expenditure by international tourists visiting Spain in February increases by 2.9% compared with the same month of 2018
 02 April 2019 Total expenditure survey. Provisional data Total expenditure by international tourists visiting Spain in February increases by 2.9% compared with the same month of 2018 Average daily expenditure
% change vs. Dec ALL VISITS (000) 2,410 12% 7,550 5% 31,148 1% Spend ( million) 1,490 15% 4,370-1% 18,710 4%
 2,410 12% 7,550 5% 31,148 1% Spend ( million) 1,490 15% 4,370-1% 18,710 4%") HEADLINES FULL YEAR 2012 (PROVISIONAL) 1 Overall visits 31.148 million visits making 2012 the best year for inbound tourism since 2008 but not a record. 1% increase in visits on 2011 (30.798 visits) slightly
HEADLINES FULL YEAR 2012 (PROVISIONAL) 1 Overall visits 31.148 million visits making 2012 the best year for inbound tourism since 2008 but not a record. 1% increase in visits on 2011 (30.798 visits) slightly
2017 VISITOR STATISTICS WASHINGTON, DC
 2017 VISITOR STATISTICS WASHINGTON, DC TOTAL VISITATION TO WASHINGTON, DC WASHINGTON, DC (DISTRICT OF COLUMBIA) VISITORS (IN MILLIONS) 20 15 10 5 Overseas Domestic 14.9 1.0 13.9 15.9 1.1 16.6 16.3 1.4
AUCKLAND DESTINATION OVERVIEW
 AUCKLAND DESTINATION OVERVIEW AUGUST 218 An in-depth overview of Auckland s visitor economy from the latest arrival, accommodation, spend and cruise data through to past five- commentary. Prepared September
TOURISM NEW ZEALAND OUR VISITORS UNDERSTANDING <1% <1% <1% HISTORIC VIEW TOTAL ARRIVALS YE APRIL 2017
 TOURISM JAPAN 102K 3% NEW ZEALAND UNDERSTANDING OUR VISITORS Our market infographics are drawn from two different sources. HISTORIC VIEW: Past Visitor Research This is information collected about those
OVERVIEW Four year annual average to the year ending September 2014
 Dec-08 Mar-09 Jun-09 Sep-09 Dec-09 Mar-10 Jun-10 Sep-10 Dec-10 Mar-11 Jun-11 Sep-11 Dec-11 Mar-12 Jun-12 Sep-12 Dec-12 Mar-13 Jun-13 Sep-13 Dec-13 Mar-14 Jun-14 Sep-14 Visitors (000's) LGA PROFILE - Tenterfield
Cooma-Monaro Visitors. International overnight, domestic overnight and domestic daytrip visitors. Sep-11. Sep-10. Jun-11. Dec-11. Dec-10.
 OVERVIEW LGA PROFILE - Cooma-Monaro Key Measures Cooma- Monaro NSW Total Visitors (overnight and domestic daytrip) (000's) 301 80,316 Total Overnight Visitors (000's) 119 28,105 Total Nights (000's) 346
Forecast for Norwegian and foreign holiday and leisure traffic in Norway. Margrethe Helgebostad
 Forecast for Norwegian and foreign holiday and leisure traffic in Norway Margrethe Helgebostad 1 Optimism at the start of the summer season there are many signs that the fifth summer season in a row with
2012 Coach & Charter Seminar. 21 February 2012 Presented by Amanda Coghlan Strategic Insights Analyst
 2012 Coach & Charter Seminar 21 February 2012 Presented by Amanda Coghlan Strategic Insights Analyst Destination NSW Lead Government agency for the NSW tourism and events sectors Established as a statutory
Rotorua. newzealand.com. argentina. Market information about our Visitors and our Active Considerers
 Rotorua argentina Market information about our Visitors and our Active Considerers newzealand.com PAST VISITORS HISTORIC VIEW TOTAL ARRIVALS YE MARCH 2018 AUS 1,495K 39% INDIA 63K 2% USA 340K 9% GERMAN
India Market Report November 2018
 India Market Report November 2018 Visit Finland Country Representative Sara KaurSodhi Semiannual Report INDIA Summer season 2018 and outlook for winter 2018-19 CONTENTS Factors affecting the results of
OVERVIEW Four year annual average to the year ending September 2014
 Dec-08 Mar-09 Jun-09 Sep-09 Dec-09 Mar-10 Jun-10 Sep-10 Dec-10 Mar-11 Jun-11 Sep-11 Dec-11 Mar-12 Jun-12 Sep-12 Dec-12 Mar-13 Jun-13 Sep-13 Dec-13 Mar-14 Jun-14 Sep-14 Visitors (000's) LGA PROFILE - Eurobodalla
Prospects for international tourism
 Prospects for international tourism Project LINK UN DESA Expert Group Meeting on the World Economy, NYC, USA 24-26 October 211 John G.C. Kester Programme Manager, Tourism Trends and Marketing Strategies
Arkansas State Highway and Transportation Department
 Arkansas State Highway and Transportation Department Blytheville Lions Club Blytheville Country Club Tuesday, September 30, 2014 Mississippi County Construction Projects Miles Cost Complete 146 $162
OVERVIEW Four year annual average to the year ending September 2014
 Dec-08 Mar-09 Jun-09 Sep-09 Dec-09 Mar-10 Jun-10 Sep-10 Dec-10 Mar-11 Jun-11 Sep-11 Dec-11 Mar-12 Jun-12 Sep-12 Dec-12 Mar-13 Jun-13 Sep-13 Dec-13 Mar-14 Jun-14 Sep-14 Visitors (000's) LGA PROFILE - Oberon
Ajankohtaista markkinoilta
 Ajankohtaista markkinoilta 1.5.2013 31.10.2013 Markkinointiedustaja Hong Kong Andrew Leung 19.11.2013 Contents What factors have affected the results of the season, especially with regard to Finland? What
Tourism in Eastern Scotland 2010 Edinburgh & Lothian's, Angus & Dundee, Perthshire and the Kingdom of Fife
 Tourism in Eastern 2010 Edinburgh & Lothian's, Angus & Dundee, Perthshire and the Kingdom of Fife Edinburgh & Lothians Summary It is estimated that in 2010, UK residents made 2.31m trips to Edinburgh and
Understanding Business Visits
 Understanding Business Visits Foresight issue 153 VisitBritain Research 1 Contents Introduction Summary and Highlights Business Visits in Context UK Business visits and spend Averages Duration of stay
Foreign overnights in the Nordic countries 2014
 Foreign overnights in the Nordic countries 2014 Sources: Statistics Statistics Statistics Statistics Visit March 2015 All figures are preliminary. 2 Contents Foreign overnights in the Nordic countries.4
March Domestic Exports Imports. Volume Tonnes SW. MAT Mar-17 5, ,880 36, , % Change 3.6% 4.9% 15.6% 10.0% -5.8% 2.
 March 2018 Overview Table 1.1 Overview trends for Domestic, Export and Import trade Domestic Exports Imports Month Slaughter Pigmeat (Tonnes) Volume Tonnes SW Value $AUD (Million) Volume Tonnes SW Value
SITUATION OF THE TOURISM SECTOR YEAR ENDING 2012
 SITUATION OF THE TOURISM SECTOR YEAR ENDING 2012 1 INDEX PAGE GENERAL STATISTICS TABLE 3 STATISTIC TABLE BY MARKET 4 ANNUAL SUMMARY GRAPHS 5 SECTION 1. TOURISTS AND PASSENGERS 9 GRAN CANARIA 10 TOURISTS
AUCKLAND DESTINATION OVERVIEW
 AUCKLAND DESTINATION OVERVIEW September 218 An in-depth overview of Auckland s visitor economy from the latest arrival, accommodation, spend, cruise and event data through to past five- commentary. Prepared
Tourism Statistics RTO 1
 Tourism Statistics RTO 1 Tourism Research Unit Spring 2012 1 1 Ontario Tourism 2 2 Ontario Tourism Indicators 2011* Visits increased by 1.3% to 104.4 million. Visits from Ontario and overseas countries
February Domestic Exports Imports. Volume Tonnes SW. MAT Feb-17 5, ,167 36, ,
 February 2018 Overview Table 1.1 Overview trends for Domestic, Export and Import trade Domestic Exports Imports Month Slaughter Pigmeat (Tonnes) Volume Tonnes SW Value $AUD (Million) Volume Tonnes SW Value
Cultural and Heritage Tourism to NSW
 Cultural and Heritage Tourism to NSW Year Ended December 2017 This snapshot provides a profile of cultural and heritage 1 to New South Wales in the year ended (YE) December 2017. 2 VISITOR MARKET SIZE
Italy Market Report May 2018
 Italy Market Report May 2018 Visit Finland Country Representative Barbara Demartin Semiannual Report ITALY Winter season 2017-18 and outlook for Summer 2018 CONTENTS Factors affecting the results of the
Tourism Towards 2030 Preview of findings
 Tourism Towards 23 Preview of findings 54th meeting of the UNWTO Commission for the Americas 11 September 212 Quito, Ecuador Carlos Vogeler Regional Director for the Americas World Tourism Organization
Japan Market Report November 2018
 Japan Market Report November 2018 Visit Finland Country Representatives ShigeyoshiNoto and KoichiNumata Semiannual Report JAPAN Summer season 2018 and outlook for winter 2018-19 CONTENTS Factors affecting
AHEA Weekly Competitor Reports. 31 January 2016
 In this Report.. AHEA Weekly Competitor Reports 31 January 2016 Other Suppliers Chile Cherries to 31 January 2016. Table Grapes to 31 January 2016. Nectarines to 31 January 2016. Plums to 31 January 2016
Tourism Snapshot A Monthly Monitor of the Performance of Canada s Tourism Industry
 Tourism Snapshot A Monthly Monitor of the Performance of Canada s Tourism Industry January 2017 Volume 13, Issue 1 Edmonton Tourism www.destinationcanada.com Tourism Snapshot January 2017 1 KEY HIGHLIGHTS
Tourism Snapshot A focus on the markets that the CTC and its partners are active in
 Tourism Snapshot A focus on the markets that the CTC and its partners are active in Newfoundland and Labrador www.canada.travel/corporate October 2011 Volume 7, Issue 10 Key highlights In October 2011,