THE GROWTH OF THE HOSPITALITY INDUSTRY IN DUBAI
|
|
|
- Claribel Osborne
- 5 years ago
- Views:
Transcription
1 THE GROWTH OF THE HOSPITALITY INDUSTRY IN DUBAI
2 THE DEFINITION OF TOURISM Tourism is travel for recreational, leisure or business purposes. The World Tourism Organization defines tourists as people "traveling to and staying in places outside their usual environment for not more than one consecutive year for leisure, business and other purposes
3 TOURISM TRENDS & KEY OPERATING INDICATORS

4 FORECAST 9.3

5 DUBAI VISITORS BY REGION 540, M 3.24 M 2.15 M 513,000 86, , , M (2011)
6 Rank TOP SOURCE MARKETS 2011 OUTLOOK Nationality Total Guests Nationality Total Guests Nationality Total Guests 1 Saudi Arabia 795,000 UK 719,889 UK 714,877 2 India 687,986 India 638,103 India 529,536 3 UK 661,122 Iran 526,598 Iran 476,120 4 Iran 499,322 Saudi Arabia 519,001 Saudi Arabia 414,482 5 USA 459,748 USA 437,723 USA 395,390 6 Kuwait 290,783 Germany 281,484 Germany 283,319 7 Germany 271,435 Kuwait 218,762 Pakistan 204,115 8 Russia 238,924 Russia 209,381 Russia 183,308 9 Pakistan 218,151 Pakistan 196,937 Kuwait 173, Oman 204,921 Oman 184,516 Oman 154, China 193,191 Australia 158,907 Australia 150, Australia 165,536 China 152,076 France 141, France France 147,677 Egypt 131, Egypt 148,859 Egypt 136,872 Italy 124, Qatar 125,859 Italy 115,734 Philippines 118, Philippines 122,794 Philippines 115,340 Canada 107, Italy 110,046 Canada 107,152 China 107, Jordan 95,712 Qatar 104,360 Qatar 95,431

7 CRUISE SHIP CALL STATISTICS

8 CRUISE PASSENGER STATISTICS 412, ,00 0
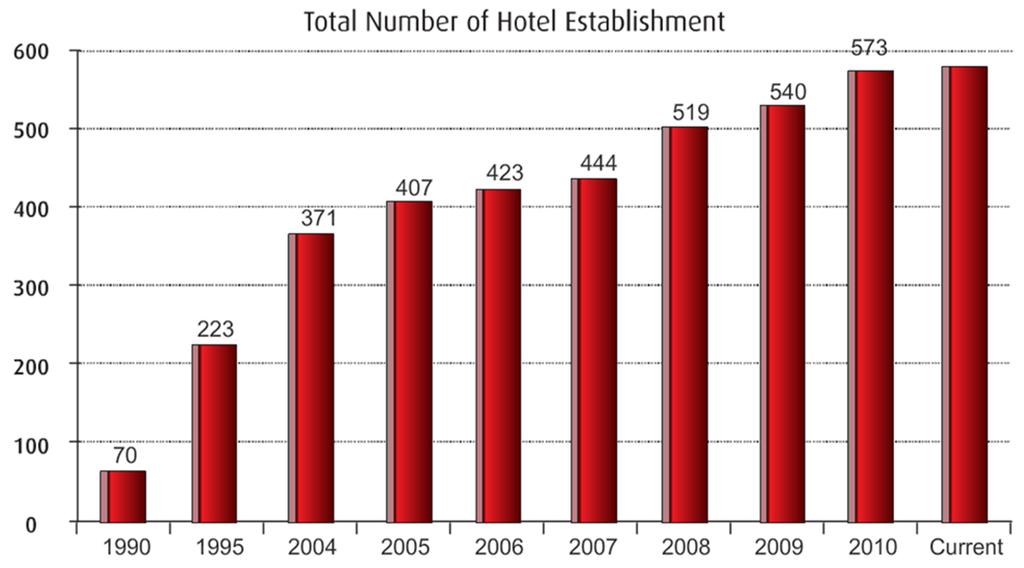
9 HOTEL ESTABLISHMENTS 578
10 HOTEL ESTABLISHMENTS ROOM SUPPLY 74,254
11 CURRENT DUBAI HOTEL & HOTEL APARTMENTS Establishment 5-Star 4-Star 3-Star 2-Star 1-Star Guest House Non- Classified Total % Share Total Beach Hotels % Total City Hotels % Total Hotels % Total Beach Rooms 7, ,131 15% Total City Rooms 12,308 14,316 8,224 5,274 4, ,096 85% Total Rooms 20,205 14,316 8,256 5,274 4, , % Rooms % Share 38% 27% 16% 10% 8% 1% 0% 100% Establishment Deluxe Standard Total Total Hotel Apartments Total Flats/Units 7,505 13,522 21,027 % Share of Total Flats 36% 64% 100% Total Hotel & Apartments 578 Total Rooms & Flats 74,254
12 Air Accessibility Frequency & Seat Capacity
13 AIR ACCESS TO DUBAI TOP 20 Monthly Arrivals Average (Jan-Jun 2011) SL No Departure Country Business Economy / Frequency First Class Class Coach Class Total Seats % Share 1 INDIA 1,617 7,604 36, , ,710 10% 2 UNITED KINGDOM 779 7,699 38, , ,885 8% 3 GERMANY 545 7,165 33, , ,456 6% 4 SAUDI ARABIA 496 3,566 16, , ,206 4% 5 UNITED STATES OF AMERICA 460 4,916 11, , ,271 4% 6 PAKISTAN 531 1,717 9, , ,608 3% 7 QATAR 466 2,332 12,226 91, ,551 3% 8 OMAN 553 1,366 9,502 95, ,159 3% 9 SOUTH AFRICA 298 3,580 12,530 80,121 96,231 3% 10 AUSTRALIA 269 3,044 12,291 80,313 95,649 3% 11 KUWAIT 421 2,383 7,234 79,795 89,412 3% 12 CHINA 271 2,150 9,691 71,090 82,931 3% 13 THAILAND 203 1,946 7,879 64,269 74,095 2% 14 IRAN, ISLAMIC REPUBLIC OF ,759 67,414 72,109 2% 15 BAHRAIN 368 1,295 7,646 57,330 66,271 2% 16 EGYPT ,470 56,374 63,226 2% 17 SINGAPORE 170 1,431 5,674 52,976 60,081 2% 18 NETHERLANDS ,316 49,730 57,326 2% 19 FRANCE 179 2,186 9,785 44,679 56,650 2% 20 NEW ZEALAND 119 1,492 6,026 39,649 47,167 1% Top Countries 8,619 57, ,341 1,905,184 2,227,994 69% Rest of the World 3,893 24, , ,601 1,006,478 31% Total Avg. Arrivals to Dubai 12,512 82, ,458 2,774,785 3,234, % Source: OAG MAX
14 Global Tourism Trends (UNWTO)
")
15 GLOBAL TOURISM TRENDS (UNWTO)
16 GLOBAL TOURISM TRENDS (UNWTO)
17 Dubai s Comparative Global Position

18 ECONOMIC IMPACT OF TOURISM- WORLD Current (Year 2011) Direct Tourism Contribution to GDP (USD) 1,850 Billion Total Tourism Contribution to GDP (USD) 6 Trillion Direct Travel & Tourism Employment 99 Million Total Travel & Tourism Employment 260 Million International Arrivals Worldwide 940 Million Source: WTTC, UNWTO 18
19 OCCUPANCY % Occupancy (%) City Nov 2011 City 2010 City 2009 City 2008 Rooms = 74,254 Rooms = 70,955 Rooms = 61,487 Rooms = 56,599 1 London 83.1 Sydney 83.5 London 80.5 New York Hong Kong 83.3 London 82.1 Sydney 78.5 Hong Kong Sydney 82.7 Hong Kong 81.3 New York 77.2 London New York 81.2 New York 80.9 Paris 73.8 Sydney Paris 79.7 Tokyo 78.2 Hong Kong 73.5 Dubai Dubai 74.9 Paris 76.3 Tokyo 70.6 Paris Tokyo 73.5 Dubai 71.0 Dubai 69.4 Tokyo Los Angeles 72.7 Berlin 69.0 Berlin 67.8 Cairo Berlin 70.5 Toronto 68.3 Cairo 64.9 Los Angeles Toronto 69.6 Los Angeles 68.0 Los Angeles 64.3 Berlin Rome 69.2 Buenos Aires 66.6 Rome 62.8 Buenos Aires Beijing 68.9 Rome 66.4 Toronto 62.3 Toronto Buenos Aires 67.1 Cairo 64.5 Madrid 57.6 Rome Madrid 66.9 Madrid 63.6 Buenos Aires 55.6 Madrid Cairo N/A Beijing 63.1 Beijing 51.6 Beijing 55.3
20 OCCUPANCY % Occupancy (%) City Nov 2011 City 2010 City 2009 City 2008 Rooms = 74,254 Rooms = 70,955 Rooms = 61,487 Rooms = 56,599 1 London 83.1 Sydney 83.5 London 80.5 New York Hong Kong 83.3 London 82.1 Sydney 78.5 Hong Kong Sydney 82.7 Hong Kong 81.3 New York 77.2 London New York 81.2 New York 80.9 Paris 73.8 Sydney Paris 79.7 Tokyo 78.2 Hong Kong 73.5 Dubai Dubai 74.9 Paris 76.3 Tokyo 70.6 Paris Tokyo 73.5 Dubai 71.0 Dubai 69.4 Tokyo Los Angeles 72.7 Berlin 69.0 Berlin 67.8 Cairo Berlin 70.5 Toronto 68.3 Cairo 64.9 Los Angeles Toronto 69.6 Los Angeles 68.0 Los Angeles 64.3 Berlin Rome 69.2 Buenos Aires 66.6 Rome 62.8 Buenos Aires Beijing 68.9 Rome 66.4 Toronto 62.3 Toronto Buenos Aires 67.1 Cairo 64.5 Madrid 57.6 Rome Madrid 66.9 Madrid 63.6 Buenos Aires 55.6 Madrid Cairo N/A Beijing 63.1 Beijing 51.6 Beijing 55.3
21 AVERAGE ROOM RATE ( USD) Average Room Rate City Nov 2011 City 2010 City 2009 City Paris 335 New York 232 Dubai 235 Dubai Hong Kong 242 Tokyo 229 Paris 234 New York New York 241 Paris 226 Tokyo 229 Paris Dubai 220 Dubai 218 New York 215 Rome London 217 Hong Kong 205 Rome 193 London Rome 211 London 196 London 183 Tokyo Sydney 192 Rome 183 Hong Kong 168 Hong Kong Tokyo 164 Sydney 166 Buenos Aires 143 Sydney Buenos Aires 148 Buenos Aires 137 Sydney 137 Madrid Toronto 138 Cairo 133 Cairo 129 Buenos Aires Madrid 125 Toronto 130 Madrid 128 Beijing Los Angeles 124 Madrid 118 Toronto 115 Toronto Berlin 121 Los Angeles 116 Los Angeles 114 Cairo Beijing 101 Berlin 115 Berlin 112 Berlin Cairo N/A Beijing 94 Beijing 93 Los Angeles 128
22 REVENUE PER AVAILABLE ROOM (USD) RevPAR City Nov 2011 City 2010 City 2009 City Paris 267 New York 188 Paris 173 Dubai Hong Kong 202 Tokyo 179 New York 166 New York New York 196 Paris 172 Dubai 163 Paris London 181 Hong Kong 167 Tokyo 162 London Dubai 165 London 161 London 147 Tokyo Sydney 159 Dubai 154 Hong Kong 123 Hong Kong Rome 146 Sydney 139 Rome 121 Rome Tokyo 121 Rome 121 Sydney 107 Sydney Buenos Aires 99 Buenos Aires 91 Cairo 84 Buenos Aires Toronto 96 Toronto 89 Buenos Aires 79 Madrid Los Angeles 90 Cairo 86 Berlin 76 Cairo Berlin 85 Berlin 79 Madrid 74 Toronto Madrid 84 Los Angeles 79 Los Angeles 73 Los Angeles Beijing 69 Madrid 75 Toronto 72 Berlin Cairo N/A Beijing 59 Beijing 48 Beijing 83
23 Axis Title Aug-08 Oct-08 Dec-08 Feb-09 Apr-09 Jun-09 Aug-09 Oct-09 Dec-09 Feb-10 Apr-10 Jun-10 Aug-10 Oct-10 Dec-10 Feb-11 Apr-11 Jun-11 Aug-11 Oct-11 Dec-11 IMPACT OF CURRENCY FLUCTUATION 5% 0% -5% -10% -15% EUR -20% -25% GBP -30% Source: oanda.com historical rates (extracted on 02 Jun 2011)
24 ROOM SUPPLY PIPELINE
25 DUBAI HOTEL ESTABLISHMENT ROOM CAPACITY Indicators Establishments Current Rooms Under Construction Future Room Capacity Hotel Hotel & Hotel Apartment Hotel Apartments Total % change 4% 6% 7% 8% Hotel Rooms 40,981 43,419 51,115 53,227 14,917 69,775 Total Rooms/Flats (Units) Hotel Apartments Flats 15,618 18,068 19,840 21, ,949 Total 56,599 61,487 70,955 74,254 15,097 91,724 % change 9% 15% 21% 24%
 Hotel Apartments Flats 15,618 18,068")
26 DUBAI HOTEL ESTABLISHMENT ROOM CAPACITY Indicators Establishments Current Rooms Under Construction Future Room Capacity Hotel Hotel & Hotel Apartment Hotel Apartments Total % change 4% 6% 7% 8% Hotel Rooms 40,981 43,419 51,115 53,227 14,917 69,775 Total Rooms/Flats (Units) Hotel Apartments Flats 15,618 18,068 19,840 21, ,949 94% - 5 Star 6 % - 4 Star Total 56,599 61,487 70,955 74,254 15,097 91,724 % change 9% 15% 21% 24%
27 GLOBAL HOTEL ESTABLISHMENT ROOM SUPPLY (CURRENT) 17,500 74,254 Source: STR Global Market Pipeline Report
 15,097 Source: STR Global Market")
28 GLOBAL HOTEL ESTABLISHMENT ROOM SUPPLY (UNDER CONSTRUCTION) 15,097 Source: STR Global Market Pipeline Report
 27,746 91,724 Source: STR Global Market Pipeline")
29 GLOBAL HOTEL ESTABLISHMENT ROOM SUPPLY (COMBINED CURRENT & UNDER CONSTRUCTION) 27,746 91,724 Source: STR Global Market Pipeline Report
30 WORLD OUTBOUND
31 GLOBAL OUTBOUND TRAVELERS World Outbound Visitors ' Short Haul Short Haul % Medium Haul Medium Haul % Long Haul Long Haul % Inbound to Dubai Dubai Inbound MH & LH % 1 GERMANY 92,017 75, % 7, % 8, % % 2 UNITED KINGDOM 87,906 59, % 9, % 18, % % 3 UNITED STATES 87,043 24, % 23, % 38, % % 4 FRANCE 42,923 32, % 2, % 7, % % 5 CHINA 33,045 23, % 4, % 4, % % 6 NETHERLANDS 31,326 27, % % 3, % % 7 CANADA 30,673 20, % 1, % 9, % % 8 ITALY 29,778 25, % % 3, % % 9 JAPAN 26,237 2, % 10, % 13, % % 10 SINGAPORE 22,008 18, % 2, % % % 11 SPAIN 21,576 17, % % 2, % % 12 BELGIUM 20,025 18, % 1, % 1, % % 13 MEXICO 19,938 17, % % 1, % 6 0.3% 14 SWITZERLAND 19,160 17, % % 1, % % 15 KOREA, REPUBLIC OF 15,457 8, % 4, % 2, % % 16 TAIWAN 12,116 10, % % 1, % 3 0.2% 17 SWEDEN 11,565 8, % 1, % 1, % % 18 DENMARK 9,921 8, % % 1, % % 19 AUSTRIA 9,576 8, % % % % 20 INDIA 9,509 1, % 5, % 2, % % 21 IRELAND 8,890 7, % % 1, % % 22 UKRAINE 8, % 7, % % % 23 MALAYSIA 7,807 4, % 2, % % % 24 THAILAND 7,028 6, % % % % 25 FINLAND 6,858 3, % 2, % % % 26 NORWAY 6,709 4, % 1, % % % 27 SOUTH AFRICA 4,920 3, % % 1, % % Major Outbound Destinations 682, , % 94, % 129, % 3, % Major Outbound Destinations % 73% 39% Rest of the World 257,815 5,260 Rest of the World % 27% % World Outbound 940, , , ,000 8,600 % Change 6.7% 6.7% -3.8% Total of Medium & Long Haul Market Share from top 27 world outbound destinations to Dubai 3.8%
32 World Outbound Visitors ' Short Haul Short Haul % Medium Haul Medium Haul % Long Haul Long Haul % Inbound to Dubai Dubai Inbound MH & LH % 1 GERMANY 92,017 75, % 7, % 8, % % 2 UNITED KINGDOM 87,906 59, % 9, % 18, % % 3 UNITED STATES 87,043 24, % 23, % 38, % % 4 FRANCE 42,923 32, % 2, % 7, % % 5 CHINA 33,045 23, % 4, % 4, % % 6 NETHERLANDS 31,326 27, % % 3, % % 7 CANADA 30,673 20, % 1, % 9, % % 8 ITALY 29,778 25, % % 3, % % 9 JAPAN 26,237 2, % 10, % 13, % % 10 SINGAPORE 22,008 18, % 2, % % % 11 SPAIN 21,576 17, % % 2, % % 12 BELGIUM 20,025 18, % 1, % 1, % % 13 MEXICO 19,938 17, % % 1, % 6 0.3% 14 SWITZERLAND 19,160 17, % % 1, % % 15 KOREA, REPUBLIC OF 15,457 8, % 4, % 2, % % 16 TAIWAN 12,116 10, % % 1, % 3 0.2% 17 SWEDEN 11,565 8, % 1, % 1, % % 18 DENMARK 9,921 8, % % 1, % % 19 AUSTRIA 9,576 8, % % % % 20 INDIA 9,509 1, % 5, % 2, % % 21 IRELAND 8,890 7, % % 1, % % 22 UKRAINE 8, % 7, % % % 23 MALAYSIA 7,807 4, % 2, % % % 24 THAILAND 7,028 6, % % % % 25 FINLAND 6,858 3, % 2, % % % 26 NORWAY 6,709 4, % 1, % % % 27 SOUTH AFRICA 4,920 3, % % 1, % % Major Outbound Destinations 682, , % 94, % 129, % 3, % Major Outbound Destinations % 73% 39% Rest of the World 257,815 5,260 Rest of the World % 27% % World Outbound 940, , , ,000 8,600 % Change 6.7% 6.7% -3.8% Total of Medium & Long Haul Market Share from top 27 world outbound destinations to Dubai 3.8%
33 THANK YOU
INTERNATIONAL TRAVEL AND TOURISM
 INTERNATIONAL TRAVEL AND TOURISM YEAR 2014 1. INTRODUCTION This issue of the Economic and Social Indicators presents data on International Travel and Tourism for the year 2014. A brief on the compilation
Sprint Real Solutions VPN SDS International Rates from the U.S. Mainland, Hawaii, Puerto Rico, and the U.S. Virgin Islands 1*
 1* The international rates below apply to calls from the U.S. Mainland, Hawaii, Puerto Rico, and the U.S. Virgin Islands where available. The rates, which are shown below in full minute increments, are
KINGDOM OF CAMBODIA NATION RELIGION KING 3
 KINGDOM OF CAMBODIA NATION RELIGION KING 3 TOURISM STATISTICS REPORT March 2014 MINISTRY OF TOURISM Statistics and Tourism Information Department No. A3, Street 169, Sangkat Veal Vong, Khan 7 Makara, Phnom
KINGDOM OF CAMBODIA NATION RELIGION KING 3
 KINGDOM OF CAMBODIA NATION RELIGION KING 3 TOURISM STATISTICS REPORT June 2014 MINISTRY OF TOURISM Statistics and Tourism Information Department No. A3, Street 169, Sangkat Veal Vong, Khan 7 Makara, Phnom
SOUTHERN AFRICA TRAVEL AND TOURISM BAROMETER REPORT 2015
 SOUTHERN AFRICA TRAVEL AND TOURISM BAROMETER REPORT 2015 1 Contents 1. TOURISM TRENDS: GLOBAL AND SOUTHERN AFRICA S MARKET SHARE IN AFRICA... 4 1.1. TOURIST ARRIVALS... 4 1.1.1. Global Tourist Arrivals
MONTHLY NATURAL GAS SURVEY. November 2009
 MONTHLY NATURAL GAS SURVEY November 2009 INTERNATIONAL ENERGY AGENCY INTERNATIONAL ENERGY AGENCY Next Release: 12 March 2010 MONTHLY NATURAL GAS SURVEY - 1 CONTENTS TABLE 1 Natural Gas Balances in OECD
KINGDOM OF CAMBODIA NATION RELIGION KING 3
 KINGDOM OF CAMBODIA NATION RELIGION KING 3 TOURISM STATISTICS REPORT September 2014 MINISTRY OF TOURISM Statistics and Tourism Information Department No. A3, Street 169, Sangkat Veal Vong, Khan 7 Makara,
KINGDOM OF CAMBODIA NATION RELIGION KING 3
 KINGDOM OF CAMBODIA NATION RELIGION KING 3 TOURISM STATISTICS REPORT October 2015 MINISTRY OF TOURISM Statistics and Tourism Information Department No. A3, Street 169, Sangkat Veal Vong, Khan 7 Makara,
Country (A - C) Local Number Toll-Free Premium Rates
 Local Number Toll-Free Premium Rates") Choose a number from the provided list based on the country that you re calling from. Numbers with Premium Rates are only available to Enterprise Groups that are subscribed to the BlueJeans Premium Calling
Choose a number from the provided list based on the country that you re calling from. Numbers with Premium Rates are only available to Enterprise Groups that are subscribed to the BlueJeans Premium Calling
EXPORT PERFORMANCE MONITOR
 India s Exports Recorded High Growth Provisional figures available for April, 2007 show that India s merchandise exports during April 2007 are valued at US $ 10575.11 million ($ 10.57 billion) which is
IMD World Talent Report Factor 1 : Investment and Development
 THAILAND 2012 2013 2014 2015 2016 Overall Investment & Development Appeal Rank 2016 37 42 24 Readiness 49 of 61 Factor 1 : Investment and Development Total Public Expenditure on Education Percentage of
FINLAND. Table 1. FDI flows in the host economy, by geographical origin. (Millions of US dollars)
") Table 1. FDI flows in the host economy, by geographical origin World 3 732 8 046 3 319 2 823 4 750 7 652 12 451-1 144 718 7 359 2 550 4 158 Developed economies 3 638 8 003 2 382 2 863 4 934 7 258 12 450-855
Table 1. FDI flows in the host economy, by geographical origin World 3 732 8 046 3 319 2 823 4 750 7 652 12 451-1 144 718 7 359 2 550 4 158 Developed economies 3 638 8 003 2 382 2 863 4 934 7 258 12 450-855
Pistachio Industry Inventory Shipment Report Pounds Crop Year
 Pistachio Industry Inventory Shipment Report Pounds March 2017 Year to Date Summary - Pounds 2016-2017 Crop Year Open Inshell AO Closed Shell Shelling Stock Total 8/31/16 Carryover 46,956,408 41,224,713
Tourism Snapshot A focus on the markets in which the CTC and its partners are active
 Tourism Snapshot A focus on the markets in which the CTC and its partners are active www.canada.travel/corporate January 214 Volume 1, Issue 1 Key highlights Total arrivals from CTC s international markets
Sprint Real Solutions Switched Data Service International Rates from the U.S. Mainland, Hawaii, Puerto Rico, and the U.S.
 1* The international rates below apply to calls from the U.S. Mainland, Hawaii, Puerto Rico, and the U.S. Virgin Islands. The usage rates below reflex the discount found in Section 6.4 of Schedule No.
PATA Strategic Intelligence Centre. Tsunami Recovery Update. Wednesday June 22, 2005
 PATA Strategic Intelligence Centre Tsunami Recovery Update Wednesday June 22, 2005 Page 1 of 6 Y-T-D Inbound (Source: Relevant NTOs, Airport Authorities) Year Destination Period 2004 2005 Change The Americas
Sprint Real Solutions Switched Data Service International Rates from the U.S. Mainland, Hawaii, Puerto Rico, and the U.S.
 1* The international rates below apply to calls from the U.S. Mainland, Hawaii, Puerto Rico, and the U.S. Virgin Islands. The usage rates below reflex the discount found in Section 6.4 of Schedule No.
The Nordic Countries in an International Comparison. Helga Kristjánsdóttir 20. apríl 2012
 The Nordic Countries in an International Comparison Helga Kristjánsdóttir 20. apríl 2012 15 Figure 1. World Bank, GDP growth (annual %) 10 5 0 1961 1963 1965 1967 1969 1971 1973 1975 1977 1979 1981 1983
Summer Work Travel Season Program Dates by Country
 The program dates are windows of opportunity for program participation. Within this timeframe, students are still subject to their university's official academic break schedule. Even though the window
SLOVAKIA. Table 1. FDI flows in the host economy, by geographical origin. (Millions of US dollars)
") Table 1. FDI flows in the host economy, by geographical origin World 1 271 4 095 1 060 1 058 714 4 693 3 267 4 692-6 1 769 3 491 2 825 Developed economies 1 204 4 050 1 036 1 113 485 4 265 1 001 5 084-881
Table 1. FDI flows in the host economy, by geographical origin World 1 271 4 095 1 060 1 058 714 4 693 3 267 4 692-6 1 769 3 491 2 825 Developed economies 1 204 4 050 1 036 1 113 485 4 265 1 001 5 084-881
Summer Work Travel Season Program Dates by Country
 Albania 1-Jul 30-Sep 3 Months Argentina 1-Dec 1-Apr 4 Months Armenia 1-Jun 31-Aug 3 Months Australia 15-Nov 8-Mar 3.5 Months Visa Waiver Country Austria 1-Jul 30-Sep 3 Months Visa Waiver Country Azerbaijan
Tourism Snapshot A focus on the markets in which the CTC and its partners are active
 Tourism Snapshot A focus on the markets in which the CTC and its partners are active www.canada.travel/corporate June Volume 1, Issue 6 Key highlights CTC s overseas markets leaped 1% over the same month
Latest Tourism Trends. Humphrey Walwyn Head of VisitEngland Research
 Latest Tourism Trends Humphrey Walwyn Head of VisitEngland Research 1 Inbound Tourism 2 2003 2004 2005 2006 2007 2008 2009 2010 2011 2012 2013 2014 2015 2016 2017 UK inbound long term trend Spend per visit
Global travel patterns: an overview
 Journal of Travel Medicine, 2017, 1 5 doi: 10.1093/jtm/tax007 Perspective Perspective Global travel patterns: an overview Dirk Glaesser*, John Kester, Hanna Paulose, Abbas Alizadeh, and Birka Valentin
ROMANIA. Table 1. FDI flows in the host economy, by geographical origin. (Millions of US dollars)
") Table 1. FDI flows in the host economy, by geographical origin World.... 2 196 6 435 6 485 11 333 9 928 13 910 4 843 2 939 2 522 2 746 Developed economies.... 1 521 5 361 6 309 11 445 9 136 13 422 4 812
Table 1. FDI flows in the host economy, by geographical origin World.... 2 196 6 435 6 485 11 333 9 928 13 910 4 843 2 939 2 522 2 746 Developed economies.... 1 521 5 361 6 309 11 445 9 136 13 422 4 812
78 MILLION 150, domains in 28 languages LARGEST TRAVEL SIT E IN THE WORLD MIL LION.
 1 # LARGEST TRAVEL SIT E IN THE WORLD 225 MIL LION reviews & opinions 340 unique visitors a month businesses listed * MILLION 4.9 MILLION 78 MILLION members 150,000+ destinations 139 user contributions
Intra-African Air Services Liberalization
 Intra-African Air Services Liberalization James Wiltshire Senior Economist, www.iata.org/economics To represent, lead and serve the airline industry Aviation connects African businesses to world markets
ENGAGING ALUMNI WORLDWIDE
 ENGAGING ALUMNI WORLDWIDE COLUMBIA GLOBAL CENTERS and COLUMBIA ALUMNI ASSOCIATION Columbia University Senate Feb. 27, 2015 Mission Statement: Columbia Global Centers Columbia Global Centers promote and
Summer Work Travel Season Program Dates by Country
 The program dates are windows of opportunity for program participation. Within this timeframe, students are still subject to their university's official academic break schedule. Even though the window
Post Show Report. The 19th China International Pet Show (CIPS 2015) National Exhibition and Convention Center (Shanghai)
 National Exhibition and Convention Center (Shanghai)") 2015.11.4-7 National Exhibition and Convention Center (Shanghai) The 19th China International Pet Show (CIPS 2015) China Great Wall International Exhibition Co. Ltd. November 2015 Content OVERVIEW... 1
2015.11.4-7 National Exhibition and Convention Center (Shanghai) The 19th China International Pet Show (CIPS 2015) China Great Wall International Exhibition Co. Ltd. November 2015 Content OVERVIEW... 1
INTERNATIONAL TRAVEL AND TOURISM
 INTERNATIONAL TRAVEL AND TOURISM YEAR 2017 1. INTRODUCTION This issue of the Economic and Social Indicators presents data on International Travel and Tourism for the year 2017. A brief on the compilation
Sprint Real Solutions Option A SDS International Outbound Rates from the U.S. Mainland, Hawaii, Puerto Rico, and the U.S.
 1* The international rates below apply to calls from the U.S. Mainland, Hawaii, Puerto Rico, and the U.S. Virgin Islands. For additional termination poinst for some countries, see International Termination
Global Travel Trends 2005
 Preliminary World Travel Monitor Results from IPK international for the ITB Berlin Message, 03/10/06 Global Travel Trends 2005 Based on the new data from the 2005 World Travel Monitor, and as it does every
Base Commission To all destinations 0%
 Commissions Offshore/Transborder Ticketing American Airlines does not pay base commission for tickets issued by travel agents on itineraries originating within the territory of the United States, including
Effective for all tickets issued where American validation is used. IATA-approved locations classified by American as full service.
 Commissions Base Commission Rates Agencies Located in 50 U.S, Puerto Rico, U.S. Virgin Islands and Canada Agencies Located Outside the 50 U.S., Puerto Rico, U.S. Virgin Islands and Canada Offshore/Trans-border
Summer Work Travel 2019 Season Program Dates by Country For External Use - Updated 11/13/2018
 The program dates are windows of opportunity for program participation. Within this timeframe, students are still subject to their university's official academic break schedule. Even though the window
Call Type PAYU1 PAYU2 PAYU3 Out Of Bundle
 Jan-18 Mobile Tariff Information Headline Rates Call Type PAYU1 PAYU2 PAYU3 Out Of Bundle Calls to Own Mobiles 1p 1p 1p 1p Calls to Own Landlines 1p 1p 1p 1p Calls to UK Landlines (Starting 01, 02, 03)
America 6% Russia 12%
 TOURISM IS A GROWING SOURCE OF EXPORT REVENUE AND A SIGNIFICANT EMPLOYMENT PROVIDER IN FINLAND TOURISM HAS A MULTIPLIER EFFECT ON OTHER SECTORS. 1 EURO IN TOURISM ADDS 56 CENTS VALUE TO THE OTHER SECTORS.
Tourism In the Maldives
 Tourism In the Maldives Content 1. Introduction 2. Maldives as a Tourist Destination (Sustainable Development Policies) 3. Marketing and Promotion 4. Tourism Sector Performance 1. INTRODUCTION The island
Finding Rationality in an Irrational World: The Economics of Successful Hotel Negotiations
 Finding Rationality in an Irrational World: The Economics of Successful Hotel Negotiations Isaac Collazo, Vice President, Performance Strategy & Planning, InterContinental Hotels Group (IHG) Maria Lowry,
INTERNATIONAL TRAVEL AND TOURISM
 INTERNATIONAL TRAVEL AND TOURISM JANUARY TO SEPTEMBER 2017 1. INTRODUCTION This issue of the Economic and Social Indicators presents data on International Travel and Tourism for the first nine months of
Outlook for International Inbound Travel to North America - The International Marketplace: What's Happening?
 University of Massachusetts Amherst ScholarWorks@UMass Amherst Tourism Travel and Research Association: Advancing Tourism Research Globally 2014 Marketing Outlook Forum - Outlook for 2015 Outlook for International
Tourism Snapshot. June 2015 Volume 11, Issue 6. A focus on the markets in which Destination Canada (DC) and its partners are active.
 and its partners are active.") Tourism Snapshot Tourism PEI / Paul Baglole A focus on the markets in which Destination Canada (DC) and its partners are active. www.destinationcanada.com June Volume 11, Issue 6 Key highlights Over the
Tourism Snapshot Tourism PEI / Paul Baglole A focus on the markets in which Destination Canada (DC) and its partners are active. www.destinationcanada.com June Volume 11, Issue 6 Key highlights Over the
Performance Derby: MSCI Share Price Indexes
 Performance Derby: MSCI Share Price Indexes January 5, 2018 Dr. Ed Yardeni 516-972-7683 eyardeni@yardeni.com Joe Abbott 732-497-5306 jabbott@yardeni.com Please visit our sites at blog.yardeni.com thinking
TripAdvisor Workshop Christchurch 7 June 2016
 TripAdvisor Workshop Christchurch 7 June 2016 TripAdvisor: The World s Largest Travel Site 1 M I L L I O N Reviews & Opinions 3402005 MILLION 2000 Unique visitors a month M I L L I O N 350 r e vie w s
1.0 Introduction Zambia s Major Trading Partners Zambia s Major Export Markets... 4
 Bank of Zambia CONTENTS 1.0 Introduction... 3 2.0 Zambia s Major Trading Partners... 3 3.0 Zambia s Major Export Markets... 4 4.0 Major Source Countries Of Zambia s Imports... 5 5.0 Direction Of Trade
GODINA XI SARAJEVO, BROJ 2 TOURISM STATISTICS. Tourism in BIH, February 2017
 number of nights GODINA XI SARAJEVO, 06.04.2017. BROJ 2 TOURISM STATISTICS Tourism in BIH, February 2017 In February 2017 tourists realised 56,042 tourist arrivals in Bosnia and Hercegovina which represent
VISIT MALAYSIA YEAR. Successful Promotion: UNWTO CONFERENCE MAINSTREAMING TOURISM IN THE MEDIA. Datuk Dr. Victor Wee Chairman, Tourism Malaysia
 UNWTO CONFERENCE MAINSTREAMING TOURISM IN THE MEDIA Successful Promotion: VISIT MALAYSIA YEAR 2007 Datuk Dr. Victor Wee Chairman, Tourism Malaysia 24 March 2011, Colombo, Sri Lanka WHY VISIT MALAYSIA YEAR
Japan 3% Foreign overnight stays 31% Domestic overnight stays 69% 8.3 MILLION FOREIGN VISITORS IN FINLAND IN 2017
 TOURISM IS A GROWING SOURCE OF EXPORT REVENUE AND A SIGNIFICANT EMPLOYMENT PROVIDER IN FINLAND TOURISM HAS A MULTIPLIER EFFECT ON OTHER SECTORS. 1 EURO IN TOURISM ADDS 56 CENTS VALUE TO THE OTHER SECTORS.
An overview of Tallinn tourism trends
 An overview of Tallinn tourism trends August 2015 The data is collected from Statistics Estonia, Tallinn Airport and Port of Tallinn. In August 2015, 179,338 stayed overnight in Tallinn s accommodation
Unit Standard Level: 2 Credit: 4 Version: 2
 Unit Standard 24729 Level: 2 Credit: 4 Version: 2 Demonstrate knowledge of world tourist destinations School: Student Name: Date of Assessment: ATTTO Unit Standard 3727 ATTTO Setting the standard for training
Performance Derby: MSCI Regions/Countries Earnings & Revenues Growth 2018E / 2017E / 2016A
 Performance Derby: MSCI Regions/Countries Earnings & Revenues Growth 2018E / 2017E / 2016A December 6, 2017 Dr. Ed Yardeni 516-972-7683 eyardeni@yardeni.com Joe Abbott 732-497-5306 jabbott@yardeni.com
Tourism Snapshot. A focus on the markets in which the CTC and its partners are active. February 2015 Volume 11, Issue 2.
 Tourism Snapshot Tourism Whistler/Mike Crane A focus on the markets in which the CTC and its partners are active www.canada.travel/corporate February Volume 11, Issue 2 Key highlights The strong beginning
China 17% Foreign overnight stays 31% Domestic overnight stays 69% 8.3 MILLION FOREIGN VISITORS IN FINLAND IN 2017
 TOURISM IS A GROWING SOURCE OF EXPORT REVENUE AND A SIGNIFICANT EMPLOYMENT PROVIDER IN FINLAND TOURISM HAS A MULTIPLIER EFFECT ON OTHER SECTORS. 1 EURO IN TOURISM ADDS 56 CENTS VALUE TO THE OTHER SECTORS.
ICCA & the International Association Meetings ICCA-JNTO-JTA Bid Workshop 2013
 ICCA & the International Association Meetings ICCA-JNTO-JTA Bid Workshop 2013 Asia continues to be one of the most dynamic meetings regions in the world, and has continued to grow and develop throughout
Animal products; badger hair and other brush making hair and waste of such bristles or hair, n.e.c. in heading no (excluding horsehair)
") Page 1 05021000 Animal products; hair or bristles, of pigs, hogs or boars, and waste thereof Qty2=KGM Qty1=KG Value=NZ$ UNITED KINGDOM 2 3 378 SAMOA 20 20 131 ALL COUNTRIES TOTAL 22 23 509 05029000 Animal
Page 1 05021000 Animal products; hair or bristles, of pigs, hogs or boars, and waste thereof Qty2=KGM Qty1=KG Value=NZ$ UNITED KINGDOM 2 3 378 SAMOA 20 20 131 ALL COUNTRIES TOTAL 22 23 509 05029000 Animal
COUNTRY & TERRITORY PROFILES A Summary of Oil Spill Response Arrangements & Resources Worldwide
 3. COUNTRY & TERRITORY PROFILES (including date of update) A Albania August 2010 Antigua January 2009 Algeria May 2011 Argentina December 2015 Angola May 2009 Aruba April 2008 Anguilla November 2005 Australia
MGTA Ocean Freight. January 21, 2016
 MGTA Ocean Freight January 21, 2016 Brief History History 1848: Pacific Mail Steamship Company is founded; the company is given a ten-year government contract to deliver mail between Panama and Oregon;
5.3. Cannabis: Wholesale and Street Prices and Purity Levels
 5. Prices: Cannabis 5.3. Cannabis: Wholesale and Street Prices and Purity Levels HERBAL CANNABIS Africa East Africa Ghana 51.0 39.2-62.7 1999 Kenya 0.2 0.1-0.3-2002 119.8-1996 Madagascar 1.3 1.1-1.4 100.0
AFTA Travel Trends. June 2017
 AFTA Travel Trends June 2017 AFTA Travel Trends Report 2017 Inbound and Outbound overview Introduction This snapshot provides an overview of the balance of trade between Inbound and Outbound Travel for
CROATIA. Table 1. FDI flows in the host economy, by geographical origin. (Millions of US dollars)
") Table 1. FDI flows in the host economy, by geographical origin World 1 307 1 153 2 107 1 210 1 844 3 228 4 928 5 941 3 566 515 1 511 1 370 Developed economies 1 207 1 113 1 719 1 190 1 885 3 093 4 775
Table 1. FDI flows in the host economy, by geographical origin World 1 307 1 153 2 107 1 210 1 844 3 228 4 928 5 941 3 566 515 1 511 1 370 Developed economies 1 207 1 113 1 719 1 190 1 885 3 093 4 775
The W20. The 20 wealthiest countries in the world. Publication Date: October 2015 NEW WORLD WEALTH
 The W20 The 20 wealthiest countries in the world Publication Date: October 2015 W20 wealth rankings The following tables ranks the top 20 countries in the world by total individual wealth held. Total individual
Tourist arrivals and overnight stays in collective accommodation 1 July 2017 (p)
") Jul-16 Aug-16 Sep-16 Oct-16 Nov-16 Dec-16 Jan-17 Feb-17 Mar-17 Apr-17 May-17 Jun-17 Jul-17 MONTENEGRO STATISTICAL OFFICE R E L E A S E No: 158 Podgorica, 31 August 2017 When using the data please name
Jul-16 Aug-16 Sep-16 Oct-16 Nov-16 Dec-16 Jan-17 Feb-17 Mar-17 Apr-17 May-17 Jun-17 Jul-17 MONTENEGRO STATISTICAL OFFICE R E L E A S E No: 158 Podgorica, 31 August 2017 When using the data please name
Asian stopovers in Nordic countries Optimistic perspectives. March 2018
 Asian stopovers in Nordic countries Optimistic perspectives March 2018 OUR COMMITMENT IS TO HAVE THE MOST PRECISE, UP-TO-DATE MARKETDATA ON TRAVELLERS JOURNEYS 30.238.647 Travellers monitored each day
TOURISM STATISTICS ANNUAL REPORT 2012
 TOURISM STATISTICS ANNUAL REPORT 2012 Published by Statistics Botswana, Private Bag 0024, Gaborone Tel: (267) 3934968 Fax: (267) 3952201/3935628 Email: info@statsbots.org.bw Website: www.cso.gov.bw February
REPUBLIC OF KOREA. Table 1. FDI flows in the host economy, by geographical origin. (Millions of US dollars)
") Table 1. FDI flows in the host economy, by geographical origin World 4 130 3 395 4 383 8 980 7 050 4 950 2 629 8 409 7 501 8 117 10 247 11 117 Developed economies 3 123 2 385 2 949 7 185 5 743 3 423-275
Table 1. FDI flows in the host economy, by geographical origin World 4 130 3 395 4 383 8 980 7 050 4 950 2 629 8 409 7 501 8 117 10 247 11 117 Developed economies 3 123 2 385 2 949 7 185 5 743 3 423-275
IATA ECONOMIC BRIEFING MARCH 2011
 IATA ECONOMIC BRIEFING MARCH 2011 WHAT DRIVES THE SIZE OF PREMIUM AIR TRAVEL MARKETS? WHY PREMIUM AIR TRAVEL IS AN IMPORTANT TRAVEL MARKET SEGMENT The premium (first and business class) travel segment
1.4: Premium Air Travel: An Important Market Segment
 CHAPTER 1.4 Premium Air Travel: An Important Market Segment SELIM ACH BRIAN PEARCE International Air Transport Association (IATA) The premium (first and business class) travel segment is an important market,
DOMESTIC AND FOREIGN DIRECT INVESTMENT REALIZATION IN QUARTER I 2018
 DOMESTIC AND FOREIGN DIRECT INVESTMENT REALIZATION IN QUARTER I 2018 Jakarta, 30 th April 2018 Indonesia Investment Coordinating Board LIST OF CONTENTS I. QUARTER I 2018: In Comparison with 2017 II. QUARTER
Tourism Snapshot A focus on the markets in which the CTC and its partners are active
 Tourism Snapshot A focus on the markets in which the CTC and its partners are active www.canada.travel/corporate May Volume 1, Issue 5 Key highlights Total arrivals from CTC s international markets improved
BADGER HAIR AND OTHER BRUSH-MAKING HAIR AND WASTE THEREOF
 Page 1 05021000 PIGS', HOGS' OR BOARS' BRISTLES AND HAIR AND WASTE THEREOF NETHERLANDS - 11,400 101,140 ALL COUNTRIES TOTAL 0 11,400 101,140 05029000 BADGER HAIR AND OTHER BRUSH-MAKING HAIR AND WASTE THEREOF
Tourism Towards 2030 Preview of findings
 Tourism Towards 23 Preview of findings 54th meeting of the UNWTO Commission for the Americas 11 September 212 Quito, Ecuador Carlos Vogeler Regional Director for the Americas World Tourism Organization
Steve Smith Director Cargo Supply Chain Management
 IATA e-freight project status Steve Smith Director Cargo Supply Chain Management Contents 1. Introduction: Vision and Board Mandate 2. Current Performance 3. 2010 progress to increasing e-freight capability:
Russia 12% Russia 24% Foreign overnight stays 31% Domestic overnight stays 69% 8.3 MILLION FOREIGN VISITORS IN FINLAND IN 2017
 TOURISM IS A GROWING SOURCE OF EXPORT REVENUE AND A SIGNIFICANT EMPLOYMENT PROVIDER IN FINLAND TOURISM HAS A MULTIPLIER EFFECT ON OTHER SECTORS. 1 EURO IN TOURISM ADDS 56 CENTS VALUE TO THE OTHER SECTORS.
Recovery Now! ANZPHIC 2010 Sydney - July 8, Hotel Performance Back On Track
 Recovery Now! Hotel Performance Back On Track ANZPHIC 2010 Sydney - July 8, 2010. STR Global Ltd is the exclusive owner of all rights in this presentation and its content. Reproduction of all or a portion
Tourism Snapshot A focus on the markets in which the CTC and its partners are active
 Tourism Snapshot A focus on the markets in which the CTC and its partners are active www.canada.travel/corporate April Volume 1, Issue 4 Key highlights Total arrivals from CTC s international markets improved
Commercial Development Update MetroTex Forecast
 Commercial Development Update 10.5.18 John Terrell Vice President Commercial Development Dallas Fort Worth International Airport 1 Texas: #1 in Economic Climate CNBC Best State For Business 2018 Chief
WORLD PRESS FREEDOM INDEX 2012
 WORLD PRESS FREEDOM INDEX 2012 1 Finland -10,00 = - Norway -10,00 = 3 Estonia -9,00 - Netherlands -9,00 5 Austria -8,00 6 Iceland -7,00 - Luxembourg -7,00 8 Switzerland -6,20 9 Cape Verde -6,00 10 Canada
FACTS & FIGURES ISE 2016
 FACTS & FIGURES ISE 2016 The first four-day Integrated Systems Europe exhibition was an unqualified success. In drawing over 65,000 registered attendees to interact with over 1,100 exhibitors it officially
Tourism Trends, Outlook and Issues. John G.C. Kester. 6th UNWTO/PATA Forum on Tourism Trends and Outlook. Guilin, China October 2012 day 1
 Tourism Trends, Outlook and Issues 6th UNWTO/PATA Forum on Tourism Trends and Outlook Guilin, China 11-13 October 212 day 1 John G.C. Kester Programme Manager, Tourism Trends and Marketing Strategies World
INTERNATIONAL REGISTRY IN ORGAN DONATION and TRANSPLANTATION
 INTERNATIONAL REGISTRY IN ORGAN DONATION and TRANSPLANTATION www.irodat.org Final Numbers 2016 December 2017 Dear colleagues On behalf of all IRODaT staff, we are glad to present the 2016 final numbers
1.0 Introduction Zambia s Major Trading Partners Zambia s Major Export Markets... 4
 Bank of Zambia CONTENTS 1.0 Introduction... 3 2.0 Zambia s Major Trading Partners... 3 3.0 Zambia s Major Export Markets... 4 4.0 Major Source Countries Of Zambia s Imports... 5 5.0 Direction Of Trade
Survey on arrivals and overnight stays of tourists, total 2017
 MONTENEGRO STATISTICAL OFFICE R E L E A S E No: 34/2 Podgorica, 1 June 2018 When using the data please name the source Survey on arrivals and overnight stays of tourists, total In Montenegro, in, tourist
GBTA BTI Outlook and Economic Forecast for Business Travel in Asia Pacific, Thailand and around the World
 GBTA BTI Outlook and Economic Forecast for Business Travel in Asia Pacific, Thailand and around the World Research Sponsored by: Welf J Ebeling Vice President, Operations - Asia Pacific Global Business
Tourism Snapshot A focus on the markets that the CTC and its partners are active in
 Tourism Snapshot A focus on the markets that the CTC and its partners are active in Nahanni National Park, NWT www.canada.travel/corporate February 2012 Volume 8, Issue 2 Key highlights Following through
Global robot installations: high double digit growth rates
 ' of units Global robot installations: high double digit growth rates 5 45 4 35 3 25 2 15 1 5 113 6 Estimated annual worldwide supply of industrial robots 28-216 and 217-22* +15% on average per year 121
Tourism Snapshot A focus on the markets that the CTC and its partners are active in
 Tourism Snapshot A focus on the markets that the CTC and its partners are active in www.canada.travel/corporate February 2011 Volume 7, Issue 2 Key highlights In the first two months of 2011 overnight
Press Information. Post Show Report
 Press Information Post Show Report Date: October 11 (Wed.) - 13 (Fri.), 2017 Venue: Makuhari Messe, Japan Organiser: Reed Exhibitions Japan Ltd. Co-organiser: Japan External Trade Organization (JETRO)
State of Global Air Transport and ICAO Forecasts for Effective Planning. Economic Development Air Transport Bureau ICAO
 State of Global Air Transport and ICAO Forecasts for Effective Planning Economic Development Air Transport Bureau ICAO State of Air Transport Industry in 2016 Growth of air transport Revenue Passenger-Kilometres
EUROPEAN CENTRE FOR DISEASE PREVENTION AND CONTROLInfluenza A(H1N1)v
v") Table 1: Reported new confirmed cases and cumulative number of influenza A(H1N1)v and cumulative deaths among confirmed cases by country as of August, 1: hours (CEST) in the EU and EFTA countries Confirmed
Table 1: Reported new confirmed cases and cumulative number of influenza A(H1N1)v and cumulative deaths among confirmed cases by country as of August, 1: hours (CEST) in the EU and EFTA countries Confirmed
AFTA Travel Trends. July 2017
 AFTA Travel Trends July 2017 AFTA Travel Trends Report 2017 Inbound and Outbound overview Introduction This snapshot provides an overview of the balance of trade between Inbound and Outbound Travel for
TOOLS, TOOL BODIES, TOOL HANDLES, BROOM OR BRUSH BODIES AND HANDLES, OF WOOD; BOOT OR SHOE LASTS AND TREES OF WOOD
 Page 1 05029000 BADGER HAIR AND OTHER BRUSH-MAKING HAIR AND WASTE THEREOF Qty2= Qty1=KG Value=HKD THE MAINLAND OF CHINA - 58,349 73,579,151 ALL COUNTRIES TOTAL 0 58,349 73,579,151 44170000 TOOLS, TOOL
1.0 Introduction Zambia s Major Trading Partners Zambia s Major Export Markets... 4
 Bank of Zambia CONTENTS 1.0 Introduction... 3 2.0 Zambia s Major Trading Partners... 3 3.0 Zambia s Major Export Markets... 4 4.0 Major Source Countries Of Zambia s Imports... 5 5.0 Direction Of Trade
% change vs. Dec ALL VISITS (000) 2,410 12% 7,550 5% 31,148 1% Spend ( million) 1,490 15% 4,370-1% 18,710 4%
 2,410 12% 7,550 5% 31,148 1% Spend ( million) 1,490 15% 4,370-1% 18,710 4%") HEADLINES FULL YEAR 2012 (PROVISIONAL) 1 Overall visits 31.148 million visits making 2012 the best year for inbound tourism since 2008 but not a record. 1% increase in visits on 2011 (30.798 visits) slightly
HEADLINES FULL YEAR 2012 (PROVISIONAL) 1 Overall visits 31.148 million visits making 2012 the best year for inbound tourism since 2008 but not a record. 1% increase in visits on 2011 (30.798 visits) slightly
Monthly Hotel Establishment Report
 Monthly Hotel Establishment Report 201 Page: 1 of 15 Abu Dhabi Emitare Rooms Summary Hotel Establishments Hotels & Apartments Rooms (Total Share % 167 29,688 100% Hotels 109 23,063 78% 5 Star 39 10,785
Central Bank of Different Countries
 Country name Afghanistan Albania Algeria Argentina Armenia Aruba Australia Austria Azerbaijan Bahamas Bahrain Bangladesh Barbados Belarus Belgium Belize Benin Bermuda Bhutan Bolivia Bosnia Botswana Brazil
Anuga 2017 in figures
 Press Release No. 10 / hac / September 2017, Cologne Anuga 2017 in figures Participation from home and abroad Exhibitors Domestic participation 716 Foreign participation 6,689 Total 7,405 The companies
Outlook for air travel markets
 Outlook for air travel markets June 2016 Brian Pearce Chief Economist International Air Transport Association Extended period of strong air travel market growth 30% 25% 20% 15% 10% 5% 0% -5% -10% -15%