River to Sea Transportation Planning Organization
|
|
|
- Stella Brown
- 5 years ago
- Views:
Transcription
1
2


3 River to Sea Transportation Planning Organization Sea Level Rise Vulnerability Assessment July 2016 Prepared by:
4
5 Contents I. Background... 1 II. Vulnerability Analysis and Data Disclaimer... 3 III. Methodology... 3 IV. Vulnerability Analysis... 5 Designated Evacuation Routes... 5 Major Roadway Network Scenic Byways Railroads Facilities Sidewalks and Trails V. Stormwater Storage Impacts VI. Next Steps Appendix... 27
6 I. Background Conditions resulting from climate change have included higher temperatures, increased precipitation and/or severe drought, and an overall rise in sea level around the world. Scientific research indicates sea levels worldwide have been rising at a rate of 0.14 inches (3.5 millimeters) per year since the early 1990s ( It is becoming increasingly clear that this rise in sea level will result in higher tides, increased saltwater intrusion and more severe storm surges causing more extensive and frequent coastal flooding. Mean elevation for the State of Florida is approximately 100 feet above sea level with the highest point registering at only 345 feet above sea level. In Volusia County, the highest natural point of elevation is 120 feet above sea level and the highest point in Flagler County is recorded at 58 feet above sea level. As sea level rise continues, it is becoming of critical importance to understand the potential vulnerability of flooding on transportation infrastructure, specifically those facilities located in low-lying coastal areas. The purpose of a vulnerability analysis is to provide a preliminary examination of potential sea level rise, erosion, and coastal flooding impacts. Increased flooding of transportation infrastructure due to tidal activity and heavy rainfall can result in: Loss of roadway capacity due to flooding and erosion Interruptions to evacuation routes when they are most needed Degradation of transportation infrastructure Loss of access to/utilization of facilities (fleet fueling/storage; evacuation centers, etc.) Insufficient stormwater storage (ponds and groundwater) Malfunctioning canals and drainage By taking a risk-based approach and identifying vulnerable facilities the River to Sea Transportation Planning Organization (R2CTPO) can implement adaptation practices overtime that will protect these facilities and minimize impacts on mobility. The Federal Highway Administration (FHWA) identifies four strategies for adapting to climate change: Know your vulnerabilities Use the transportation planning process Incorporate climate risks in engineering design; and Enhance operations, maintenance, and emergency preparedness. In addition, recent directives include: Executive Order Preparing the United States for the Impact of Climate Change November 2013 Fixing America s Surface Transportation (FAST) Act: expands the focus on the resiliency of the transportation system as well as activities to reduce stormwater runoff from transportation infrastructure; and requires strategies to reduce the vulnerability of existing transportation infrastructure to natural disasters. [23 U.S.C. 134(d)(3) & (i)(2)(g)] Florida Statutes, Section Coastal management strategies, etc., flood, Community Rating System (CRS), etc. With this new law, Florida Statute section (2)(f)1. now includes sea-level rise as one of the causes of flood risk that must be addressed in the redevelopment principles, strategies, and engineering solutions to reduce flood risk. 1


, Given the range of uncertainty in future global sea level rise (SLR), using multiple scenarios encourages experts and")

 also notes that analysts should consider what higher rates of sea level rise may have on design alternatives, risk and others.")

7 R2CTPO Sea Level Rise Vulnerability Assessment Figure 1: Comparison between NOAA and USACE Projection Rate Curves NOAA High Rate USACE High Rate NOAA Int High Rate NOAA Int Low Rate/USACE Int Rate NOAA Low Rate/USACE Low Rate The sea level rise scenarioss considered in this report represent an effort to respond to these directives. They re based on current conditions and doo not include projections of erosion, detailed hydrologic connectivity, storm surge or precipitation. This work simply provides a preliminary consideration of exposure and identifies a subset of infrastructure within the metropolitan planning area that is most vulnerable. These findings help direct our attentionn toward areas and assets that require more in-depth research, study of alternatives, and engineering analysis. It is important to use these results to begin further analysis because planning and programming takes time and coordination. Advanced planning will be effective for avoiding potential costs in the future. According to the National Oceanicc and Atmospheric Administration (NOAA), Given the range of uncertainty in future global sea level rise (SLR), using multiple scenarios encourages experts and decision makers to consider multiple future conditions and to develop multiple response options. Scenario planning offers an opportunity to initiate actionss now that may reducee future impacts and vulnerabilities. Thus, specific probabilities or likelihoods aree not assigned to individual scenarios in this report, and none of these scenarios should be used in isolation. U.S. Army Corps of Engineers (USACE) also notes that analysts should consider what higher rates of sea level rise may have on design alternatives, risk and others. NOAA also states that the Agency has a very high confidence (greater than 9 in 10 chances) that global mean sea level will rise at least 8 inches but no more than 6.6 feet by The parameters associated with the NOAA rate curves are found below. ( THE LOWEST SEA LEVEL CHANGE SCENARIO IS BASED ON HISTORIC RATES OF OBSERVED SEA LEVEL CHANGE. THIS SCENARIO SHOULD BE CONSIDERED WHERE THEREE IS A HIGH TOLERANCE FOR RISK PROJECTS WITH A SHORT LIFESPAN OR FLEXIBILITY TO ADAPT WITHIN THE NEAR-TERM) (E.G. P THE INTERMEDIATE-LOW SCENARIO IS BASED ON PROJECTED OCEAN WARMING THE INTERMEDIATE-HIGH SCENARIO IS BASED ON PROJECTED OCEAN WARMING AND RECENT ICE SHEET LOSS THE HIGHEST SEA LEVEL CHANGE SCENARIO REFLECTS OCEAN WARMING AND THE MAXIMUM PLAUSIBLE CONTRIBUTION OF ICE SHEET LOSS AND GLACIAL MELTING. THIS HIGHEST SCENARIO SHOULDD BE CONSIDERED IN SITUATIONS WHERE THERE IS LITTLE TOLERANCE FOR RISK. (NOAA, 2016) States-National-Climate-Assessment.aspx) 2
")


")
, and")

8 R2CTPO Sea Level Rise Vulnerability Assessment II. Vulnerability Analysiss and Data Disclaimer This report provides an initial and conservative assessment of the potential vulnerabilities the River to Sea Transportation Planning Organization (R2CTPO) may face due to rising sea levels. It draws attention to potentially vulnerable transportationn assets so that advanced planning can occur. It is not meant to be a comprehensive or regional review and inn no way replaces the critical science and engineering studies thatt should be conducted as part of the development of a more comprehensive adaptation strategy or plan. These data and maps are for planning, educational, and awareness purposes only and should not be used for site-specific analysis, navigation, and flood rates or permitting. As with all data, all features should be verified with a site visit and surveying. The data and maps in this report are provided as is. III. Methodology This study builds upon modeling and parameters established by previous sea level rise vulnerability assessmentss conductedd by the East Central Florida Regional Planning Council (ECFRPC) and reviewed by the Working Group established for this assessment. The working group consisted of Flagler and Volusia County representatives from emergency management, traffic engineering, transit, planning and development, geographic information system (GIS), and environmental management. The University of Florida Geoplan Center s Sea Level Scenario Sketch Planning Tool served as the primary modeling tool due to its statewide applicability, development under direction from Florida Department of Transportation (FDOT), sea level scenario customization and utilization of a more conservative U.S. Army PARAMETER D Corps of Engineers (USACE) high projection rate curve than National Oceanic and Atmospheric Administration (NOAA). The tool, documents, and MEAN HIGHER other associated information, including tool development methodology for the Average of the Sea Level Scenario Sketch Planning Tool can be found at the higher high mixed tide over year period. DEFINITIONS HIGH WATER e elevations of h water off a a specific 19- As part of this study, the modeling included the following parameters: Planning horizons , 2070 and Projection Rate Curves USACE Low, Intermediate, High Vertical Datum o Volusia County Mean Higher High Water (MHHW) for Atlantic Coastal impacts and Mean High Water (MHW) for Indian River Lagoon hydroconnectivity. The previous analysis determined that due to the low daily tidal variations within the Indian River Lagoon, MHW is more applicable for impacts related to this water source. o Flagler County Mean Higher High Water MEAN HIGH WATER Average elevation of all high waters recorded at a particular point or station over a considerable period of time, usually 19 years. MEAN SEA LEVEL an average level for the surface of one or more of Earth's oceans from which heights such as elevations may be measured. 3
 used the Daytona")
.")


, under the specific planning")
9 R2CTPO Sea Level Rise Vulnerability Assessment Calculations of projected sea level rise and inundationn from the Table 1: Projected Sea Level Rise Change Atlantic and Indian River Lagoon (IRL) used the Daytona Beach (Inches) at Daytona Beach Shores Tidal Shores NOAA tide station s sea level trend values, which incorporate Gauge by Rate Curve local subsidence or uplift rates. (See table). Hence, the amount of projected sea level change under each scenario is the same for both the Atlantic and Lagoon. What differs is the starting water level as previously mentioned with MHW for the Lagoon in Volusia County and MHHW for the Atlantic. Since Flagler County was not within the recent study area of the Indian River Lagoon study, this data had to be modeled as part of the River to Sea TPO project. In discussion with the Working Group for this project, it was determined to model only MHHW for Flagler County. Year Low Intermediate High Table 1 illustrates the level of sea level rise change at the Daytona Beach Shores Tidal Gauge under each USACE projectionn Rate Curve. This data was utilized in the model to determine inundation levels on land and the vulnerability assessment. The sea level rise data in Figure 2 was used to determine the inundation elevations expected to occur based on tidal datum. The figure below shows the potential inundation, above mean sea level (MSL), under the specific planning horizons, datum and rate curves. These data are important for vulnerability analysis. Figure 2: Inundation Elevations (Inches) Above Mean Sea Level (MSL) by Rate Curve, Year and Vertical Datum Source: UF Geoplan Sea Level Scenario Sketch Planning Tool Inches Above Mean Sea Level MHW MHHW Low Intermediate High Source: UF Geoplan Sea Level Scenario Sketch Planning Tool 4
10 R2CTPO Sea Level Rise Vulnerability Assessment Using these parameters, the ECFRPC utilized the FDOT Sea Level Scenario Sketch Planning Tool plug-in for GIS in order to begin the process of creating highly customized sea Coast) level rise shapefiles for each of the counties in the study area. In the model, the input Digital Elevation Model (DEM) used was from the Florida Geographic Data Library (FGDL) and compiled by the University of Florida GeoPlan Center. The DEM cell size (horizontal resolution) is 5.4 meters and the vertical units are inches. MODELING PARAMETERS VERTICAL DATUM- MHHW Flagler County and Volusia County (Atlantic MHW Indian River Lagoon PROJECTION RATE CURVES - USACE Low, Intermediate and High PLANNING HORIZON: 2040, 2070, Shapefiles were developed for each planning horizon with each rate curve and datum. Volusia County resulted in 18 shapefiles and Flagler, having only MHHW datum runs, had nine shapefiles. These resultant sea level inundation files were used to determine impacts to various transportation infrastructure in Flagler and Volusia Counties. M IV. Vulnerability Analysiss Transportation facility and infrastructure data was collectedd from the Volusia and Flagler Counties as well as Florida Geographic Data Library (FGDL) and available ECFRPC datasets. Facilities that were assessed through this preliminary analysis include: Designated Evacuation Routes Major Roadway Network Fleet Storage Facilities Public Works Facilities Emergency Management Centers Other Storage Facilities necessary for transportationn or evacuation purposess Sidewalks and Trails Further details concerning impacts to waterbodies and facilities can be found in the datasets provided with this document. Designated Evacuation Routes The section below includes an analysis of designated evacuation routes that may be impacted by rising seas. Evacuation routes are of extreme importance for thee safety of residents and visitors to Volusia and Flagler Counties in the event of an emergency or evacuation. The tables in this section represent only those routes found to be vulnerable under the parameters of the study. Specific roadway segment information is available in the data files providedd with this report. Other considerations include: Impacts from storm surge and erosion to these roadways and land areas are not included in this analysis. Erosion and undercutting already occurring in sections of roadway, such as State Highway A1A, may be exacerbated as sea level rises. This, in turn, may elevate the segments priority for furtherr analysis for remediation by the TPO. The number of miles below do not represent a solid stretch of roadway vulnerable to inundation but the total miles potentially vulnerable to inundation along the roadway within the county. Theree may be sections of roadway that are not expected to be inundated but may be isolated by the inundation of flanking sections. It is recommende ed that the TPO further analyze the location of these impacts to determine if larger stretches of roadway may be mitigated due to the distance between the potential impacts. As noted in the disclaimer, the Sea Level Scenario Sketch Planning tool is for regional analysis and further on site assessment will need to bee conductedd to verify elevation and other 5


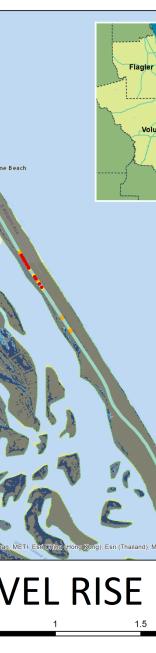


11 R2CTPO Sea Level Rise Vulnerability Assessment considerations. These numbers are to provide a preliminary overview of potential impacts to transportation infrastructure. Stormwater retention ponds and drainage weree not specifically evaluated and further assessment would be required to determine if they adequately to address the impacts from sea level rise. The Flagler & Volusia Sea Level Rise Atlas 2016 at the end of this report provides maps atlases broken out by scenario, to depict evacuation routes vulnerable to sea level rise. The images below are examples taken from the atlas. Please utilize this atlas for graphic representation of impacts to evacuation routes by year and projection rate curve. 6

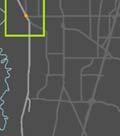
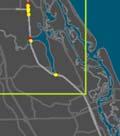
12 Table 2: Evacuation Route Projected Impacts from Sea Level Rise Flagler County Flagler County Evacuation Routes Year and Estimated Miles of Potential Inundated (by Projection Rate Curve) Roadway Low Intermediate High Hammock Dunes Parkway 0.18 mi Oceanshore Boulevard 0.31 mi Palm Coast Parkway 0.58 mi State Highway 100/Moody Boulevard <0.25 mi <0.25 mi 0.9mi State Highway 5 <0.25mii State Highway A1A <0.25 mi 0.3 mi 4.31 mi Surfview Drive 0.41 mi The analysis of evacuation routes in Flagler County indicates that State Highway 100 and SR A1A are most vulnerable to inundation from sea level rise. Inundation in sections of these roadways may begin to be realized under high tide conditions as early as 2040 in each rate project curve. This is important because even under historical sea level rise trends, with no increase in rate of sea level rise (Low Projection Rate Curve), impacts are likely. State Highway A1A is likely to see the greatest impacts by 2100, under the high projection rate curve, with an estimate of over four total miles of roadway segments impacted. The map below illustrates where impacts are likely to occur along evacuation routes, with the largest impacts in the northern portions of the county. Figure 3: Flagler County Evacuation Routes Vulnerable to Sea Level Rise Site 1 Site 2 The areas highlighted with the red circles are highlighted on page 11. 7
13 Table 3: Evacuation Route Projected Impacts from Sea Level Rise by Projection Rate Curve and Year Volusia County Roadway Volusia County Evacuation Routes Year and Estimated Miles Inundated (by Projection Rate Curve) Low Intermediate High CR 4019 (LPGA Blvd.) 0.2 mi 0.6 mi CR A1A (Atlantic Ave./Turtlemound) <0.25 mi 0.9 mi 8 mi State Highway A1A <0.25 mi <0.25 mi 0.5 mi 8.5 mi Interstate 4 <0.25 mi <0.25 mi 0.3 mi Interstate 95 <0.25 mi <0.25 mi 0.3 mi Silver Beach / Orange Ave. <0.25 mi <0.25 mi 0.3 mi State Road 40 <0.25 mi 0.4 mi State Road 415 <0.25 mi <0.25 mi 0.9 mi State Road 421 <0.25 mi State Road 430 <0.25 mi 0.8 mi State Road 44 State Road 46 <0.25 mi <0.25 mi State Road 5A US Highway 1 <0.25 mi <0.25 mi <0.25 mi 0.7 mi <0.25 mi <0.25 mi US Highway 92 <0.25 mi 0.5 mi 11 mi The analysis of evacuation routes in Volusia County estimate impacts to State Highway/CR A1A, SR 415 and 46, US 1, I 4 and I-95, along with Orange Ave., Pioneer Trail, as early as 2040 under the low projection rate curve, as shown in the table above. The total number of miles impacted greatly increases under the high rate curve, especially between 2070 and 2100 when the rate of sea level increase is highest. Under the high rate curve, State Highway/CR A1A and U.S. 1 are at the greatest risk of inundation as shown in the table above with 8.5 mi and 11 mi of potential inundation respectively. The map following depicts the evacuation routes that are expected to be impacted under each scenario in Volusia county. As shown on the map, impacts occur on both sides of the county and largely along the north/south routes. 8

14 Figure 4: Volusia County Evacuation Routes Vulnerable to Sea Level Rise by the Year This map depicts evacuation routes that may be vulnerable to sea level rise under each scenario by the year Those in red indicate the most vulnerable sections of evacuation routes as they are projected to be impacted under the low projection rate curve. Site 6 Site 3 Site 4 Site 5 The areas highlighted with the red circles are highlighted in the following sections. 9
15 Major Roadway Network Table 4: Summary of Major Roads Vulnerable to Sea Level Rise Flagler County Tables 3 and 4 provide a summary of the impact sea level rise may have on the major thorough-fare system. Local roadways are not included in this analysis and may be assessed at a later date along with associated assets such as traffic lights. Impacts to the major roadways may impact access to local roadways and the extent of local roadways vulnerable to inundation may exceed that of the major roadways. Of the 484 miles of major roadways in Flagler County nearly nine miles may be impacted under the USACE high projection rate curve by 2100, while less than a mile of roadway may be inundated under the other rate curves. The most vulnerable roadways are those impacted by 2040 in all three scenarios. Segments of the following roadways which are considered most vulnerable include: State Hwy. 100, SR A1A, CR 305 and CR 305. In Volusia County, approximately 47 miles of the major roadway network may be impacted under the USACE high projection rate curve by When analyzing impacts under the low and intermediate projection rate curves, approximately six miles or less may be inundated. The roadways listed below can be considered the county s most vulnerable roadways as sections of these roads may be impacted by 2040 under all three projection rate curves. These roadways include: U.S. 1, Beach Street, Pioneer Tr., SR/CR A1A, East LOW MED HIGH Flagler County Infrastructure Inundation Major Roads Total Mileage Estimated Inundation % Inundated 2040 <0.25 Miles <0.1% <0.25 Miles <0.1% 2070 Miles 2100 <0.25 Miles <0.1% <0.25 Miles <0.1% Miles 0.1% 2070 Miles Miles 0.1% Miles 0.1% Miles 0.3% 2070 Miles Miles 1.8% 2100 Table 5: Summary of Major Roads Vulnerable to Sea Level Rise Volusia County LOW MED HIGH 2040 Volusia County Infrastructure Inundation Major Roads Estimated Total Mileage % Inundated Inundation 1.5 Miles 0.2% Miles 2.1 Miles 0.2% Miles 0.3% Miles 0.2% Miles 3.2 Miles 0.4% Miles 0.6% Miles 0.4% Miles 11.1 Miles 1.2% Miles 5.2% 2100 Orange Ave, High Bridge Rd., I-4, I-95, Old Dixie Hwy, SR 415, SR 46, Turnbull Bay Rd., and Walter Boardman Ln. Site specific assessments should be made for all potential areas of impacts, including bridge elevations, to further refine these impacts. LOW MED HIGH LOW MED HIGH 10
 to light blue")


16 R2CTPO Sea Level Rise Vulnerability Assessment The images below represent some of vulnerable areas in Flagler and Volusia County. The 2070 sea level rise projections for each scenario are shown in the graphics below from dark blue (low rate curve) to light blue (high rate curve). Inundation projections for the year 2070 overlaid with roadways vulnerable to sea level rise impacts by 2040 to provide additional perspective. In the graphics below, red represents segments that may be impacted by the low rate curve, orange by the intermediate rate curve and yellow by the high rate curve. The areas shownn below are noted on the previous maps on red circles. Site 1: State Highway A1A may see impacts just north of Beverly Beach near the Fox Cut creek curve by Site 2: Middle Haw Creek runs under CR 305. Further analysis is necessary to refine the extent of potential impacts in this area. These screenshots illustrates the areas of the major roadways that are vulnerable to sea level rise by Areas of inundation by 2070 aree also shown in blue to provide additional perspective. 11


17 R2CTPO Sea Level Rise Vulnerability Assessment Site 3: East/Wes Routes from the barrier island along Beach Street in Daytona Beach may be impacted by under the high rate curve. Major impacts may be realized by 2070 under the highh projection rate curve. Site 4: Various areas in the vicinity in New Smyrna Beach, including bridge ramps, will need to be further assessed for inundation impacts. These impacts may be felt by 2040 under the low projection rate curve, as a shownn below in the areas in red. Thesee screenshotss illustrate the areas of the major roadways that are vulnerable to sea level rise by Areas of inundation by 2070 are also shown in blue to provide additional perspective. 12


18 Scenic Byways Scenic Byways were reviewed to determine potential vulnerabilities to sea level rise. Some of the areas of impact may be covered in the major roadway analysis. In the graphics below, red represents segments that may be impacted by 2040 in the low rate curve, orange by the intermediate rate curve and yellow by the high rate curve. In Flagler County, at the border of St. Johns County, the Heritage Crossroads: Miles of History Scenic Byway, may be impacted as early as 2040 under the low projection rate curve, especially as the byway crosses Pelicer Creek. As noted in the previous section, inundation impacts to SR A1A Scenic and Historic Coastal Byway may also be experienced as early as 2040 under each project rate curve. The County is already experiencing issues with flooding and erosion along SR A1A. These issues may be exacerbated as sea level rises and may impact SR A1A, especially in northern Flagler County. Sections of the Ormond Scenic Loop and Trail in Volusia County may be vulnerable to impacts by 2040 in all three scenarios. Most of these impacts are north of the Tomoka Basin along High Bridge Rd., John Anderson Drive and Walter Boardman Rd. On the west side of Volusia County, the River of Lakes Heritage Corridor Scenic Highway (RLHCSH) may be inundated along River Ridge Road on the east side of Lake Beresford. Impacts to the RLHCSH may also occur in Oak Hill along River Dr. Site 5: The Heritage Crossroads: Miles of History Scenic Byway, may be impacted as early as 2040 under the low projection rate curve. Site 6: Many segments of the Ormond Scenic Loop and Trail are vulnerable to impacts by 2040 under all three curves, even largely under the low projection rate curve. These screenshots illustrate the areas of the byways that are vulnerable to sea level rise by Areas of inundation by 2070 are also shown in blue to provide additional perspective. 13
19 Railroads Tables 5 and 6 provide a summary of railway infrastructure vulnerability to sea level rise under the three projection rate curves in the years 2040, 2070 and The tables represent active rail line mileage of the Florida East Coast Rail line and the CSX/Amtrak/SunRail Tracks. Rail is an important asset in the region, with freight accessing Port Canaveral, SunRail, and the potential increase in passenger rail along the FEC corridor as part of All Aboard Florida. It will be important to ensure vulnerable rail rights of way are mitigated to maintain their viability. As with any private entity, it will be important for CSX and FEC to assess vulnerability impacts to their infrastructure. The FEC rail line begins to head north-west, crossing I-95 just before the Volusia/Flagler line resulting in minimal impacts to the rail line in Flagler County. In Volusia County, modeling illustrates there may be impacts to segments of FEC rail line as early as 2040 under the low projection rate curve in the area of Ormond Beach just southeast of Tomoka State Park and sections south of port Orange and Oak Hill. However, as the projection rate increases to intermediate and high, extensive impacts by 2100 are shown to continue south through Daytona Beach and then pick up again in the area near Turnbull and Spruce Creek, which is highly vulnerable to inundation under the high projection rate curve. Impacts by 2040 under the high scenario continue in some segments of the FEC in Edgewater and Oak Hill. The CSX rail line runs near Lake Monroe Park in western Volusia County, along the Seminole County line. Most of the impacts to the rail lines are expected to occur by the year 2100 under the high projection rate curve (HPRC), again illustrating the tipping point between the 2070 and 2100-year horizon under the HPRC. The majority of these impacts are from Daytona Beach north to Ormond Beach, with additional impacts in southern Volusia County. In western Volusia County, impacts are expected in the vicinity of DeLeon Springs and along Lake Beresford. Table 6: Summary of Railroad ROW Vulnerable to Sea Level Rise - Flagler County Flagler County Infrastructure Inundation Railroads Total Mileage Estimated Inundation % Inundated LOW INTERM 2040 < 0.25 Miles < 0.25 % Miles < 0.25 Miles < 0.25 % < 0.25 Miles < 0.25 % < 0.25 Miles < 0.25 % Miles < 0.25 Miles 0.29% < 0.25 Miles 0.33% 2100 LOW INTERM. HIGH 2040 < 0.25 Miles 0.33% Miles < 0.25 Miles 0.33% < 0.25 Miles 0.33% 2100 HIGH 14

20 Table 7: Summary of Railroad ROW Vulnerable to Sea Level Rise- Volusia County Volusia County Infrastructure Inundation Railroads Total Mileage Estimated Inundation % Inundated LOW MED HIGH Miles 0.6% Miles 0.73 Miles 0.8% Miles 0.9% Miles 0.76% Miles 1.08 Miles 1.13% Miles 2.55% Miles 1.23% Miles 1.18 Miles 1.23% Miles 16.0% 2100 LOW MED HIGH The USACE High Projection Rate Curve models major impacts to the FEC rail line by 2100 from Ormond Beach south into New Smyrna Beach. Additional impacts continue south into Edgewater. As discussed throughout this report, there is a major tipping point within this rate curve from 2070 to 2100 which impacts areas of Volusia County with dense population, infrastructure and assets. This graphic represents areas of potential inundation and impacts to the FEC rail line in New Smyrna Beach under the high rate curve. 15


21 R2CTPO Sea Level Rise Vulnerability Assessment Figure 5: Sections of Railroad ROW or Line that may be vulnerable to inundation from sea level rise under the Low projection rate curve Flagler 16


22 R2CTPO Sea Level Rise Vulnerability Assessment Figure 6: Sections of Railroad ROW or Line that may be vulnerable to inundation from sea level rise under the Low projection rate curve Volusia 17
23 Facilities The facility analysis includes an assessment of fleet storage/barns and public works facilities, emergency management centers and other storage facilities that may be necessary for transportation or evacuation purposes such as airports, the coast guard station and transportation management centers. A list of facilities can be found in the Appendix. Of the facilities reviewed, none were found to be vulnerable to sea level rise impacts in Flagler County. Additional analysis may be required to determine if these assets may be vulnerable to new storm surge areas that may arise from rising sea levels. In Volusia County, most impacts may be expected under the high rate curve by the year Smokey s Heliport could be considered the most vulnerable as under the high rate curve it is expected to be impacted by Only the Coast Guard Facility in Ponce Inlet and the County s Road and Bridge Building in Holly Hill may be impacted in 2070 under the high projection rate curve. It is important to note that in the County, especially in the Holly Hill/ Daytona Beach area, there may be significant impacts in relation to the tipping point that occurs in the high projection rate curve between 2070 and At this tipping point, inundation is pushed to the west side of Beach Street and U.S. 1, thus potentially having greater impacts on various transportation and other local facilities. As with Flagler County, additional analysis should be conducted to determine if other facilities may be vulnerable to new storm sure areas that may arise from rising seas. The following map illustrates the facilities identified in the Volusia County GIS resource file. All vulnerable facilities have been identified in red, however, only those determined to fall within this scope have been labeled. Table 8: Facilities Vulnerable to Sea Level Rise by Year and Projection Rate Curve - Volusia Facility Smokey's Heliport Coast Guard Station (Ponce) R&B Barn 3 - NE Complex Evac Parking Lot 2 - Holly Hill Holly Hill Public Works New Smyrna Transp. Terminal Votran Bus McLeod Bethune/Hibiscus Florida National Guard Holly Hill Evac Tower South Daytona Fire Station 99 Warehouse Volusia County Facilities Projected Year of Inundated (by Projection Rate Curve) Intermediate High

24 R2CTPO Sea Level Rise Vulnerability Assessment Figure 7: Facilities Vulnerable to sea level rise in Volusia County 19

25 The area of Holly Hill and Daytona Beach may experience significant impacts under the 2100 high projection rate curve scenario. Many various government facilities are located in this urban area. Most are impacted under the 2070/2100 high projection rate curve. The figure below depicts the area of Holly Hill and Daytona Beach vulnerable to inundation in 2070 under each projection rate curve. As illustrated, there is a significant increase in area vulnerable by 2070 under the high rate curve compared to the intermediate rate curve. Figure 8: Daytona Beach and Holly Hill area vulnerable to potential inundation by 2070 illustrated by each projection rate curve. 20


26 The County s Road and Bridge Division in Holly Hill may be vulnerable to sea level rise by 2070 under the high projection rate curve. Access to this area may also be compromised. The figure below illustrates potential impacts in this area under High Rate Curve from While the Votran facility on Big Tree Rd itself may not be inundated under any scenario, the area surrounding the facility may be vulnerable to impacts under the 2100 HPRC as shown below. Other facilities in the Flagler and Volusia County may be subject to similar circumstances that may impact access or increase flooding potential during prolonged rainfall events or tropical storm events. The figure below illustrates potential impacts under the High Rate Curve from in the area of Big Tree Rd. 21

27 Sidewalks and Trails The threat of sea level rise to the multi-use paths and sidewalk networks in Flagler and Volusia County was also completed as part of this effort. A summary of the findings from these analyses is below. Due to the continuous building of sidewalk infrastructure, to maintain a more consistent analysis of impacts, it may be more feasible to first assess the roadways (local and above) that are vulnerable to inundation and use these findings to further assess impacts to sidewalks. In Flagler County, local roadways in the area north of Moody Blvd. in Flagler Beach vulnerable to inundation from Smith Creek and Silver Lake, in turn, impacting sidewalks in these areas. This inundation may stretch along the entire coastline up to Beverly Beach. In Palm Coast, in the Bon Terra and Hammock Beach area through The Washington Oaks Gardens State Park to the northern county line, access to neighborhood streets and sidewalks are at a high risk for inundation under the high projection rate curve. Also in this area, sections of the FIND Trail may begin to experience inundation as early as 2040 under all rate curves. To the north of Washington Oaks Gardens State Park, Marineland, the county s northernmost area, may be highly susceptible to sea level rise by 2100 under the high rate curve. Facilities along SR A1A may be susceptible to inundation and erosion, as well as the Legacy Trail, along Pellicer Creek. Sections of the FIND Trail in the Palm Coast may be vulnerable to inundation as early as 2040 in the Fox Cut area. The illustration depicts 2070 scenarios. In Volusia County, a majority of the potentially inundated sidewalks and trails are located along the barrier islands to the east of the lagoon system. Roadway facilities along SR A1A and South Peninsula Drive in New Smyrna Beach are projected to be inundated. A loss or inundation obstruction of sidewalk connectivity along SR A1A, even just under high tides, pose a safety hazard for residents and visitors. In addition to these facilities, a number of off-road trail, boardwalk and sidewalk systems are projected to be inundated to the north and south of Ponce Inlet. Volusia County s sidewalk and trail system is also vulnerable to the west of the Indian River Lagoon and Halifax River. Projected sea level rise inundation typically stretches 0.2 to 0.5 miles inland from the lagoon system. Because of this, US Highway 1 is among the most vulnerable sidewalk networks. Sidewalk inundation is expected to occur extensively in Daytona Beach, as early as This could have major economic and safety impacts in the area due to the high tourism industry in Daytona Beach and surrounding areas. Consideration should be given to show how sea level rise may impact tourism, as beach related tourism is a major traffic generator. If use of the beach is impacted by sea level rise and erosion, the effect on the economy and traffic could be significant. Additionally, impacts may also be realized up to one mile inland, under the high projection rate curve due to the creeks that come in north of Ormond Beach and south of Port Orange. West International Speedway Boulevard, Mason Avenue and LPGA Boulevard three highly traversed east-west roadways for bicyclists and pedestrians, are projected to have approximately 0.3 miles to 0.5 miles of inundation when measuring inundation under the high curve for the year Ormond Beach and New Smyrna Beach, as a whole, could also experience considerable sidewalk network obstruction by 2100 under the high rate curve; again illustrating the major tipping point between the 2070 and 2100-year horizon projections.. 22

28 The Spring to Spring Trail systems are vulnerable to sea level rise along the western border with Lake County near lake Beresford and Blue Springs State Park. Other unpaved and trail and off-road walkways are projected to be inundated as well in these parks and conservation areas. The Coast to Coast Trail may also be impacted as early as 2040 near Lake Monroe and Lake Harney. Sections of the East Coast Greenway between Holly Hill and Port Orange may begin to see impacts as early as 2040 as well as the King s Highway Heritage Trail in Ormond Beach. Many of these impacted areas mimic the sidewalk analysis. Conservation area trails such as the Merritt Island National Wildlife Refuge Trail, Tomoka State Park Trail, Bulow Creek Trail and a large extent of World s Most Famous Beach Trail are extremely vulnerable to sea level rise by 2040 under each curve, as would be expected from the context and location of the trails. In Daytona Beach, sea level rise is expected to impact transportation infrastructure including sidewalks as early as 2040 as shown below. Red are the most vulnerable as these segments are expected to be impacted under the low rate curve by Orange represents the intermediate curve and yellow the high. (2070 sea level rise is depicted in blue to provide additional perspective). 23
29 V. Stormwater Storage Impacts Many roadways traverse lower elevations and are more likely to experience flooding during evacuation events. With sea level rise, existing stormwater ponds may fail resulting in additional flooding of roadways. This flooding could be compounded due to rising groundwater tables which may become higher commensurate with sea level rise. It should be noted that this analysis does not take into account the impacts of increased storm surge due to sea level rise and does not include analysis of increases in the water table. This additional analysis is critical in order to maintain the health, safety and welfare of the general public. The rate at which gravity can drain an area depends, in part, on the difference in elevation between the area being drained and the place to which the water flows. The greater the difference in elevation, the greater the slope of the hydraulic head and the faster the water can drain. Lower elevations, particularly populated areas proximate to the coast and the St Johns River, will be more susceptible to tidal flooding with changes to sea levels. This combination can severely hinder natural drainage. Roadways that traverse lower areas or that approach bridges near rivers may be inundated. High tides can decrease the difference in elevation and during rain events, saturated soils will prevent permeation, resulting in more standing water. With high storm events, drainage systems can be ineffectual until water levels have subsided. Due to sea level rise, the failure of existing drainage systems will be more common and additional planning and engineering will be needed to ensure that systems work. According to the Journal of Water Resources Planning and Management, there are three general strategies to address these issues: enhanced gravity drainage, forced drainage and adaptation to increased flooding. Gravity drainage can be improved by using larger pipes or wider drainage channels. Communities with drainage systems in place can either install supplemental pipe systems or replace old pipes with larger ones. Setbacks from canals and waterways can be increased to prevent flooding and to allow for dredging to increase volumes. Locks and flap gates may be useful to allow drainage during low tides and prevent back flow during surges or high tide events. Some critical areas may need to install forced pumping systems in lieu of gravity systems. Detention basins can be enlarged and other techniques such as infiltration trenches, porous pavement, rooftop detention, storage in playgrounds and parking areas, etc. are other options. Additional detention basins higher in the drainage basin may help deter the accumulation of water in lower areas and reduce the peak discharge. Evacuation routes and critical infrastructure can be mitigated against higher waters by elevating roads, relocating critical buildings out of lower areas or flood proofing buildings. Federal or state funding may be available for these purposes, and should be considered when building or expanding facilities. Planners and engineers should be considering the impacts of climate change, surge events and sea level rise to lessen future costs from storm events. Also, the counties should work with the SJRWMD to determine vulnerable ground water storage and identify areas where mitigation ponds can be located. The screenshots below illustrate the potential need for additional stormwater facilities or other strategies adjacent to Turnbull Creek. In the model screenshot, several areas may be impacted by the year 2040 (dark blue), and more widespread areas may be impacted by 2070 (blue) and 2100 (light green). Planning for these areas could include hydrological solutions or comprehensive plan changes that may lessen potential impacts to the area (Google Earth screenshot). 24


")
30 Figure 9: Potential Areas of Inundation in the Turnbull Creek Area from 2040 (Dark Blue) through 2100 (light green) 25
31 VI. Next Steps The ECFRPC recommends that the R2CTPO to consider the following actions in order to fulfill directives such as FAST Act and Executive Order and to collaborate with local jurisdictions in order to address new Comprehensive Plan legislation pertaining to sea level rise and resiliency, including HB 720 and SB The agency will benefit from compiling case studies of how other coastal transportation planning organizations have addressed resiliency strategies. While one size does not fit all, the case studies may present creative and viable tools, strategies and recommendations for the R2CTPO. Continue discussions that will lead to the establishment of a standardized assessment of projects, programs and other transportation efforts and adopt a base sea level rise modeling scenario inclusive of projection rate curve year as well as probability modeling. This would provide a standard base level assessment for reviewing current and future projects for vulnerability, mitigation efforts and costs. Continue discussions that will lead to a determination of the vulnerability horizon and probability appropriate for projects included in the next LRTP to minimize the potential impacts from sea level rise. Review and consistency in TPO plans, programs and procedures, such as Corridor Improvement Plans and the Long Range Transportation Plan, is important as the TPO establishes policies and programs towards resiliency. Further identify and analyze impacts to storm water ponds to determine if additional countermeasures are appropriate to ensure functionality. Continue collaboration and coordination with other agencies, organizations and jurisdictions in outreach efforts, data collection, policy development, planning, floodplain management and other efforts that reduce impacts of sea level rise and flooding. Further analyze Low Impact Development (LID) and Green Streets Infrastructure techniques that provide innovative methods to lessen the impacts of stormwater runoff and to preserve recharge areas that may assist in the reduction of existing and future flooding. 26
32 Appendix 27
33 The Evacuation Routes and connections and ramps associated with these routes that were analyzed are below. VOLUSIA COUNTY ROAD NAME US Hwy 1 I-95 SB US 1 OFF RAMP US HWY 1 I-95 SB US 92 OFF RAMP US HWY 1 (DIXIE FREEWAY N) I-W EB US 92 ON RAMP US HWY 1 (DIXIE FREEWAY S) INDIAN RIVER BLVD E US HWY 1 (RIDGEWOOD AV N) LPGA EB I-95 NB ON RAMP US HWY 1 (RIDGEWOOD AV S) LPGA EB I-95 ON RAMP US HWY 1 (RIDGEWOOD AV) LPGA WB I-95 NB ON RAMP US HWY 1 (YONGE ST N) LPGA WB I-95 SB ON RAMP US HWY 1 (YONGE ST S) MAIN ST I-4 EB ON RMP US HWY 1 N N SPRING GARDEN AV US HWY 1 S N WILLIAMSON BLVD 5TH AV E OLD DIXIE I-95 SB ON RAMP ATLANTIC AV S ORANGE AV BEVILLE RD ORANGE CMP I-4 WB ON RMP BEVILLE WB I-95 NB ON RMP PENNINSULA BEVILLE WB I-95 SB ON RMP ROSEWOOD AV CANAL ST S ATLANTIC AV CAUSEWAY N SAXON EB I-4 WB ON RAMP CR 2002 (OLD DIXIE HWY) SAXON I-4 EB ON RAMP CR 4009 (WILLIAMSON BLVD N) SAXON WB I-4 WB ON RAMP CR 4019 (LPGA BLVD) SERVICE RD CR 4068 (BELLEVUE AV) SR 11 CR 4075 (ATLANTIC AV S) SR 40 CR 4106 (VOORHIS AV E) SR 40 (GRANADA BLVD E) CR 4116 (MAIN ST W) SR 40 (GRANADA BLVD W) CR 4116 (ORANGE CAMP RD) SR 40 E CR 4118 (PIONEER TR) SR 40 W CR 4146 (SAXON BLVD) SR 400 (BEVILLE RD) CR 415 (TOMOKA FARMS RD) SR 415 N CR 415 N SR 415 S CR 4162 (DEBARY AV) SR 421 (DUNLAWTON AV) CR 4162 (DIRKSEN DR) SR 430 CR 4162 (DOYLE RD) SR 430 (MASON AV) CR 4164 (MAYTOWN RD) SR 430 (OAKRIDGE BLVD) CR 421 (TAYLOR RD) SR 430 (SEABREEZE BLVD) CR 430 (MASON AV) SR 44 CR 483 (CLYDE MORRIS BLVD S) SR 44 (LYTLE AV) CR 483 (CLYDE MORRIS BLVD) SR 44 (NEW YORK AV E) CR A1A (ATLANTIC AV S) SR 44 (NEW YORK AV W) CR A1A (TURTLEMOUND RD) SR 44 EB I-95 ON RAMP DEBARY AV SR 44 WB I-95 ON RAMP DEBARY I-4 EB ON RAMP SR 441 (PENINSULA DR S) DIRKSEN I-4 WB ON RAMP SR 442 (INDIAN RIVER BLVD W) DUNLAWTON EB I-95 ON RMP SR 442 EB I-95 ON RAMP DUNLAWTON I-95 NB ON RMP SR 442 WB I-95 ON RAMP DUNLAWTON I-95 ON RMP SR 46 DUNLAWTON WB I-95 ON RMP SR 472 E PLYMOUTH AV SR 472 I-4 EB ON RAMP FLAGLER AV SR 472 I-4 WB ON RAMP 28
34 GRANADA I-95 NB ON RAMP SR 472 ON-OFF RAMP GRANADA I-95 SB ON RAMP SR 472 US OFF RAMP I-4 E SR 472 US SB OFF RMP I-4 EB DEBARY OFF RAMP SR 483 (CLYDE MORRIS BLVD N) I-4 EB I-95 NB ON RAMP SR 483 (CLYDE MORRIS BLVD S) I-4 EB I-95 SB ON RMP SR 5A (NOVA RD N) I-4 EB MAIN ST OFF RMP SR 5A (NOVA RD S) I-4 EB SAXON EB OFF RAMP SR 5A (NOVA RD) I-4 EB SAXON WB OFF RAMP SR A1A I-4 EB SR 472 OFF RAMP SR A1A (3RD AV) I-4 EB SR44 OFF RAMP SR A1A (ATLANTIC AV N) I-4 EB US 92 ON RAMP SR A1A (ATLANTIC AV S) I-4 W SR A1A (CAUSEWAY S) I-4 WB DIRKSEN OFF RAMP SR A1A (DUNLAWTON AV) I-4 WB ORANGE CMP OFF RMP SR A1A (DUNLAWTON BLVD) I-4 WB SAXON EB OFF RAMP SR A1A (LYTLE AV) I-4 WB SAXON WB OFF RAMP SR A1A (OCEAN SHORE BLVD) I-4 WB SR 472 OFF RAMP SR44 I-4 EB ON RAMP I-4 WB SR44 OFF RAMP SR44 I-4 WB ON RAMP I-95 N TURTLEMOUND RD I-95 NB BEVILLE OFF RAMP US 1 I-95 NB ON RAMP I-95 NB DUNLAWTON EB RMP US 1 NB I-95 SB ON RAMP I-95 NB DUNLAWTON OFF RMP US SR 472 ON RAMP I-95 NB DUNLAWTON WB RMP US 92 EB I-95 ON RAMP I-95 NB GRANADA OFF RAMP US 92 WB I-4 ON RAMP I-95 NB I-4 ON RAMP US 92 WB I-95 NB ON RAMP I-95 NB LPGA EB OFF RAMP US 92 WB I-95 ON RAMP I-95 NB LPGA OFF RAMP US 92 WB I-95 SB ON RAMP I-95 NB LPGA WB OFF RAMP US HWY 1 (RIDGEWOOD AV) I-95 NB OLD DIXIE OFF RMP US HWY 1 S I-95 NB SR 44 OFF RAMP US HWY (CHARLES R BEALL BLVD N I-95 NB SR 442 OFF RAMP US HWY (CHARLES R BEALL BLVD S) I-95 NB US 92 OFF RMP US HWY (VOLUSIA AV N) I-95 NB US1 OFF RAMP US HWY (VOLUSIA AV S) I-95 S US HWY (WOODLAND BLVD N) I-95 SB BEVILLE ON RAMP US HWY (WOODLAND BLVD S) I-95 SB DUNLAWTON EB RMP US HWY 17 (CENTER ST N) I-95 SB DUNLAWTON OFF RMP US HWY 17 (CENTER ST S) I-95 SB DUNLAWTON WB RMP US HWY 17 (WOODLAND BLVD N) I-95 SB GRANADA OFF RAMP US HWY 17 N I-95 SB I-4 ON RAMP US HWY 17 S I-95 SB LPGA OFF RAMP US HWY 92 (INTL SPEEDWAY BLVD E) I-95 SB SR 44 EB OFF RAMP US HWY 92 (INTL SPEEDWAY BLVD W) I-95 SB SR 44 OFF RAMP WALLACE RD I-95 SB SR442 OFF RAMP WASHINGTON ST 29
35 NAME I 95 I-4 EB SR44 OFF RAMP S SR 15A US Hwy 1 I-4 EB US 92 ON RAMP S TYMBER CREEK RD US HWY 1 I-4 FRONTAGE RD S VOLUSIA AV US HWY 1 (DIXIE FREEWAY I-4 W S WILLIAMSON BLVD N) US HWY 1 (DIXIE FREEWAY I-4 WB DIRKSEN OFF SAXON BLVD S) RAMP US HWY 1 (RIDGEWOOD AV I-4 WB ORANGE CMP OFF SAXON EB I-4 WB ON RAMP N) RMP US HWY 1 (RIDGEWOOD AV I-4 WB SAXON EB OFF SAXON I-4 EB ON RAMP S) RAMP US HWY 1 (RIDGEWOOD I-4 WB SAXON WB OFF SAXON WB I-4 WB ON RAMP AV) RAMP US HWY 1 (YONGE ST N) I-4 WB SR 472 OFF RAMP SERVICE RD US HWY 1 (YONGE ST S) I-4 WB SR44 OFF RAMP SILVER BEACH AV US HWY 1 N I-95 N SPRING GARDEN AV US HWY 1 S I-95 NB BEVILLE OFF SPRING GARDEN RANCH RD RAMP 10TH ST I-95 NB DUNLAWTON EB SPRUCE CREEK RD RMP 5TH AV E I-95 NB DUNLAWTON OFF SR 11 RMP AIR PARK RD I-95 NB DUNLAWTON WB SR 40 RMP AIRPORT RD I-95 NB GRANADA OFF SR 40 (GRANADA BLVD E) RAMP ARREDONDO GRANT RD I-95 NB I-4 ON RAMP SR 40 (GRANADA BLVD W) ATLANTIC AV S I-95 NB LPGA EB OFF SR 40 E RAMP BEACH ST I-95 NB LPGA OFF RAMP SR 40 W BEACON LIGHT RD I-95 NB LPGA WB OFF SR 400 (BEVILLE RD) RAMP BELLEVUE AV I-95 NB OLD DIXIE OFF SR 415 N RMP BERESFORD AV EXT PH I I-95 NB SR 44 OFF RAMP SR 415 S BERESFORD AV EXT PH II I-95 NB SR 442 OFF RAMP SR 421 (DUNLAWTON AV) BEVILLE RD I-95 NB US 92 OFF RMP SR 430 BEVILLE WB I-95 NB ON I-95 NB US1 OFF RAMP SR 430 (MASON AV) RMP BEVILLE WB I-95 SB ON I-95 PARALLEL RD SR 430 (OAKRIDGE BLVD) RMP BIG TREE RD I-95 S SR 430 (SEABREEZE BLVD) BLUE LAKE AV S I-95 SB BEVILLE ON RAMP SR 44 BROADWAY AV I-95 SB DUNLAWTON EB SR 44 (LYTLE AV) RMP BUNNELL RD I-95 SB DUNLAWTON OFF SR 44 (NEW YORK AV E) RMP CANAL ST I-95 SB DUNLAWTON WB SR 44 (NEW YORK AV W) 30
36 RMP CASSADAGA RD I-95 SB GRANADA OFF SR 44 EB I-95 ON RAMP RAMP CAUSEWAY N I-95 SB I-4 ON RAMP SR 44 WB I-95 ON RAMP CHILDRENS WAY I-95 SB LPGA OFF RAMP SR 441 (PENINSULA DR S) CLYDE MORRIS BLVD I-95 SB SR 44 EB OFF SR 442 (INDIAN RIVER BLVD W) RAMP COW CREEK RD I-95 SB SR 44 OFF RAMP SR 442 EB I-95 ON RAMP CR 2002 (OLD DIXIE HWY) I-95 SB SR442 OFF RAMP SR 442 WB I-95 ON RAMP CR 4009 (WILLIAMSON I-95 SB US 1 OFF RAMP SR 46 BLVD N) CR 4019 (LPGA BLVD) I-95 SB US 92 OFF RAMP SR 472 CR 4068 (BELLEVUE AV) I-W EB US 92 ON RAMP SR 472 I-4 EB ON RAMP CR 4075 (ATLANTIC AV S) INDIAN RIVER BLVD E SR 472 I-4 WB ON RAMP CR 4101 JACOBS RD SR 472 ON-OFF RAMP CR 4106 (VOORHIS AV E) JOHN ANDERSON HWY SR 472 US OFF RAMP CR 4116 (MAIN ST W) JOSEPHINE ST SR 472 US SB OFF RMP CR 4116 (ORANGE CAMP KICKLIGHTER RD SR 483 (CLYDE MORRIS BLVD N) RD) CR 4118 (PIONEER TR) LAKE HELEN OSTEEN RD SR 483 (CLYDE MORRIS BLVD S) CR 4139 LAKE WINONA RD SR 5A (NOVA RD N) CR 4146 (SAXON BLVD) LAKESHORE DR SR 5A (NOVA RD S) CR 415 (TOMOKA FARMS LPGA BLVD SR 5A (NOVA RD) RD) CR 415 N LPGA EB I-95 NB ON SR A1A RAMP CR 4162 (DEBARY AV) LPGA EB I-95 ON RAMP SR A1A (3RD AV) CR 4162 (DIRKSEN DR) LPGA WB I-95 NB ON SR A1A (ATLANTIC AV N) RAMP CR 4162 (DOYLE RD) LPGA WB I-95 SB ON SR A1A (ATLANTIC AV S) RAMP CR 4164 (FLORIDA AV) MACY AV SR A1A (CAUSEWAY S) CR 4164 (HALIFAX AV W) MADELINE AV SR A1A (DUNLAWTON AV) CR 4164 (MAYTOWN RD) MADELINE AV EXT SR A1A (DUNLAWTON BLVD) CR 4164 (NEW SMYRNA MAIN ST SR A1A (LYTLE AV) BLVD) CR 4164 (OSTEEN MAIN ST I-4 EB ON RMP SR A1A (OCEAN SHORE BLVD) MAYTOWN RD) CR 421 (TAYLOR RD) MARION ST SR44 I-4 EB ON RAMP CR 430 (MASON AV) MARSH RD SR44 I-4 WB ON RAMP CR 483 (CLYDE MORRIS MAYBERRY AV STAGECOACH RD BLVD S) CR 483 (CLYDE MORRIS MCGREGOR RD SUGAR MILL DR BLVD) CR A1A (ATLANTIC AV S) MERCERS FERNERY RD TAYLOR BRANCH RD CR A1A (TURTLEMOUND MIDWAY AV TAYLOR RD RD) DAUGHARTY RD MISSION DR TURNBULL BAY RD 31
District 5 - Mrs. Diane Smith READ-PATTILLO ELEMENTARY SPRUCE CREEK ELEMENTARY SWEETWATER ELEMENTARY
 - Ms. Candace Lankford BLUE LAKE ELEMENTARY DELAND MIDDLE BOSTON AVENUE CHARTER CITRUS GROVE ELEMENTARY RIVER SPRINGS MIDDLE EASTER SEALS CHARTER, WEST DEBARY ELEMENTARY SOUTHWESTERN MIDDLE ELEARNING WEST
Table of Recommended Functional Classification Changes East Volusia County. Page 1
 Daytona 3rd St Jimmy Ann Dr Derbyshire Rd Collector URBAN Local URBAN Daytona 3rd St SR 5A/Nova Road Beach St Collector URBAN Local URBAN Daytona Bay St US 1 Beach St Collector URBAN Local URBAN Daytona
Current Installed APS Inventory
 Current Installed APS Inventory City Street (North/South) Street (West/East) Fentress Turn One Dr Midway White Nove US 1 Palmetto Nove Walmart Clyde Morris Grandview Wild Olive Oleander Peninsula Peninsula
Bin Location Latitude Longitude Bin Address City
 Bin Location Latitude Longitude Bin Address City Lake Dias 29.167866-81.300083 5320 State Rd. 11 DeLeon Springs Cypress Lake 29.0586-81.2584 1700 First Ave. DeLand Ed Stone Fishing 29.009433-81.382316
INTER-OFFICE MEMORANDUM
 INTER-OFFICE MEMORANDUM TO: FROM: Development Review Committee John G. Thomson, AICP./(' Land Development Manager,... j \ DATE: February 10, 2014 SUBJECT: DRC Meeting Date: February 18, 2014 Request for
DRAFT. Volusia County - Half-Cent Projects
 Volusia County - Half-Cent Projects Estimated Cost Summary Projects Estimated Cost Eastside Total Estimated Cost for Water Quality Projects 34,410,000 Westside Total Estimated Cost for Water Quality Projects
2018 LIST OF PRIORITY PROJECTS
 River to Sea Transportation Planning Organization 2018 LIST OF PRIORITY PROJECTS STRATEGIC INTERMODAL SYSTEM (SIS) PROJECTS... 2 REGIONALLY SIGNIFICANT, NON-SIS ROADWAY PROJECTS... 3 TRAFFIC OPERATIONS,
1.2 Corridor History and Current Characteristics
 SECTION 1 Description and Background of Study Area 1.1 Introduction This preliminary engineering report was prepared for the Alaska Department of Transportation and Public Facilities (ADOT&PF). It is part
County of Volusia, Florida Land Development Residential Developments - Project Status Listing. Project Name Lots Units Status Comment
 Page 1 2015-S-ODP-0088 Subdivision BEACH SUBDIVISION 2 2012-S-ODP-0103 Subdivision BELLOMO SUBDIVISION 3 2007-S-FPL-0368 Subdivision BERRY'S RIDGE 109 2015-S-ODP-0195 Subdivision BLAIR SUBDIVISION 2 2005-S-PPL-0747
2018 Resource & Relocation Guide
 Volusia County - Florida 2018 Resource & Relocation Guide CONTENTS Published By: In association with Sales Coordinator: John Armbruster Ad Designer: Linda Swindler Book Designer: Asha Bohannon www.skylinepub.net
FY 2018/19 CENTRAL FLORIDA MPO ALLIANCE - LIST OF PRIORITY PROJECTS
 Priority FY 2018/19 CENTRAL FLORIDA ALLIANCE - LIST OF PRIORITY PROJECTS FY 2018-2019 SIS HIGHWAY PROJECTS FDOT Financial Management Number Project Name From To Work Description Latest Project Phase Funded
PPCR/SC.4/5 October 9, Meeting of the PPCR Sub-Committee Washington, D.C. October 28, REVIEW OF ON-GOING WORK OF THE MDBs IN DJIBOUTI
 PPCR/SC.4/5 October 9, 2009 Meeting of the PPCR Sub-Committee Washington, D.C. October 28, 2009 REVIEW OF ON-GOING WORK OF THE MDBs IN DJIBOUTI Proposed Sub-Committee Decision The Sub-Committee reviewed
Coast to Coast Connector Summit
 Project Partners Welcome to the Coast to Coast Connector Summit Winter Garden, Florida City Hall October 1, 2014 1 Why are we here? Objectives 1. Inform key stakeholders on the current state of the C2C
A Presentation to: Project Advisory Group Meeting #6
 A Presentation to: Project Advisory Group Meeting #6 March 25, 2015 Agenda Introductions Action items from last PAG meeting (February 25, 2015) Public involvement update Status of April public meetings
FUNDED FOR CONSTRUCTION
 Priority CENTRAL FLORIDA ALLIANCE 2016 SIS HIGHWAY PROJECTS FOR PRIORITIZATION FDOT Financial Project Phase(s) Estimated Management Project Name or Length Latest Project Remaining Remaining Cost Designation
Overview of Highway 37 Project. Novato Rotary November 4, 2016
 Overview of Highway 37 Project Novato Rotary November 4, 2016 Project Location-Caltrans District 4 SR 37 Corridor Features Two to Four lane 21 mile corridor traversing Solano, Sonoma, and Marin Counties.
Georgetown-Lewes Rail/Trail Study. Rail/Trail Study: Cool Spring to Cape Henlopen State Park New Road Extension (House Resolution No.
 Georgetown-Lewes Rail/Trail Study Rail/Trail Study: Cool Spring to Cape Henlopen State Park New Road Extension (House Resolution No. 47) August 22, 2011 Presentation Outline Background Benefits Statewide
Memo. Orange City Trail Plan Becky Mendez, AICP Jamie Krzeminski, PE, PTOE Matt Wiesenfeld, PE, AICP. Development of the Existing and Proposed Network
 Memo Date: Friday, December 22, 2017 Project: To: From: Subject: Trail Plan Becky Mendez, AICP Jamie Krzeminski, PE, PTOE Matt Wiesenfeld, PE, AICP Development of the Existing and Proposed Network HDR
Chapter 4.0 Alternatives Analysis
 Chapter 4.0 Alternatives Analysis Chapter 1 accumulated the baseline of existing airport data, Chapter 2 presented the outlook for the future in terms of operational activity, Chapter 3 defined the facilities
Overview of Highway 37 Project. Napa County Board of Supervisors December 20, 2016
 Overview of Highway 37 Project Napa County Board of Supervisors December 20, 2016 1 Project Location-Caltrans District 4 2 SR 37 Corridor Features 2 to 4 lane 21 mile corridor traversing Solano, Sonoma,
City of Fort Lauderdale. Frequently Asked Questions. Proposed Sea Wall Ordinance
 City of Fort Lauderdale Frequently Asked Questions Proposed Sea Wall Ordinance The City of Fort Lauderdale is considering amending the Unified Land Development Regulations of the City of Fort Lauderdale
NEW YORK AVENUE TOWN HOME SITE
 NEW YOR AVENUE TOWN HOME SITE EXCLUSIVE LISTING DELAND, FLORIDA LOCATION The Property is located in DeLand, FL on the south side of New York Avenue (SR 44) between Frankfort Avenue on the east, Fairview
2015 City of Tuscaloosa Floodplain Management Plan Tuscaloosa, Alabama
 2015 City of Tuscaloosa Floodplain Management Plan Tuscaloosa, Alabama Prepared under the direction of the City of Tuscaloosa Floodplain Management Planning Committee With the support of the City of Tuscaloosa
DAMAGE ASSESSMENT OF SAND FENCING GARDEN CITY, NORTH LITCHFIELD AND LITCHFIELD BEACH GEORGETOWN COUNTY, SC
 OF SAND FENCING GARDEN CITY, NORTH LITCHFIELD AND LITCHFIELD BEACH GEORGETOWN COUNTY, SC June 07, 2017 PREPARED FOR: GEORGETOWN COUNTY DEPARTMENT OF PUBLIC SERVICES PREPARED BY: The EARTHWORKS Group 11655
SOUTH INTERCHANGE AREA
 Santaquin City General Plan 1 Location and Characteristics The South Interchange Area of Santaquin is located west of Interstate 15 and south of 500 South (Figure 1). It includes properties already annexed
566± acres total - WILL DIVIDE Volusia County, FL
 L IC E N S E D HUNTING P RESERVE ts Q u a i l ahi ul anb l e are av r info! fo CALL TODAY LAKEFRONT PROPERTY PERFECTION This ranch lies on a natural sand ridge in North Volusia County, Florida and has
Introduction. The System. Model Limitations, Assumptions, and Parameters. Optional Services Tech Memo
 Optional Services Tech Memo Introduction This technical memo evaluates the impact of a tide gate to be installed at the confluence of the Left Bank Tributary of Thalia Creek and Lake Windsor. Specifically,
Welcome KROSNO CREEK DIVERSION PROJECT CLASS ENVIRONMENTAL ASSESSMENT
 Welcome KROSNO CREEK DIVERSION PROJECT PUBLIC INFORMATION CENTRE # 1 Tonight s Presentation Study Overview Background Existing Conditions Alternative Solutions Preliminary Preferred Solution Next Steps
Header i
 Header i 048285014.10 Header Sub Title Body Text here. Body text here. Body text here. Section 1... 1 Executive Summary... 1 Opportunities and Constraints... 3 Overall Opportunities and Constraints Map
SEA LEVEL RISE IN THE FLORIDA KEYS
 SEA LEVEL RISE IN THE FLORIDA KEYS SUSTAINABILITY AND CLIMATE MILESTONES YEAR 2014 GreenKeys! Launched YEAR 2015 SLR Data collection SLR modeling for 2030 and 2060 Community SLR Modeling Community Outreach
Brevard County Utility Services Department
 Brevard County Utility Services Department April 3, 2018 Jim Helmer, Department Director Brian Sorensen, W/WW Manager 1 Utility Services Department 9 TREATMENT PLANTS 6 WASTEWATER, 3 WATER 163 EMPLOYEES
CITY OF PORT ORANGE MONTHLY DEVELOPMENT ACTIVITY REPORT
 CITY OF PORT ORANGE MONTHLY DEVELOPMENT ACTIVITY REPORT Walmart Neighborhood Market 3811 Clyde Morris Blvd. CITY COUNCIL allen green, mayor drew bastian, vice mayor bob ford, councilman donald burnette,
Leasing Brochure. Park Plaza Shopping Center 1150 N. Federal Highway, Pompano Beach, Florida Under Construction - Coming Very Soon
 Park Plaza Shopping Center 1150 N. Federal Highway, Pompano Beach, Florida 33062 Leasing Brochure Under Construction - Coming Very Soon Exclusive Leasing Broker 2048 East Sample Road, Lighthouse Point,
Agenda Report. Spruce Street Outlet Drainage Improvements Tower Road Relief Sewer
 Agenda Report Subject: Prepared By: Spruce Street Outlet Drainage Improvements Tower Road Relief Sewer Steven M. Saunders, Director of Public Works/Village Engineer Date: August 12, 2012 On March 8, 2012
The Problem.. SuDS: Controlling the Flow. LANDF RM Technical delivery of SuDS 15/10/2013. Bridget Woods Ballard HR Wallingford 1.
 SuDS: Controlling the Flow 15th October 2013 Bridget Woods Ballard The Problem.. Page 2 Bridget Woods Ballard HR Wallingford 1 15th October 2013 Landform Event Page 3 HR Wallingford 2013 The Aim of SuDS.
Airport Planning Area
 PLANNING AREA POLICIES l AIRPORT Airport Planning Area LOCATION AND CONTEXT The Airport Planning Area ( Airport area ) is a key part of Boise s economy and transportation network; it features a multi-purpose
CITY OF PORT ORANGE MONTHLY DEVELOPMENT ACTIVITY REPORT
 CITY OF PORT ORANGE MONTHLY DEVELOPMENT ACTIVITY REPORT VyStar Credit Union 750 Dunlawton Ave. CITY COUNCIL allen green, mayor drew bastian, vice mayor bob ford, councilman donald burnette, councilman
2016 Regional Transportation Alternatives Program (TAP) Grant Application
 Grant Application") 2016 Regional Transportation Alternatives Program (TAP) Grant Application PROJECT TITLE: Yelm-Tenino Trail Extension Feasibility Study TRPC use only GENERAL PROJECT INFORMATION Agency or Organization City
2016 Regional Transportation Alternatives Program (TAP) Grant Application PROJECT TITLE: Yelm-Tenino Trail Extension Feasibility Study TRPC use only GENERAL PROJECT INFORMATION Agency or Organization City
FINAL. Bicycle/Pedestrian Feasibility Study City of DeBary Dirksen Drive Trail. Prepared For: Volusia County MPO
 City of DeBary Dirksen Drive Trail FINAL Prepared By: Reynolds, Smith and Hills, Inc. Prepared For: Volusia County MPO September 2007 Table of Contents INTRODUCTION...1 PROJECT PURPOSE AND SCOPE...2 PHYSICAL
12, 14 and 16 York Street - Amendments to Section 16 Agreement and Road Closure Authorization
 REPORT FOR ACTION 12, 14 and 16 York Street - Amendments to Section 16 Agreement and Road Closure Authorization Date: April 27, 2018 To: Toronto and East York Community Council From: Senior Strategic Director,
CITY OF PORT ORANGE MONTHLY DEVELOPMENT ACTIVITY REPORT
 CITY OF PORT ORANGE MONTHLY DEVELOPMENT ACTIVITY REPORT VyStar Credit Union 750 Dunlawton Ave. CITY COUNCIL allen green, mayor drew bastian, vice mayor bob ford, councilman donald burnette, councilman
TREASURE COAST REGIONAL PLANNING COUNCIL M E M O R A N D U M. To: Council Members AGENDA ITEM 9
 TREASURE COAST REGIONAL PLANNING COUNCIL M E M O R A N D U M To: Council Members AGENDA ITEM 9 From: Date: Subject: Staff October 21, 2016 Council Meeting South Dixie Highway Corridor Improvement Plan
Draft Year 2040 Cost Feasible Plan
 Year 2040 Plan Ranking of Desires Plan Projects And Matching of Available Revenues Palm Beach Metropolitan Planning Organization (MPO) Technical Advisory Committee (TAC) Citizens Advisory Committee (CAC)
SR 429/WEKIVA PARKWAY FTBA CONFERENCE March 20-21, Presented By Suzanne Phillips, P.E., FDOT District 5
 SR 429/WEKIVA PARKWAY FTBA CONFERENCE March 20-21, 2012 Presented By Suzanne Phillips, P.E., FDOT District 5 Project Description The Wekiva Parkway project constructs 25 centerline miles of new toll expressway.
San Martin Boulevard over Riviera Bay Project Development & Environment (PD&E) Study Update PID A
 Study Update PID A") San Martin Boulevard over Riviera Bay Development & Environment (PD&E) Study Update PID 001036A June 12, 2018 Location & Limits Unincorporated Pinellas County City of St. Petersburg 2 Overview Of Alternatives
San Martin Boulevard over Riviera Bay Development & Environment (PD&E) Study Update PID 001036A June 12, 2018 Location & Limits Unincorporated Pinellas County City of St. Petersburg 2 Overview Of Alternatives
4.0 Context for the Crossing Project
 4.0 Context for the Crossing Project This section provides background information about key features of the North Douglas Crossing project area, and opportunities and constraints. This information is important
TABLE OF CONTENTS. Coral Springs Charter High School and Middle School Job No Page 2
 Job No. 15-019 Page 2 TABLE OF CONTENTS 1.0 INTRODUCTION... 4 2.0 EXISTING CONDITIONS... 5 3.0 TRAFFIC GENERATION... 7 4.0 TRIP DISTRIBUTION... 8 5.0 FUTURE CONDITIONS... 8 6.0 SITE ACCESS...13 7.0 CONCLUSION...13
VI. ALTERNATIVES TO THE MASTER PLAN C. RENOVATED EAST BUILDING ALTERNATIVE
 VI. ALTERNATIVES TO THE MASTER PLAN C. RENOVATED EAST BUILDING ALTERNATIVE INTRODUCTION The Renovated East Building Alternative would include the continued use of the renovated West Building and the renovation
CITY COUNCIL AGENDA MEMORANDUM
 To: Mayor and City Council From: Charles Ozaki, City and County Manager Prepared By: Kevin Standbridge, Deputy City and County Manager Katie Allen, City and County Engineer David Shinneman, Community Development
Electric System Serving Pierce County Current system and future investments. Janet Olsen Steve Botts
 Electric System Serving Pierce County Current system and future investments Janet Olsen Steve Botts Project Manager Real Estate t / Rights-of-Way April 13, 2011 Presentation overview Information requested
Waukegan & Calumet Rivers. All Hands Meeting
 Waukegan & Calumet Rivers 516(e) Update All Hands Meeting David F. Bucaro, P.E. Chief, Economic Formulation & Analysis Section, Planning Branch May 18 th, 2011 Kensington Court Ann Arbor, MI 1 2 Waukegan
Macleod Trail Corridor Study. Welcome. Macleod Trail Corridor Study Open House. Presentation of Proposed Design Concepts
 Macleod Trail Corridor Study Welcome Macleod Trail Corridor Study Open House Presentation of Proposed Design Concepts Study Purpose Develop a corridor plan for Macleod Trail that aligns with The City s:
Clam Harbour Provincial Park
 Clam Harbour Provincial Park Public Engagement Session Thursday, September 14 th, 2017 5:30pm 7:30pm Webbers Store 11470 Nova Scotia Trunk 7 Lake Charlotte, NS Agenda Overview of the Provincial Parks System
Miles. Prepared by: Volusia County Sheriff's Office
 Volusia County Sheriff District 3 North 31 32 34 35 0 1.25 2.5 5 7.5 10 Volusia County Sheriff Zone 31 PECOS DR LUKE LN ACOMA DR KILLARNEY DR CR 2803 (JOHN ANDERSON DR) THE BEACH N I-95 S UTILITY DR CR
PURPOSE AND NEED (CONCURRENCE POINT 1) NEW CANADA ROAD PROJECT FROM STATE ROUTE 1 (U.S. HIGHWAY 70) TO U.S. INTERSTATE 40
 NEW CANADA ROAD PROJECT FROM STATE ROUTE 1 (U.S. HIGHWAY 70) TO U.S. INTERSTATE 40") PURPOSE AND NEED (CONCURRENCE POINT 1) NEW CANADA ROAD PROJECT FROM STATE ROUTE 1 (U.S. HIGHWAY 70) TO U.S. INTERSTATE 40 Project Description The primary purpose of this project is to improve the major
PURPOSE AND NEED (CONCURRENCE POINT 1) NEW CANADA ROAD PROJECT FROM STATE ROUTE 1 (U.S. HIGHWAY 70) TO U.S. INTERSTATE 40 Project Description The primary purpose of this project is to improve the major
ANCLOTE COASTAL TRAIL ALTERNATIVES ANALYSIS STUDY
 ANCLOTE COASTAL TRAIL ALTERNATIVES ANALYSIS STUDY PASCO COUNTY MPO JULY 2015 PROJECT OVERVIEW... INTRODUCTION EXECUTIVE SUMMARY CONTEXT... TAMPA BAY AREA, PINELLAS, & PASCO COUNTY S MULTI-USE TRAIL PLANS
FDOT Treasure Coast Traffic Report through
 FDOT Treasure Coast Traffic Report 02 26 16 through 03 04 16 Kathleen Dempsey Fri 2/26/2016 2:56 PM To:Kathleen Dempsey ; 1 attachment 355 KB CR 714_Median Access Modifications.pdf;
Lake Erie Commerce Center Traffic Analysis
 LOCATION: East of NYS Route 5 at Bayview Road Town of Hamburg Erie County, New York PREPARED BY: Wendel Companies 140 John James Audubon Parkway Suite 200 Amherst, New York 14228 January 2012 i ii Table
Completion: August 2011 LS #321 Design LS #8
 1 CIPNumber c350406 2 c350302 3 c350902 LEGEND PERMITTING/ BIDDING CHARLOTTE COUNTY UTILITIES Burnt Store Water Reclamation Facility (Expansion to 0.75 MGD) East Port Expansion Water Reclamation Facility
Land Use Context Definitions
 Land Use Context Definitions Note: The colors to the right of the land use context names refer to the mapset. Land Use Context Type Description Building Placement and Parking Land Uses Data Source Higher
5.1 Traffic and Transportation
 5.1 When it opens in 2009, the Bellevue Nickel Improvement Project will increase the number of vehicles able to travel through the study area, improve travel speeds, and improve safety by reducing the
CHAPTER 1 EXECUTIVE SUMMARY
 CHAPTER 1 EXECUTIVE SUMMARY 1 1 EXECUTIVE SUMMARY INTRODUCTION William R. Fairchild International Airport (CLM) is located approximately three miles west of the city of Port Angeles, Washington. The airport
Flood History. Floodplain Descriptions
 Flood History The worst flooding in the area took place in 1966, 1969, 1971, 1995 and 1998. The storms in 1966 and 1969 caused considerable damage throughout the area due to flooding, erosion and debris
CHAPTER III: TRAIL DESIGN STANDARDS, SPECIFICATIONS & PERMITS
 CHAPTER III Trail Design Standards, Specifications & Permits This chapter discusses trail standards, preferred surface types for different activities, permits, and other requirements one must consider
Section II. Planning & Public Process Planning for the Baker/Carver Regional Trail began in 2010 as a City of Minnetrista initiative.
 Section II Planning & Public Process Planning for the began in 2010 as a City of initiative. city staff began discussions with the Park District on the possibility of a north/south regional trail connection
NORTH FRASER PERIMETER ROAD WEST CORRIDOR DEFINITION STUDY
 NORTH FRASER PERIMETER ROAD WEST CORRIDOR DEFINITION STUDY MAY 2011 SW1132SWD NORTH FRASER PERIMETER ROAD WEST CORRIDOR DEFINITION STUDY TABLE OF CONTENTS 1.0 INTRODUCTION... 1 2.0 CURRENT TRAVEL PATTERNS
Palm Beach County Traffic Report July 13 through July 20, 2012
 For Immediate Release July 13, 2012 Meredith Cruz, (561) 641-6440 mcruz@corradino.com Palm Beach County Traffic Report July 13 through July 20, 2012 Palm Beach County Palm Beach County traffic will be
2017 TBARTA Future Regional Priority Projects Adopted by TBARTA Board, December 9, 2016
 2017 TBARTA Future Regional Priority Projects Adopted by TBARTA Board, December 9, 2016 Project numbers do not signify ranking they are for mapping identification purposes only. 1. 15th Street East The
Executive Summary. MASTER PLAN UPDATE Fort Collins-Loveland Municipal Airport
 Executive Summary MASTER PLAN UPDATE Fort Collins-Loveland Municipal Airport As a general aviation and commercial service airport, Fort Collins- Loveland Municipal Airport serves as an important niche
AGENDA ITEM 5 D WAKULLA ENVIRONMENTAL INSTITUTE (WEI) TRAIL FEASIBILITY STUDY
 TRAIL FEASIBILITY STUDY") March 19, 2018 AGENDA ITEM 5 D WAKULLA ENVIRONMENTAL INSTITUTE (WEI) TRAIL FEASIBILITY STUDY TYPE OF ITEM: Action STATEMENT OF ISSUE The Wakulla Environmental Institute (WEI) Trail is one of several trails
March 19, 2018 AGENDA ITEM 5 D WAKULLA ENVIRONMENTAL INSTITUTE (WEI) TRAIL FEASIBILITY STUDY TYPE OF ITEM: Action STATEMENT OF ISSUE The Wakulla Environmental Institute (WEI) Trail is one of several trails
April 4, 2014 Chuck McGinness, FDOT TREASURE COAST TRAFFIC REPORT April 4 through April 11, 2014
 April 4, 2014 Chuck McGinness, 954-777-4090 Chuck.McGinness@dot.state.fl.us FDOT TREASURE COAST TRAFFIC REPORT April 4 through April 11, 2014 TREASURE COAST Construction and maintenance-related lane closures
Interstate 90 and Mercer Island Mobility Study APRIL Commissioned by. Prepared by
 Interstate 90 and Mercer Island Mobility Study APRIL 2017 Commissioned by Prepared by Interstate 90 and Mercer Island Mobility Study Commissioned by: Sound Transit Prepared by: April 2017 Contents Section
SASP Advisory Committee Meeting #2
 SASP Advisory Committee Meeting #2 MnDOT Office of Aeronautics #FlyMN www.minnesotago.org 1 Agenda Introductions Progress since last meeting Assessment of Prior Efforts Objectives and Strategies Trends
Trail Feasibility Study
 VOLUSIA COUNTY MPO CITY OF NEW SMYRNA BEACH FINAL REPORT JUNE 30, 2009 Trail Feasibility Study What s inside? 1 Introduction 2 Project Purpose & Scope 3 Physical Inventory & Assessment of Right-of- Way
Memorandum. Fund Allocation Fund Programming Policy/Legislation Plan/Study Capital Project Oversight/Delivery Budget/Finance Contract/Agreement Other:
 Memorandum Date: March 23, 2018 To: Transportation Authority Board From: Eric Cordoba Deputy Director Capital Projects Subject: 4/10/18 Board Meeting: San Francisco Freeway Corridor Management Study Update
Freeway Volume-Crash Summary
 Freeway Volume-Crash Summary Twin Cities Metropolitan Area Continuation Report 22 Data Minnesota Department of Transportation Office of Traffic, Security and Operations Freeway Operations Section Regional
AUGUST 5, 2010 UPDATE # 3 AMTRAK/FEC PROJECT: STATION LOCATIONS AND CONCEPTUAL DRAWINGS
 AUGUST 5, 2010 UPDATE # 3 AMTRAK/FEC PROJECT: STATION LOCATIONS AND CONCEPTUAL DRAWINGS The Summer of 2010 has been a time of tremendous progress for the Amtrak/FEC Corridor project and its goal of restoring
A. CONCLUSIONS OF THE FGEIS
 Chapter 11: Traffic and Parking A. CONCLUSIONS OF THE FGEIS The FGEIS found that the Approved Plan will generate a substantial volume of vehicular and pedestrian activity, including an estimated 1,300
Section 106 Update Memo #1 Attachment D. Traffic Diversion & APE Expansion Methodology & Maps
 Section 106 Update Memo #1 Attachment D Traffic Diversion & APE Expansion Methodology & Maps I-65/I-70 North Split Interchange Reconstruction Project (Des. Nos. 1592385 & 1600808) Traffic Diversion and
Pump Stations...more than just pumps
 Task Force Hope Status Report Newsletter March 13, 2013 Pump Stations...more than just pumps Photo by Jerry Baggett Pump Station 11, Algiers Canal Repairs and Fronting Protection Repaired pump stations
REVISED DRAFT Integrated Hurricane Sandy General Reevaluation Report and Environmental Impact Statement. Atlantic Coast of New York
 REVISED DRAFT Integrated Hurricane Sandy General Reevaluation Report and Environmental Impact Statement Atlantic Coast of New York East Rockaway Inlet to Rockaway Inlet and Jamaica Bay Appendix F Public
Draft Concept Alternatives Analysis for the Inaugural Airport Program September 2005
 Section 10 Preferred Inaugural Airport Concept 10.0 Introduction The Preferred Inaugural Airport Concept for SSA was developed by adding the preferred support/ancillary facilities selected in Section 9
FECAL COLIFORM MONITORING IN GRAYS HARBOR COUNTY: SUMMARY REPORT OF MONITORING RESULTS FOR
 Chehalis Basin Partnership Fecal Coliform Monitoring in Grays Harbor County: Summary Report of Monitoring Results for 2000-2003 Draft June 30, 2003 Prepared by Tetra Tech/KCM, Inc. 1917 First Avenue, Seattle,
DEEP CREEK RANCH 566± acres total - WILL DIVIDE Volusia County, FL
 LICESED HUTIG PRESERVE Quail hunts are available CALL TODAY for info! LAKEFROT PROPERTY PERFECTIO This ranch lies on a natural sand ridge in orth Volusia County, Florida and has a gentle roll and boasts
CITY OF PORT ORANGE MONTHLY DEVELOPMENT ACTIVITY REPORT
 CITY OF PORT ORANGE MONTHLY DEVELOPMENT ACTIVITY REPORT Hawks Preserve Subdivision CITY COUNCIL allen green, mayor drew bastian, vice mayor bob ford, councilman donald burnette, councilman scott stiltner,
FDOT Treasure Coast Traffic Impact Report October 9 through October 16, 2015
 From: Kathleen Dempsey To: Kathleen Dempsey Subject: FDOT Treasure Coast Traffic Report 10 09 15 through 10 16 15 Date: Friday, October 09, 2015 2:10:36 PM Attachments: image003.png CR 714_Median Construction
SR 934 Project Development And Environment (PD&E) Study
 Study") SR 934 Project Development And Environment (PD&E) Study Project Advisory Group Meeting March 1, 2018 State Road 934/NE/NW 79th Street from west of I-95 (NW 13th CT) to N. Bayshore Drive PD&E STUDY SR 934/NE/NW
SR 934 Project Development And Environment (PD&E) Study Project Advisory Group Meeting March 1, 2018 State Road 934/NE/NW 79th Street from west of I-95 (NW 13th CT) to N. Bayshore Drive PD&E STUDY SR 934/NE/NW
Electric System Serving Pierce County Current system and future investments
 Electric System Serving Pierce County Current system and future investments Janet Olsen Project Manager Steve Botts Real Estate / Rights-of-Way April 13, 2011 Presentation overview Information requested
Alternatives Study of Alignment
 Project: 4-lanning of Barhi Rajauli Section of NH-31 Sheet: 1 of 6 Alternatives Study of Alignment 1 Objectives The following objectives were kept in view while locating the alternative bypass alignments:
Appendix B Connecting Track Options Evaluation Criteria
 Appendix B Connecting Track Options Evaluation Criteria 608979-853_ra_July5-0_App Title Pages.Docx TTC ASHBRIDGES BAY MAINTENANCE AND STORAGE FACILITY CONNECTING TRACK ROUTE ALTERNATIVE - EVAULATION MATRIX.0
Stage 2 ION: Light Rail Transit (LRT) from Kitchener to Cambridge
 from Kitchener to Cambridge") Stage 2 ION: Light Rail Transit (LRT) from Kitchener to Cambridge Public Consultation Centre (PCC) No. 3 Please Sign-in Cambridge City Hall November 21, 2017 2:00 to 8:00pm Preston Memorial Auditorium
Stage 2 ION: Light Rail Transit (LRT) from Kitchener to Cambridge Public Consultation Centre (PCC) No. 3 Please Sign-in Cambridge City Hall November 21, 2017 2:00 to 8:00pm Preston Memorial Auditorium
SITE ELEVATION AMSL...Ground Elevation in feet AMSL STRUCTURE HEIGHT...Height Above Ground Level OVERALL HEIGHT AMSL...Total Overall Height AMSL
 ******************************************** * Federal Airways & Airspace * * Summary Report * ******************************************** File: User Assigned File Name Latitude: NAD83 Coordinate Longitude:
Airport Obstruction Standards
 Airport Obstruction Standards Dr. Antonio Trani Department of Civil and Environmental Engineering Virginia Tech Outline of this Presentation Obstructions to navigation around airports Discussion of Federal
LAUNCH OF THE COASTAL ZONE MANAGEMENT TRUST
 A 60km stretch of coastline on the Yucatan Peninsula of Mexico is the testing ground for an idea that could protect fragile environments around the world: insuring coral reefs. The Economist World Ocean
MONTEREY REGIONAL AIRPORT MASTER PLAN TOPICAL QUESTIONS FROM THE PLANNING ADVISORY COMMITTEE AND TOPICAL RESPONSES
 MONTEREY REGIONAL AIRPORT MASTER PLAN TOPICAL QUESTIONS FROM THE PLANNING ADVISORY COMMITTEE AND TOPICAL RESPONSES Recurring topics emerged in some of the comments and questions raised by members of the
March 2, The Honorable Mayor Williams D. Sessoms, Jr. Members of City Council. Subject: Coastal CIP Presentation to City Council - March 6, 2018
 OFFICE OF THE CITY MANAGER (757) 385-4242 (757) 427-5626 FAX MUNICIPAL CENTER BUILDING 1, ROOM 234 2401 COURTHOUSE DRIVE VIRGINIA BEACH, VA 23456-9001 March 2, 2018 The Honorable Mayor Williams D. Sessoms,
Project Management, Environmental Assessment, Stormwater Management. Hydrologic Modelling. Natural Heritage. Fluvial Geomorphology
 Welcome PUBLIC INFORMATION CENTRE # 1 KROSNO CREEK DIVERSION PROJECT February 19, 2014 6:30 p.m. to 8:30 p.m. Please sign in on the sheet provided. Then feel free to walk around and view the displays.
Alternative Highest & Best Use Analysis Boutique Hotel
 Alternative Highest & Best Use Analysis In response to numerous comments received from the public, as well as issues raised by the CCC in the Appeal Staff Report Substantial Issue Determination, the following
United States Department of the Interior National Park Service. Boundary Expansion Listed in National Register January 11, 2017
 NPS Form 10900-a (Rev. 8/2002) OMB No. 10240018 United States Department of the Interior National Park Service Boundary Expansion Listed in National Register January 11, 2017 National Register of Historic
ROAD AND TRAIL PROJECT APPROVAL
 ROAD AND TRAIL PROJECT APPROVAL www.marincountyparks.org Marin County Parks, 3501 Civic Center Dr, Suite 260, San Rafael, CA 94903 DATE: July 12, 2017 PRESERVE: Gary Giacomini Open Space Preserve PROJECT: