Southern Oregon Transportation Engineering, LLC
|
|
|
- Sabrina Dawson
- 5 years ago
- Views:
Transcription
1 Southern Oregon Transportation Engineering, LLC 112 Monterey Drive - Medford, Or Office Cell Kwkp1@Q.com August 12, 2013 Mike Faught, Public Works Department City of Ashland 51 Winburn Way Ashland, Oregon RE: Post Road Diet Assessment January to Present Southern Oregon Transportation Engineering, LLC was retained by the City of Ashland to perform an on-going assessment of how the road diet on North Main Street is operating since it was implemented in September of The evaluation criteria, set forth by Kittelson & Associates, included the following measures: Improve Safety Reduce the annual average number and severity of crashes on North Main Street. Reduce Vehicle Speeds Reduce the 85 th Percentile Speed closer to the posted speed of 25 mph. Increase Bicycle and Pedestrian Volumes An increase in bicycle and pedestrian volumes during the trial period would indicate an element of success at better serving all modes along North Main Street. Maintain Acceptable Vehicle Travel Time Maintain an average vehicle travel time of 4 minutes and 20 seconds or less from Helman Street to the northern city limits. Gain Community Support Achieve an increase in support for keeping the road diet after the trial period. Background The City hired Kittelson & Associates in 2012 to establish evaluation criteria for the North Main Street Road Diet pilot project and collect data on North Main Street prior to implementation of the road diet. In late September of 2012, construction began to implement the road diet and it was finished by the end of October of Volunteers and staff collected monthly pedestrian and bicycle data from October of 2012 to the present date. Southern Oregon Transportation Engineering, LLC was hired by the City in January of 2013 to collect operational data on North Main Street and provide an assessment in October of 2013 regarding the road diet performance over a one-year trial period.
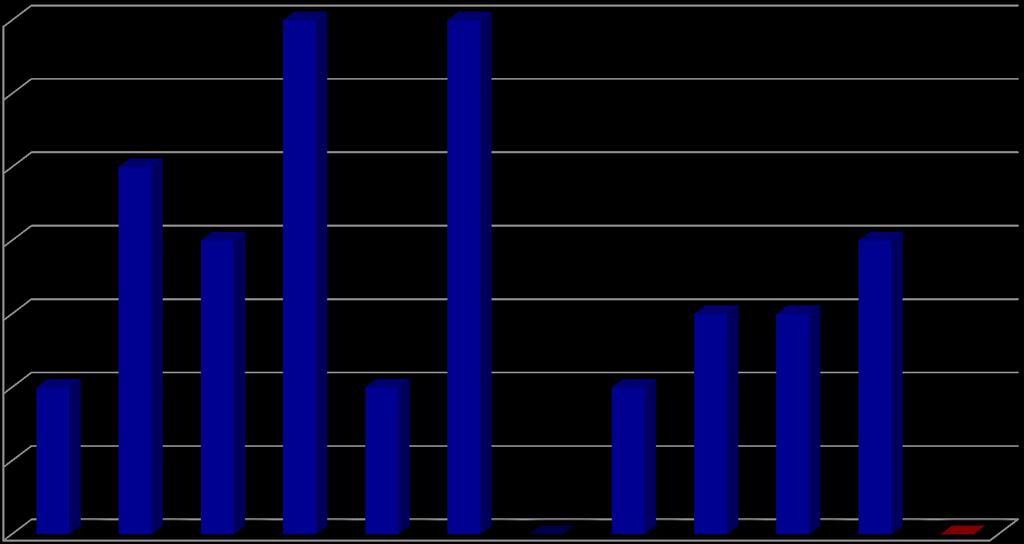
2 Data Collection Monthly data collection since January of 2013 includes: Side street delays during the PM peak hour (seconds per vehicle) Side street queue lengths during the PM peak hour (number of vehicles waiting at any one time) Main Street delays and queue lengths during the PM peak hour Intersection level of services during the PM peak hour (A-F) Available gaps on Main Street for side street traffic during the PM peak hour Average travel times during the AM and PM peak hours 85 th percentile speeds Average daily traffic (ADT) volumes Quarterly data collection since January of 2013 includes: Side street average daily traffic volumes Side street delays during the AM peak hour (seconds per vehicle) Side street queue lengths during the AM peak hour (number of vehicles waiting at any one time) Pre vs. Post Road Diet - North Main Street Performance Crash Data The North Main Street corridor between Schofield Street and Helman Street experienced 120 reported crashes in the most recent 10-year period (2002 to 2012), or an average of 12 crashes per year. A fatality resulted from a collision in June of 2005 between Schofield and Sheridan. The location with the highest occurrence during that 10-year period was shown at the stop-controlled intersection of Wimer/Hersey/Main Street, where there were 39 reported crashes with a maximum of 7 crashes in any one single year. Since October of 2012 there have been 3 reported crashes on North Main Street between Schofield Street and Helman Street. All 3 crashes occurred at the signalized intersection of Maple/Main Street. Two were rear-end collisions and one an angle collision. None of the crashes involved injury. Comparison graphs show before and after results in the following pages. S.O. Transportation Engineering, LLC August 12, 2013 Post Road Diet Assessment 2


3 Crashes in Corridor

4 Crashes at Hersey/Wimer/Main
5 Pedestrian/Bicycle Activity One of the motivations for the North Main Street road diet is to make it easier and more attractive for bicyclists and pedestrians to use North Main Street. An increase in these volumes would be an indication of better serving all modes of travel. Prior to implementation of the road diet, pedestrian and bicyclist volumes were gathered during peak periods at the intersections of Laurel/Main and Maple/Main. There were 36 pedestrians and 26 bicyclists counted during a 2-hour peak period at Main/Laurel and 17 pedestrians and 22 bicyclists at Main/Maple along North Main Street. Since implementation of the road diet, pedestrian and bicyclist volumes have fluctuated up and down throughout the trial period, but have shown an overall increase since May. A more accurate comparison will occur when data is collected in September of 2013 since this is the month that data was collected before the road diet was implemented. Volume fluctuations to date are shown in the following graphs. S.O. Transportation Engineering, LLC August 12, 2013 Post Road Diet Assessment 5
6
7
8 85 th Percentile Speed Before implementation of the road diet, the 85 th percentile speed on North Main Street was measured to be 31 miles per hour (mph) northbound and 32 mph southbound at a location just north of Coolidge Street. Since January of 2013 the 85 th percentile speed has been measured each month at the same location for comparison purposes and has decreased slightly to date. The 85 th percentile speed in June was measured to be 29 mph northbound and 30 mph southbound. Corridor Travel Times Travel times were measured along North Main Street between Valley View Road-Maple Street and Maple Street-Helman Street in both directions before implementation of the road diet. Travel times have continued to be measured each month since January of 2013 for comparison purposes. Results are provided in Table 1. Table 1 Travel Time Comparisons North Main Street Segment Length (Miles) Existing without Road Diet Travel Times (Seconds) Proposed with Road Diet Actual with Road Diet (to date) Helman Street to Maple Street (NB) Maple Street to Valley View Road (NB) Total Travel Time (NB) Valley View Road to Maple Street (SB) Maple Street to Helman Street (SB) Total Travel Time (SB) As can be seen in Table 1, travel times along North Main Street have remained fairly unchanged since implementation of the road diet. More detailed information is provided in a data summary sheet at the end of this report, which shows travel times for each month from January of 2013 to date. A more accurate comparison will occur when travel times are measured in September of 2013 and compared to September of 2012 travel times taken prior to implementation of the road diet. Intersection Level of Service Traffic operations were evaluated at key intersections along North Main Street before implementation of the road diet and estimated for post-road diet conditions. Intersection operations have been evaluated each month since January of 2013 at the most critical intersection (Wimer/Hersey/Main) and in August of 2013 at all other intersections for comparison purposes. The worst operations to date were reported in Tables 2 and 3, and compared to what was reported for pre-road diet conditions and proposed road diet conditions. S.O. Transportation Engineering, LLC August 12, 2013 Post Road Diet Assessment 8
9 Table 2 North Main Street Arterial Operations PM Peak Hour Intersection Measure Existing without Road Diet Traffic Operations Proposed with Road Diet Actual with Road Diet (to date) LOS (A-F) B C B North Main Street SB/NB Speed (mph) Travel Time (sec) Table 3 North Main Street Intersection Operations PM Peak Hour Intersection Measure Existing without Road Diet Traffic Operations Proposed with Road Diet Actual with Road Diet (to date) LOS A B B Maple Street/North Main Street V/C Delay (sec/veh) LOS B C C Glenn Street/Main Street Hersey/Wimer/Main Street Manzanita Street/Main Street Laurel Street/Main Street V/C Delay (sec/veh) From Glenn-WB LOS F E D V/C Delay (sec/veh) From Wimer-EB Delay (sec/veh) From Hersey-WB LOS E D C V/C Delay (sec/veh) From Manzanita-EB LOS A A A V/C Note: Bold, italic results reflects operations that exceed performance standards Delay (sec/veh) As can be seen in Tables 2 and 3, arterial and intersection operations have improved to date since implementation of the road diet. Actual intersection operations have been better than estimated by Kittelson & Associates in their June of 2011 memorandum. S.O. Transportation Engineering, LLC August 12, 2013 Post Road Diet Assessment 9
10 Corridor Queuing Queuing is the stacking up of vehicles for a given lane movement. Queue lengths are reported as the average, maximum, or 95 th percentile queue length to the nearest 25- foot increment. Each 25-foot increment represents a single vehicle. 95 th percentile queue lengths were measured at key intersections prior to the road diet and estimated for post-road diet conditions. Average and maximum queue lengths have been measured each month since January of 2013 at the most critical intersection (Wimer/Hersey/Main) and in August of 2013 at all other intersections. The worst queue lengths to date were reported in Table 4 and compared to pre-road diet conditions and proposed road diet conditions. Table 4 North Main Street Corridor Queue Lengths Intersection Movement Existing without Road Diet Queue Lengths (Feet) Proposed with Road Diet Actual with Road Diet (to date) NBT Maple Street/North Main Street SBT EB NA WB NA NBL Glenn Street/Main Street SBL EB WB NBL Hersey/Wimer/Main Street SBL EB WB NBL Manzanita Street/Main Street SBTR EB WB NB Laurel Street/Main Street SB EB WB S.O. Transportation Engineering, LLC August 12, 2013 Post Road Diet Assessment 10
11 Proposed design changes Effort continues to be made to improve the road diet and make it more efficient. A design change is being considered at the intersection of Bush Street/Main Street to transition the road diet cross section further to the south so that a northbound left turn pocket can be added at Bush Street. Other considerations include replacing exclusive left turn pockets with center two-way-left-turn-lanes, re-aligning driveways to avoid conflicting left turn movements, and improving sight distance at intersections to increase visibility for side street traffic. In summary, data collected to date includes: Corridor Travel Times Side Street Delay Main Street Delay Intersection Capacity and Level of Service Corridor Level of Service Corridor 85 th Percentile Speeds Intersection Queuing and Blocking Main Street Available Gaps Pedestrian Volumes Bicyclist Volumes Main Street Peak Hour and Average Daily Traffic Volumes Side Street Peak Hour and Average Daily Traffic Volumes Additional considerations to date include: Design Modifications Intersection Sight Distances Citizen Requests A summary of corridor travel times, side street and Main Street delays, and available gaps is provided on the following page. S.O. Transportation Engineering, LLC August 12, 2013 Post Road Diet Assessment 11
12 Pre/PostRoadDietDataSummary2013 Pre Jan Feb March April May June July Aug Sept Oct Segment TravelTimeSouthbound ValleyViewMapleStreet(min) 2:18 2:18 2:20 2:20 2:21 2:34 2:25 2:18 ValleyViewMapleStreet(MPH) MapleStreetHelmanStreet(min) 1:32 1:28 1:27 1:30 1:32 1:33 1:29 1:32 MapleStreetHelmanStreet(MPH) Segment TravelTimeNorthbound ValleyViewMapleStreet(min) 2:27 2:12 2:19 2:22 2:20 2:22 2:24 2:24 ValleyViewMapleStreet(MPH) MapleStreetHelmanStreet(min) 1:22 1:26 1:28 1:23 1:25 1:23 1:27 1:27 MapleStreetHelmanStreet(MPH) SideStreetStoppedDelay WimerDelay PM PM PM PM PM AM PM PM AvgStoppedTime(sec) MaxStoppedTime(sec) AvgQueue(veh) MaxQueue(veh) HerseyDelay Left/Throughs All AvgStoppedTime(sec) MaxStoppedTime(sec) AvgQueue(veh) MaxQueue(veh) RightTurns AvgStoppedTime(sec) MaxStoppedTime(sec) AvgQueue(veh) MaxQueue(veh) NorthMainStreetDelay NorthboundLefts NumberofTurns(veh) NA 94 NA NA NA 72 AvgStoppedTime(sec) NA 7.81 NA NA NA MaxStoppedTime(sec) NA 59 NA NA NA 72 AvgQueue(veh) 1 NA 1 NA 1 1 NA NA 1 MaxQueue(veh) 3 NA 3 NA 2 1 NA NA 3 SouthboundLefts NumberofTurns(veh) NA 144 NA NA NA 136 AvgStoppedTime(sec) NA NA NA NA 9.29 MaxStoppedTime(sec) NA 47 NA NA NA 75 AvgQueue(veh) 2 NA 1 NA 1 1 NA NA 1 MaxQueue(veh) 7 NA 3 NA 4 3 NA NA 4 NorthMainStreetGapsatHersey/Wimer Direction PM PM PM PM PM AM PM PM Southbound Northbound Combined
13 No recommendation is proposed until the fall of 2013 when data has been collected and evaluated for a full one-year trial period. This letter provides a summary of collected data resultss to date. If you have any questions or concerns with this assessment, please feell free to contact me. Sincerely, Kimberly Parducci, PE PTOE Southern Oregon Transportation Engineering, LLC Attachments: Data Output S.O. Transportation Engineering, LLC August 12, 2013 Post Road Diett Assessment 13
14 Southern Oregon Transportation. Engineering, LLC Medford, Or Hersey Approach Lane 1: Left/Throughs Lane 2: Right Turns Weather: Sunny, Warm File Name : Hersey_SD_July Site Code : Start Date : 7/11/2013 Page No : 1 L No. Joined Queue Released From Delay n. Queue 1 1 3:39:55 PM 3:40:43 PM :48:06 PM 3:48:10 PM :02:18 PM 4:03:21 PM :06:41 PM 4:07:30 PM :18:46 PM 4:18:51 PM :27:29 PM 4:27:34 PM :33:34 PM 4:33:52 PM :58:50 PM 4:58:53 PM :31:01 PM 3:31:02 PM :31:37 PM 3:32:01 PM :31:54 PM 3:32:10 PM :31:56 PM 3:32:14 PM :32:21 PM 3:32:24 PM :34:29 PM 3:34:47 PM :34:38 PM 3:34:55 PM :34:46 PM 3:35:04 PM :34:57 PM 3:35:08 PM :36:05 PM 3:36:07 PM :37:12 PM 3:37:16 PM :37:54 PM 3:38:26 PM :38:05 PM 3:38:31 PM :38:10 PM 3:38:36 PM :38:18 PM 3:38:41 PM :38:44 PM 3:38:46 PM :38:47 PM 3:38:49 PM :39:05 PM 3:39:24 PM :39:09 PM 3:39:29 PM :39:14 PM 3:39:41 PM :39:23 PM 3:39:55 PM :39:43 PM 3:40:44 PM :40:52 PM 3:40:52 PM :42:50 PM 3:43:05 PM :43:17 PM 3:43:19 PM :43:24 PM 3:43:26 PM :44:28 PM 3:44:35 PM :45:46 PM 3:45:47 PM :46:24 PM 3:46:26 PM :46:46 PM 3:47:01 PM :47:09 PM 3:47:11 PM :47:32 PM 3:47:55 PM :47:39 PM 3:48:04 PM :48:12 PM 3:48:14 PM :48:47 PM 3:48:59 PM :48:53 PM 3:49:09 PM :49:13 PM 3:49:36 PM :50:11 PM 3:50:12 PM :52:09 PM 3:52:18 PM :52:40 PM 3:52:49 PM :53:34 PM 3:53:40 PM :54:58 PM 3:55:00 PM :56:00 PM 3:56:08 PM :56:04 PM 3:56:13 PM :56:41 PM 3:56:43 PM :58:19 PM 3:58:23 PM :58:33 PM 3:58:36 PM 3
15 Southern Oregon Transportation. Engineering, LLC Medford, Or Hersey Approach Lane 1: Left/Throughs Lane 2: Right Turns Weather: Sunny, Warm File Name : Hersey_SD_July Site Code : Start Date : 7/11/2013 Page No : 2 L No. Joined Queue Released From Delay n. Queue :59:09 PM 3:59:34 PM :59:29 PM 3:59:36 PM :00:37 PM 4:00:46 PM :01:47 PM 4:02:11 PM :02:21 PM 4:02:23 PM :03:47 PM 4:03:49 PM :05:59 PM 4:05:59 PM :06:00 PM 4:06:01 PM :06:28 PM 4:06:49 PM :07:14 PM 4:07:16 PM :07:34 PM 4:07:55 PM :08:35 PM 4:08:36 PM :08:38 PM 4:08:39 PM :09:22 PM 4:09:28 PM :09:34 PM 4:09:36 PM :09:39 PM 4:09:41 PM :10:11 PM 4:10:14 PM :10:42 PM 4:10:51 PM :10:56 PM 4:10:58 PM :11:37 PM 4:11:57 PM :11:48 PM 4:12:02 PM :11:53 PM 4:12:03 PM :12:05 PM 4:12:07 PM :12:27 PM 4:12:39 PM :12:51 PM 4:13:12 PM :14:21 PM 4:14:30 PM :14:25 PM 4:14:36 PM :15:14 PM 4:15:23 PM :15:29 PM 4:15:30 PM :15:35 PM 4:15:55 PM :15:49 PM 4:15:57 PM :16:18 PM 4:16:22 PM :16:41 PM 4:16:43 PM :18:25 PM 4:18:26 PM :18:29 PM 4:18:36 PM :18:34 PM 4:18:49 PM :21:10 PM 4:21:11 PM :23:35 PM 4:23:40 PM :23:42 PM 4:23:45 PM :24:34 PM 4:24:39 PM :25:05 PM 4:25:06 PM :26:04 PM 4:26:05 PM :26:11 PM 4:26:12 PM :26:27 PM 4:27:08 PM :26:49 PM 4:27:11 PM :26:51 PM 4:27:21 PM :27:16 PM 4:27:31 PM :28:38 PM 4:28:40 PM :28:48 PM 4:28:57 PM :30:38 PM 4:30:46 PM :31:29 PM 4:31:30 PM :32:17 PM 4:32:25 PM :32:31 PM 4:32:33 PM :32:47 PM 4:32:49 PM :32:54 PM 4:33:05 PM 11
16 Southern Oregon Transportation. Engineering, LLC Medford, Or Hersey Approach Lane 1: Left/Throughs Lane 2: Right Turns Weather: Sunny, Warm File Name : Hersey_SD_July Site Code : Start Date : 7/11/2013 Page No : 3 L No. Joined Queue Released From Delay n. Queue :33:33 PM 4:33:36 PM :34:15 PM 4:34:19 PM :34:57 PM 4:34:57 PM :35:03 PM 4:35:17 PM :35:06 PM 4:35:18 PM :35:38 PM 4:35:40 PM :36:01 PM 4:36:02 PM :36:35 PM 4:36:39 PM :37:03 PM 4:37:07 PM :37:10 PM 4:37:14 PM :37:50 PM 4:38:07 PM :37:58 PM 4:38:08 PM :38:01 PM 4:38:11 PM :38:36 PM 4:38:43 PM :38:47 PM 4:38:50 PM :39:08 PM 4:39:32 PM :39:33 PM 4:39:38 PM :40:30 PM 4:40:40 PM :40:45 PM 4:40:49 PM :41:04 PM 4:41:11 PM :41:43 PM 4:41:51 PM :43:18 PM 4:43:36 PM :43:41 PM 4:43:48 PM :43:46 PM 4:43:50 PM :45:00 PM 4:45:56 PM :46:08 PM 4:46:10 PM :46:42 PM 4:46:59 PM :48:10 PM 4:48:30 PM :48:10 PM 4:48:32 PM :48:26 PM 4:48:48 PM :49:01 PM 4:49:28 PM :50:35 PM 4:50:49 PM :51:05 PM 4:51:06 PM :52:14 PM 4:52:20 PM :52:56 PM 4:53:48 PM :54:16 PM 4:54:42 PM :56:04 PM 4:56:14 PM :56:16 PM 4:56:18 PM :56:40 PM 4:56:49 PM :57:52 PM 4:58:05 PM :59:08 PM 4:59:14 PM :02:43 PM 5:03:14 PM :02:49 PM 5:03:22 PM :04:14 PM 5:04:21 PM :05:18 PM 5:05:23 PM :05:35 PM 5:05:49 PM :05:54 PM 5:06:15 PM :06:27 PM 5:07:15 PM :06:59 PM 5:07:23 PM :07:09 PM 5:07:27 PM :08:22 PM 5:08:25 PM :09:45 PM 5:09:51 PM :10:50 PM 5:11:12 PM :12:18 PM 5:12:20 PM :12:34 PM 5:12:36 PM 2
17 Southern Oregon Transportation. Engineering, LLC Medford, Or Hersey Approach Lane 1: Left/Throughs Lane 2: Right Turns Weather: Sunny, Warm File Name : Hersey_SD_July Site Code : Start Date : 7/11/2013 Page No : 4 L No. Joined Queue Released From Delay n. Queue :13:23 PM 5:13:28 PM :13:26 PM 5:13:32 PM :13:37 PM 5:13:41 PM :13:52 PM 5:13:56 PM :14:32 PM 5:14:43 PM :14:40 PM 5:14:53 PM :14:51 PM 5:15:00 PM :17:05 PM 5:17:28 PM :17:27 PM 5:17:48 PM :17:38 PM 5:18:32 PM :18:53 PM 5:19:56 PM :19:08 PM 5:20:04 PM :19:28 PM 5:20:08 PM :20:11 PM 5:20:33 PM :20:15 PM 5:20:45 PM :20:16 PM 5:20:52 PM :22:33 PM 5:22:34 PM :23:30 PM 5:23:32 PM :23:53 PM 5:23:56 PM :25:36 PM 5:25:58 PM :25:42 PM 5:25:59 PM :26:00 PM 5:26:07 PM :26:31 PM 5:26:42 PM :27:19 PM 5:27:22 PM :27:43 PM 5:27:47 PM :28:44 PM 5:28:48 PM :28:53 PM 5:29:00 PM :29:41 PM 5:29:43 PM :30:08 PM 5:30:26 PM :30:38 PM 5:30:41 PM 3 Summary Information: 3:31:00 PM - 5:31:00 PM Left/Through Right Total Vehicle Count: Delayed Vehicle Count: Through Vehicle Count: 0 0 Average Stopped Time: Maximum Stopped Time: Min. Secs. for Delay: 0 0 Average Queue: Queue Density: Maximum Queue: 1 4 Delay in Vehicle Hour: Total Delay:
18 Wimer Approach Lane 1: Left/Through/Right Weather: Sunny, Warm Stop Sign Delay Study L No. Joined Queue Released From Delay n. Queue 1 1 3:32:01 PM 3:32:03 PM :36:36 PM 3:36:41 PM :37:18 PM 3:37:20 PM :38:45 PM 3:38:53 PM :40:22 PM 3:40:48 PM :40:37 PM 3:40:49 PM :41:55 PM 3:42:00 PM :43:37 PM 3:43:46 PM :43:51 PM 3:43:54 PM :43:55 PM 3:43:58 PM :46:07 PM 3:46:08 PM :47:37 PM 3:47:45 PM :48:08 PM 3:48:14 PM :53:00 PM 3:53:01 PM :54:09 PM 3:54:23 PM :54:42 PM 3:55:14 PM :56:04 PM 3:56:14 PM :58:56 PM 3:58:57 PM :00:47 PM 4:01:03 PM :00:53 PM 4:01:15 PM :01:08 PM 4:01:49 PM :01:52 PM 4:01:58 PM :02:59 PM 4:03:18 PM :03:48 PM 4:03:56 PM :04:00 PM 4:04:24 PM :05:42 PM 4:05:43 PM :05:46 PM 4:05:54 PM :06:48 PM 4:06:51 PM :11:19 PM 4:11:28 PM :11:41 PM 4:12:02 PM :16:53 PM 4:17:14 PM :16:55 PM 4:17:15 PM :20:45 PM 4:20:51 PM :21:44 PM 4:21:53 PM :23:19 PM 4:23:47 PM :24:53 PM 4:24:59 PM :26:39 PM 4:26:41 PM :26:54 PM 4:26:56 PM :28:32 PM 4:28:35 PM :29:34 PM 4:29:40 PM :30:27 PM 4:30:29 PM :31:31 PM 4:31:40 PM :32:09 PM 4:32:18 PM :33:43 PM 4:33:45 PM :34:02 PM 4:34:04 PM :37:05 PM 4:37:23 PM :38:18 PM 4:38:19 PM :40:30 PM 4:40:35 PM :42:17 PM 4:42:28 PM :43:36 PM 4:43:41 PM :43:49 PM 4:44:12 PM :45:40 PM 4:46:00 PM :45:58 PM 4:46:03 PM :46:25 PM 4:46:26 PM :47:02 PM 4:47:15 PM :48:55 PM 4:49:02 PM :50:06 PM 4:50:29 PM :52:56 PM 4:53:15 PM :54:20 PM 4:54:36 PM :54:52 PM 4:55:00 PM :55:12 PM 4:55:19 PM :57:11 PM 4:57:13 PM 2 S.O.Transportation Engineering, LLC Medford, Oregon File Name : Wimer_SD_July Site Code : Start Date : 7/11/2013 Page No : 1
19 Wimer Approach Lane 1: Left/Through/Right Weather: Sunny, Warm Stop Sign Delay Study S.O.Transportation Engineering, LLC Medford, Oregon File Name : Wimer_SD_July Site Code : Start Date : 7/11/2013 Page No : 2 L No. Joined Queue Released From Delay n. Queue :57:15 PM 4:57:45 PM :00:30 PM 5:01:06 PM :00:34 PM 5:01:07 PM :03:24 PM 5:03:32 PM :04:33 PM 5:04:36 PM :08:47 PM 5:08:53 PM :10:25 PM 5:10:30 PM :10:36 PM 5:11:14 PM :11:12 PM 5:12:15 PM :12:02 PM 5:12:27 PM :12:06 PM 5:12:31 PM :12:13 PM 5:14:03 PM :15:07 PM 5:15:26 PM :15:25 PM 5:16:17 PM :16:49 PM 5:16:50 PM :18:19 PM 5:19:06 PM :19:26 PM 5:21:27 PM :22:11 PM 5:22:13 PM :22:37 PM 5:23:21 PM :23:14 PM 5:30:39 PM :24:48 PM 5:32:31 PM 20 Summary Information: 3:32:00 PM - 5:33:00 PM Lane 1 Total Vehicle Count: 83 Delayed Vehicle Count: 83 Through Vehicle Count: 0 Average Stopped Time: Maximum Stopped Time: 121 Min. Secs. for Delay: 0 Average Queue: 0.31 Queue Density: 1.29 Maximum Queue: 4 Delay in Vehicle Hour: 0.19 Total Delay: 1372
20 Southern Oregon Transportation. Engineering, LLC Medford, Or N. Main Street at Hersey/Wimer Lane 1: Northbound Lefts Lane 2: Southbound Lefts Stop Sign Delay Study File Name : N Main_SD_July Site Code : Start Date : 7/11/2013 Page No : 1 L No. Joined Queue Released From Delay n. Queue 1 1 3:29:43 PM 3:29:58 PM :29:53 PM 3:30:10 PM :33:27 PM 3:33:27 PM :33:47 PM 3:33:57 PM :37:52 PM 3:37:59 PM :38:04 PM 3:38:05 PM :39:59 PM 3:40:02 PM :47:08 PM 3:47:10 PM :48:01 PM 3:48:11 PM :49:23 PM 3:49:24 PM :49:38 PM 3:49:42 PM :50:29 PM 3:50:31 PM :51:02 PM 3:51:10 PM :52:26 PM 3:53:38 PM :53:58 PM 3:54:30 PM :54:35 PM 3:54:35 PM :55:17 PM 3:55:19 PM :56:51 PM 3:57:05 PM :57:40 PM 3:57:50 PM :58:08 PM 3:58:11 PM :59:35 PM 3:59:51 PM :01:10 PM 4:01:13 PM :02:35 PM 4:02:41 PM :02:48 PM 4:02:51 PM :06:07 PM 4:06:08 PM :07:29 PM 4:07:33 PM :11:28 PM 4:11:32 PM :13:30 PM 4:13:32 PM :20:46 PM 4:20:48 PM :20:57 PM 4:20:58 PM :22:06 PM 4:22:20 PM :23:14 PM 4:23:29 PM :26:13 PM 4:26:20 PM :35:12 PM 4:35:58 PM :35:27 PM 4:36:00 PM :36:11 PM 4:36:17 PM :37:21 PM 4:37:24 PM :41:13 PM 4:41:25 PM :42:22 PM 4:42:23 PM :44:49 PM 4:44:52 PM :46:24 PM 4:47:09 PM :48:31 PM 4:48:38 PM :48:35 PM 4:48:40 PM :48:44 PM 4:48:45 PM :49:26 PM 4:49:38 PM :49:27 PM 4:49:42 PM :50:25 PM 4:50:45 PM :51:15 PM 4:51:24 PM :52:56 PM 4:52:57 PM :59:41 PM 5:00:10 PM :59:50 PM 5:00:20 PM :00:36 PM 5:01:01 PM :01:32 PM 5:01:34 PM :02:16 PM 5:02:21 PM :06:22 PM 5:06:48 PM 26
21 Southern Oregon Transportation. Engineering, LLC Medford, Or N. Main Street at Hersey/Wimer Lane 1: Northbound Lefts Lane 2: Southbound Lefts Stop Sign Delay Study File Name : N Main_SD_July Site Code : Start Date : 7/11/2013 Page No : 2 L No. Joined Queue Released From Delay n. Queue :06:31 PM 5:07:22 PM :06:47 PM 5:07:27 PM :06:59 PM 5:07:31 PM :07:47 PM 5:07:54 PM :13:59 PM 5:14:00 PM :14:51 PM 5:15:19 PM :15:24 PM 5:15:26 PM :16:01 PM 5:16:03 PM :16:26 PM 5:17:15 PM :18:57 PM 5:18:59 PM :19:44 PM 5:19:57 PM :21:10 PM 5:21:11 PM :21:45 PM 5:22:21 PM :22:22 PM 5:22:23 PM :22:58 PM 5:23:00 PM :27:04 PM 5:27:04 PM :28:44 PM 5:28:59 PM :30:13 PM 3:30:14 PM :31:37 PM 3:31:38 PM :32:11 PM 3:32:13 PM :32:15 PM 3:32:16 PM :32:54 PM 3:32:58 PM :33:50 PM 3:33:50 PM :34:49 PM 3:34:49 PM :35:12 PM 3:35:13 PM :36:20 PM 3:36:21 PM :37:55 PM 3:37:59 PM :39:46 PM 3:40:16 PM :41:25 PM 3:41:26 PM :42:23 PM 3:42:29 PM :42:42 PM 3:42:44 PM :43:40 PM 3:43:42 PM :44:45 PM 3:44:57 PM :48:08 PM 3:48:09 PM :48:39 PM 3:48:40 PM :53:05 PM 3:53:12 PM :53:07 PM 3:53:14 PM :53:08 PM 3:54:02 PM :53:34 PM 3:54:09 PM :54:14 PM 3:54:16 PM :55:20 PM 3:55:48 PM :56:04 PM 3:56:16 PM :57:08 PM 3:57:18 PM :58:15 PM 3:58:17 PM :59:47 PM 4:00:06 PM :00:16 PM 4:00:17 PM :00:20 PM 4:00:22 PM :00:24 PM 4:00:25 PM :00:37 PM 4:00:58 PM :01:00 PM 4:01:01 PM :03:02 PM 4:03:05 PM :03:06 PM 4:03:08 PM :03:26 PM 4:03:27 PM :04:24 PM 4:04:58 PM :05:01 PM 4:05:04 PM 3
22 Southern Oregon Transportation. Engineering, LLC Medford, Or N. Main Street at Hersey/Wimer Lane 1: Northbound Lefts Lane 2: Southbound Lefts Stop Sign Delay Study File Name : N Main_SD_July Site Code : Start Date : 7/11/2013 Page No : 3 L No. Joined Queue Released From Delay n. Queue :05:16 PM 4:05:17 PM :05:18 PM 4:05:19 PM :06:13 PM 4:06:18 PM :08:20 PM 4:08:49 PM :09:29 PM 4:09:30 PM :09:58 PM 4:10:13 PM :12:18 PM 4:12:24 PM :12:21 PM 4:12:28 PM :14:11 PM 4:14:13 PM :14:58 PM 4:15:15 PM :15:01 PM 4:15:18 PM :15:03 PM 4:15:21 PM :15:14 PM 4:15:24 PM :15:45 PM 4:15:49 PM :16:34 PM 4:16:35 PM :17:42 PM 4:17:42 PM :17:51 PM 4:17:54 PM :17:58 PM 4:17:59 PM :20:14 PM 4:20:18 PM :22:13 PM 4:22:26 PM :22:16 PM 4:22:28 PM :22:37 PM 4:22:38 PM :23:11 PM 4:23:32 PM :24:13 PM 4:24:14 PM :25:04 PM 4:25:05 PM :25:33 PM 4:25:37 PM :25:54 PM 4:26:20 PM :28:12 PM 4:28:25 PM :28:53 PM 4:28:54 PM :29:40 PM 4:29:41 PM :30:09 PM 4:30:14 PM :31:13 PM 4:31:15 PM :31:51 PM 4:32:15 PM :34:05 PM 4:34:06 PM :34:07 PM 4:34:08 PM :34:18 PM 4:34:19 PM :35:42 PM 4:35:56 PM :36:34 PM 4:36:39 PM :37:23 PM 4:37:23 PM :38:14 PM 4:38:35 PM :43:03 PM 4:43:04 PM :45:36 PM 4:45:37 PM :46:37 PM 4:46:42 PM :47:42 PM 4:47:45 PM :47:49 PM 4:48:04 PM :48:00 PM 4:48:39 PM :48:14 PM 4:48:43 PM :51:26 PM 4:51:34 PM :51:31 PM 4:52:46 PM :53:04 PM 4:53:13 PM :53:11 PM 4:53:16 PM :54:40 PM 4:55:00 PM :54:57 PM 4:55:06 PM :55:25 PM 4:55:26 PM :55:29 PM 4:55:30 PM 1
23 Southern Oregon Transportation. Engineering, LLC Medford, Or N. Main Street at Hersey/Wimer Lane 1: Northbound Lefts Lane 2: Southbound Lefts Stop Sign Delay Study File Name : N Main_SD_July Site Code : Start Date : 7/11/2013 Page No : 4 L No. Joined Queue Released From Delay n. Queue :55:52 PM 4:56:00 PM :57:37 PM 4:57:37 PM :57:49 PM 4:57:51 PM :58:27 PM 4:58:29 PM :58:28 PM 4:58:29 PM :59:28 PM 4:59:37 PM :00:50 PM 5:01:07 PM :01:23 PM 5:01:28 PM :02:08 PM 5:02:14 PM :03:46 PM 5:03:48 PM :04:38 PM 5:05:10 PM :06:51 PM 5:07:33 PM :07:21 PM 5:07:45 PM :07:56 PM 5:07:58 PM :08:14 PM 5:08:31 PM :09:48 PM 5:10:11 PM :10:18 PM 5:10:20 PM :11:35 PM 5:11:36 PM :12:12 PM 5:12:37 PM :13:13 PM 5:13:14 PM :14:48 PM 5:14:49 PM :15:47 PM 5:15:59 PM :15:56 PM 5:16:05 PM :16:54 PM 5:16:55 PM :17:13 PM 5:17:51 PM :17:50 PM 5:17:53 PM :18:16 PM 5:18:46 PM :20:35 PM 5:20:37 PM :21:18 PM 5:21:19 PM :21:39 PM 5:21:43 PM :21:49 PM 5:21:49 PM :21:57 PM 5:22:19 PM :22:01 PM 5:22:35 PM :22:49 PM 5:22:50 PM :22:50 PM 5:22:51 PM :24:05 PM 5:24:06 PM :25:04 PM 5:25:05 PM :25:10 PM 5:25:11 PM :25:13 PM 5:25:14 PM :25:48 PM 5:26:04 PM :26:55 PM 5:26:57 PM :27:12 PM 5:27:24 PM :28:33 PM 5:28:36 PM 3
24 Southern Oregon Transportation. Engineering, LLC Medford, Or N. Main Street at Hersey/Wimer Lane 1: Northbound Lefts Lane 2: Southbound Lefts Stop Sign Delay Study File Name : N Main_SD_July Site Code : Start Date : 7/11/2013 Page No : 5 Summary Information: 3:29:00 PM - 5:29:00 PM Northbound Lefts Southbound Lefts Total Vehicle Count: Delayed Vehicle Count: Through Vehicle Count: 0 0 Average Stopped Time: Maximum Stopped Time: Min. Secs. for Delay: 0 0 Average Queue: Queue Density: Maximum Queue: 3 4 Delay in Vehicle Hour: Total Delay:
25 Southern Oregon Transportation. Engineering, LLC Medford, Or Bush_N Main Street Stopped Delay Lane 1: Bush Street - EBL/R Lane 2: N Main St - NBL Weather: Hot, Clear File Name : Bush St_SD_July Site Code : Start Date : 7/18/2013 Page No : 1 L No. Joined Queue Released From Delay n. Queue 1 1 3:46:01 PM 3:46:04 PM :03:31 PM 4:04:44 PM :20:10 PM 4:20:14 PM :21:42 PM 4:21:46 PM :23:20 PM 4:23:25 PM :24:34 PM 4:24:39 PM :28:16 PM 4:28:21 PM :30:07 PM 4:30:10 PM :34:26 PM 4:35:57 PM :43:23 PM 4:43:24 PM :49:31 PM 4:49:35 PM :49:38 PM 4:50:47 PM :50:28 PM 4:50:51 PM :55:05 PM 4:55:10 PM :56:26 PM 4:56:35 PM :00:14 PM 5:00:32 PM :00:30 PM 5:00:37 PM :01:56 PM 5:02:10 PM :07:10 PM 5:07:31 PM :09:02 PM 5:09:32 PM :12:02 PM 5:12:08 PM :23:36 PM 5:24:02 PM :25:00 PM 5:25:05 PM :26:16 PM 5:26:27 PM :29:20 PM 5:29:24 PM :39:48 PM 5:39:52 PM :45:50 PM 5:46:01 PM :50:36 PM 5:50:37 PM :47:25 PM 3:47:27 PM :57:52 PM 3:58:30 PM :06:15 PM 4:06:17 PM :06:23 PM 4:06:26 PM :16:31 PM 4:16:33 PM :28:46 PM 4:28:47 PM :28:48 PM 4:28:49 PM :40:27 PM 4:40:30 PM :47:26 PM 4:47:28 PM :47:55 PM 4:48:43 PM :13:48 PM 5:13:49 PM :13:50 PM 5:13:51 PM :22:30 PM 5:22:31 PM :30:08 PM 5:30:30 PM :35:34 PM 5:35:39 PM :37:42 PM 5:37:55 PM :46:41 PM 5:46:52 PM :50:38 PM 5:50:38 PM 0
26 Southern Oregon Transportation. Engineering, LLC Medford, Or Bush_N Main Street Stopped Delay Lane 1: Bush Street - EBL/R Lane 2: N Main St - NBL Weather: Hot, Clear File Name : Bush St_SD_July Site Code : Start Date : 7/18/2013 Page No : 2 Summary Information: 3:46:00 PM - 5:51:00 PM Bush - EBL/R Main - NBL Total Vehicle Count: Delayed Vehicle Count: Through Vehicle Count: 0 0 Average Stopped Time: Maximum Stopped Time: Min. Secs. for Delay: 0 0 Average Queue: Queue Density: Maximum Queue: 2 1 Delay in Vehicle Hour: Total Delay:
27 Southern Oregon Transportation. Engineering, LLC Medford, Or Glenn_Main Stop Delay Lane 1: WBL/R Lane 2: SBL Weather: Hot, Clear File Name : Glenn_SD_July Site Code : Start Date : 7/18/2013 Page No : 1 L No. Joined Queue Released From Delay n. Queue 1 1 3:31:01 PM 3:31:02 PM :31:43 PM 3:31:49 PM :33:05 PM 3:33:14 PM :33:25 PM 3:33:27 PM :34:07 PM 3:34:31 PM :38:20 PM 3:38:22 PM :38:29 PM 3:38:31 PM :41:32 PM 3:41:34 PM :42:36 PM 3:43:42 PM :44:27 PM 3:44:46 PM :45:19 PM 3:45:20 PM :51:12 PM 3:51:14 PM :52:43 PM 3:52:47 PM :54:48 PM 3:54:50 PM :55:45 PM 3:56:42 PM :56:22 PM 3:56:43 PM :57:45 PM 3:58:30 PM :58:28 PM 3:59:06 PM :03:47 PM 4:04:19 PM :04:28 PM 4:04:51 PM :04:37 PM 4:04:55 PM :05:55 PM 4:07:43 PM :06:53 PM 4:08:12 PM :08:10 PM 4:08:27 PM :08:32 PM 4:08:37 PM :09:02 PM 4:09:06 PM :09:52 PM 4:10:20 PM :10:23 PM 4:10:30 PM :11:52 PM 4:12:10 PM :15:46 PM 4:16:03 PM :17:21 PM 4:17:22 PM :17:53 PM 4:18:16 PM :21:05 PM 4:21:07 PM :22:27 PM 4:23:09 PM :23:16 PM 4:23:38 PM :27:13 PM 4:27:23 PM :27:16 PM 4:27:27 PM :27:21 PM 4:27:28 PM :28:17 PM 4:28:24 PM :30:33 PM 4:30:37 PM :37:32 PM 4:37:40 PM :39:25 PM 4:39:58 PM :43:28 PM 4:43:32 PM :45:00 PM 4:45:32 PM :48:33 PM 4:48:51 PM :50:26 PM 4:50:45 PM :51:50 PM 4:52:29 PM :53:01 PM 4:53:20 PM :55:45 PM 4:55:47 PM :56:37 PM 4:56:47 PM :58:26 PM 4:58:29 PM :58:40 PM 4:58:43 PM :59:11 PM 4:59:14 PM :00:02 PM 5:00:22 PM :05:49 PM 5:05:57 PM 8
28 L No. Joined Queue Released From Delay n. Queue :07:43 PM 5:07:50 PM :09:31 PM 5:09:33 PM :09:54 PM 5:09:58 PM :11:30 PM 5:11:32 PM :11:51 PM 5:12:14 PM :13:45 PM 5:14:06 PM :14:27 PM 5:14:45 PM :19:40 PM 5:19:47 PM :19:50 PM 5:20:57 PM :24:52 PM 5:25:38 PM :25:40 PM 5:25:43 PM :25:51 PM 5:25:57 PM :25:54 PM 5:26:01 PM :26:41 PM 5:26:55 PM :27:18 PM 5:27:22 PM :30:10 PM 5:30:15 PM :30:21 PM 5:30:24 PM :31:27 PM 5:31:32 PM :32:45 PM 5:33:07 PM :34:12 PM 3:34:25 PM :37:15 PM 3:37:16 PM :37:37 PM 3:37:47 PM :41:10 PM 3:41:12 PM :41:36 PM 3:41:47 PM :44:17 PM 3:44:45 PM :49:24 PM 3:49:31 PM :49:35 PM 3:49:42 PM :52:07 PM 3:52:21 PM :53:42 PM 3:54:10 PM :03:45 PM 4:03:47 PM :05:03 PM 4:05:11 PM :07:35 PM 4:07:36 PM :09:31 PM 4:09:47 PM :11:38 PM 4:12:09 PM :13:33 PM 4:13:38 PM :19:00 PM 4:19:02 PM :22:07 PM 4:22:15 PM :23:57 PM 4:23:59 PM :24:29 PM 4:24:36 PM :25:05 PM 4:25:51 PM :25:14 PM 4:25:56 PM :27:24 PM 4:27:26 PM :28:53 PM 4:28:54 PM :29:20 PM 4:29:22 PM :30:39 PM 4:30:42 PM :33:01 PM 4:33:05 PM :35:53 PM 4:35:56 PM :39:48 PM 4:40:03 PM :39:54 PM 4:40:10 PM :39:59 PM 4:40:14 PM :40:27 PM 4:40:51 PM :47:10 PM 4:47:18 PM :47:16 PM 4:47:26 PM :48:07 PM 4:48:07 PM :48:38 PM 4:48:52 PM :50:46 PM 4:50:48 PM :58:10 PM 4:58:12 PM 2 Southern Oregon Transportation. Engineering, LLC Medford, Or File Name : Glenn_SD_July Site Code : Start Date : 7/18/2013 Page No : 2
29 L No. Joined Queue Released From Delay n. Queue :00:33 PM 5:00:38 PM :02:28 PM 5:02:34 PM :02:42 PM 5:03:01 PM :05:46 PM 5:05:55 PM :06:16 PM 5:06:28 PM :10:43 PM 5:11:08 PM :12:12 PM 5:12:14 PM :12:26 PM 5:12:29 PM :13:18 PM 5:13:33 PM :22:45 PM 5:23:09 PM :23:29 PM 5:23:32 PM :25:14 PM 5:25:25 PM :26:48 PM 5:26:57 PM :26:53 PM 5:27:03 PM :27:51 PM 5:28:05 PM :29:27 PM 5:29:29 PM :29:37 PM 5:29:39 PM :29:40 PM 5:29:41 PM :29:46 PM 5:29:51 PM :30:52 PM 5:30:54 PM :30:55 PM 5:30:57 PM :31:00 PM 5:31:02 PM :32:31 PM 5:32:37 PM :33:20 PM 5:33:24 PM 4 Southern Oregon Transportation. Engineering, LLC Medford, Or Summary Information: 3:31:00 PM - 5:34:00 PM WBLR SBL Total Vehicle Count: Delayed Vehicle Count: Through Vehicle Count: 0 0 Average Stopped Time: Maximum Stopped Time: Min. Secs. for Delay: 0 0 Average Queue: Queue Density: Maximum Queue: 3 3 Delay in Vehicle Hour: Total Delay: File Name : Glenn_SD_July Site Code : Start Date : 7/18/2013 Page No : 3
30 Gap Spreadsheet for North Main Street at Hersey/Wimer Date: Thurs July 11, 2013 Ashland Post Road Diet Analysis 3:30-5:30 PM Wimer Hersey Both Wimer-Hersey Gap size # of Mult. factor EBR gaps # of Mult. factor WBR gaps # of Mult. factor EB-WB Left-Thru gaps 6 to NA NA NA 8 to to to to to to to to to to to > Total
31 Date:71613 Time:7:308:30A.M. Corridor:NorthMainStreet LimitsofStudy:ValleyViewtoHelman ControlPoint:MapleStreet TravelTimeDelayStudy ValleyViewMaple MapleHelman Southbound Northbound Southbound Northbound Run1 02: : : :21.9 Run2 02: : : :15.5 Run3 02: : : :30.5 Run4 02: : : :49.4 Run5 02: : : :43.2 Run6 Run7 AVERAGE 02: : : :32.1
32 Date:71513 Time:4:305:30P.M. Corridor:NorthMainStreet LimitsofStudy:ValleyViewtoHelman ControlPoint:MapleStreet TravelTimeDelayStudy ValleyViewMaple MapleHelman Southbound Northbound Southbound Northbound Run1 02: : : :21.7 Run2 02: : : :27.2 Run3 02: : : :14.7 Run4 02: : : :19.4 Run5 02: : : :22.5 Run6 Run7 AVERAGE 02: : : :21.1
33
MEMORANDUM. Bob Zagozda, Chief Financial Officer Westside Community Schools. Mark Meisinger, PE, PTOE Felsburg Holt & Ullevig. DATE: June 11, 2018
 MEMORANDUM TO: Bob Zagozda, Chief Financial Officer Westside Community Schools FROM: Mark Meisinger, PE, PTOE Felsburg Holt & Ullevig DATE: June 11, 218 6-11-18 SUBJECT: Sunset Hills Elementary School
LUDWIG RD. SUBDIVISION PROJECT TRAFFIC IMPACT ANALYSIS
 LUDWIG RD. SUBDIVISION PROJECT TRAFFIC IMPACT ANALYSIS Prepared for Skip Coddington GSC Development, Inc PO Box 1623 Woodinville WA 9872 Prepared by 1141 NE 124 th St., #59 Kirkland, WA 9834 425.522.4118
Aldridge Transportation Consultants, LLC Advanced Transportation Planning and Traffic Engineering
 Aldridge Transportation Consultants, LLC Advanced Transportation Planning and Traffic Engineering John M.W. Aldridge, PE, PTOE, AICP 182 Chimney Rock Road Colorado Registered Professional Engineer Highlands
FINAL TERMINAL TRAFFIC MONITORING STUDY
 FINAL TERMINAL 91 216 TRAFFIC MONITORING STUDY Prepared for: Port of Seattle February 15, 217 Prepared by: 12131 113 th Avenue NE, Suite 23 Kirkland, WA 9834-712 Phone: 425-821-3665 www.transpogroup.com
Strategic Signal Timing Changes = BIG Results. Barbara Jones, PE, PTOE DGL Consulting Engineers, LLC Senior Traffic Engineer
 Strategic Signal Timing Changes = BIG Results Barbara Jones, PE, PTOE DGL Consulting Engineers, LLC Senior Traffic Engineer Pre Signal Timing Updates Signal Timing Updates Average Retiming Interval Percent
Traffic Analysis Final Report
 SR-71 Widening Project Project Approval/Environmental Documentation Traffic Analysis Final Report Prepared for Caltrans District 7 August 2012 6 Hutton Centre Drive, Suite 700 Santa Ana, California 92707
Caliber Charter School VALLEJO, CA
 Traffic Impact Study Final Report Caliber Charter School VALLEJO, CA 21 June 2016 Prepared for: Prepared by: Traffic Engineering & Transportation Planning This report has been prepared and certified by
Pedestrian Safety Review Spadina Avenue
 STAFF REPORT ACTION REQUIRED Pedestrian Safety Review Spadina Avenue Date: October 13, 2015 To: Toronto and East York Community Council From: Director, Transportation Services, Toronto and East York District
Washington St. & Ash Coulee Dr./43 rd Ave Intersection Study
 430 IACC Building Fargo, ND 58105 Tel 701-231-8058 Fax 701-231-1945 www.ugpti.org www.atacenter.org Washington St. & Ash Coulee Dr./43 rd Ave Intersection Study Final Report April 2007 Prepared for: City
MEMORANDUM. Lynn Hayes LSA Associates, Inc.
 MEMORANDUM To: Lynn Hayes LSA Associates, Inc. Date: May 5, 217 From: Zawwar Saiyed, P.E., Senior Transportation Engineer Justin Tucker, Transportation Engineer I Linscott, Law & Greenspan, Engineers LLG
%g 109 %g 9. %g 99. %g 9. %g 4. %g 4 %g ,95 (/ 1. Route 109 Corridor Study. %g 35. Corridor Study Area Study Area. Sanford.
 %g 4A %g 109 %g 4 Sanford %g 4 %g 109 %g 99 North Berwick Wells 3 0 3 Miles Route 109 Corridor Study %g 9 %g 109 %g 9A %g9a %g 9 Kennebunk.-,95 W N S E EXIT 2 MEETING HOUSE RD BRAGDO N RD 20 2 %g1 1 (/
KING STREET TRANSIT PILOT
 KING STREET TRANSIT PILOT Update toronto.ca/kingstreetpilot #kingstreetpilot HIGHLIGHTS TRANSIT RIDERSHIP TRANSIT CAPACITY To respond to this growth in ridership, the TTC has increased the capacity of
Lake Erie Commerce Center Traffic Analysis
 LOCATION: East of NYS Route 5 at Bayview Road Town of Hamburg Erie County, New York PREPARED BY: Wendel Companies 140 John James Audubon Parkway Suite 200 Amherst, New York 14228 January 2012 i ii Table
rtc transit Before and After Studies for RTC Transit Boulder highway UPWP TASK Before Conditions
 rtc transit Before and After Studies for RTC Transit UPWP TASK 3403-11-14 Before Conditions Report Boulder highway June 2011 Before and After Studies for RTC Transit BOULDER HIGHWAY BEFORE STUDY UPWP Task
Transform66: Inside the Beltway
 Transform66: Inside the Beltway Result of a multi-year planning that started during the McDonnell Administration 2016 compromise reached with General Assembly Convert I-66 to express lanes from 5:30a-9:30a
Freymond Aggregates Quarry 2287 Bay Lake Road Twp. of Faraday, Hastings County
 Freymond Aggregates Quarry 2287 Bay Lake Road Twp. of Faraday, Hastings County Traffic Impact Study Prepared by: Tranplan Associates PO Box 455 Lakefield, ON K0L 2H0 www.tranplan.com Prepared for: Freymond
Fairfax County Parkway Widening Fairfax County
 Get Involved VDOT representatives will review and evaluate information received as a result of this meeting. Please fill out the comment sheet provided in this brochure if you have any comments or questions.
MEMORANDUM. Open Section Background. I-66 Open Section Study Area. VDOT Northern Virginia District. I-66 Project Team. Date: November 5, 2015
 MEMORANDUM To: VDOT Northern Virginia District From: I-66 Project Team Date: November 5, 2015 Subject: Open Section Background The purpose of this technical memorandum is to provide narrative and technical
Transportation Improvement District (TID) Exercise New Castle County Unified Development Code
 Exercise New Castle County Unified Development Code") Transportation Improvement District (TID) Exercise New Castle County Unified Development Code Churchmans Crossing TID How should New Castle County deploy Transportation Improvement Districts (TIDs)? Site
Transportation Improvement District (TID) Exercise New Castle County Unified Development Code Churchmans Crossing TID How should New Castle County deploy Transportation Improvement Districts (TIDs)? Site
5.1 Traffic and Transportation
 5.1 When it opens in 2009, the Bellevue Nickel Improvement Project will increase the number of vehicles able to travel through the study area, improve travel speeds, and improve safety by reducing the
FHWA P/N Guidelines. Corridor Relationship. Highway 22 Segment 1 - US 169 to CSAH 2 Relevance / Documentation of Need
 Highway 22 Segment 1 - US 169 to CSAH 2 Vehicle Mobility Congestion Intersection Congestion Existing Conditions - Based on Highway Capacity Manual methodology, corridor level of service is currently LOS
Mercer SCOOT Adaptive Signal Control. Karl Typolt, Transpo Group PSRC RTOC July 6th, 2017
 Mercer SCOOT Adaptive Signal Control Karl Typolt, Transpo Group PSRC RTOC July 6th, 2017 Our mission, vision, and core values Mission: deliver a high-quality transportation system for Seattle Vision: connected
Slow Down! Reducing Downtown Bloomington s Progression Speed
 Slow Down! Reducing Downtown Bloomington s Progression Speed Neil Kopper, PE, City of Bloomington Patrick O Connor, PE, PTOE, American Structurepoint March 7, 2018 Background and Project Overview Bloomington,
This report was prepared by the Lake Zurich Police Department Traffic Safety Division. Intersection location and RLR camera approaches identified:
 POLICE DEPARTMENT 200 Mohawk Trail Lake Zurich, Illinois 60047 (847) 719-1690 LakeZurich.org April 1, 2018 This report is being submitted regarding the red-light cameras. According to the Red Light Running
KING STREET TRANSIT PILOT
 KING STREET TRANSIT PILOT Update toronto.ca/kingstreetpilot #kingstreetpilot UPDATE Average streetcar travel times in continued to show similar trends as first observed in November. The most significant
TECHNICAL MEMORANDUM. DATE: August 31, Pamela Dalcin-Walling/Dokken Engineering. Daniel Yau and Victor Baltazar/Y&C
 DATE: August 31, 2017 TECHICAL MEMORADUM Y&C Transportation Consultants, Inc. 3250 Ramos Circle Sacramento, CA 95827 Phone: (916) 366-8000 Fax (916) 366-8008 TO: FROM: SUBJECT: Pamela Dalcin-Walling/Dokken
Planning. Proposed Development at the Southeast Corner of Lakeshore Road West and Brookfield Road Intersection FINAL.
 Project No. 121-22908 N o v e m b e r 2 0 1 2 Traffic Impact Study Transportation Planning th GENIVAR Inc., 600 Cochrane Drive, 5 Floor, Markham, Ontario L3R 5K3 Telephone: 905.475.7270 Fax: 905.475.5994
TABLE OF CONTENTS. Coral Springs Charter High School and Middle School Job No Page 2
 Job No. 15-019 Page 2 TABLE OF CONTENTS 1.0 INTRODUCTION... 4 2.0 EXISTING CONDITIONS... 5 3.0 TRAFFIC GENERATION... 7 4.0 TRIP DISTRIBUTION... 8 5.0 FUTURE CONDITIONS... 8 6.0 SITE ACCESS...13 7.0 CONCLUSION...13
US 19 Sunset Point Rd to Countryside Blvd.
 Frontage Lanes Alternative Six-Lane Roadway Two-Lane, One-Way Frontage Lanes Close All Median Openings w/ Concrete Median Barrier Construct Within Existing Right-of-Way Status Update Construction started
PERFORMANCE REPORT JANUARY Keith A. Clinkscale Performance Manager
 PERFORMANCE REPORT JANUARY 2018 Keith A. Clinkscale Performance Manager INTRODUCTION/BACKGROUND Keith A. Clinkscale Performance Manager FIXED ROUTE DASHBOARD JANUARY 2018 Safety Max Target Goal Preventable
APPENDIX H MILESTONE 2 TRAFFIC OPERATIONS ANALYSIS OF THE AT-GRADE CROSSINGS
 Draft Environmental Impact Statement/Environment Impact Report Appendix H Milestone 2 Traffic Operations Analysis of the At-Grade Crossings APPENDIX H MILESTONE 2 TRAFFIC OPERATIONS ANALYSIS OF THE AT-GRADE
EXISTING CONDITIONS A. INTRODUCTION. Route 107 Corridor Study Report
 II. EXISTING CONDITIONS A. INTRODUCTION The Route 107 study area extends from the south at Chestnut Street in Lynn approximately 3.7 miles to the north to Boston Street in Salem. The study area has three
Regulations to deter cut-through traffic - Heath Street V\fest, between Spadina Road and Avenue Road. Toronto and East York Community Council
 TORONTO STAFF REPORT ACTION REQUIRED Regulations to deter cut-through traffic - Heath Street V\fest, between Spadina Road and Avenue Road Dnte: February 16,2009 To: From: Toronto and East York Community
# 7. Date of Meeting: September 2, 2015 BOARD OF SUPERVISORS BUSINESS MEETING ACTION ITEM SUBJECT:
 BOARD OF SUPERVISORS BUSINESS MEETING ACTION ITEM Date of Meeting: September 2, 2015 # 7 SUBJECT: ELECTION DISTRICT: CRITICAL ACTION DATE: STAFF CONTACTS: Traffic Congestion and Safety Improvements at
TRAFFIC & PARKING STUDY FOR PROPOSED BIRMINGHAM BOUTIQUE HOTEL
 TRAFFIC & PARKING STUDY FOR PROPOSED BIRMINGHAM BOUTIQUE HOTEL Prepared for LORIENT CAPTIAL LLC Birmingham, MI By GIFFELS WEBSTER Washington Township, MI April 2017 i CONTENTS EXECUTIVE SUMMARY. ii INTRODUCTION.
EVALUATION OF TRANSIT SIGNAL PRIORITY EFFECTIVENESS USING AUTOMATIC VEHICLE LOCATION DATA
 EVALUATION OF TRANSIT SIGNAL PRIORITY EFFECTIVENESS USING AUTOMATIC VEHICLE LOCATION DATA A Thesis Presented to The Academic Faculty by Carl Andrew Sundstrom In Partial Fulfillment of the Requirements
95 Express Managed Lanes Consolidated Analysis Technical Report
 95 Express Managed Lanes Consolidated Analysis Technical Report November 2011 FDOT District 4 Prepared by Cambridge Systematics, Inc Acronyms AVO Average Vehicle Occupancy CCTV Closed Circuit Television
SANTA CLARA COUNTY I-280 CORRIDOR STUDY
 SANTA CLARA COUNTY I-280 CORRIDOR STUDY Appendix B 2 Technical Memorandum Existing Transportation Condition Memo SANTA CLARA VALLEY TRANSPORTATION AUTHORITY (VTA) 1-1 Introduction The I-280 Corridor Study
STAR Bond Development
 STR ond Development Traffic Impact Study Goddard, Kansas Prepared for: Kansas Department of Transportation City of Goddard, Kansas Prepared by TranSystems November 218 November 3, 218 Kansas Department
Memorandum. Roger Millar, Secretary of Transportation. Date: April 5, Interstate 90 Operations and Mercer Island Mobility
 Memorandum To: From: The Honorable Dow Constantine, King County Executive; The Honorable Ed Murray, City of Seattle Mayor; The Honorable Bruce Bassett, City of Mercer Island Mayor; The Honorable John Stokes,
95 Express Monthly Operations Report May 2017
 95 Express Operations Report May 17 95 Express currently has three dynamically-priced tolling segments in each direction. Segment 1 is in Miami-Dade County from just north of SR 836 to the Golden Glades
95 Express Monthly Operations Report July 2017
 95 Express Operations Report July 17 95 Express currently has three dynamically-priced tolling segments in each direction. Segment 1 is in Miami-Dade County from just north of SR 836 to the Golden Glades
PDF compression, OCR, web optimization using a watermarked evaluation copy of CVISION PDFCompressor
 o U.S. Department Washington Division Suite 501 Evergreen Plaza of Transportation 711 South Capitol Way Olympia, Washington 98501-1284 Federa' Highway (360) 753-9480 Administration (360) 753-9889 (FAX)
PURPOSE AND NEED (CONCURRENCE POINT 1) NEW CANADA ROAD PROJECT FROM STATE ROUTE 1 (U.S. HIGHWAY 70) TO U.S. INTERSTATE 40
 NEW CANADA ROAD PROJECT FROM STATE ROUTE 1 (U.S. HIGHWAY 70) TO U.S. INTERSTATE 40") PURPOSE AND NEED (CONCURRENCE POINT 1) NEW CANADA ROAD PROJECT FROM STATE ROUTE 1 (U.S. HIGHWAY 70) TO U.S. INTERSTATE 40 Project Description The primary purpose of this project is to improve the major
PURPOSE AND NEED (CONCURRENCE POINT 1) NEW CANADA ROAD PROJECT FROM STATE ROUTE 1 (U.S. HIGHWAY 70) TO U.S. INTERSTATE 40 Project Description The primary purpose of this project is to improve the major
DISTRICT EXPRESS LANES ANNUAL REPORT FISCAL YEAR 2017 JULY 1, 2016 JUNE 30, FloridaExpressLanes.com
 DISTRICT EXPRESS LANES ANNUAL REPORT FISCAL YEAR 2017 JULY 1, 2016 JUNE 30, 2017 FloridaExpressLanes.com This page intentionally left blank. TABLE OF CONTENTS List of Figures... ii List of Tables.... ii
4. Safety Concerns Potential Short and Medium-Term Improvements
 NH Route 104 Access Management Study Page 19 4. Safety Concerns Potential Short and Medium-Term Improvements Potential safety improvement strategies are listed by priority based on field observations by
Glasgow Street Traffic Review
 Glasgow Street Traffic Review Recommendation That the Standing Policy Committee on Transportation recommend to City Council: 1. That the Administration proceed with removing the pinch points installed
Appendix B Connecting Track Options Evaluation Criteria
 Appendix B Connecting Track Options Evaluation Criteria 608979-853_ra_July5-0_App Title Pages.Docx TTC ASHBRIDGES BAY MAINTENANCE AND STORAGE FACILITY CONNECTING TRACK ROUTE ALTERNATIVE - EVAULATION MATRIX.0
Proposed Bicycle Lanes on Yonge Street from Queens Quay to Front Street
 STAFF REPORT ACTION REQUIRED Proposed Bicycle Lanes on Yonge Street from Queens Quay to Front Street Date: March 12, 2007 To: From: Toronto and East York Community Council Director, Transportation Infrastructure
10.0 Recommendations Methodology Assumptions
 10.0 Recommendations To accommodate the projected growth of the I-526 corridor, this report has summarized potential improvement strategies that were separated into four categories, TDM, Modal, Traffic
Parking Amendments - Bay Street, between Harbour Street and Queens Quay West (York Street, Bay Street, and Yonge Street Ramp Removal)
") REPORT FOR ACTION between Harbour Street and Queens Quay West (York Street, Bay Street, and Yonge Street Ramp Removal) Date: October 26, 2017 To: Toronto and East York Community Council From: Acting Director,
REPORT FOR ACTION between Harbour Street and Queens Quay West (York Street, Bay Street, and Yonge Street Ramp Removal) Date: October 26, 2017 To: Toronto and East York Community Council From: Acting Director,
FINAL REPORT INTERSECTION STUDY
 FINL REPORT INTERSECTION STUDY Vermont Route 22 & Panton Road City of Vergennes, Vermont May 9, 2011 Prepared for: 14 Seminary Street Middlebury, Vermont 05753 Prepared by: LMOUREUX & DICKINSON 14 Morse
MEMORANDUM. for HOV Monitoring on I-93 North and the Southeast Expressway, Boston Region MPO, November, 2011.
 MEMORANDUM Date: January 12, 2012 To: Congestion Management Process Files From: Seth Asante, Ryan Hicks, and Efi Pagitsas MPO Staff Re: Historical Trends: Travel Times and Vehicle Occupancy Levels for
Auckland Transport Quarterly Indicators Report 2018/19
 Attachment 1 Auckland Transport ly Indicators Report 218/19 September 218 Table of Contents Page 2. 1. Executive summary 2. External indicators 3. Performance by Key Priority 3.1 Deliver an efficient and
PERFORMANCE REPORT DECEMBER Performance Management Office
 PERFORMANCE REPORT DECEMBER 2018 Performance Management Office INTRODUCTION/BACKGROUND Performance Management Office FIXED ROUTE DASHBOARD FY 2019 Safety Max Target Goal Preventable Collisions per 100k
BUSINESS OF THE CITY COUNCIL CITY OF MERCER ISLAND, WA
 BUSINESS OF THE CITY COUNCIL CITY OF MERCER ISLAND, WA December 1, 2008 Public Hearing TOWN CENTER PARKING TIME LIMITS (FIRST READING) Proposed Council Action: Conduct public hearing and first reading
Launceston City Council. Kings Meadows Traffic Management Report for Public Consultation
 Launceston City Council Kings Meadows Traffic Management Report for Public Consultation November 2013 This report: has been prepared by GHD for Launceston City Council and may only be used and relied on
Memorandum. Fund Allocation Fund Programming Policy/Legislation Plan/Study Capital Project Oversight/Delivery Budget/Finance Contract/Agreement Other:
 Memorandum Date: March 23, 2018 To: Transportation Authority Board From: Eric Cordoba Deputy Director Capital Projects Subject: 4/10/18 Board Meeting: San Francisco Freeway Corridor Management Study Update
77 McDonnell-Lindbergh - Monday thru Friday NORTHBOUND Effective: March 18, Shopping Center North County. Shopping Center Washington &
 77 McDonnell- - Monday thru Friday NORTHBOUND Effective: March 18, 2019 & Valley Industries 4:53A 4:59A 5:10A 5:18A 5:27A 5:39A 5:33A 5:39A 5:50A 5:58A 6:07A 6:19A 6:13A 6:19A 6:31A 6:39A 6:49A 7:02A 6:53A
TRANSPORTATION ELEMENT
 Transportation TRANSPORTATION ELEMENT Data, Inventory, and Analysis Prepared by Contents 1.0 INTRODUCTION... 1 2.0 EXISTING CONDITIONS... 1 2.1 Roadways... 1 2.1.1 Jurisdiction... 1 2.1.2 Functional Classification...
Albany NY Red Light Camera Locations and Activation Dates 1 Central Avenue & Colvin Avenue
 Albany NY Red Light Camera Locations and Activation Dates 1 Central Avenue & Colvin Avenue Westbound 8/28/2015 2 Central Avenue & Henry Johnson Boulevard Eastbound 2/16/2016 1. Description of the locations
A. CONCLUSIONS OF THE FGEIS
 Chapter 11: Traffic and Parking A. CONCLUSIONS OF THE FGEIS The FGEIS found that the Approved Plan will generate a substantial volume of vehicular and pedestrian activity, including an estimated 1,300
Appendix 4.1 J. May 17, 2010 Memorandum from CTPS to the Inter Agency Coordinating Group
 Appendix 4.1 J May 17, 2010 Memorandum from CTPS to the Inter Agency Coordinating Group CTPS CENTRAL TRANSPORTATION PLANNING STAFF Staff to the Boston Region Metropolitan Planning Organization MEMORANDUM
ROUTE 20 CORRIDOR STUDY ---- Orange County, Virginia
 ROUTE 20 CORRIDOR STUDY ---- Orange County, Virginia Prepared by PARSONS Fairfax, Virginia on behalf of the: Rappahannock-Rapidan Regional Commission in cooperation with Orange County, Virginia Virginia
PERFORMANCE REPORT DECEMBER 2017
 PERFORMANCE REPORT DECEMBER 2017 Note: New FY2018 Goal/Target/Min or Max incorporated in the Fixed Route and Connection Dashboards. Keith A. Clinkscale Performance Manager INTRODUCTION/BACKGROUND Keith
NORTH FRASER PERIMETER ROAD WEST CORRIDOR DEFINITION STUDY
 NORTH FRASER PERIMETER ROAD WEST CORRIDOR DEFINITION STUDY MAY 2011 SW1132SWD NORTH FRASER PERIMETER ROAD WEST CORRIDOR DEFINITION STUDY TABLE OF CONTENTS 1.0 INTRODUCTION... 1 2.0 CURRENT TRAVEL PATTERNS
Route 141 and I-44 Design-Build Project Community Involvement Group. March 21, 2016
 Route 141 and I-44 Design-Build Project Community Involvement Group March 21, 2016 Purpose of CIG 1. Share information with major stakeholders 2. Keep stakeholders informed of the process 3. Reduce uncertainty
1.2 Corridor History and Current Characteristics
 SECTION 1 Description and Background of Study Area 1.1 Introduction This preliminary engineering report was prepared for the Alaska Department of Transportation and Public Facilities (ADOT&PF). It is part
ROUTE 122 CORRIDOR STUDY ---- Bedford County and Bedford City, Virginia
 ROUTE 122 CORRIDOR STUDY ---- Bedford County and Bedford City, Virginia Developed by Region 2000 Regional Commission In cooperation with Bedford County, Virginia City of Bedford, Virginia Virginia Department
APPENDIX J MODIFICATIONS PERFORMED TO THE TOR
 APPENDIX J MODIFICATIONS PERFORMED TO THE TOR This appendix summarizes the modifications that were performed in years 2012 and 2017 to rectify calculation errors that were observed in the data presented
London Borough of Barnet Traffic & Development Design Team
 London Borough of Barnet Traffic & Development Design Team AERODROME ROAD PEDESTRIAN FACILITY AND BUS STOP INTRODUCTION FEASIBILITY REPORT Job Number: 60668 Doc Ref: S106/12-13/60668 Author: Manoj Kalair
DOGWOOD AT VILLA AVENUE PROJECT
 TRANSPORTATION IMPACT ANALYSIS DOGWOOD AT VILLA AVENUE PROJECT El Centro, California September 4, 2018 LLG Ref. 3-17-2782 TABLE OF CONTENTS SECTION PAGE Appendices... ii List of Figures... i List of Tables...
Statistical Study of the Impact of. Adaptive Traffic Signal Control. Traffic and Transit Performance
 Statistical Study of the Impact of Adaptive Traffic Signal Control on Traffic and Transit Performance Courtney Slavin, Wei Feng, Miguel Figliozzi, and Peter Koonce The Sydney Coordinated Adaptive Traffic
New Hampshire Route 101 Corridor Plan
 Amherst, Milford, Wilton Final Report September 2002 Bedford Amherst Wilton Milford Prepared for the Nashua Regional Planning Comission (NRPC) by: Wallace Floyd Design Group Vanasse Hangen Brustlin, Inc.
Michigan s Engineering Safety Program for Local Roadways
 Michigan s Engineering Safety Program for Local Roadways Local Road Safety Peer Exchange October 2018 Timothy J. Gates, Ph.D., P.E., P.T.O.E. Michigan State University Andrew Ceifetz, P.E. WSP For More
PERFORMANCE REPORT NOVEMBER 2017
 PERFORMANCE REPORT NOVEMBER 2017 Note: New FY2018 Goal/Target/Min or Max incorporated in the Fixed Route and Connection Dashboards. Keith A. Clinkscale Performance Manager INTRODUCTION/BACKGROUND In June
HOV LANE PERFORMANCE MONITORING: 2000 REPORT EXECUTIVE SUMMARY
 Final Report Research Project Agreement No. T1803, Task 4 HOV Monitoring V HOV LANE PERFORMANCE MONITORING: 2000 REPORT EXECUTIVE SUMMARY by Jennifer Nee TRAC Research Engineer John Ishimaru TRAC Senior
6. HIGHWAY MATTERS A. U.S. ROUTE 58 CORRIDOR STUDY
 SOUTHAMPTON COUNTY BOARD OF SUPERVISORS Regular Session i June 22, 2015 6. HIGHWAY MATTERS A. U.S. ROUTE 58 CORRIDOR STUDY Last year, VDOT commissioned the Route 58 Corridor Study to develop a planning
MONTHLY OPERATIONS REPORT SEPTEMBER 2015
 MONTHLY OPERATIONS REPORT SEPTEMBER 215 Table of Contents SEPTEMBER 215 Section Page September Highlights... 3 Strategic Goals Progress Update... 4 Ridership... 6 Revenue... 9 Expenses... 1 System Summary...
BONITA BEACH ROAD. May 18, Ian Lockwood, PE Cindy Zerger, AICP, ASLA Ken Ray, RLA. Greg Diserio, RLA. Tara Salmieri, AICP
 BONITA BEACH ROAD May 18, 2016 Ian Lockwood, PE Cindy Zerger, AICP, ASLA Ken Ray, RLA Greg Diserio, RLA Tara Salmieri, AICP Toole Design Group Engineers Planners Landscape Architects Authors BONITA BEACH
CONGESTION REPORT 1 st Quarter 2018
 CONGESTION REPORT 1 st Quarter 2018 A quarterly update of the National Capital Region s traffic congestion, travel time reliability, top-10 bottlenecks and featured spotlight Feburary 11, 2019 ABOUT TPB
Baltimore Ravens Egress Study
 Baltimore Ravens Egress Study Presented by: Matt Snare, P.E., PTOE Amy Jackson, P.E. April 19, 2016 Agenda History of Ravens in Baltimore Traditional Traffic Studies vs. Stadium Work Ravens Egress Study
Authors. Courtney Slavin Graduate Research Assistant Civil and Environmental Engineering Portland State University
 An Evaluation of the Impacts of an Adaptive Coordinated Traffic Signal System on Transit Performance: a case study on Powell Boulevard (Portland, Oregon) Authors Courtney Slavin Graduate Research Assistant
SAN FRANCISCO MUNICIPAL TRANSPORTATION AGENCY
 THIS PRINT COVERS CALENDAR ITEM NO. : 10.4 DIVISION: Sustainable Streets BRIEF DESCRIPTION: SAN FRANCISCO MUNICIPAL TRANSPORTATION AGENCY Approving various parking and traffic modifications associated
Sky Temporary Car Park Transport Statement
 001 Issue 26 August 2016 This report takes into account the particular instructions and requirements of our client. It is not intended for and should not be relied upon by any third party and no responsibility
Memo. Orange City Trail Plan Becky Mendez, AICP Jamie Krzeminski, PE, PTOE Matt Wiesenfeld, PE, AICP. Development of the Existing and Proposed Network
 Memo Date: Friday, December 22, 2017 Project: To: From: Subject: Trail Plan Becky Mendez, AICP Jamie Krzeminski, PE, PTOE Matt Wiesenfeld, PE, AICP Development of the Existing and Proposed Network HDR
Community Advisory Panel Meeting #
 Community Advisory Panel Meeting # 6 02.13.19.. Agenda Welcome and Introductions Community Conversations City Council Meeting Debrief Review Citywide Tunnel Video (North Portal Only) Churchill Pedestrian
Downtown Skokie & Oakton Street Corridor Study (Draft)
") Downtown Skokie & Oakton Street Corridor Study (Draft) Skokie, Illinois Project Manager: William C. Grieve, P.E., PTOE GHA Project #3261.805 Downtown Skokie & Oakton Street Corridor Study Skokie, Illinois
Downtown Skokie & Oakton Street Corridor Study (Draft) Skokie, Illinois Project Manager: William C. Grieve, P.E., PTOE GHA Project #3261.805 Downtown Skokie & Oakton Street Corridor Study Skokie, Illinois
OREGON DEPARTMENT OF TRANSPORTATION STATEWIDE ROAD, WEATHER AND INCIDENT CONDITIONS 9/5/2018 2:12:06 PM
 OREGON DEPARTMENT OF TRANSPORTATION STATEWIDE ROAD, WEATHER AND INCIDENT CONDITIONS Incidents/: 9/5/2018 2:12:06 PM ROUTE ORE99EB 2 3 @ Salem, Hyacinth/Verda Hwy100 15 22 7 Mi W of Ainsworth St Park Southbound
Metro ExpressLanes April 5, 2011 Community Meeting re: Adams Blvd Improvements
 Metro ExpressLanes April 5, 2011 Community Meeting re: Adams Blvd Improvements Jan Perry Councilwoman, District 9 Welcome Remarks Arthur T. Leahy Chief Executive Officer, Metro Metro ExpressLanes Overview
Transport Impact Assessment
 Transport Impact Assessment Springbok Hotel Erf 5206, Springbok Northern Cape March 2018 5th Floor Imperial Terraces Carl Cronje Drive Tyger Waterfront Bellville, 7530 (021) 914 6211 (T) e mail: mail@itsglobal.co.za
PORTS TORONTO Billy Bishop Toronto City Airport Summary of 2015 Traffic and Passenger Surveys
 PORTS TORONTO Billy Bishop Toronto City Airport Summary of 2015 Traffic and Passenger Surveys 1 Summary of 2015 BBTCA Traffic and Passenger Surveys Surveys of traffic volumes and pedestrian activity were
Albany NY Red Light Camera Locations and Activation Dates 1 Central Avenue & Colvin Avenue
 Albany NY Red Light Camera Locations and Activation Dates 1 Central Avenue & Colvin Avenue 2 Central Avenue & Henry Johnson Boulevard Eastbound 2/16/2016 1. Description of the locations where traffic control
DTTAS Quarterly Aviation Statistics Snapshot Quarter Report
 Contents DTTAS Quarterly Aviation Statistics Snapshot Quarter 4 2015 Report 1.1 Dublin Airport Key Statistics... 1 1.2 Cork Airport Key Statistics... 3 1.3 Shannon Airport Key Statistics... 5 1.4 Total
Finchley and Golders Green Area Committee 27 April 2017
 Finchley and Golders Green Area Committee 27 April 2017 Title Report of Wards Status Urgent Key Enclosures Officer Contact Details Junction of Regents Park Road / Tillingbourne Gardens, N3 Commissioning
Saighton Camp, Chester. Technical Note: Impact of Boughton Heath S278 Works upon the operation of the Local Highway Network
 Technical Note: Impact of Boughton Heath S278 Works July 2013 SAIGHTON CAMP CHESTER COMMERCIAL ESTATES GROUP TECHNICAL NOTE: IMPACT OF BOUGHTON HEATH S278 WORKS UPON THE OPERATION OF THE LOCAL HIGHWAY
Road Safety Audit Review State Route 245 (LM 2.13) Intersection of Southport Road Maury County Description of Project and Background This project invo
 Intersection of Southport Road Maury County Description of Project and Background This project invo") Road Safety Audit Review State Route 245 (LM 2.13) Intersection of Southport Road Description of Project and Background This project involves an area of concern at the intersection of State Route 245 (Campbellsville
Road Safety Audit Review State Route 245 (LM 2.13) Intersection of Southport Road Description of Project and Background This project involves an area of concern at the intersection of State Route 245 (Campbellsville
DTTAS Quarterly Aviation Statistics Snapshot Quarter Report
 Contents DTTAS Quarterly Aviation Statistics Snapshot Quarter 1 2018 Report 1.1 Dublin Airport Key Statistics... 1 1.2 Cork Airport Key Statistics... 3 1.3 Shannon Airport Key Statistics... 5 1.4 Total
Yonge Street / Highway 401 Improvements Update. Public Works and Infrastructure Committee. General Manager, Transportation Services
 PW9.7 STAFF REPORT ACTION REQUIRED Yonge Street / Highway 401 Improvements Update Date: October 26, 2015 To: From: Wards: Reference Number: Public Works and Infrastructure Committee General Manager, Transportation
Sound Transit Operations August 2015 Service Performance Report. Ridership
 Ridership Total Boardings by Mode Mode Aug-14 Aug-15 % YTD-14 YTD-15 % ST Express 1,534,241 1,553,492 1.3% 11,742,839 12,354,957 5.2% Sounder 275,403 326,015 18.4% 2,139,086 2,463,422 15.2% Tacoma Link