STAR Bond Development
|
|
|
- Blaise Wade
- 5 years ago
- Views:
Transcription


1 STR ond Development Traffic Impact Study Goddard, Kansas Prepared for: Kansas Department of Transportation City of Goddard, Kansas Prepared by TranSystems November 218


2 November 3, 218 Kansas Department of Transportation Ms. Nelda uckley, P.E. 7 SW Harrison Street 2 nd Floor - Tower Topeka, KS TranSystems 245 N. Waco Suite 222 Wichita, KS 6722 Tel Fax Re: Traffic Impact Study for the City of Goddard STR ond Development Goddard, Kansas Dear Ms. uckley: The City of Goddard is requesting assistance for a project at 183rd Street and U.S. Highway 4 in Goddard, Kansas. The City of Goddard is building a $5 million STR ond project that will be a destination of choice for south-central Kansas and the greater mid-west. The STR ond district is expected to generate 4 new jobs, which will only serve to increase traffic counts in an already busy area. This potential road project will enhance safety and navigability for Goddard residents and Kansan s alike. In response to your request and authorization, TranSystems Corporation has completed a traffic impact study for the proposed STR ond Development in Goddard, Kansas. The purpose of this study is to assess the impact of the proposed development on the surrounding transportation system. Included in this study is a discussion of the anticipated impact of the proposed development on the adjacent street network and identified improvements to mitigate deficiencies for the following development conditions: Existing Conditions Existing plus Proposed Development Conditions Future plus Proposed Development Conditions We trust that the enclosed information proves beneficial to you in this phase of the development process. We appreciate the opportunity to be of service to you and we will be available to review this study with you at your convenience. Sincerely, y: Slade G. Engstrom, PE, PTOE CC: rian Silcott, Goddard City dministrator SGE:ssp:ccb:P
3 Introduction TranSystems Corporation has completed a traffic impact study for the proposed STR ond Development in Goddard, Kansas. The limits of the study corridor extend from 215 th Street on the west of Goddard to 167 th Street on the east of Goddard. The basic limits of the proposed development are the area bounded by N. Goddard Road, E. Kellogg Drive, and 183 rd Street. The purpose of this study is to assess the impact of the proposed STR ond Development on the surrounding transportation system. The study evaluates the increased traffic between the development and US-54 directly adjacent to Kellogg Drive north of the proposed site. The location of the proposed development relative to the major streets in the area is shown on Figure -1 in ppendix. US-54 freeway concept plans have been previously completed to a field check (3%) level though the City of Goddard. Currently, the timeline for the freeway improvements has not been established and funding has not been identified. Included in this study is a discussion of the anticipated traffic growth along the corridor from the proposed STR bond development and the resulting improvements necessary to mitigate development traffic and maintain traffic operations until US-54 is developed into the planned freeway facility with grade-separated arterials. Proposed Development Plan The proposed development will be located south of US-54 (Kellogg) between North Goddard Road and 183 rd Street. Figures -1 and -2 show the location and site plan of the proposed development and its relationship with the surrounding area. Preliminary and future site layouts are shown on Figures -3 through -5. The Goddard quatic Center and Sports Complex is anticipated to be a regional destination attraction with a focus to attract national youth sporting events and tournaments. The development includes an Olympic quality swimming complex operated by the International Swimming Hall of Fame, 15-room full-service hotel with conference facility, four baseball/softball fields, retail and dining. Study rea To assess the impacts of the proposed development, several intersections were identified for study during the.m. and P.M. peak hours. The intersections are located in the immediate area of the site and include: 215 th Street and US-54; Main Street and US-54; Cedar Street and US-54; 199 th Street / N. Goddard Road and US-54; arber Street and US-54; 183 rd Street and US-54; and 167 th Street and US-54. Turning Movement Counts.M. and P.M. weekday peak hour traffic volumes were collected at the existing study intersections between November 1 and December 2, 215, from 7: a.m. to 9: a.m. and from 4: p.m. to 6: p.m. In general, the peak hours for all study intersections were determined to be from 7: a.m. to 8: a.m. and from 4:3 p.m. to 5:3 p.m. The study area includes Eisenhower High School (school hours 7:35 a.m.-2:51 p.m.), Eisenhower Middle School (school hours 7:35 a.m.-2:51 p.m.), pollo Elementary School (school hours 8:45 a.m.-4:1 p.m.), Explorer Elementary School (school hours 8:45 a.m.-4:1 p.m.), and Discovery Intermediate School (school hours 7:45 a.m.- 3:1 p.m.). The weather was generally clear to partly cloudy on all days when counts were recorded. ll schools were in session at the time of the counts. The existing lane configurations and traffic control devices,.m. peak hour traffic volumes and P.M. peak hour traffic volumes are shown on Figures -8 through -1, respectively. STR ond Development Traffic Impact nalysis Page 1 Goddard, Kansas November 218
4 Machine Traffic Data Collection TranSystems placed machine counters at the locations mentioned earlier to determine 24-hour daily approach volumes on these streets over a typical weekday. The counters were in place between Sunday, November 8, 215, and Sunday, November 22, 215. The counts were collected in 15-minute intervals and are included in Figure -17 and ppendix. The 24-hour traffic volumes recorded at these locations are summarized in Table 1. Table 1 verage Daily Traffic (DT) Volumes Location US-54 and west of 215 th Street US-54 between Main Street and 199 th Street US-54 between 199 th Street and 183 rd Street US-54 east of 183 rd Street 199 th Street north of US th Street south of US-54 US-54 north frontage road east of 199 th Street (W. Kellogg Drive) US-54 north frontage road west of 199 th Street (W. Kellogg Drive) US-54 north frontage access at arber Street (W. Kellogg Drive) 24-Hour Volume 12,424 16,54 17,682 19,52 2,275 4,493 1,177 1,118 1,46 Spot Speed Study s a part of the traffic volume counts, speed data was collected and a speed study was conducted within the project limits, between 199 th Street and 183 rd Street, to make recommendations as to appropriate speeds for the roadway segment. One of the more important statistics obtained from a spot speed study is the 85 th percentile speed. This statistic represents the speed at which 85 percent of the observed vehicles are traveling at or below and is generally regarded as the speed considered reasonable and appropriate by most drivers. Vehicle speeds on US-54 were recorded using a radar speed detecting device. The results of the study for data collected on Wednesday, November 11, 215 are shown in Table 2. Relative frequency distributions for the data have also been prepared and are included in the ppendix. Table 2 Speed Observations Intersection pproach Number of Observations Posted Speed Limit (mph) 85 th Percentile Speed (mph) Eastbound US-54 between 199 th & 183 rd Street Westbound US-54 between 199 th & 183 rd Street The posted speed limit on US-54 is 7 mph west of Goddard and 6 mph east of Goddard except through the City of Goddard. 5 mph posted speed limit generally occurs in the city limits from east of 215 th Street to west of 183 rd Street and appear to be appropriate at this time. Street Network The proposed site including proposed improvements are shown in Figure -3 in ppendix. US-54 is the principal east/west arterial roadway located just north of the proposed site. US-54 is a suburban arterial roadway with two through lanes in both directions and a posted speed limit of 5 mph within the city limits with an open ditch on the north side. US-54 is on the National Highway System (NHS) and is classified as a Class route per KDOT s route classification. Class routes are non-interstate routes that serve as the most important statewide and interstate corridors for travel. The long-term goal for this route is full-access control as part of planned corridor. STR ond Development Traffic Impact nalysis Page 2 Goddard, Kansas November 218
5 East Kellogg Drive is an east/west frontage road for US-54 and collector street located immediately north of the proposed development with a posted speed limit of 3 mph. West Kellogg Drive is an east/west frontage road for US- 54 and collector with one lane in each direction and a posted speed limit of 3 mph located north of US-54. North Main Street and North Cedar Street are two north/south collector streets with one lane in each direction and a speed limit of 3 mph. North Main Street generally serves as access to the Goddard school complex which includes five schools on the south side of US-54. North Goddard Road/199 th Street is the minor north/south arterial street located west of the proposed site with one lane in each direction and a posted speed limit of 4 mph southbound and 3 mph northbound. 183 rd Street is a minor north/south arterial street located east of the proposed development with one lane in each direction and a posted speed limit of 4 mph. 167 th Street is a minor north/south arterial street with one lane in each direction and a posted speed limit 55 mph both southbound and northbound. 167 th Street generally serves as access to the Eisenhower school complex which includes four schools on the north side of US-54. Future improvements include addition of a signalized intersection at US-54 and arber Street. arber Street north of US-54 currently serves as an access point to US-54 for the residential neighborhood located to the north of West Kellogg Drive (north frontage road) from Casado Road or Seasons Street. The existing site plan for the STR ond Development includes a new arber Street connection to US-54 from the south frontage road. ccess to the proposed site is provided from the East Kellogg Drive (south frontage road) with traffic accessing the south frontage road from the existing traffic signals at 199th Street and 183rd Street. We recommend direct access from US-54 to the proposed site by connecting arber Street to US-54. dditionally, construction of offsite mid-mile circulatory roads to improve choices for alternative paths and connections. Planning for future circulatory roads prior to site development is a great opportunity for the City to identify areas needed for right-ofway and reduce associated acquisition costs. In conjunction with the construction of the arber Street connection, we recommend the realignment of West Kellogg Drive at 183 rd Street in order to increase the storage capacity for the southbound approach, improve accessibility to the frontage road, and increase safety at the intersection by removing conflicts within the intersection s influence area. The proposed realignment has been platted prior to this report and is similar to the constructed frontage road south of US-54 at 183 rd. The proposed site including future proposed improvements are shown in Figure -5 in ppendix. Surrounding Land Use The US-54 corridor through the City of Goddard is a developed area type and includes moderate commercial with predominantly retail and restaurant land uses. griculture land is located on either end of the corridor and surrounds the City of Goddard. residential neighborhood, a trailer park, and commercial businesses are located adjacent to the proposed development on the west. Fast food restaurants are located to the west of North Goddard Road. Walmart is located to the east of the proposed development with access points on 183 rd Street and East Kellogg Drive (south frontage road). n industrial area with multiple businesses is located to the south of the proposed development. Traffic Operation ssessment The study intersections were evaluated based on the methodologies outlined in the Highway Capacity Manual (HCM), 21 Edition, published by the Transportation Research oard. The operating conditions at an intersection are graded by the level of service experienced by drivers. Level of service (LOS) describes the quality of traffic operating conditions and is rated from to F. LOS represents the most desirable condition with free-flow movement of traffic with minimal delays. LOS F generally indicates severely congested conditions with excessive delays to motorists. Intermediate grades of, C, D, and E reflect incremental increases in the average delay per stopped vehicle. Delay is measured in seconds per vehicle. Table 3 shows the upper limit of delay associated with each level of service for signalized and unsignalized intersections. STR ond Development Traffic Impact nalysis Page 3 Goddard, Kansas November 218
6 Table 3 Intersection Level of Service Delay Thresholds Level of Service (LOS) Signalized Unsignalized < 1 Seconds < 1 Seconds < 2 Seconds < 15 Seconds C < 35 Seconds < 25 Seconds D < 55 Seconds < 35 Seconds E < 8 Seconds < 5 Seconds F 8 Seconds 5 Seconds While one of the primary measurements of traffic operations, LOS, applies to both signalized and unsignalized intersections, there are significant differences between how these intersections operate and how they are evaluated. LOS for signalized intersections reflects the operation of the intersection as a whole. While the individual movements may operate with varying LOS ratings, that is largely a function of the signal timings and how the intersection is operating relative to other signals in the vicinity. s an example, in a coordinated system of multiple signalized intersections, some minor side-street approaches may have LOS ratings of D, E or even F. This can be the result of the length of time provided to the major movements and do not reflect a condition where the intersection is operating over capacity or is judged to be operating poorly. Unsignalized intersections, in contrast, are evaluated based on the movement grouping which are required to yield to other traffic. Typically, this is the left turns off of the major street and the side-street approaches for two-way stop-controlled intersections. Lower LOS ratings (D, E and F) do not, in themselves, indicate significant difficulties or the need for additional improvements. Many times there are convenient alternative paths to avoid the longer delays. Other times, the volumes on the unsignalized approaches are relatively minor when compared to the major street traffic. The decision to install a traffic signal, which is often considered when lower LOS ratings are projected, should be based on engineering studies and the warrants for traffic signal installation as outlined in the Federal Highway dministration s Manual on Uniform Traffic Control Devices. Signals are typically not recommended in locations where there are convenient alternative paths, or the installation of a traffic signal would have negative impacts on the surrounding transportation system. For instance, if the new signalized intersection is located too close to existing traffic signals it may not be recommended despite meeting the minimum warrants. In addition to delay (and the corresponding Level of Service), a secondary means of evaluation is often utilized to assess the overall capacity of the intersection or unsignalized movement. This evaluation is a ratio of volume to capacity (v/c) that reflects, regardless of delay, the ability to accommodate the existing or projected traffic volumes over the course of a peak hour. v/c ratio of 1. reflects the capacity of the intersection or movement. Lastly, traffic queues are evaluated as part of the analyses. Long traffic queues which extend beyond the amount of storage available, either between intersections or within turn lanes, can have significant impacts on operations. The projected vehicular queues are analyzed to ensure the analyses are reflective of the physical constraints of the study intersections and to identify if additional storage is needed for turn lanes. The LOS rating deemed acceptable varies by community, facility type and traffic control device. In communities similar to the city of Goddard, a LOS D for signalized intersections is often found to be acceptable. However, at unsignalized intersections LOS D, E and above are often accepted for low to moderate traffic volumes where the installation of a traffic signal is not warranted by the conditions at the intersection or the location has been deemed undesirable for signalization for other reasons, e.g. the close proximity of an existing traffic signal or the presence of a convenient alternative path. STR ond Development Traffic Impact nalysis Page 4 Goddard, Kansas November 218
7 The Synchro software package was used to evaluate signalized and stop controlled intersections. Synchro was also used to evaluate the estimated travel time for the US-54 corridor between 215 th Street to 167 th. Travel time was used as measure of effectiveness (MOE), because the 21 HCM does not calculate a LOS for non-standard intersection phasing, a condition for a Restricted Crossing U-Turn (RCUT) described later in this report. The US-54 travel time is used as a measure of effectiveness when comparing each condition and is summarized in Table 13. In order to calibrate Synchro to real-world conditions, the corridor was driven in both the eastbound and westbound directions from 215 th Street to 167 th Street on January 4, 217 during peak hours. The driven travel times were then compared to the Synchro output travel times for existing conditions. Travel times were within one minute of each other and are summarized in Table 4. Documented results from the Synchro analysis are based on HCM methodology and have been included in ppendix E. Table 4 Existing Conditions Travel Time Comparison verage.m. Peak Hour 1 P.M. Peak Hour 1 Travel Time Eastbound Westbound Eastbound Westbound Driven 4:45 4:28 4:2 4:6 Synchro nalyzed Existing Conditions 5:26 4:5 5: 4:54 1 Travel Time in mm:ss s shown in Table 4, the westbound travel times are general lower than eastbound travel times. Currently, a single free signal timing plan is being utilized and is not adjusted for time-of-day or traffic distribution during peak hours. The existing timing plan favors westbound traffic. Existing Conditions The results of the intersection analysis for the existing conditions during.m. and P.M. peak hour are summarized in Table 5. The study intersections were evaluated with the lane configurations shown on Figure -8. The existing traffic volumes are shown on Figures -9 and -1. ppendix E contains the analyses output files from Synchro. The intersections of East Kellogg Drive/North Cedar Street and East Kellogg Drive/North Goddard Street are not included because the eastbound traffic originates from a parking lot with low traffic volumes and only westbound traffic is stop controlled. Synchro will not evaluate this condition. Table 5 Intersection Operational nalysis Existing Conditions Intersection.M. Peak Hour P.M. Peak Hour Movement LOS 1 Delay 2 v/c 3 LOS 1 Delay 2 v/c 3 US-54 and 215 th Street US-54 and North Main Street Northbound (ll Movements) Eastbound (Left Turn) Westbound (Left Turn) Southbound (ll Movements) Northbound (ll Movements) Eastbound (Left Turn) Westbound (Left Turn) Southbound (ll Movements) West Kellogg Drive and North Main Street Northbound (Left Turn) Eastbound (ll Movements) Westbound (ll Movements) Southbound (Left Turn) STR ond Development Traffic Impact nalysis Page 5 Goddard, Kansas November 218 C C D F C D C E
8 US-54 and North Cedar Street Northbound (ll Movements) Westbound (Left Turn) STR ond Development Traffic Impact nalysis Page 6 Goddard, Kansas November 218 C C US-54 and North Goddard Road/199 th Street ll Movements (Signalized Intersection) D * D * West Kellogg Drive and 199 th Street Northbound (Left Turn) Eastbound (ll Movements) Westbound (ll Movements) Southbound (Left Turn) US-54 and North arber Street Eastbound (Left Turn) Southbound (ll Movements) West Kellogg Drive and North arber Street Northbound (Left Turn) Eastbound (ll Movements) Westbound (ll Movements) Southbound (Left Turn) C E US-54 and 183 rd Street ll Movements (Signalized Intersection) E * D * West Kellogg Drive and 183 rd Street Northbound (Left Turn) Eastbound (ll Movements) East Kellogg Drive and 183 rd Street Northbound (Left Turn) Eastbound (ll Movements) East Kellogg Drive and Walmart Entrance Northbound (ll Movements) Westbound (Left Turn) US-54 and 167 th Street ll Movements (Signalized Intersection) C 2.4.8* * 1 Level of Service 2 Delay in seconds per vehicle 3 Volume/Capacity Ratio * Highest Movement v/c ll the intersections, excluding US-54 and North Goddard Road, US-54 and 183 rd Street, and US-54 and 167 th Street, are stop controlled intersections. The peak hour analyses show that all the intersections perform at acceptable level of service during the peak hours in existing conditions except the signalized intersection of US-54 and 183 rd Street and the southbound movement at the intersection of US-54 and North Main Street. lthough roadway connections to US-54 were evaluated in the traffic analysis, the purpose of this study is to assess the impact of the proposed STR ond Development on the surrounding transportation system. Focus was given to arber Street and the signalized intersections at 183 rd and 199 th Streets. Further refinement should be completed for side street connections to US-54 outside of the focus area. Proposed Development and Traffic Growth Proposed Development The scope of analysis for the assessment of the proposed development s impact on the surrounding transportation system is based in large part on the recommended practices of the Institute of Transportation Engineers (ITE), as outlined in their Traffic Engineering Handbook. ITE is a nationally-recognized organization of transportation professionals with members from both private and public sectors. The analysis of the proposed development s impact includes:
9 Trip Generation estimates; Trip Distribution assumptions; Operational nalysis of the surrounding transportation system; Site Plan Review. Each of these analysis methodologies and findings are described in more detail in the subsequent sections of the report. Trip Generation The vehicle trips generated by the proposed development were estimated using the Institute of Transportation Engineers (ITE) Trip Generation, 9 th Edition. Several assumptions were made to determine the land uses and intensities that were used to develop the trip generation estimates. ssumptions were based on the site plan and data provided by the developer and from engineering judgement. The Goddard quatic Center and Sports Complex is anticipated to be a regional destination attraction with a focus to attract national youth sporting events and tournaments. The hotel is intended to serve not only the sports complex, but also host conferences and other events. Four pad sites are shown in the site plan (Figure -2) along the west side of arber Street. The developer intends for these lots to be restaurants or supporting retail infrastructure. The pad sites were all assumed to be high-turnover restaurants which results in a more conservative trip generation (almost 3 times more trips) compared to trip generation for either a shopping center or specialty retail. The average size for this type of restaurant in the Wichita area is approximately 8, square feet. For comparison based on 1, square feet of gross floor area/leasable space, the average trip generation is trips for high-turnover (sit-down) restaurant compared to 42.7 trips for a shopping center and trips for a specialty retail center. There is no land use in Trip Generation that is directly comparable to the proposed quatics Center and Sports Complex. The total area of the quatics Center is approximately 1, combined square feet over three floors. The plan for the facility includes a building with three large pools on the first floor, which is approximately 7, square feet. The pools include a 5-meter long course competition pool, a 5-meter warm-up pool and a 25-meter training pool with an integrated diving well. The first floor also includes training rooms, locker rooms, several offices, and spectator seating areas. smaller second floor includes a fitness center and more spectator seating. There is a lower floor that has mechanical and equipment rooms. The thletic Club land use in Trip Generation is most similar to the proposed quatics Center and Sports Complex development. The thletic Club land use includes competitive team sport activities, social facilities, pools, locker rooms, athletic courts and workout facilities. It is not likely that the facilities used to develop trip generation data for the thletic Club land use include as much square footage for pools as the proposed quatics Center. The pools at the Goddard quatic Center occupy the vast majority of the square footage of the facility. When developing trip generation estimates for this site, development trips will likely be overestimated if the full square footage of the proposed facility is used. The roughly rectangular portion of the main floor, excluding some of the training rooms and training pool is approximately 5, square feet which is representative of the portion of the facility that will be in use during typical weekday peak hours. The thletic Club Trip Generation also accounts for the four baseball/softball fields to be constructed as part of the facility. The estimated daily,.m. peak hour and P.M. peak hour traffic volumes associated with this development are shown in Table 6. Saturday peak hours were not specifically evaluated. Saturday trip generation and distribution is similar to weekday trips and peak traffic volumes on US-54 are typically 2% less on weekends compared to weekday peak traffic. STR ond Development Traffic Impact nalysis Page 7 Goddard, Kansas November 218
10 Table 6 Development Trip Generation ITE verage.m. Peak Hour P.M. Peak Hour Land Use Intensity Code Daily Total In Out Total In Out Lodging Hotel (total rooms) 15 rooms 31 1, Lodging Sub-Total 15 rooms 1, Dining High-Turnover (Sit-Down) Restaurant 8, sf 932 1, High-Turnover (Sit-Down) Restaurant 8, sf 932 1, High-Turnover (Sit-Down) Restaurant 8, sf 932 1, High-Turnover (Sit-Down) Restaurant 8, sf 932 1, Dining Sub-Total 32, sf 4, quatics Center thletic Club 5, sf 493 2, quatics Center Sub-Total 5, sf 2, Total 7, The proposed development is anticipated to generate approximately 7,46 daily net new trips, with 68 trips in the.m. peak hour and 982 trips in the P.M. peak hour. The generated trips and property use meet the Type 6 access type classification per the KDOT ccess Management Policy. Type 6 access is defined as commercial land use with high traffic volumes of 5 or more trips per day and helps determine the design criteria and location access for the development. The development trip generation shown in Table 6 accounts for the STR bond development and does not include development outside of the proposed development limits, including the east side of arber Street. The aquatics center, hotel and baseball/softball fields are anticipated to be constructed at the same time. The restaurants and other commercial sites are anticipated to be constructed within three (3) years of the aquatics center and hotel completion. When estimating the future year 24 conditions discussed later in this report, existing traffic volumes were increased by regional growth factors accounting for future development, including the area between arber Street and 183 rd Street, within the limits of the study. Trip Distribution The estimated peak hour trips generated by the proposed development were distributed onto the street system based on the trip distributions summarized below. The proposed development is a regional, competitive sports complex with a significant number of trips coming from the east (Wichita). Table 7 illustrates the general distributions used in this study. These distributions are derived based on existing travel patterns and site geometry. The detailed distribution patterns through the study intersections are documented in ppendix C. Table 7 Trip Distribution Direction To/From Percentage East on US-54 5 West on US-54 2 North South Total STR ond Development Traffic Impact nalysis Page 8 Goddard, Kansas November 218
11 Design Characteristics The intersection of both arber Street and 183 rd Street are signalized intersections with Type 6 access in developed areas. Type 6 access is described as a high volume access with 5 or more vehicles per day or 5 or more vehicles per peak hour of the highway. Each proposed improvement was designed to accommodate the turning path of an interstate semitrailer (W-67) design vehicle. lthough the percent of trucks accessing the proposed development is expected to be low, the design will accommodate large trucks for deliveries and other activities. The existing profile of US-54 is level with a vertical profile slope of less than. The intersection sight distance relates to a drivers ability to see approaching vehicles on other legs on the intersection. Signalized intersections do not typically have intersection sight triangle issues except for right turn on red applications. The permitted right turn on a red signal requires the appropriate departure sight triangles for approaching traffic and is a function of approaching vehicle speed and intersection geometry. Figure -7 in ppendix illustrates the proposed functional distances and corner clearances. Table 8 outlines the proposed site characteristics. Table 8 Proposed Design Characteristics Proposed Design Criteria US-54 at arber Street US-54 at 183 rd Street Type of rea Developed Developed ccess Type Type 6 Type 6 Design Vehicle W-67 W-67 US-54 Speed Limit (mph) at intersection 5 5 Stopping Sight Distance (feet) Intersection Sight Distance (feet) Minimum Upstream Functional Distance (feet) W= 785, E= 635 W= 96, E= 995 Minimum Downstream Functional Distance (feet) Corner Clearance (feet) Right Turn from Minor Road at signalized intersection lternative Travel Modes Currently, the proposed bond site does not include sidewalk or other alternative transportation connections (transit, bicycle, pedestrian, etc.) to the surrounding system. When evaluating alternative modes of transportation, pedestrian travel is the most applicable to this development. The Prairie Sunset Trail, a hike/bike trail located along an abandoned railroad line on the south side of the proposed development, connects Garden Plain through Goddard and continues to Wichita. However, the current site plan does not show connections to this trail. On the north side of the proposed development, existing sidewalks, trails, or other alternative modes of travel are not present nor is there an existing pedestrian crossing near US-54. The City of Goddard has indicated that they have an existing issue with pedestrians (including children) trying to cross US-54 from the residential developments on the north side of US-54 to the south side on bicycles or walking. When school is in session, the Goddard Police Department frequently provides transportation to children trying to cross US-54 at 183 rd Street. Neither the existing traffic signal at Goddard Road/199 th Street or 183 rd Street incorporates pedestrian crossings. If feasible, the proposed improvements should incorporate a pedestrian crossing to alleviate pedestrian demand in the area. lternative travel modes (specifically pedestrian facilities) were evaluated within the proposed intersection improvements, but a comprehensive pedestrian plan for the surrounding system was not included. Further refinement should be completed for alternative travel modes and connected pathways. US-54 and arber Street Improvement lternatives Several possible improvements were identified at the study intersection of US-54 and arber Street to achieve an acceptable Level of Service and manage projected vehicular queues from the impact of the proposed development. These improvements include: Installation of a traffic signal at US-54 and arber Street intersection; and STR ond Development Traffic Impact nalysis Page 9 Goddard, Kansas November 218
12 Construction of a Signalized Restricted Crossing U-Turn (RCUT) at US-54 and arber Street with U-turn locations approximately 7 west and 1,16 east of arber Street. The arber Street connection and the two U-turns are collectively evaluated as the RCUT. Restricted Crossing U-Turn (RCUT) intersections, also referred to as super street intersections, are excellent in median locations with dominant traffic on the major road. Compared to conventional at-grade intersections with similar traffic volumes, they move traffic more efficiently and are safer. RCUT intersection works by eliminating direct left turn and through movements from the minor street approaches and instead accommodates those movements by requiring drivers to make a right turn from the minor street approach and then making a U-turn downstream. dditional information on RCUTs may be found in the Federal Highway ssociation (FHW) publication lternative Intersections/Interchanges: Informational Report (IIR). There are several key advantages to an RCUT intersection for access to US-54 from the proposed development: n RCUT intersection has fewer traffic conflict points which relates to fewer crashes. ccording to studies conducted by the FHW, injury crashes may be reduced by 4% and fatal crashes reduced by 7% when compared to traditional signalized intersections. On a signalized RCUT as proposed for this development, only two signal phases are required compared to a traditional intersection. This results in significant time savings and reduced emissions from stopped vehicles. Pedestrians could cross the RCUT signalized intersection in two-stages. They would encounter fewer conflicting traffic streams and have a refuge area in the center median. This two-stage pedestrian crossing approach allows the signal to operate traffic more efficiently than a traditional signal and pedestrians can cross during the left phase cycle. Utilizing an RCUT gets motorist accustomed to using U-turns for access to sites between 183 rd and 199th. U- turns are planned for future freeway access, which is planned to be similar to existing US-54 locations through the City of Wichita (such as in the Woodlawn and Oliver area). For the proposed RCUT in this study, locating the U-turns at the existing signalized intersections, Goddard Road/199 th Street and 183 rd Street, was evaluated but ultimately not chosen because neither the intersection geometry nor traffic signals support the U-turns at the existing intersections. combination of the U-turns at the existing intersections complicate the intersection geometry, require additional space to accommodate turning vehicles, and create more conflict points. Existing Plus Development Condition Intersection analyses were conducted to determine the impact on existing conditions with the addition of the proposed development. For this condition, the development does not directly connect to US-54, but only to the south frontage road. The existing plus development condition includes only improvements that may be completed with the existing infrastructure without additional geometric or traffic signal improvements. The existing traffic signal timings were optimized for this condition but are not coordinated since signal coordination requires additional equipment. The results for the intersection analyses of existing plus proposed development peak hour conditions have been summarized in Table 9. The assessment of existing plus development conditions is an iterative process that begins by applying development traffic volumes to the existing street system. s deficiencies were identified, improvements were considered and evaluated to achieve acceptable levels of service. The study intersections were evaluated with the existing plus development lane configurations, traffic volumes, and traffic controls shown on Figures -11 and -12. ppendix E contains the analysis output files from Synchro. STR ond Development Traffic Impact nalysis Page 1 Goddard, Kansas November 218
13 Table 9 Intersection Operational nalysis Existing Plus Development Conditions Intersection.M. Peak Hour P.M. Peak Hour Movement LOS 1 Delay 2 v/c 3 LOS 1 Delay 2 v/c 3 US-54 and 215 th Street US-54 and North Main Street Northbound (ll Movements) Eastbound (Left Turn) Westbound (Left Turn) Southbound (ll Movements) Northbound (ll Movements) Eastbound (Left Turn) Westbound (Left Turn) Southbound (ll Movements) West Kellogg Drive and North Main Street Northbound (Left Turn) Eastbound (ll Movements) Westbound (ll Movements) Southbound (Left Turn) US-54 and North Cedar Street Northbound (ll Movements) Westbound (Left Turn) C C E F D E E D F D US-54 and North Goddard Road/199 th Street ll Movements (Signalized Intersection) F * F * West Kellogg Drive and 199 th Street Northbound (Left Turn) Eastbound (ll Movements) Westbound (ll Movements) Southbound (Left Turn) US-54 and North arber Street Eastbound (Left Turn) Southbound (ll Movements) West Kellogg Drive and North arber Street Northbound (Left Turn) Eastbound (ll Movements) Westbound (ll Movements) Southbound (Left Turn) C E US-54 and 183 rd Street ll Movements (Signalized Intersection) F * F * West Kellogg Drive and 183 rd Street Northbound (Left Turn) Eastbound (ll Movements) East Kellogg Drive and 183 rd Street Northbound (Left Turn) Eastbound (ll Movements) East Kellogg Drive and Walmart Entrance Northbound (ll Movements) Westbound (Left Turn) C C C US-54 and 167 th Street ll Movements (Signalized Intersection) C * * 1 Level of Service 2 Delay in seconds per vehicle 3 Volume/Capacity Ratio * Highest Movement v/c STR ond Development Traffic Impact nalysis Page 11 Goddard, Kansas November 218
14 The peak hour analyses show that the signalized intersections, except the intersection at US-54 and 167 th Street, perform at a level of service (LOS) F during the peak hours in existing conditions. LOS F is below an acceptable level at these signals and generally indicates severely congested conditions with excessive delays to motorists. To improve the LOS at these intersections, direct access will need to be considered to the site by connecting arber Street to US- 54 by signalization. y distributing development traffic away from the existing intersections, intersection LOS will increase while also improving site access. dditionally, the intersections of US-54/215 th Street, US-54/North Main Street, and US-54/North arber Street indicate the southbound movements operate at a LOS E or lower. Improvements at intersections not directly impacted by the proposed development were not considered as part of this study. The purpose of this study is to assess the impact of the proposed STR ond Development on the surrounding transportation system from 199 th to 183rd. Focus was given to arber Street and the signalized intersections. Further analysis is required for the side street connections to US-54 outside of these limits. Existing Plus Development Condition with Restricted Crossing U-Turn (RCUT) Intersection analyses were conducted to determine the impact on existing conditions with the addition of the proposed development. The system was evaluated with development trips on the existing conditions and the addition of direct access to the proposed development using a Restricted Crossing U-Turn (RCUT) located at arber Street. s shown in the existing plus development condition, the signalized intersections at 199 th and 183 rd Streets perform at LOS F during peak hours. y allowing direct access to the site from US-54, turning traffic at the existing signalized intersections is reduced, increasing the intersection level of service. dditionally, as a regional destination, direct access to the development is easier for motorists not familiar with the location. The results for the intersection analyses of existing plus proposed development peak hour conditions have been summarized in Table 1. The results reflect the improvements considered for this scenario. The study intersections are evaluated with a Restricted Crossing U-Turn (RCUT) type signalized intersection at arber Street, the existing plus development lane configurations, traffic volumes, and traffic controls shown on Figures -13 and -14. ppendix E contains the analysis output files from the Synchro software. Improvements were identified at deficient study intersections to achieve an acceptable Level of Service and manage projected vehicular queues from the impact of the proposed development on existing conditions. These improvements include: Connecting arber Street to US-54 from the development site and constructing a Restricted Crossing U-Turn (RCUT) with U-turn locations approximately 7 west and 1,16 east of arber Street. The west U-turn includes a 2 single left turn lane and the east U-turn includes 38 dual left turn lanes. Median widths are generally 18 on the west single U-turn and 6 on the east dual U-turn. The RCUT requires additional loons to accommodate turning vehicles. The loons provide additional turning space for large vehicles and is shown on Figure -3. Two-Stage pedestrian crossing at the arber Street RCUT signalized intersection. This two-stage pedestrian crossing reduces the impact to motorists for greater efficiently. Installation of a median island on arber Street both north and south side of US-54 to restrict the through movement and the left turn movements from East and West Kellogg Drives onto arber Street and US-54, respectively. This is recommended for safety by reducing conflicting traffic movements with the approaching through roadway. To keep full property access, mid-mile circulation roads as illustrated in Figure -5 would be required. Realignment of West Kellogg Drive at 183 rd Street in order to increase the storage capacity for the southbound approach, improve accessibility to the frontage road, and increase safety at the intersection by removing conflicts within the intersection s influence area. Coordinate the signals at 167 th, 183 rd, arber RCUT and 199 th Street. Installation of a STOP sign on the eastbound approach of the intersection of North Goddard Road and East Kellogg Drive. STR ond Development Traffic Impact nalysis Page 12 Goddard, Kansas November 218
15 Installation of a STOP sign on the eastbound approach of the intersection of North Cedar Street and East Kellogg Drive. Construction of a dedicated 35 southbound left turn and 23 right turn lane located at US-54 and 183 rd Street. Construction of a dedicated 2 northbound right turn lane at US-54 and 183 rd Street. Construction of eastbound single 25 left turn lane at US-54 and arber Street. Construction of westbound dual 45 left turn lanes at US-54 and arber Street. Construction of eastbound and westbound 31 right turn lanes located at US-54 and arber Street. Construction of offsite mid-mile circulatory roads to improve choices for alternative paths and connections. Table 1 Intersection Operational nalysis Existing Plus Development Conditions (RCUT) Intersection.M. Peak Hour P.M. Peak Hour Movement LOS 1 Delay 2 v/c 3 LOS 1 Delay 2 v/c 3 US-54 and 215 th Street US-54 and North Main Street Northbound (ll Movements) Eastbound (Left Turn) Westbound (Left Turn) Southbound (ll Movements) Northbound (ll Movements) Eastbound (Left Turn) Westbound (Left Turn) Southbound (ll Movements) West Kellogg Drive and North Main Street Northbound (Left Turn) Eastbound (ll Movements) Westbound (ll Movements) Southbound (Left Turn) US-54 and North Cedar Street Northbound (ll Movements) Westbound (Left Turn) East Kellogg Drive and North Cedar Street Northbound (ll Movements) Eastbound (ll Movements) Westbound (ll Movements) C C E F D E E D F D Southbound (ll Movements) US-54 and North Goddard Road/199 th Street ll Movements (Signalized Intersection) D * D * West Kellogg Drive and 199 th Street Northbound (Left Turn) Eastbound (ll Movements) Westbound (ll Movements) Southbound (Left Turn) East Kellogg Drive and North Goddard Road Northbound (Left Turn) Eastbound (ll Movements) Westbound (ll Movements) Southbound (Left Turn) US-54 and North arber Street (RCUT)** ll Movements (Signalized Intersection) N N N N N N STR ond Development Traffic Impact nalysis Page 13 Goddard, Kansas November 218
16 West Kellogg Drive and North arber Street Eastbound (ll Movements) Westbound (ll Movements) East Kellogg Drive and North arber Street Eastbound (ll Movements) Westbound (ll Movements) West Kellogg Drive and Seasons Street Eastbound (Left Turn) Southbound (ll Movements) STR ond Development Traffic Impact nalysis Page 14 Goddard, Kansas November US-54 and 183 rd Street ll Movements (Signalized Intersection) E * D * West Kellogg Drive and 183 rd Street Northbound (Left Turn) Eastbound (ll Movements) East Kellogg Drive and 183 rd Street Northbound (Left Turn) Eastbound (ll Movements) East Kellogg Drive and Walmart Entrance Northbound (ll Movements) Westbound (Left Turn) US-54 and 167 th Street ll Movements (Signalized Intersection) C * C * 1 Level of Service 3- Volume/Capacity Ratio ** - Includes signalized U-turns. LOS not supported by 21 HCM. See Table 11 for US-54 MOE 2 Delay in seconds per vehicle * - Highest Movement V/C The peak hour analyses shows that all the signalized intersections perform at an acceptable level of service during the peak hours with the RCUT. While a LOS E at US-54 and 183 rd Street is below generally acceptable practices, the LOS is maintained to existing levels, but includes the additional development traffic. lthough functioning poorly, the corridor is anticipated to continue as a signalized corridor until the freeway facility is funded and constructed (freeway concept plans have been completed to a field check phase). t the intersections of US-54/215 th Street, US-54/North Main Street, and US-54/North arber Street the southbound movements are found to operate at a LOS E or lower. Due to the increased vehicle weaving and signals from the RCUT along with the City of Goddard s expansion towards the east, it is recommended to move the existing 5 mph speed limits to the east side of 183 rd prior to the existing signal. This removes the speed limit change from within the RCUT mixing area, allows for better recognition of approaching traffic on the corridor, and provides a logical location for traffic to anticipate a speed limit change. Future Year 24 Conditions The results for the intersection analyses for the future 24 development peak hour conditions have been summarized for the RCUT in Table 11. The study intersections were evaluated with the future lane configurations and traffic control shown on Figures -5 and -6. Growth factors were derived from the most recent updates to the region s current forecasted plan found in Wichita rea Metropolitan Planning Organization (WMPO) travel demand model and the growth applied to the existing turning movement volumes. The future peak hour traffic volumes were increased approximately 3.% per year on the north and south approaches and approximately 1. per year on US-54. The difference in traffic volumes were then distributed based on existing and anticipated travel patterns. The intersections of West Kellogg Drive/199 th Street, East Kellogg Drive/N. Goddard Road, and West Kellogg Drive/183 rd Street are not included for future 24 charts. Traffic volumes exceed intersection capacity due to the close proximity of the frontage roads to US-54 and cannot be adequately evaluated for this condition using Synchro. dditional traffic from these intersections is not anticipated to significantly increase traffic volumes at the arber Street (RCUT) intersection. Proposed medians at arber Street will restrict drivers from turning left making the existing intersections a more direct route and remain the driver choice. The future traffic volumes are shown in Figures -15 and -16. ppendix E contains the output files from Synchro.
17 Table 11 Intersection Operational nalysis Future Year 24 Conditions (RCUT) Intersection.M. Peak Hour P.M. Peak Hour Movement LOS 1 Delay 2 v/c 3 LOS 1 Delay 2 v/c 3 US-54 and 215 th Street US-54 and North Main Street Northbound (ll Movements) Eastbound (Left Turn) Westbound (Left Turn) Southbound (ll Movements) Northbound (ll Movements) Eastbound (Left Turn) Westbound (Left Turn) Southbound (ll Movements) West Kellogg Drive and North Main Street Northbound (Left Turn) Eastbound (ll Movements) Westbound (ll Movements) Southbound (Left Turn) US-54 and North Cedar Street Northbound (ll Movements) Westbound (Left Turn) East Kellogg Drive and North Cedar Street Northbound (ll Movements) Eastbound (ll Movements) Westbound (ll Movements) F F F C F F C > >3 > > > F C F F F C E F > >3 > > > Southbound (ll Movements) US-54 and North Goddard Road/199 th Street ll Movements (Signalized Intersection) F * F * US-54 and North arber Street (RCUT)** ll Movements (Signalized Intersection) N N N N N N West Kellogg Drive and North arber Street Eastbound (ll Movements) Westbound (ll Movements) East Kellogg Drive and North arber Street Eastbound (ll Movements) Westbound (ll Movements) West Kellogg Drive and Seasons Street Eastbound (Left Turn) Southbound (ll Movements) US-54 and 183 rd Street ll Movements (Signalized Intersection) F * F * East Kellogg Drive and 183 rd Street Northbound (Left Turn) Eastbound (ll Movements) East Kellogg Drive and Walmart Entrance Northbound (ll Movements) Westbound (Left Turn) C US-54 and 167 th Street ll Movements (Signalized Intersection) F * E * 1 Level of Service 2 Delay in seconds per vehicle 3 Volume/Capacity Ratio * Highest Movement v/c ** - Includes signalized U-turns. LOS not supported by 21 HCM. STR ond Development Traffic Impact nalysis Page 15 Goddard, Kansas November 218
18 The results of the analysis show that the study corridor will not operate at acceptable levels of service in the future year 24 with the exception of minor streets. 183 rd and 199 th Street footprints were increased to be more representative of the future (dual lefts, etc.) for the analysis. The purpose of the future scenario is to examine how the RCUT performs adjacent to 183 rd and 199 th prior to the freeway facility being constructed along US-54. lthough both signals adjacent to the arber intersection experience issues (even if there was no signal at arber Street the traffic volumes begin to exceed capacities in the peak hours), due to the two phase signal, the arber RCUT is still able to operate with relatively minor queuing along US-54 or arber Street and maintain proper coordination between the signals at 183 rd and 199 th streets during the future scenario. dditional Future Year nalysis The RCUT was further evaluated to determine its maximum capacity before creating significant impacts to US-54 through traffic, queuing or excessive delay at the intersection. Using Synchro to perform the analysis, we began with the future year 24 Condition (RCUT) volumes then increased the development traffic until the RCUT was no longer functioning reasonably. Signal timings and coordination were then modified for additional efficiencies. The intersection was then re-evaluated until the intersection was over capacity. The saturation point was determined to be when the westbound dual-left turn lane at arber Street experienced excessive spill over onto the westbound US-54 through lanes and the northbound right-turn took several cycles in order to clear the traffic queue. fter several iterations, we determined that development trips could approximately double (from the future year 24 volumes) and the RCUT would still reasonably be working. Traffic Queuing Traffic queue lengths are evaluated to determine the required storage length of turn bays. When the number of vehicles is greater than the allowable storage space, turning vehicles may spill over into through lanes. Inadequate storage not only creates a potentially unsafe condition, but can reduce the intersection capacity and increase delay. The RCUT was evaluated for both the Existing Plus Development and Future Year 24 Conditions. The intersection of US-54 and 183 rd Street was evaluated for the Existing Plus Development condition with the recommended improvements previously discussed and shown in Figure -3. US-54 and 183 rd Street was not evaluated for the Future Year 24 condition since the intersection will require additional geometric improvements in order to maintain an acceptable LOS as previously discussed. The geometric improvements include additional left, right and through lanes on 183 rd Street as shown in the previously completed US-54 freeway concept plans. The turn lane lengths as shown on Figure -6 are recommended based on the 95 th percentile queue lengths analyzed from Synchro. lthough Synchro is not able to support a calculated Level of Service (LOS) for signalized U-turns (RCUT) as previously discussed, Synchro can estimate queue lengths. The 95th percentile traffic queue lengths were evaluated using the Synchro software and the results are shown in Table 12. Table 12 Peak Hour 95th Percentile Queue Lengths (RCUT) Intersection Exist. + Dev. Future Year 24 Movement.M. P.M..M. P.M. US-54 and West RCUT U-Turn Westbound (U-Turn) US-54 and North arber Street (RCUT) Eastbound (Left Turn) Eastbound (Right Turn) Westbound (Left Turn) Westbound (Right Turn) Northbound (Right Turn) Southbound (Right Turn) STR ond Development Traffic Impact nalysis Page 16 Goddard, Kansas November 218
19 US-54 and East RCUT U-Turn US-54 and 183 rd Street * dditional intersection improvements required by Future 24. Eastbound (U-Turn) Eastbound (Left Turn) Eastbound (Right Turn) Westbound (Left Turn) Westbound (Right Turn) Northbound (Left Turn) Northbound (Right Turn) Southbound (Left Turn) Southbound (Right Turn) Summary This study documents the transportation impact of the proposed STR ond Development in Goddard, Kansas. Included in this study is a review of the anticipated impact of the proposed development on the existing transportation system and the resulting improvements necessary to mitigate development traffic and maintain the best capacity until US-54 is ultimately developed into a freeway facility with grade-separated arterials. This study is a review of the existing plus development condition with no improvements, the existing plus development condition with a Restricted Crossing U-Turn Intersection (RCUT) concept for US-54 and arber Street, and future 24 conditions; Specifically: The amount of vehicular traffic estimated to be generated by the development; The projected distribution patterns of the development traffic onto the surrounding transportation system; n analysis of existing intersection operating conditions; n analysis of the intersection operating conditions with the addition of the proposed development; and Identification of improvements to the surrounding transportation system to mitigate the potential impact of the proposed development. The 21 Highway Capacity Manual (HCM) does not support a calculated Level of Service (LOS) for clustered intersections such as the proposed RCUT. To compare the effectiveness of each condition, the estimated overall delay and travel time (in seconds) for the US-54 corridor was calculated and summarized in Table 13. Documented results from the Synchro analysis have been included in ppendix D. Existing Table 13 US-54 Corridor Measures of Effectiveness (MOE).M. Peak Hour P.M. Peak Hour Condition Delay 1 Travel Time 2 Delay 1 Travel Time 2 Eastbound Westbound Existing + Development Eastbound Westbound Existing + Development (RCUT) Eastbound Westbound Future Year 24 (RCUT) Eastbound Westbound Delay in seconds per vehicle 2 US-54 Travel Time in seconds N/* N/* STR ond Development Traffic Impact nalysis Page 17 Goddard, Kansas November 218
20 The proposed development is anticipated to generate approximately 7,46 daily net new trips, with 68 trips in the.m. peak hour and 982 trips in the P.M. peak hour. Proposed pad sites were conservatively evaluated as high-turn over restaurants generating almost 3 times more trips than shopping centers or specialty retail centers. The development trip generation accounts for the STR bond development and does not include development outside of the proposed development limits. Future year conditions were increased by regional growth factors accounting for future development. dditionally, the RCUT was evaluated to determine its maximum capacity. It was determined that development trips could approximately double and the RCUT would still operate without excessive queuing or delay. The following improvements are recommended to mitigate the impact of the proposed development on the existing transportation system until the ultimate US-54 freeway section is constructed. Recommended improvements are shown on Figure -6 in ppendix : Coordination of the signals at the intersections of 167 th Street, 183 th Street, and 199 th Street with US-54 to ensure more efficient traffic flow. Coordinated signals result in less frequent stops and reduce the overall delays on the corridor. In addition to coordination, using the suggested timing plan and lagging the westbound left turn movements at 183 rd and 167 th Street results in improved capacity, efficiency, and reduced delays. lthough both the concepts discussed (signalized arber Street and the RCUT intersection) provide acceptable LOS for the existing plus development conditions, with future growth, the RCUT concept will provide greater capacity, increased safety and improved movement of traffic. The RCUT at the aber Street and US-54 intersection results in longer green intervals and reduced stops when compared to improvement alternatives. lthough the RCUT provides superior efficiencies over a traffic signal, the RCUT is an unconventional design. Public acceptance and input is critical to the success of the design. Connecting arber Street to US-54 from the development site and constructing a RCUT with U-turn locations approximately 7 west and 1,16 east of arber Street. The west U-turn includes a 2 single left turn lane and the east U-turn includes 38 dual left turn lanes. Median widths are generally 18 on the west single U- turn and 6 on the east dual U-turn. The RCUT requires additional loons to accommodate turning vehicles. The loons provide additional turning space for large vehicles and is shown on Figure -3. Installing a two-stage pedestrian crossing at the arber Street RCUT intersection. Providing an at-grade pedestrian crossing is not recommended as a long-term solution, but only to provide the ability for pedestrians to cross until a permanent crossing, such as a grade-separated pedestrian crossing or the future freeway section, can be established. Installation of a median islands on arber Street both north and south side of US-54 to restrict the through movements and the left turn movements from East and West Kellogg Drives onto arber Street and US-54, respectively. This is recommended for safety by reducing conflicting traffic movements. dditional site access will likely need to be constructed to maintain good access to the properties. Realignment of West Kellogg Drive at 183 rd Street in order to increase the storage capacity for the southbound approach, improve accessibility to the frontage road, and increase safety at the intersection by removing conflicts within the intersection s influence area. The proposed realignment has been previously platted prior to this report and is similar to the constructed frontage road south of US-54 at 183 rd. Installation of a STOP sign on the eastbound approach of the intersection of North Goddard Road and East Kellogg Drive. Installation of a STOP sign on the eastbound approach of the intersection of North Cedar Street and East Kellogg Drive. Installation of STOP signs on Kellogg Drive (both north and south US-54) at arber Street. Construction of a dedicated 35 southbound left turn and 23 right turn lane located at US-54 and 183 rd Street. Construction of a dedicated 2 northbound right turn lane at US-54 and 183 rd Street. Construction of eastbound single 25 left turn lane at US-54 and arber Street. Construction of westbound dual 45 left turn lanes at US-54 and arber Street. Construction of eastbound and westbound 31 right turn lanes located at US-54 and arber Street. STR ond Development Traffic Impact nalysis Page 18 Goddard, Kansas November 218
21 Construction of offsite mid-mile circulatory roads to improve choices for alternative paths and connections. Planning for future circulatory roads prior to site development is a great opportunity for the City to identify areas needed for right-of-way and reduce associated acquisition costs. Installation of advanced traffic signal warning for E traffic before the199 th Street traffic signal. 199 th Street is the first signalized intersection into the corridor from the west. Generally, a signalized intersection occurs every mile for W traffic and advanced warning is not needed. Relocate the 5 mph speed limits to the east side of 183 rd Street prior to the signal. Excluding the installation of median islands on arber Street both north and south of US-54 and construction of mid-mile roadways, all recommendations should be constructed concurrently with the proposed development. lthough operations at arber Street were not specifically studied without medians islands on the frontage roads, existing locations within Wichita region, including Goddard, have shown that restricting vehicle movements when the frontage road is in close proximity to the intersection is necessary for safety and proper operation of the intersection. t a minimum, the median islands at arber Street should be installed when the intersection crash frequency exceeds the state critical crash rate for urban intersections. dditionally, installation of the median islands will trigger the necessity of mid-mile or additional circulatory roadways to provide access around the development and prevent vehicles traveling on the frontage roads from required U-turns within the development. STR ond Development Traffic Impact nalysis Page 19 Goddard, Kansas November 218
22 ppendix - Figures Figure -1 Location Map Figure -2 Site Plan Figure -3 Preliminary Concept Figure -4 Typical Sections Figure -5 Future Concept Figure -6 Future Lane Configurations and Proposed Improvements Figure -7 Proposed Design Characteristics Figure -8 Existing - Lane Configurations Figure -9 Existing -.M. Peak Hour Traffic Volumes Figure -1 Existing - P.M. Peak Hour Traffic Volumes Figure -11 Existing Plus Proposed Development Conditions -.M. Peak Hour Traffic Volumes Figure -12 Existing Plus Proposed Development Conditions - P.M. Peak Hour Traffic Volumes Figure -13 Existing Plus Proposed Development Conditions (RCUT) -.M. Peak Hour Traffic Volumes Figure -14 Existing Plus Proposed Development Conditions (RCUT) - P.M. Peak Hour Traffic Volumes Figure -15 Future 24 Conditions (RCUT) -.M. Peak Hour Traffic Volumes Figure -16 Future 24 Conditions (RCUT) - P.M. Peak Hour Traffic Volumes Figure -17 verage Daily Traffic STR ond Development Traffic Impact nalysis Goddard, Kansas
23 199th St. 167th St. 183rd St. 215th St. Goddard Rd. ST. NORTH HWKINS URTON SHERIC ST. W MPLE ST. 6th St. / Maple PLESNT RIDGE CEMETERY HWKINS LN. ESTRIDGE ST. ST. NDREW WINTERSET CIR. N OK ST. SUNSET ST. UTUMN PL. SPRINGFIELD ST. US-54 HOPPER DR. MRTENS DR. W. KELLOGG DR. (NORTH FRONTGE ROD) CSDO RD. RER SESONS ST. SUMMERWOOD ST. US-54 MIDDLE LERNING CENTER TIM MY CT. ST. 7TH ST. ESY WLNUT ST. 7THST. WLNUT ST. SPRUCE ST. 3RD 2ND ST. SPRUCE 1ST SNT FE PINE ST. ST. OK MIN ST. 4TH GODDRD MEDICL CLINIC N. CEDR ST. 6TH ST. ST. CEDR ST. ELM ST. GODDRD RD. 6TH ST. 5TH 4TH 3RD E. KELLOGG DR. (SOUTH FRONTGE ROD) ST. ST. ST. Proposed Development ike Path (bandoned.t. & S.F. Railroad) SOUTH ST. GODDRD JR. HIGH RICHRD RD. MIN ST. RGON DR. ELM SHENNDOH DR. LNGTON DR. INDUSTRIL ST. RZOS SPRUCE ST. DR. SHWNEE STEWRT DR. DR. 23rd St. / Pawnee S 222nd ST W S 218th ST. W W 24th ST. S S 215th ST. W W. 24th ST. S. S. 28th ST. W. November 218 STR ond Development LOCTION MP Figure -1 Goddard, Kansas No Scale


24 NORTH SITE PLN STR ond Development Goddard, Kansas November 218 No Scale Figure -2


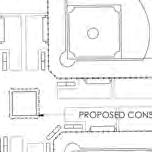
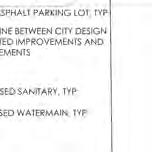
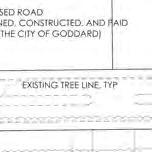
25 LEGEND New Pavement Pavement Removal rick Grass ñ See Figure -4 for Typical Sections W. Kelogg Dr. E. Kelogg Dr. arber St. ñ ñ ñ ñ Seasons St. C C D D US-54 arber St. arber Intersection Detail PRELIMINRY CONCEPT STR ond Development Goddard, Kansas November 218 No Scale Figure -3
26 1.' 24.' 12.' 18.' 24.' 1.' Existing Shoulder Existing Shoulder Concrete Pavement (1" Uniform)(E)(NRDJ) 6" Topsoil Existing Ground 6" Crushed Stone Subgrade Existing Pavement (to Remain) 6" Compaction of Earthwork (Type )(MR--5) Curb & Gutter (Typ.) TYPICL SECTION - West U-Turn 1.' 24.' 18.' 12.' 24.' 1.' Existing Existing Shoulder Shoulder Existing Pavement (to Remain) Curb & Gutter (Typ.) 6" Topsoil Concrete Pavement (1" Uniform)(E)(NRDJ) Existing Ground 6" Crushed Stone Subgrade 6" Compaction of Earthwork (Type )(MR--5) TYPICL SECTION - West U-Turn 1.' 24.' 24.' 6.' 24.' 1.' Existing Shoulder Existing Shoulder Concrete Pavement (1" Uniform)(E)(NRDJ) 6" Crushed Stone Subgrade 6" Compaction of Earthwork (Type )(MR--5) Existing Pavement (to Remain) Curb & Gutter (Typ.) Concrete Pavement w/ rick Pattern Existing Ground TYPICL SECTION C-C East U-Turn 1.' 24.' 6.' 24.' 24.' 1.' Existing Existing Shoulder Shoulder Concrete Pavement Curb & Gutter (Typ.) (1" Uniform)(E)(NRDJ) Existing Pavement Existing Ground Concrete Pavement w/ rick Pattern 6" Crushed Stone Subgrade 6" Compaction of Earthwork (Type )(MR--5) (to Remain) TYPICL SECTION D-D East U-Turn TYPICL SECTIONS Star ond Development Goddard, Kansas November 218 No Scale Figure -4


27 LEGEND New Pavement Pavement Removal rick Grass W. Kelogg Dr. Seasons St. US-54 E. Kelogg Dr. N. Main St. N. Cedar St. N. Goddard Rd. 183rd St. FUTURE CONCEPT STR ond Development Goddard, Kansas November 218 No Scale Figure -5
28 * Existing Items Screened for Clarity S. 183rd St. arber St. S. 199th St. N. Main St. W. 167th St. S. 215th St. N. Goddard Rd. N. Cedar St. arber St. [35'] [23'] W. 167th St. S. 183rd St. [2'] W 3-3 w/ Flashing eacons [23'] - Turn ay Length - Lane Configuration - Stop Sign - Tra fic Signal (Coordinated) LEGEND* W. Kellogg Dr. NORTH [31'] SPEED LIMIT 5 US-54 [Lead Lt.] [2'] [45'] [Lag Lt.] [Lag Lt.] [Lead Lt.] [25'] [38'] [Lead Lt.] [Lead Lt.] [31'] SPEED L MI IT 6 E. Kellogg Dr. Proposed Development FUTURE LNE CONFIGURTIONS & PROPOSED IMPROVEMENTS STR ond Development Goddard, Kansas November 218 No Scale Figure -6

29 NORTH 183rd St. Novem ber 218 No Scale Figure -7 E. Kelogg Dr. W. Kelogg Dr. 355' Min. Downstream Functional Distance 995' Min. Upstream Functional Distance 115' Corner Clearance 115' Corner Clearance 96' Min. Upstream Functional Distance 355' Min. Downstream Functional Distance US-54 STR ond Developm ent Goddard, Kansas US-54 & 183RD STREET INTERSECTION 115' Corner Clearance 355' Min. Downstream Functional Distance 635' Min. Upstream Functional Distance arber St. 115' Corner Clearance 355' Min. Downstream Functional Distance W. Kellogg Dr. 785' Min. Upstream Functional Distance E. Kellogg Dr. US-54 PROPOSED DESIGN CHRCTERISTICS US-54 & RER STREET INTERSECTION
30 S. 183rd St. arber St. S. 199th St. N. Main St. W. 167th St. S. 215th St. S. 215th St. W. 167th St. N. Goddard Rd. N. Cedar St. N. Main St. S. 183rd St. [55'] [21'] [23'] - Turn ay Length - Lane Configuration - Stop Sign - Tra fic Signal LEGEND NORTH W. Kellogg Dr. [136'] [4'] [225'] [65'] [555'] [26'] [75'] [245'] [142'] [3'] [136'] [14'] [336'] [235'] [234'] [525'] [225'] [3'] US-54 [85'] [85'] [165'] [748'] [55'] [745'] [115'] E. Kellogg Dr. [115'] [115'] EXISTING LNE CONFIGURTION STR ond Development Goddard, Kansas November 218 No Scale Figure -8
31 N. Main St. S. 183rd St. S. 199th St. W. 167th St. N. Goddard Rd. N. Cedar St. N. Main St. arber St. W. 167th St. S. 215th St. S. 183rd St Level of Service (Signal Control) 123 Level of Service (Stop Control) Total Hourly Volum e LEGEND W. Kellogg Dr NORTH C F C C E D C 14 C US D C E. Kellogg Dr Proposed Development 3 EXISTING.M. PEK HOUR TRFFIC VOLUMES STR ond Development Goddard, Kansas November 218 No Scale Figure -9
32 N. Main St. S. 183rd St. S. 199th St. W. 167th St. N. Goddard Rd. N. Cedar St. N. Main St. arber St. W. 167th St. S. 215th St. S. 183rd St C Level of Service (Signal Control) 123 Level of Service (Stop Control) Total Hourly Volum e LEGEND W. Kellogg Dr NORTH E E D D D US C C E. Kellogg Dr Proposed Development 2 EXISTING P.M. PEK HOUR TRFFIC VOLUMES STR ond Development Goddard, Kansas November 218 No Scale Figure -1
33 N. Main St. S. 183rd St. S. 199th St. W. 167th St. N. Goddard Rd. N. Cedar St. N. Main St. arber St. W. 167th St. S. 215th St. S. 183rd St D Level of Service (Signal Control) 123 Level of Service (Stop Control) Total Hourly Volum e LEGEND W. Kellogg Dr NORTH C F D F F C US E C E. Kellogg Dr Proposed Development 9 EXISTING PLUS DEVELOPMENT.M. PEK HOUR TRFFIC VOLUMES STR ond Development Goddard, Kansas November 218 No Scale Figure -11
34 N. Main St. S. 183rd St. S. 199th St. W. 167th St. N. Goddard Rd. N. Cedar St. N. Main St. arber St. W. 167th St. S. 215th St. S. 183rd St C C C Level of Service (Signal Control) 123 Level of Service (Stop Control) Total Hourly Volum e LEGEND W. Kellogg Dr NORTH E F E F F US C E E. Kellogg Dr Proposed Development 6 EXISTING PLUS DEVELOPMENT P.M. PEK HOUR TRFFIC VOLUMES STR ond Development Goddard, Kansas November 218 No Scale Figure -12
35 N. Main St. S. 183rd St. S. 199th St. W. 167th St. N. Goddard Rd. N. Cedar St. arber St. W. 167th St. S. 215th St. arber St. S. 183rd St D Signal Control (LOS not supported by 21 HCM) - Level of Service (Signal Control) Level of Service (Stop Control) C Total Hourly Volum e 6 13 LEGEND F W. Kellogg Dr D US E C NORTH E C E. Kellogg Dr Proposed Development EXISTING PLUS DEVELOPMENT (RCUT).M. PEK HOUR TRFFIC VOLUMES STR ond Development Goddard, Kansas November 218 No Scale Figure -13
36 N. Main St. S. 183rd St. S. 199th St. W. 167th St. N. Goddard Rd. N. Cedar St. arber St. W. 167th St. S. 215th St. arber St. S. 183rd St D 19 - Signal Control (LOS not supported by 21 HCM) - Level of Service (Signal Control) Level of Service (Stop Control) E 9 1 Total Hourly Volum e LEGEND F W. Kellogg Dr D US D C NORTH D E E. Kellogg Dr Proposed Development EXISTING PLUS DEVELOPMENT (RCUT) P.M. PEK HOUR TRFFIC VOLUMES STR ond Development Goddard, Kansas November 218 No Scale Figure -14
37 N. Main St. S. 183rd St. S. 199th St. W. 167th St. N. Goddard Rd. N. Cedar St. arber St. W. 167th St. S. 215th St. arber St. C S. 183rd St F Signal Control (LOS not supported by 21 HCM) - Level of Service (Signal Control) Level of Service (Stop Control) F 4 64 Total Hourly Volum e LEGEND F C W. Kellogg Dr C C F C US F F NORTH F F E 8 E. Kellogg Dr F Proposed Development FUTURE YER 24 (RCUT).M. PEK HOUR TRFFIC VOLUMES STR ond Development Goddard, Kansas November 218 No Scale Figure -15
38 N. Main St. S. 183rd St. S. 199th St. W. 167th St. N. Goddard Rd. N. Cedar St. arber St. W. 167th St. S. 215th St. arber St. C S. 183rd St F C 62 - Signal Control (LOS not supported by 21 HCM) - Level of Service (Signal Control) C Level of Service (Stop Control) F Total Hourly Volum e LEGEND C F E W. Kellogg Dr F F F US F E NORTH F F E. Kellogg Dr F Proposed Development FUTURE YER 24 (RCUT) P.M. PEK HOUR TRFFIC VOLUMES STR ond Development Goddard, Kansas November 218 No Scale Figure -16
39 S. 183rd St. arber St. S. 199th St. N. Main St. W. 167th St. S. 215th St. S. 215th St. W. 167th St. N. Goddard Rd. N. Cedar St. N. Main St. S. 183rd St. NORTH [1215] [16] [597] [575] [527] W. Kellogg Dr. [52] [62] [519] [619] [895] [8762] [972] [6234] [849] US-54 [892] [98] E. Kellogg Dr. [259] [2434] VERGE DILY TRFFIC STR ond Development Goddard, Kansas November 218 No Scale Figure -17
40 ppendix Daily Traffic Counts and Spot Speed Studies See attached worksheets. STR ond Development Traffic Impact nalysis Goddard, Kansas
41 Location: US-54 West of 215th Street Daily Traffic Count Goddard Traffic Impact Study Goddard, Kansas Period Period Period Period Start W E TOTL Start W E TOTL Start W E TOTL Start W E TOTL 12:a :a :p :p :15a :15a :15p :15p :3a :3a :3p :3p :45a :45a :45p :45p :a :a :p :p :15a :15a :15p :15p :3a :3a :3p :3p :45a :45a :45p :45p :a :a :p :p :15a :15a :15p :15p :3a :3a :3p :3p :45a :45a :45p :45p :a :a :p :p :15a :15a :15p :15p :3a :3a :3p :3p :45a :45a :45p :45p :a :a :p :p :15a :15a :15p :15p :3a :3a :3p :3p :45a :45a :45p :45p :a :a :p :p :15a :15a :15p :15p :3a :3a :3p :3p :45a :45a :45p :45p Count in 15 min. periods :a 1:a 2:a 3:a 4:a 5:a 6:a 7:a 8:a 9:a 1:a 11:a 12:p 1:p 2:p Time of Day 3:p 4:p 5:p 6:p 7:p 8:p TOTL W E 9:p 1:p 11:p HOURLY TOTLS Period Start W E TOTL 12:a :a :a :a :a :a :a :a :a :a :a :a :p :p :p :p :p :p :p :p :p :p :p :p M Peak Mid-day Peak PM Peak pproach Count Start Date 7:a - 8:a 2:3p - 3:3p 4:45p - 5:45p Totals Westbound Mon 11/16/15 12: M ,19 Eastbound Mon 11/16/15 12: M ,234 TOTL ,99 12,424 TranSystems Corporation 245 N. Waco, Ste. 222, Wichita, KS (316) 33-3
42 Daily Traffic Count Goddard Traffic Impact Study Goddard, Kansas Location: US-54 etween Main Street & 199th Street Period Period Period Period Start W E TOTL Start W E TOTL Start W E TOTL Start W E TOTL 12:a :a :p :p :15a :15a :15p :15p :3a :3a :3p :3p :45a :45a :45p :45p :a :a :p :p :15a :15a :15p :15p :3a :3a :3p :3p :45a :45a :45p :45p :a :a :p :p :15a :15a :15p :15p :3a :3a :3p :3p :45a :45a :45p :45p :a :a :p :p :15a :15a :15p :15p :3a :3a :3p :3p :45a :45a :45p :45p :a :a :p :p :15a :15a :15p :15p :3a :3a :3p :3p :45a :45a :45p :45p :a :a :p :p :15a :15a :15p :15p :3a :3a :3p :3p :45a :45a :45p :45p Count in 15 min. periods :a 1:a 2:a 3:a 4:a 5:a 6:a 7:a 8:a 9:a 1:a 11:a 12:p 1:p 2:p Time of Day 3:p 4:p 5:p 6:p 7:p 8:p TOTL W E 9:p 1:p 11:p HOURLY TOTLS Period Start W E TOTL 12:a :a :a :a :a :a :a :a :a :a :a :a :p :p :p :p :p :p :p :p :p :p :p :p M Peak Mid-day Peak PM Peak pproach Count Start Date 7:a - 8:a 2:3p - 3:3p 5:p - 6:p Totals Westbound Mon 11/9/15 12: M ,95 Eastbound Mon 11/9/15 12: M ,49 TOTL 1,31 1,134 1,425 16,54 TranSystems Corporation 245 N. Waco, Ste. 222, Wichita, KS (316) 33-3
43 Daily Traffic Count Goddard Traffic Impact Study Goddard, Kansas Location: US-54 etween 199th Street & 183rd Street Period Period Period Period Start W E TOTL Start W E TOTL Start W E TOTL Start W E TOTL 12:a :a :p :p :15a :15a :15p :15p :3a :3a :3p :3p :45a :45a :45p :45p :a :a :p :p :15a :15a :15p :15p :3a :3a :3p :3p :45a :45a :45p :45p :a :a :p :p :15a :15a :15p :15p :3a :3a :3p :3p :45a :45a :45p :45p :a :a :p :p :15a :15a :15p :15p :3a :3a :3p :3p :45a :45a :45p :45p :a :a :p :p :15a :15a :15p :15p :3a :3a :3p :3p :45a :45a :45p :45p :a :a :p :p :15a :15a :15p :15p :3a :3a :3p :3p :45a :45a :45p :45p Count in 15 min. periods :a 1:a 2:a 3:a 4:a 5:a 6:a 7:a 8:a 9:a 1:a 11:a 12:p 1:p 2:p Time of Day 3:p 4:p 5:p 6:p 7:p 8:p TOTL W E 9:p 1:p 11:p HOURLY TOTLS Period Start W E TOTL 12:a :a :a :a :a :a :a :a :a :a :a :a :p :p :p :p :p :p :p :p :p :p :p :p M Peak Mid-day Peak PM Peak pproach Count Start Date 7:a - 8:a 2:3p - 3:3p 4:3p - 5:3p Totals Westbound Mon 11/16/15 12: M ,762 Eastbound Mon 11/16/15 12: M ,92 TOTL 1,4 1,263 1,473 17,682 TranSystems Corporation 245 N. Waco, Ste. 222, Wichita, KS (316) 33-3
44 Location: US-54 East of 183rd Street Daily Traffic Count Goddard Traffic Impact Study Goddard, Kansas Period Period Period Period Start W E TOTL Start W E TOTL Start W E TOTL Start W E TOTL 12:a :a :p :p :15a :15a :15p :15p :3a :3a :3p :3p :45a :45a :45p :45p :a :a :p :p :15a :15a :15p :15p :3a :3a :3p :3p :45a :45a :45p :45p :a :a :p :p :15a :15a :15p :15p :3a :3a :3p :3p :45a :45a :45p :45p :a :a :p :p :15a :15a :15p :15p :3a :3a :3p :3p :45a :45a :45p :45p :a :a :p :p :15a :15a :15p :15p :3a :3a :3p :3p :45a :45a :45p :45p :a :a :p :p :15a :15a :15p :15p :3a :3a :3p :3p :45a :45a :45p :45p Count in 15 min. periods :a 1:a 2:a 3:a 4:a 5:a 6:a 7:a 8:a 9:a 1:a 11:a 12:p 1:p 2:p Time of Day 3:p 4:p 5:p 6:p 7:p 8:p TOTL W E 9:p 1:p 11:p HOURLY TOTLS Period Start W E TOTL 12:a :a :a :a :a :a :a :a :a :a :a :a :p :p :p :p :p :p :p :p :p :p :p :p M Peak Mid-day Peak PM Peak pproach Count Start Date 7:a - 8:a 2:3p - 3:3p 4:45p - 5:45p Totals Westbound Mon 11/16/15 12: M ,72 Eastbound Mon 11/16/15 12: M 1, ,8 TOTL 1,713 1,354 1,63 19,52 TranSystems Corporation 245 N. Waco, Ste. 222, Wichita, KS (316) 33-3
45 Location: 199th Street North of US-54 Daily Traffic Count Goddard Traffic Impact Study Goddard, Kansas Period Period Period Period Start N S TOTL Start N S TOTL Start N S TOTL Start N S TOTL 12:a 1 1 6:a :p :p :15a 1 1 6:15a :15p :15p :3a 1 1 6:3a :3p :3p :45a :45a :45p :45p :a 7:a :p :p :15a 1 1 7:15a :15p :15p :3a :3a :3p :3p :45a 7:45a :45p :45p :a :a :p :p :15a 8:15a :15p :15p :3a 1 1 8:3a :3p :3p :45a 1 1 8:45a :45p :45p :a :a :p :p :15a :15a :15p :15p :3a 1 1 9:3a :3p :3p :45a 1 1 9:45a :45p :45p :a 2 2 1:a :p :p :15a :15a :15p :15p :3a :3a :3p :3p :45a :45a :45p :45p :a :a :p :p :15a :15a :15p :15p 1 1 5:3a :3a :3p :3p :45a :45a :45p :45p Count in 15 min. periods :a 1:a 2:a 3:a 4:a 5:a 6:a 7:a 8:a 9:a 1:a 11:a 12:p 1:p 2:p Time of Day 3:p 4:p 5:p 6:p 7:p 8:p TOTL N S 9:p 1:p 11:p HOURLY TOTLS Period Start N S TOTL 12:a :a :a :a :a :a :a :a :a :a :a :a :p :p :p :p :p :p :p :p :p :p :p :p M Peak Mid-day Peak PM Peak pproach Count Start Date 7:a - 8:a 2:3p - 3:3p 4:3p - 5:3p Totals Northbound Mon 11/9/15 4:15 PM ,6 Southbound Mon 11/9/15 4:15 PM ,215 TOTL ,275 TranSystems Corporation 245 N. Waco, Ste. 222, Wichita, KS (316) 33-3
46 Location: 199th Street South of US-54 Daily Traffic Count Goddard Traffic Impact Study Goddard, Kansas Period Period Period Period Start N S TOTL Start N S TOTL Start N S TOTL Start N S TOTL 12:a :a :p :p :15a :15a :15p :15p :3a :3a :3p :3p :45a :45a :45p :45p :a :a :p :p :15a 1 1 7:15a :15p :15p :3a :3a :3p :3p :45a :45a :45p :45p :a :a :p :p :15a :15a :15p :15p :3a :3a :3p :3p :45a :45a :45p :45p :a 9:a :p :p :15a :15a :15p :15p :3a 2 2 9:3a :3p :3p :45a 1 1 9:45a :45p :45p :a 1 1 1:a :p :p :15a :15a :15p :15p :3a :3a :3p :3p :45a :45a :45p :45p :a :a :p :p :15a :15a :15p :15p :3a :3a :3p :3p :45a :45a :45p :45p Count in 15 min. periods :a 1:a 2:a 3:a 4:a 5:a 6:a 7:a 8:a 9:a 1:a 11:a 12:p 1:p 2:p Time of Day 3:p 4:p 5:p 6:p 7:p 8:p TOTL N S 9:p 1:p 11:p HOURLY TOTLS Period Start N S TOTL 12:a :a :a :a :a :a :a :a :a :a :a :a :p :p :p :p :p :p :p :p :p :p :p :p M Peak Mid-day Peak PM Peak pproach Count Start Date 6:45a - 7:45a 2:3p - 3:3p 2:45p - 3:45p Totals Northbound Mon 11/16/15 12: M ,434 Southbound Mon 11/16/15 12: M ,59 TOTL ,493 TranSystems Corporation 245 N. Waco, Ste. 222, Wichita, KS (316) 33-3
47 Daily Traffic Count Goddard Traffic Impact Study Goddard, Kansas Location: West Kellogg Drive East of 199th Street Period Period Period Period Start W E TOTL Start W E TOTL Start W E TOTL Start W E TOTL 12:a 6:a :p :p :15a 6:15a 12:15p :15p :3a 1 6:3a :3p :3p :45a 6:45a :45p :45p :a 7:a :p :p :15a 7:15a :15p :15p :3a 7:3a :3p :3p :45a 7:45a :45p :45p :a 8:a :p :p :15a 8:15a :15p :15p :3a 8:3a :3p :3p :45a 8:45a :45p :45p :a 9:a :p :p :15a 9:15a :15p :15p :3a 9:3a :3p :3p :45a 9:45a :45p :45p :a 1:a :p :p 1 1 4:15a 1:15a :15p :15p :3a 1:3a :3p :3p 1 1 4:45a 1 1 1:45a :45p :45p 1 5:a 11:a :p :p 1 1 5:15a :15a :15p :15p 5:3a :3a :3p :3p 1 1 5:45a 11:45a :45p :45p 1 1 Count in 15 min. periods :a 1:a 2:a 3:a 4:a 5:a 6:a 7:a 8:a 9:a 1:a 11:a 12:p 1:p 2:p Time of Day 3:p 4:p 5:p 6:p 7:p 8:p TOTL W E 9:p 1:p 11:p HOURLY TOTLS Period Start W E TOTL 12:a 1 1 1:a 1 1 2:a 1 1 3:a 4:a :a :a :a :a :a :a :a :p :p :p :p :p :p :p :p :p :p :p :p M Peak Mid-day Peak PM Peak pproach Count Start Date 1:15a - 11:15a 2:3p - 3:3p 4:p - 5:p Totals Westbound Mon 11/16/15 12: M Eastbound Mon 11/16/15 12: M TOTL ,177 TranSystems Corporation 245 N. Waco, Ste. 222, Wichita, KS (316) 33-3
48 Daily Traffic Count Goddard Traffic Impact Study Goddard, Kansas Location: West Kellogg Drive West of 199th Street Period Period Period Period Start W E TOTL Start W E TOTL Start W E TOTL Start W E TOTL 12:a 1 1 6:a :p :p :15a :15a :15p :15p :3a 6:3a :3p :3p :45a 6:45a :45p :45p :a 7:a :p :p :15a 7:15a :15p :15p :3a 7:3a :3p :3p :45a 7:45a :45p :45p :a 8:a :p :p :15a 1 8:15a :15p :15p :3a 8:3a :3p :3p :45a 1 1 8:45a :45p :45p :a 9:a :p :p :15a 9:15a :15p :15p :3a 9:3a :3p :3p :45a 9:45a :45p :45p 1 1 4:a 1:a :p :p :15a 1 1 1:15a :15p :15p :3a 1 1:3a :3p :3p :45a 1:45a :45p :45p :a 1 11:a :p :p :15a :15a :15p :15p 1 1 5:3a :3a :3p :3p :45a :45a :45p :45p Count in 15 min. periods :a 1:a 2:a 3:a 4:a 5:a 6:a 7:a 8:a 9:a 1:a 11:a 12:p 1:p 2:p Time of Day 3:p 4:p 5:p 6:p 7:p 8:p TOTL W E 9:p 1:p 11:p HOURLY TOTLS Period Start W E TOTL 12:a :a 1 1 2:a 2 2 3:a :a :a :a :a :a :a :a :a :p :p :p :p :p :p :p :p :p :p :p :p M Peak Mid-day Peak PM Peak pproach Count Start Date 7:15a - 8:15a 2:15p - 3:15p 4:3p - 5:3p Totals Westbound Mon 11/9/15 12:18 PM Eastbound Mon 11/9/15 12:18 PM TOTL ,118 TranSystems Corporation 245 N. Waco, Ste. 222, Wichita, KS (316) 33-3
49 Daily Traffic Count Goddard Traffic Impact Study Goddard, Kansas Location: West Kellogg Drive East of arber Street Period Period Period Period Start W E TOTL Start W E TOTL Start W E TOTL Start W E TOTL 12:a 1 1 6:a :p :p :15a 1 1 6:15a :15p :15p :3a 1 6:3a :3p :3p :45a 6:45a :45p :45p :a 7:a :p :p :15a 1 1 7:15a :15p :15p :3a 7:3a :3p :3p :45a 1 7:45a :45p :45p :a 8:a :p :p :15a 8:15a :15p :15p :3a 8:3a :3p :3p :45a 8:45a :45p :45p :a 9:a :p :p :15a 9:15a :15p :15p :3a 2 2 9:3a :3p :3p :45a 9:45a :45p :45p :a 1:a :p :p 2 2 4:15a 2 2 1:15a :15p :15p :3a 2 2 1:3a :3p :3p :45a 2 2 1:45a :45p :45p 1 5:a :a :p :p 5:15a :15a :15p :15p 1 1 5:3a :3a :3p :3p 1 2 5:45a :45a :45p :45p 1 2 Count in 15 min. periods :a 1:a 2:a 3:a 4:a 5:a 6:a 7:a 8:a 9:a 1:a 11:a 12:p 1:p 2:p Time of Day 3:p 4:p 5:p 6:p 7:p 8:p TOTL W E 9:p 1:p 11:p HOURLY TOTLS Period Start W E TOTL 12:a :a :a 1 1 3:a 2 2 4:a :a :a :a :a :a :a :a :p :p :p :p :p :p :p :p :p :p :p :p M Peak Mid-day Peak PM Peak pproach Count Start Date 7:a - 8:a 2:3p - 3:3p 4:15p - 5:15p Totals Westbound Mon 11/16/15 1: PM Eastbound Mon 11/16/15 1: PM TOTL ,46 TranSystems Corporation 245 N. Waco, Ste. 222, Wichita, KS (316) 33-3
50 SPOT SPEED STUDY RESULTS RELTIVE FREQUENCY DISTRIUTION GODDRD TRFFIC IMPCT STUDY CITY: Goddard COUNTY: Sedgwick LOCTION: US-54 east of 199th Street OSERVER: SSP SPEED LIMIT: 5 TIME STRT: 1:19 M DTE: 11/11/215 DIRECTION: E TIME END: 11:28 M SPEED FREQUENCY CUM TOTL CUM % PERCENTGE REKDOWN VERGE SPEED = 55. PCE = 5-59 SMPLE VRINCE = th PERCENTILE = 54. VEHICLES IN PCE = 111 STNDRD DEVITION = th PERCENTILE = 57.7 % IN PCE = 88.8 RNGE 1*S = th PERCENTILE = 58.9 % ELOW PCE = 1.6 RNGE 2*S = th PERCENTILE = 6.9 % OVE PCE = 9.6 RNGE 3*S = 98.4
51 SPOT SPEED STUDY RESULTS RELTIVE FREQUENCY DISTRIUTION GODDRD TRFFIC IMPCT STUDY CITY: Goddard COUNTY: Sedgwick LOCTION: US-54 east of 199th Street OSERVER: SSP SPEED LIMIT: 6 TIME STRT: 11:46 M DTE: 11/11/215 DIRECTION: W TIME END: 12:4 PM SPEED FREQUENCY CUM TOTL CUM % PERCENTGE REKDOWN VERGE SPEED = 56.2 PCE = SMPLE VRINCE = th PERCENTILE = 55.9 VEHICLES IN PCE = 111 STNDRD DEVITION = th PERCENTILE = 59.1 % IN PCE = 88.8 RNGE 1*S = 72. 9th PERCENTILE = 59.8 % ELOW PCE = 7.2 RNGE 2*S = th PERCENTILE = 6.8 % OVE PCE = 4. RNGE 3*S = 99.2
52 ppendix C Trip Generation and Distribution See attached worksheets. STR ond Development Traffic Impact nalysis Goddard, Kansas
53 STR ond Development Traffic Impact Study Goddard, KS Trip Generation ITE.M. Peak Hour P.M. Peak Hour Saturday Peak Hour Land Use Intensity Code Daily Total % In % Out In Out Total % In % Out In Out Total % In % Out In Out Lodging Hotel (total rooms) 15 rooms 31 1, % 46% % 42% % 44% Lodging Sub-Total 15 rooms 1, Dining High-Turnover (Sit-Down) Restaurant 8, sf 932 1, % 47% % 46% % 47% High-Turnover (Sit-Down) Restaurant 8, sf 932 1, % 47% % 46% % 47% High-Turnover (Sit-Down) Restaurant 8, sf 932 1, % 47% % 46% % 47% High-Turnover (Sit-Down) Restaurant 8, sf 932 1, % 47% % 46% % 47% Dining Sub-Total 32, sf 4, quatics Center thletic Club 5, sf 493 2, % 42% % 37% % quatics Center Sub-Total 5, sf 2, Total 7, Notes - 4% 14% 13% Estimates based on ITE's Trip Generation, 9th Edition * - PM Peak Hour of Generator Used (not of dj. Traffic) P
54 PEC 3 21 SSP 5 1 PEC 43 SSP 8 11/17/15 11/12/15 11/17/15 12/2/ M 7-9 M 7-9 M 7-8 M SSP PEC SSP 29 3 SSP 11 PEC 2 SSP SSP /19/ /17/ /17/ /12/ /17/ /1/ M M M M M M M SSP 9 13 SSP 6 1 SSP SSP 2 11/17/15 11/12/15 12/1/15 12/1/ M 7-9 M 7-8 M 7-8 M STR ond Development Traffic Impact Study Goddard, KS Existing Traffic Volumes (djusted) M Peak Hour Intersection ( W Kellogg Dr/N Main Street) Intersection (W Kellogg Dr/199th Street) Intersection ( W Kellogg Dr/arber Street) Intersection ( W Kellogg Dr/183rd Street) Intersection (Kellogg/215th Street) Intersection (Kellogg/Main Street) Intersection (Kellogg/Cedar Street) Intersection (Kellogg/199th Street) Intersection (Kellogg/arber Street) Intersection (Kellogg/183rd Street) Intersection (Kellogg/167th Street) Intersection (E Kellogg Dr/Cedar Street) Intersection (E Kellogg Dr/199th Street) Intersection (E Kellogg Dr/Walmart) Intersection (E Kellogg Dr/183rd Street) P
55 PEC SSP 29 9 PEC 16 SSP 3 11/17/15 11/12/15 11/17/15 12/2/ PM 4-6 PM 4-6 PM 5-6 PM SSP 47 9 PEC SSP 23 5 SSP 121 PEC 63 SSP 92 6 SSP /19/ /17/ /17/ /12/ /17/ /1/ /18/ PM PM PM PM PM PM PM SSP 9 8 SSP 12 SSP SSP /17/15 11/12/15 12/1/15 12/1/ PM 4-6 PM 5-6 PM 5-6 PM STR ond Development Traffic Impact Study Goddard, KS Existing Traffic Volumes (djusted) PM Peak Hour Intersection (W Kellogg Dr/N Main Street) Intersection (W Kellogg/199th Street) Intersection (W Kellogg Dr/arber Street) Intersection (W Kellogg Dr/183rd Street) Intersection (Kellogg/215th Street) Intersection (Kellogg/Main Street) Intersection (Kellogg/Cedar Street) Intersection (Kellogg/199th Street) Intersection (Kellogg/arber Street) Intersection (Kellogg/183rd Street) Intersection (Kellogg/167th Street) Intersection (E Kellogg Dr/N Cedar Street) Intersection (E Kellogg Dr/199th Street) Intersection (E Kellogg Dr/Walmart) Intersection (E Kellogg Dr/183rd Street) P
56 STR ond Development Traffic Impact Study Goddard, KS Trip Distribution (Existing Configuration) M Inbound % Intersection (W Kellogg Dr/N Main Street) Intersection (W Kellogg/199th Street) Intersection (W Kellogg Dr/arber Street) Intersection (Kellogg Dr/183rd Street) % 3% 3% Intersection (Kellogg/215th Street) Intersection (Kellogg/Main Street) Intersection (Kellogg/Cedar Street) Intersection (Kellogg/199th Street) Intersection (Kellogg/arber Street) Intersection (Kellogg/183rd Street) Intersection (Kellogg/167th Street) 3% % 2% 2% + + 2% 2% 2% 2% + + 2% 53% 53% 49% % 49% 2% % 4% 4% 4% 53% 53% 49% % % + + 2% 2% 2% 2% 2% 2% 2% + + % + + 3% 33% 2% % 36% 58% 36% 36% 58% 58% 3% 3% 36% 36% 58% 58% 3% 33% 2% 2% 5 Intersection (E Kellogg Dr/N Cedar Street) Intersection (E Kellogg Dr/199th Street) Intersection (E Kellogg Dr/Walmart) Intersection (Kellogg Dr/183rd Street) 58% % 59% 59% 59% 59% 4 59% 59% 59% 36% P
57 STR ond Development Traffic Impact Study Goddard, KS Trip Distribution (Existing Configuration) PM Inbound % Intersection (W Kellogg Dr/N Main Street) Intersection (W Kellogg/199th Street) Intersection (W Kellogg Dr/arber Street) Intersection (Kellogg Dr/183rd Street) % 3% 3% Intersection (Kellogg/215th Street) Intersection (Kellogg/Main Street) Intersection (Kellogg/Cedar Street) Intersection (Kellogg/199th Street) Intersection (Kellogg/arber Street) Intersection (Kellogg/183rd Street) Intersection (Kellogg/167th Street) 3% % 2% 2% + + 2% 2% 2% 2% + + 2% 62% 62% 58% % 58% 2% 6% 22% 22% 22% 26% 26% 26% 26% 4% 4% 4% 4% 62% 62% 58% % 22% 22% % 22% 22% 22% % 26% 26% 26% % 26% 26% 2% + + 2% 2% 2% 2% 2% 2% 2% + + % + + 3% 24% 2% % 27% 67% 27% 27% 67% 67% 3% 3% 27% 27% 67% 67% 3% 24% 2% 2% 6% Intersection (E Kellogg Dr/N Cedar Street) Intersection (E Kellogg Dr/199th Street) Intersection (E Kellogg Dr/Walmart) Intersection (Kellogg Dr/183rd Street) 67% % 68% 68% 68% 68% 32% 68% 68% 68% 27% % P
58 % 2% 2% % % 16% 16% 16% 16% 16% 2% 2% 2% 2% 2% 2% 3% 2% 16% 16% 16% 2% 2% 2% 2% 67% 67% 64% 2% % 67% 64% % 67% 2 72% % 72% 3% 3% % 72% 3% 2% 67% STR ond Development Traffic Impact Study Goddard, KS Trip Distribution (Existing Configuration) M Outbound % Intersection (W Kellogg Dr/N Main Street) Intersection (W Kellogg/199th Street) Intersection (W Kellogg Dr/arber Street) Intersection (Kellogg Dr/183rd Street) Intersection (Kellogg/215th Street) Intersection (Kellogg/Main Street) Intersection (Kellogg/Cedar Street) Intersection (Kellogg/199th Street) Intersection (Kellogg/arber Street) Intersection (Kellogg/183rd Street) Intersection (Kellogg/167th Street) Intersection (E Kellogg Dr/N Cedar Street) Intersection (E Kellogg Dr/199th Street) Intersection (E Kellogg Dr/Walmart) Intersection (Kellogg Dr/183rd Street) % 26% 74% 74% 74% 72% % 74% 74% 74% 74% 2% 2% 2% 2% P
59 6% 6% 6% % 6% 6% 6% 6% 6% % % 36% 36% 36% 36% 36% 4% 4% 4% 4% 4% 4% 3% 4% 36% 36% 36% 4% 4% 4% 4% 47% 47% 44% % 47% 44% % 47% 2% 4 53% % 53% 3% 3% % 53% 2% 3% 4% 6% 47% 2% STR ond Development Traffic Impact Study Goddard, KS Trip Distribution (Existing Configuration) PM Outbound % Intersection (W Kellogg Dr/N Main Street) Intersection (W Kellogg/199th Street) Intersection (W Kellogg Dr/arber Street) Intersection (Kellogg Dr/183rd Street) Intersection (Kellogg/215th Street) Intersection (Kellogg/Main Street) Intersection (Kellogg/Cedar Street) Intersection (Kellogg/199th Street) Intersection (Kellogg/arber Street) Intersection (Kellogg/183rd Street) Intersection (Kellogg/167th Street) Intersection (E Kellogg Dr/N Cedar Street) Intersection (E Kellogg Dr/199th Street) Intersection (E Kellogg Dr/Walmart) Intersection (Kellogg Dr/183rd Street) % 46% 54% 54% 54% 53% % 54% 54% 54% 54% P
60 STR ond Development Traffic Impact Study Goddard, KS Development Trips (Existing Configuration) M Peak Hour Intersection (W Kellogg Dr/N Main Street) Intersection (W Kellogg/199th Street) Intersection (W Kellogg Dr/arber Street) Intersection (Kellogg Dr/183rd Street) Intersection (Kellogg/215th Street) Intersection (Kellogg/Main Street) Intersection (Kellogg/Cedar Street) Intersection (Kellogg/199th Street) Intersection (Kellogg/arber Street) Intersection (Kellogg/183rd Street) Intersection (Kellogg/167th Street) Intersection (E Kellogg Dr/N Cedar Street) Intersection (E Kellogg Dr/199th Street) Intersection (E Kellogg Dr/Walmart) Intersection (Kellogg Dr/183rd Street) P
61 STR ond Development Traffic Impact Study Goddard, KS Development Trips (Existing Configuration) PM Peak Hour Intersection (W Kellogg Dr/N Main Street) Intersection (W Kellogg/199th Street) Intersection (W Kellogg Dr/arber Street) Intersection (Kellogg Dr/183rd Street) Intersection (Kellogg/215th Street) Intersection (Kellogg/Main Street) Intersection (Kellogg/Cedar Street) Intersection (Kellogg/199th Street) Intersection (Kellogg/arber Street) Intersection (Kellogg/183rd Street) Intersection (Kellogg/167th Street) Intersection (E Kellogg Dr/N Cedar Street) Intersection (E Kellogg Dr/199th Street) Intersection (E Kellogg Dr/Walmart) Intersection (Kellogg Dr/183rd Street) P
62 STR ond Development Traffic Impact Study Goddard, KS Existing (dj.) + Development Trips M Peak Hour Intersection (W Kellogg Dr/N Main Street) Intersection (W Kellogg/199th Street) Intersection (W Kellogg Dr/arber Street) Intersection (Kellogg Dr/183rd Street) Intersection (Kellogg/215th Street) Intersection (Kellogg/Main Street) Intersection (Kellogg/Cedar Street) Intersection (Kellogg/199th Street) Intersection (Kellogg/arber Street) Intersection (Kellogg/183rd Street) Intersection (Kellogg/167th Street) Intersection (E Kellogg Dr/N Cedar Street) Intersection (E Kellogg Dr/199th Street) Intersection (E Kellogg Dr/Walmart) Intersection (Kellogg Dr/183rd Street) P
63 STR ond Development Traffic Impact Study Goddard, KS Existing (dj.) + Development Trips PM Peak Hour Intersection (W Kellogg Dr/N Main Street) Intersection (W Kellogg/199th Street) Intersection (W Kellogg Dr/arber Street) Intersection (Kellogg Dr/183rd Street) Intersection (Kellogg/215th Street) Intersection (Kellogg/Main Street) Intersection (Kellogg/Cedar Street) Intersection (Kellogg/199th Street) Intersection (Kellogg/arber Street) Intersection (Kellogg/183rd Street) Intersection (Kellogg/167th Street) Intersection (E Kellogg Dr/N Cedar Street) Intersection (E Kellogg Dr/199th Street) Intersection (E Kellogg Dr/Walmart) Intersection (Kellogg Dr/183rd Street) P
64 PEC 3 21 SSP 5 15 PEC 8 SSP 87 11/17/ /12/ /17/ /2/ M M M M SSP PEC SSP 29 3 SSP PEC 2 SSP SSP /19/ /17/ /17/ /12/ /17/ /1/ /18/ M M M M M M M SSP 9 13 SSP 4 1 SSP 8 SSP 2 11/17/15 11/12/15 12/1/15 12/1/ M 7-9 M 7-8 M 7-8 M STR ond Development Traffic Impact Study Goddard, KS Existing + uild (RCUT) Traffic Volumes (djusted) M Peak Hour Intersection ( W Kellogg Dr/N Main Street) Intersection (W Kellogg Dr/199th Street) Intersection ( W Kellogg Dr/arber Street) Seasons Drive Intersection ( W Kellogg Dr/183rd Street) Intersection (Kellogg/215th Street) Intersection (Kellogg/Main Street) Intersection (Kellogg/Cedar Street) Intersection (Kellogg/199th Street) Right-in/Right-out U-turn Intersection (Kellogg/arber Street) U-turn Right-in/Right-out Intersection (Kellogg/183rd Street) Intersection (Kellogg/167th Street) Intersection (E Kellogg Dr/Cedar Street) Intersection (E Kellogg Dr/199th Street) Intersection (E Kellogg Dr/arber Street) Intersection (E Kellogg Dr/Walmart) Intersection (E Kellogg Dr/183rd Street) P
65 PEC SSP PEC 3 SSP /17/ /12/ /17/ /2/ PM PM 4-6 PM PM SSP 47 9 PEC SSP 23 5 SSP PEC 63 SSP 92 6 SSP /19/ /17/ /17/ /12/ /17/ /1/ /18/ PM PM PM PM PM PM PM SSP 9 SSP SSP SSP /17/15 11/12/15 12/1/15 12/1/ PM 4-6 PM 5-6 PM 5-6 PM STR ond Development Traffic Impact Study Goddard, KS Existing + uild (RCUT) Traffic Volumes (djusted) PM Peak Hour Intersection (W Kellogg Dr/N Main Street) Intersection (W Kellogg/199th Street) Intersection (W Kellogg Dr/arber Street) Seasons Drive Intersection (W Kellogg Dr/183rd Street) Intersection (Kellogg/215th Street) Intersection (Kellogg/Main Street) Intersection (Kellogg/Cedar Street) Intersection (Kellogg/199th Street) Right-in/Right-out U-turn Intersection (Kellogg/arber Street) U-turn Right-in/Right-out Intersection (Kellogg/183rd Street) Intersection (Kellogg/167th Street) Intersection (E Kellogg Dr/N Cedar Street) Intersection (E Kellogg Dr/199th Street) Intersection (E Kellogg Dr/arber Street) Intersection (E Kellogg Dr/Walmart) Intersection (E Kellogg Dr/183rd Street) P
66 STR ond Development Traffic Impact Study Goddard, KS Trip Distribution (RCUT) M Inbound % Intersection (W Kellogg Dr/N Main Street) Intersection (W Kellogg/199th Street) Intersection (W Kellogg Dr/arber Street) Seasons Drive Intersection (Kellogg Dr/183rd Street) % 3% Intersection (Kellogg/215th Street) Intersection (Kellogg/Main Street) Intersection (Kellogg/Cedar Street) Intersection (Kellogg/199th Street) Right-in/Right-out U-turn Intersection (Kellogg/arber Street) U-turn Right-in/Right-out Intersection (Kellogg/183rd Street) Intersection (Kellogg/167th Street) 3% % 2% 2% + + 2% 6% 6% 6% 59% 59% 59% 59% % 59% 59% 53% % 53% 53% 49% % 49% 58% % 34% 34% 34% 36% 36% % 59% 59% 59% 53% 53% 49% % % % 33% 33% 33% % 33% 33% 33% 34% 34% 34% + + % + + 3% 2% 33% % 4% 9 4% 4% 9 9 3% 3% 4% 4% 9 9 3% 2% 33% 58% Intersection (E Kellogg Dr/N Cedar Street) Intersection (E Kellogg Dr/199th Street) Intersection (E Kellogg Dr/arber Street) Intersection (E Kellogg Dr/Walmart) Intersection (Kellogg Dr/183rd Street) % 9% 4% % 9% 9% 9% 9 P
67 Intersection (W Kellogg Dr/arber Street) STR ond Development Traffic Impact Study Goddard, KS Trip Distribution (RCUT) PM Inbound % Intersection (W Kellogg Dr/N Main Street) Intersection (W Kellogg/199th Street) Intersection (Kellogg Dr/183rd Street) % 3% 3% Intersection (Kellogg/215th Street) Intersection (Kellogg/Main Street) Intersection (Kellogg/Cedar Street) Intersection (Kellogg/199th Street) Intersection (Kellogg/arber Street) Intersection (Kellogg/183rd Street) Intersection (Kellogg/167th Street) 3% % 68% 68% 68% 68% 68% 68% % 68% 68% 62% % 62% 62% 58% % 58% 68% 22% 22% 22% 26% 26% 26% 26% 23% 23% 23% 23% 23% 23% 68% 68% 68% 68% 68% 68% 62% 62% 58% % 22% 22% % 22% 22% 22% % 26% 26% 26% % 26% 26% 23% % 23% 23% 23% % 23% 23% 23% 23% 23% 23% % + + 3% 3% 23% % 4% 9 4% 4% 9 9 3% 3% 4% 4% 9 9 3% 3% 23% 68% Intersection (E Kellogg Dr/N Cedar Street) Intersection (E Kellogg Dr/199th Street) Intersection (Kellogg Dr/arber Street) Intersection (E Kellogg Dr/Walmart) Intersection (Kellogg Dr/183rd Street) % 9% 4% % 9% 9% 9% 9 P
68 % 16% % 16% 16% 16% % 2% 2% 2% 2% 2% 2% 2% + + 2% 26% 26% 26% % 26% 26% 26% 26% 26% 26% 26% % 26% 26% 26% % 16% 16% 16% 2% 2% 2% 2% 26% 26% 26% 26% 26% 26% 116% 116% 64% 64% 64% 64% 67% 67% 64% 26% 2% % 9% 64% 64% 64% 64% 64% % 64% 64% 64% % 67% 67% 64% % 9% 3% 9% 8% 9% 9% 8% 8% 3% 3% 9% 9% 8% 8% 3% 9% 3% STR ond Development Traffic Impact Study Goddard, KS Trip Distribution (RCUT) M Outbound % Intersection (W Kellogg Dr/N Main Street) Intersection (W Kellogg/199th Street) Intersection (W Kellogg Dr/arber Street) Intersection (W Kellogg Dr/arber Street) Intersection (Kellogg Dr/183rd Street) Intersection (Kellogg/215th Street) Intersection (Kellogg/Main Street) Intersection (Kellogg/Cedar Street) Intersection (Kellogg/199th Street) Intersection (Kellogg/arber Street) Intersection (Kellogg/183rd Street) Intersection (Kellogg/167th Street) Intersection (E Kellogg Dr/N Cedar Street) Intersection (E Kellogg Dr/199th Street) Intersection (Kellogg Dr/arber Street) Intersection (E Kellogg Dr/Walmart) Intersection (Kellogg Dr/183rd Street) % % 2% 2% 9% 2% P
69 6% STR ond Development Traffic Impact Study Goddard, KS Trip Distribution (RCUT) PM Outbound % Intersection (W Kellogg Dr/N Main Street) Intersection (W Kellogg/199th Street) Intersection (W Kellogg Dr/arber Street) Seasons Drive Intersection (Kellogg Dr/183rd Street) Intersection (Kellogg/215th Street) Intersection (Kellogg/Main Street) Intersection (Kellogg/Cedar Street) Intersection (Kellogg/199th Street) Right-in/Right-out U-turn Intersection (Kellogg/arber Street) U-turn Right-in/Right-out Intersection (Kellogg/183rd Street) Intersection (Kellogg/167th Street) 36% 36% % 36% 36% 36% % 4% 4% 4% 4% 4% 4% 4% + + 4% 46% 46% 46% % 46% 46% 46% 46% 46% 46% 46% % 46% 46% 46% % 36% 36% 36% 4% 4% 4% 4% 46% 46% 46% 46% 46% 46% 136% 136% 44% 44% 44% 44% 47% 47% 44% 46% 2% % 9% 44% 44% 44% 44% 44% % 44% 44% 44% % 47% 47% 44% % 44% 9% 3% 9% 9% 9% 9% 3% 3% 9% 9% 9% 9% 3% 9% 9% 9% 6% 3% Intersection (E Kellogg Dr/N Cedar Street) Intersection (E Kellogg Dr/199th Street) Intersection (Kellogg Dr/arber Street) Intersection (E Kellogg Dr/Walmart) Intersection (Kellogg Dr/183rd Street) % % P
70 STR ond Development Traffic Impact Study Goddard, KS Development Trips (RCUT) M Peak Hour Intersection (W Kellogg Dr/N Main Street) Intersection (W Kellogg/199th Street) Intersection (W Kellogg Dr/arber Street) Seasons Drive Intersection (Kellogg Dr/183rd Street) Intersection (Kellogg/215th Street) Intersection (Kellogg/Main Street) Intersection (Kellogg/Cedar Street) Intersection (Kellogg/199th Street) Right-in/Right-out U-turn Intersection (Kellogg/arber Street) U-turn Right-in/Right-out Intersection (Kellogg/183rd Street) Intersection (Kellogg/167th Street) Intersection (E Kellogg Dr/N Cedar Street) Intersection (E Kellogg Dr/199th Street) Intersection (E Kellogg Dr/arber Street) Intersection (E Kellogg Dr/Walmart) Intersection (Kellogg Dr/183rd Street) P
71 STR ond Development Traffic Impact Study Goddard, KS Development Trips (RCUT) PM Peak Hour Intersection (W Kellogg Dr/N Main Street) Intersection (W Kellogg/199th Street) Intersection (W Kellogg Dr/arber Street) Seasons Drive Intersection (Kellogg Dr/183rd Street) Intersection (Kellogg/215th Street) Intersection (Kellogg/Main Street) Intersection (Kellogg/Cedar Street) Intersection (Kellogg/199th Street) Intersection (Kellogg/arber Street) Intersection (Kellogg/183rd Street) Intersection (Kellogg/167th Street) Intersection (E Kellogg Dr/N Cedar Street) Intersection (E Kellogg Dr/199th Street) Intersection (E Kellogg Dr/Walmart) Intersection (Kellogg Dr/183rd Street) P
72 STR ond Development Traffic Impact Study Goddard, KS Existing (dj.) + Development Trips w/ RCUT at arber Street M Peak Hour Intersection (W Kellogg Dr/N Main Street) Intersection (W Kellogg/199th Street) Intersection (W Kellogg Dr/arber Street) Seasons Drive Intersection (Kellogg Dr/183rd Street) Intersection (Kellogg/215th Street) Intersection (Kellogg/Main Street) Intersection (Kellogg/Cedar Street) Intersection (Kellogg/199th Street) Right In-Right Out U-turn Intersection (W Kellogg Dr/arber Street) U-turn Right In-Right Out Intersection (Kellogg/183rd Street) Intersection (Kellogg/167th Street) Intersection (E Kellogg Dr/N Cedar Street) Intersection (E Kellogg Dr/199th Street) Intersection (E Kellogg Dr/arber Street) Intersection (E Kellogg Dr/Walmart) Intersection (Kellogg Dr/183rd Street) P
73 STR ond Development Traffic Impact Study Goddard, KS 24 + Devlopment Trips w/ RCUT at arber Street M Peak Hour Intersection (W Kellogg Dr/N Main Street) Intersection (W Kellogg/199th Street) Intersection (W Kellogg Dr/arber Street) Seasons Drive Intersection (Kellogg Dr/183rd Street) U-turn Intersection (W Kellogg Dr/arber Street) U-turn Right In-Right Out Intersection (Kellogg/183rd Street) Intersection (Kellogg/215th Street) Intersection (Kellogg/Main Street) Intersection (Kellogg/Cedar Street) Intersection (Kellogg/199th Street) Right In-Right Out Intersection (Kellogg/167th Street) Intersection (E Kellogg Dr/N Cedar Street) Intersection (E Kellogg Dr/199th Street) Intersection (E Kellogg Dr/arber Street) Intersection (E Kellogg Dr/Walmart) Intersection (Kellogg Dr/183rd Street) P
74 STR ond Development Traffic Impact Study Goddard, KS Existing (dj.) + Development Trips w/ RCUT at arber Street PM Peak Hour Intersection (W Kellogg Dr/N Main Street) Intersection (W Kellogg/199th Street) Right In-Right Out Intersection (W Kellogg Dr/arber Street) Seasons Drive Right In-Right Out at Seasons Intersection (Kellogg Dr/183rd Street) Intersection (Kellogg/215th Street) Intersection (Kellogg/Main Street) Intersection (Kellogg/Cedar Street) Intersection (Kellogg/199th Street) Right In-Right Out U-turn Intersection (Kellogg/arber Street) U-turn Right In-Right Out Intersection (Kellogg/183rd Street) Intersection (Kellogg/167th Street) Intersection (E Kellogg Dr/N Cedar Street) Intersection (E Kellogg Dr/199th Street) Intersection (E Kellogg Dr/arber Street) Intersection (E Kellogg Dr/Walmart) Intersection (Kellogg Dr/183rd Street) P
75 STR ond Development Traffic Impact Study Goddard, KS 24 + Devlopment Trips w/ RCUT at arber Street PM Peak Hour Intersection (W Kellogg Dr/N Main Street) Intersection (W Kellogg/199th Street) Intersection (W Kellogg Dr/arber Street) Seasons Drive Intersection (Kellogg Dr/183rd Street) U-turn Intersection (W Kellogg Dr/arber Street) U-turn Right In-Right Out Intersection (Kellogg/183rd Street) Intersection (Kellogg/215th Street) Intersection (Kellogg/Main Street) Intersection (Kellogg/Cedar Street) Intersection (Kellogg/199th Street) Right In-Right Out Intersection (Kellogg/167th Street) Intersection (E Kellogg Dr/N Cedar Street) Intersection (E Kellogg Dr/199th Street) Intersection (E Kellogg Dr/arber Street) Intersection (E Kellogg Dr/Walmart) Intersection (Kellogg Dr/183rd Street) P
76 ppendix D US-54 Corridor MOE See attached reports. STR ond Development Traffic Impact nalysis Goddard, Kansas
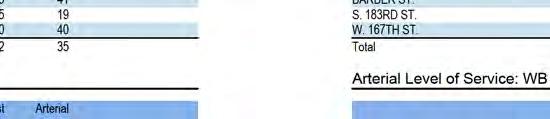
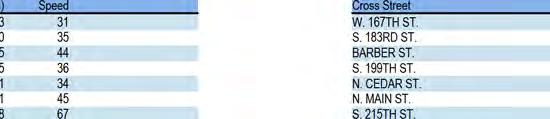
77
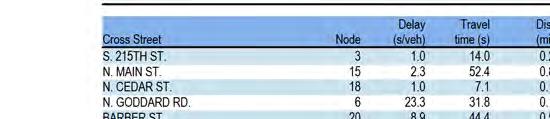
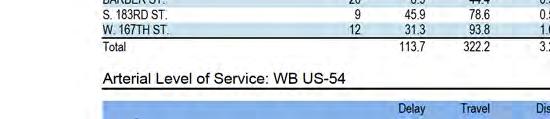
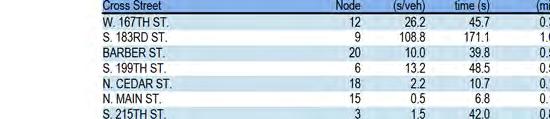
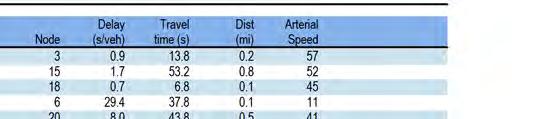
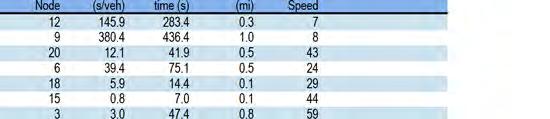
78
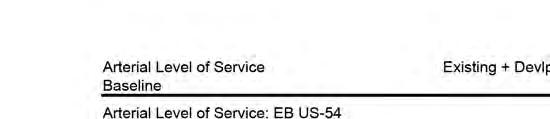
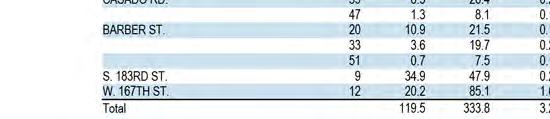
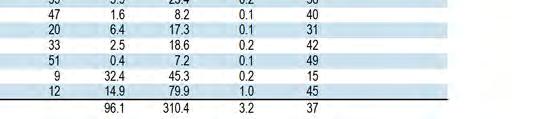
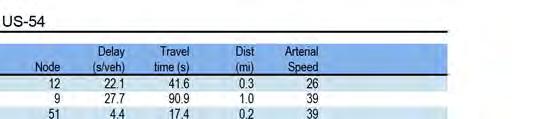
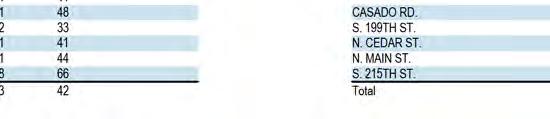
79
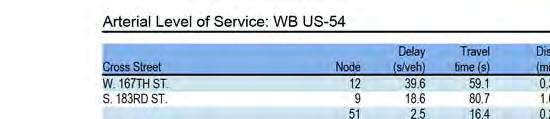
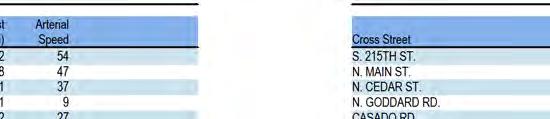
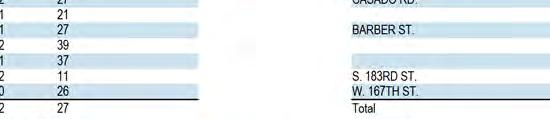
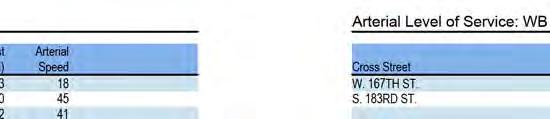
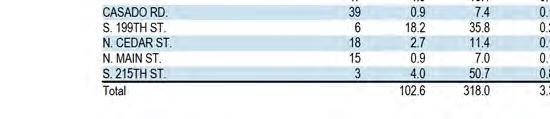

80
81 ppendix E Capacity nalysis Reports See attached reports. STR ond Development Traffic Impact nalysis Goddard, Kansas
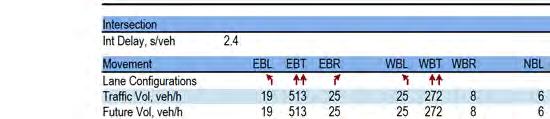
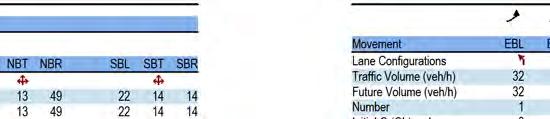
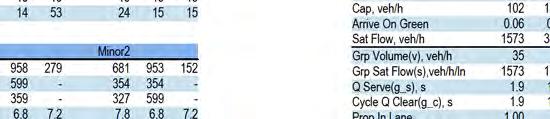
82
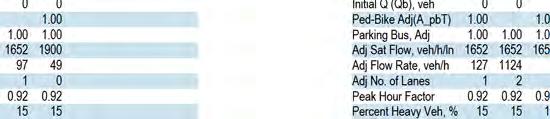
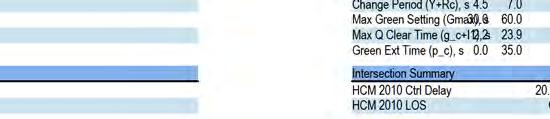
83
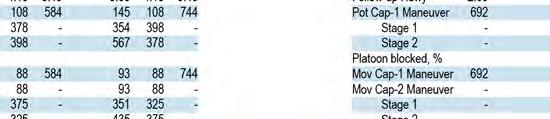
84
85
86
87
88
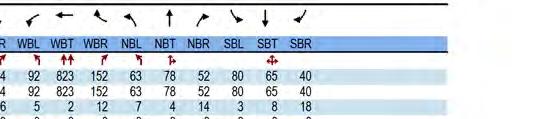
89
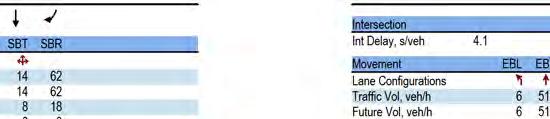
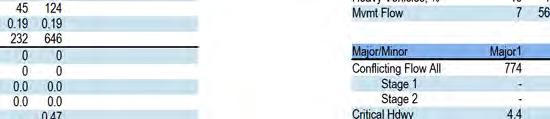
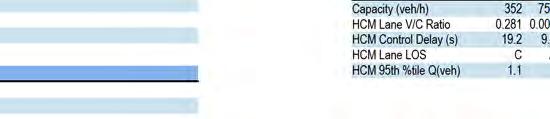
90
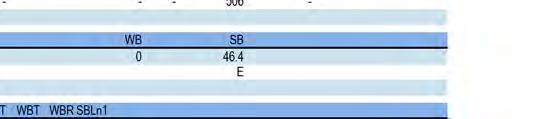
91
92
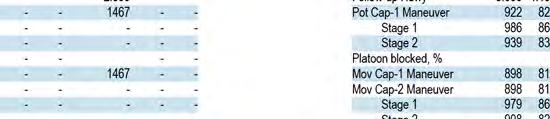
93
94
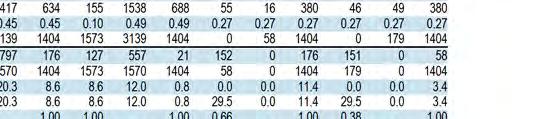
95
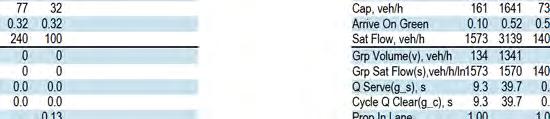
96
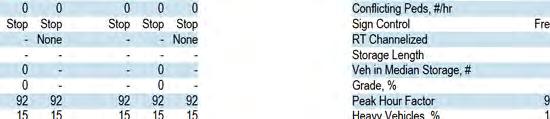
97
98
99
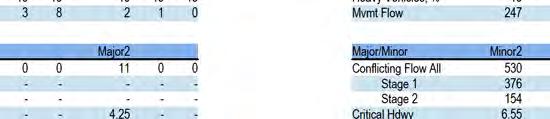
100
101
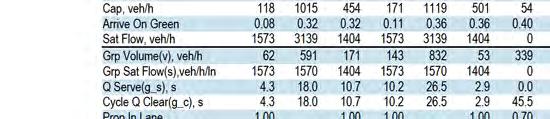
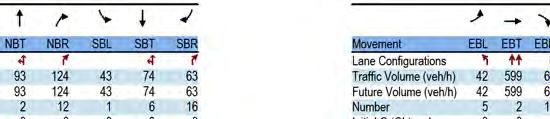
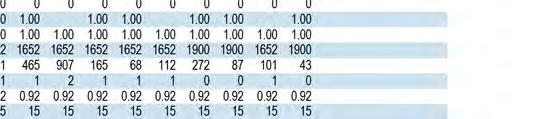
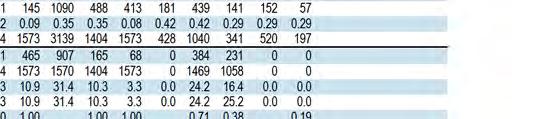
102
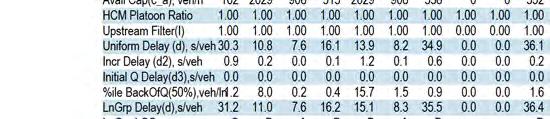
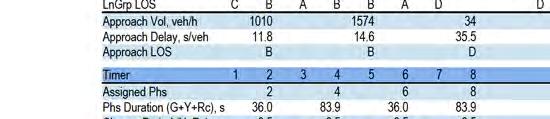
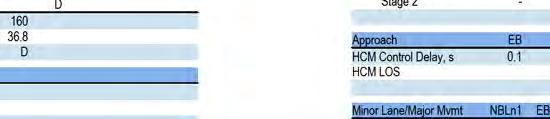

103
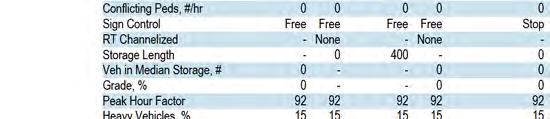
104
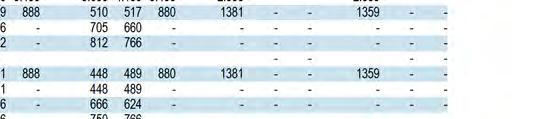
105
106
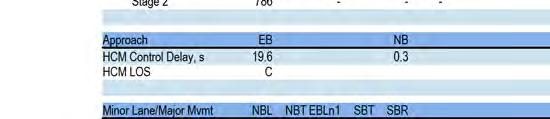
107
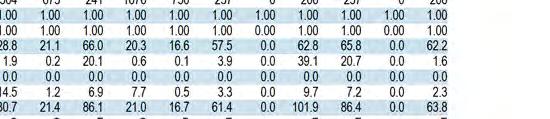
108
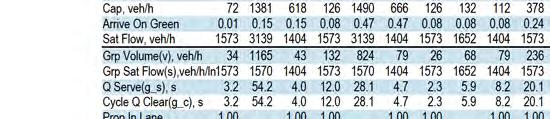
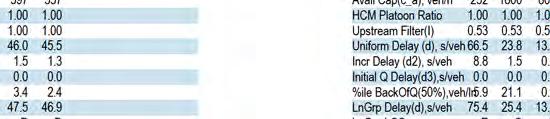
109
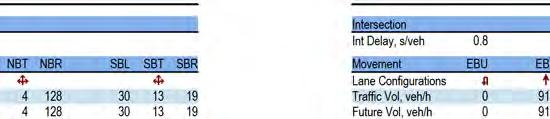
110
111
112
113
114
115
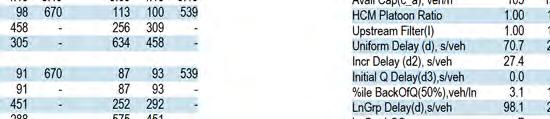
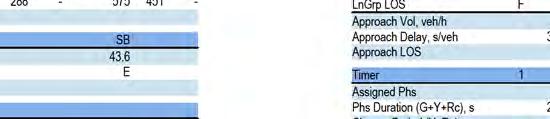

116
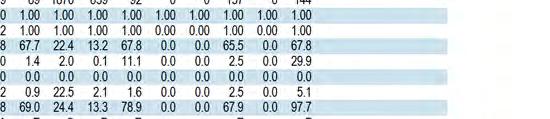
117
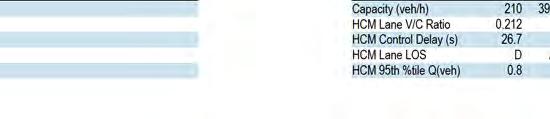
118
119
120
121
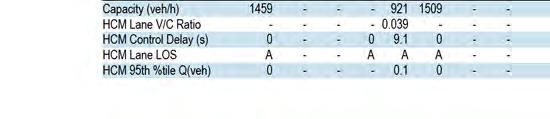
122
123
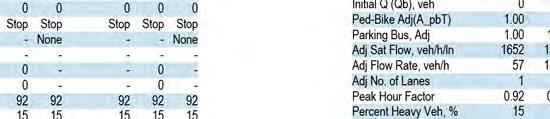
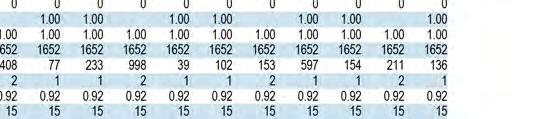
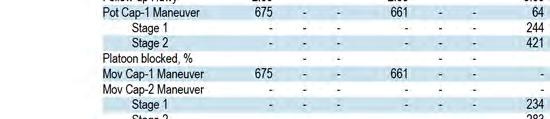
124
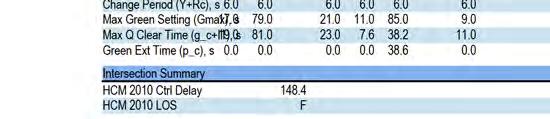
125
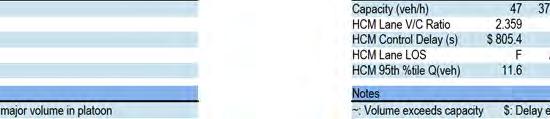
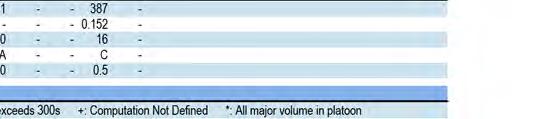
126
127
128
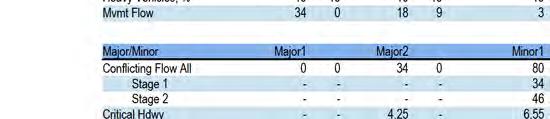
129
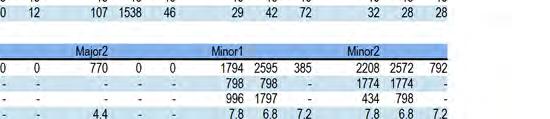
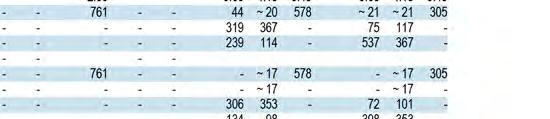
130
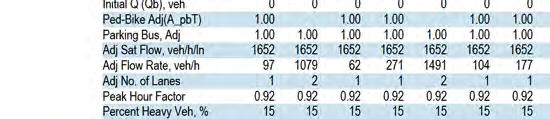
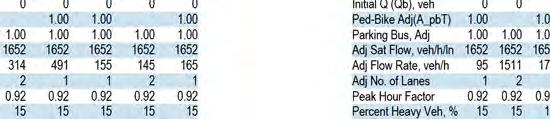
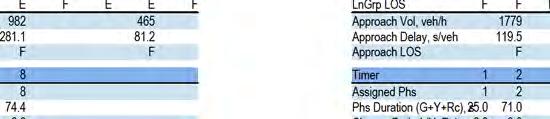

131
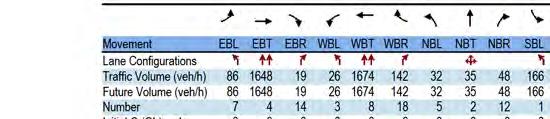
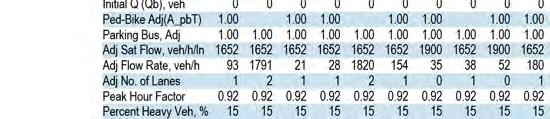
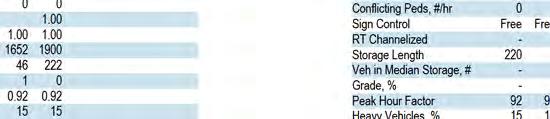
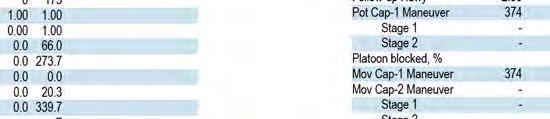
132
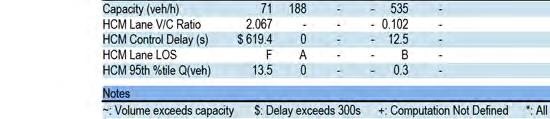
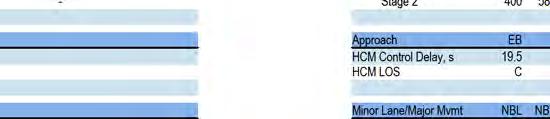
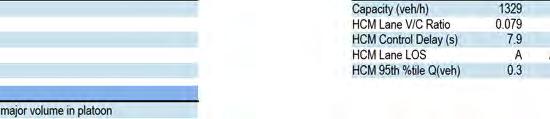
133
134
135
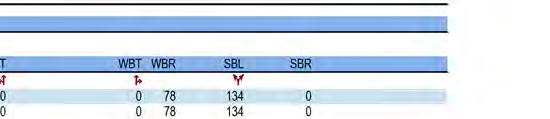
136
TABLE OF CONTENTS. Coral Springs Charter High School and Middle School Job No Page 2
 Job No. 15-019 Page 2 TABLE OF CONTENTS 1.0 INTRODUCTION... 4 2.0 EXISTING CONDITIONS... 5 3.0 TRAFFIC GENERATION... 7 4.0 TRIP DISTRIBUTION... 8 5.0 FUTURE CONDITIONS... 8 6.0 SITE ACCESS...13 7.0 CONCLUSION...13
A. CONCLUSIONS OF THE FGEIS
 Chapter 11: Traffic and Parking A. CONCLUSIONS OF THE FGEIS The FGEIS found that the Approved Plan will generate a substantial volume of vehicular and pedestrian activity, including an estimated 1,300
MEMORANDUM. Lynn Hayes LSA Associates, Inc.
 MEMORANDUM To: Lynn Hayes LSA Associates, Inc. Date: May 5, 217 From: Zawwar Saiyed, P.E., Senior Transportation Engineer Justin Tucker, Transportation Engineer I Linscott, Law & Greenspan, Engineers LLG
Lake Erie Commerce Center Traffic Analysis
 LOCATION: East of NYS Route 5 at Bayview Road Town of Hamburg Erie County, New York PREPARED BY: Wendel Companies 140 John James Audubon Parkway Suite 200 Amherst, New York 14228 January 2012 i ii Table
Treasure Island Supplemental Information Report Addendum
 1 1 1 1 0 1 0 1 0 1 Treasure Island Supplemental Information Report Addendum Introduction Purpose The purpose of this Supplemental Information Report (SIR) Addendum is to determine if the current land
MEMORANDUM. Bob Zagozda, Chief Financial Officer Westside Community Schools. Mark Meisinger, PE, PTOE Felsburg Holt & Ullevig. DATE: June 11, 2018
 MEMORANDUM TO: Bob Zagozda, Chief Financial Officer Westside Community Schools FROM: Mark Meisinger, PE, PTOE Felsburg Holt & Ullevig DATE: June 11, 218 6-11-18 SUBJECT: Sunset Hills Elementary School
APPENDIX H MILESTONE 2 TRAFFIC OPERATIONS ANALYSIS OF THE AT-GRADE CROSSINGS
 Draft Environmental Impact Statement/Environment Impact Report Appendix H Milestone 2 Traffic Operations Analysis of the At-Grade Crossings APPENDIX H MILESTONE 2 TRAFFIC OPERATIONS ANALYSIS OF THE AT-GRADE
Interstate 90 and Mercer Island Mobility Study APRIL Commissioned by. Prepared by
 Interstate 90 and Mercer Island Mobility Study APRIL 2017 Commissioned by Prepared by Interstate 90 and Mercer Island Mobility Study Commissioned by: Sound Transit Prepared by: April 2017 Contents Section
Planning. Proposed Development at the Southeast Corner of Lakeshore Road West and Brookfield Road Intersection FINAL.
 Project No. 121-22908 N o v e m b e r 2 0 1 2 Traffic Impact Study Transportation Planning th GENIVAR Inc., 600 Cochrane Drive, 5 Floor, Markham, Ontario L3R 5K3 Telephone: 905.475.7270 Fax: 905.475.5994
DOGWOOD AT VILLA AVENUE PROJECT
 TRANSPORTATION IMPACT ANALYSIS DOGWOOD AT VILLA AVENUE PROJECT El Centro, California September 4, 2018 LLG Ref. 3-17-2782 TABLE OF CONTENTS SECTION PAGE Appendices... ii List of Figures... i List of Tables...
LUDWIG RD. SUBDIVISION PROJECT TRAFFIC IMPACT ANALYSIS
 LUDWIG RD. SUBDIVISION PROJECT TRAFFIC IMPACT ANALYSIS Prepared for Skip Coddington GSC Development, Inc PO Box 1623 Woodinville WA 9872 Prepared by 1141 NE 124 th St., #59 Kirkland, WA 9834 425.522.4118
Aldridge Transportation Consultants, LLC Advanced Transportation Planning and Traffic Engineering
 Aldridge Transportation Consultants, LLC Advanced Transportation Planning and Traffic Engineering John M.W. Aldridge, PE, PTOE, AICP 182 Chimney Rock Road Colorado Registered Professional Engineer Highlands
FINAL REPORT INTERSECTION STUDY
 FINL REPORT INTERSECTION STUDY Vermont Route 22 & Panton Road City of Vergennes, Vermont May 9, 2011 Prepared for: 14 Seminary Street Middlebury, Vermont 05753 Prepared by: LMOUREUX & DICKINSON 14 Morse
Pedestrian Safety Review Spadina Avenue
 STAFF REPORT ACTION REQUIRED Pedestrian Safety Review Spadina Avenue Date: October 13, 2015 To: Toronto and East York Community Council From: Director, Transportation Services, Toronto and East York District
Washington St. & Ash Coulee Dr./43 rd Ave Intersection Study
 430 IACC Building Fargo, ND 58105 Tel 701-231-8058 Fax 701-231-1945 www.ugpti.org www.atacenter.org Washington St. & Ash Coulee Dr./43 rd Ave Intersection Study Final Report April 2007 Prepared for: City
PURPOSE AND NEED (CONCURRENCE POINT 1) NEW CANADA ROAD PROJECT FROM STATE ROUTE 1 (U.S. HIGHWAY 70) TO U.S. INTERSTATE 40
 NEW CANADA ROAD PROJECT FROM STATE ROUTE 1 (U.S. HIGHWAY 70) TO U.S. INTERSTATE 40") PURPOSE AND NEED (CONCURRENCE POINT 1) NEW CANADA ROAD PROJECT FROM STATE ROUTE 1 (U.S. HIGHWAY 70) TO U.S. INTERSTATE 40 Project Description The primary purpose of this project is to improve the major
PURPOSE AND NEED (CONCURRENCE POINT 1) NEW CANADA ROAD PROJECT FROM STATE ROUTE 1 (U.S. HIGHWAY 70) TO U.S. INTERSTATE 40 Project Description The primary purpose of this project is to improve the major
Traffic Analysis Final Report
 SR-71 Widening Project Project Approval/Environmental Documentation Traffic Analysis Final Report Prepared for Caltrans District 7 August 2012 6 Hutton Centre Drive, Suite 700 Santa Ana, California 92707
EXISTING CONDITIONS A. INTRODUCTION. Route 107 Corridor Study Report
 II. EXISTING CONDITIONS A. INTRODUCTION The Route 107 study area extends from the south at Chestnut Street in Lynn approximately 3.7 miles to the north to Boston Street in Salem. The study area has three
2008 DEKALB COUNTY TRANSPORTATION PLAN (UPDATE)
") 2008 DEKALB COUNTY TRANSPORTATION PLAN (UPDATE) TABLE OF CONTENTS Introduction 1 Transportation Planning Activities 2 Identification of Problem Areas and Recommended Solutions 7 DeKalb County Projects
2008 DEKALB COUNTY TRANSPORTATION PLAN (UPDATE) TABLE OF CONTENTS Introduction 1 Transportation Planning Activities 2 Identification of Problem Areas and Recommended Solutions 7 DeKalb County Projects
FINAL TERMINAL TRAFFIC MONITORING STUDY
 FINAL TERMINAL 91 216 TRAFFIC MONITORING STUDY Prepared for: Port of Seattle February 15, 217 Prepared by: 12131 113 th Avenue NE, Suite 23 Kirkland, WA 9834-712 Phone: 425-821-3665 www.transpogroup.com
ROUTE 20 CORRIDOR STUDY ---- Orange County, Virginia
 ROUTE 20 CORRIDOR STUDY ---- Orange County, Virginia Prepared by PARSONS Fairfax, Virginia on behalf of the: Rappahannock-Rapidan Regional Commission in cooperation with Orange County, Virginia Virginia
5.1 Traffic and Transportation
 5.1 When it opens in 2009, the Bellevue Nickel Improvement Project will increase the number of vehicles able to travel through the study area, improve travel speeds, and improve safety by reducing the
Other Principle Arterials Minor Arterial Major Collector Minor Collector Local
 CHAPTER 10 TRANSPORTATION Introduction The system of public roads in East Pikeland Township is decidedly rural in character. Since the 1984, the road network has remained much the same, with the addition
MEMORANDUM. Open Section Background. I-66 Open Section Study Area. VDOT Northern Virginia District. I-66 Project Team. Date: November 5, 2015
 MEMORANDUM To: VDOT Northern Virginia District From: I-66 Project Team Date: November 5, 2015 Subject: Open Section Background The purpose of this technical memorandum is to provide narrative and technical
FNORTHWEST ARKANSAS WESTERN BELTWAY FEASIBILITY STUDY
 FNORTHWEST ARKANSAS WESTERN BELTWAY FEASIBILITY STUDY EXECUTIVE SUMMARY The 2030 Northwest Arkansas Regional Transportation Plan developed by the Northwest Arkansas Regional Planning Commission (NWARPC)
Caliber Charter School VALLEJO, CA
 Traffic Impact Study Final Report Caliber Charter School VALLEJO, CA 21 June 2016 Prepared for: Prepared by: Traffic Engineering & Transportation Planning This report has been prepared and certified by
Memorandum. Roger Millar, Secretary of Transportation. Date: April 5, Interstate 90 Operations and Mercer Island Mobility
 Memorandum To: From: The Honorable Dow Constantine, King County Executive; The Honorable Ed Murray, City of Seattle Mayor; The Honorable Bruce Bassett, City of Mercer Island Mayor; The Honorable John Stokes,
2006 WEEKDAY TRAFFIC PROFILE. June 15, 2007
 June 15, 2007 Mr. Gary Stobb, P.E. Director of Planning/Operations Harris County Toll Road Authority 330 Meadowfern, Suite 200 Houston, TX 77067 Re: Westpark Tollway Value Pricing Analysis Dear Mr. Stobb:
Glasgow Street Traffic Review
 Glasgow Street Traffic Review Recommendation That the Standing Policy Committee on Transportation recommend to City Council: 1. That the Administration proceed with removing the pinch points installed
7272 WISCONSIN AVENUE LOCAL AREA TRANSPORTATION REVIEW
 7272 LOCAL AREA TRANSPORTATION REVIEW AND TRANSPORTATION POLICY AREA REVIEW MONTGOMERY COUNTY, MARYLAND Submitted on behalf of Carr Properties Prepared by: Wells + Associates, Inc. Submission: July 1,
London Borough of Barnet Traffic & Development Design Team
 London Borough of Barnet Traffic & Development Design Team AERODROME ROAD PEDESTRIAN FACILITY AND BUS STOP INTRODUCTION FEASIBILITY REPORT Job Number: 60668 Doc Ref: S106/12-13/60668 Author: Manoj Kalair
1.2 Corridor History and Current Characteristics
 SECTION 1 Description and Background of Study Area 1.1 Introduction This preliminary engineering report was prepared for the Alaska Department of Transportation and Public Facilities (ADOT&PF). It is part
Appendix B Ultimate Airport Capacity and Delay Simulation Modeling Analysis
 Appendix B ULTIMATE AIRPORT CAPACITY & DELAY SIMULATION MODELING ANALYSIS B TABLE OF CONTENTS EXHIBITS TABLES B.1 Introduction... 1 B.2 Simulation Modeling Assumption and Methodology... 4 B.2.1 Runway
FHWA P/N Guidelines. Corridor Relationship. Highway 22 Segment 1 - US 169 to CSAH 2 Relevance / Documentation of Need
 Highway 22 Segment 1 - US 169 to CSAH 2 Vehicle Mobility Congestion Intersection Congestion Existing Conditions - Based on Highway Capacity Manual methodology, corridor level of service is currently LOS
B. Congestion Trends. Congestion Trends
 B. Congestion Trends Congestion Trends There are two types of congestion that impact mobility: recurring and non-recurring congestion. Recurring congestion is related to segments of roadway that are over
TRANSPORTATION ELEMENT
 Transportation TRANSPORTATION ELEMENT Data, Inventory, and Analysis Prepared by Contents 1.0 INTRODUCTION... 1 2.0 EXISTING CONDITIONS... 1 2.1 Roadways... 1 2.1.1 Jurisdiction... 1 2.1.2 Functional Classification...
Regulations to deter cut-through traffic - Heath Street V\fest, between Spadina Road and Avenue Road. Toronto and East York Community Council
 TORONTO STAFF REPORT ACTION REQUIRED Regulations to deter cut-through traffic - Heath Street V\fest, between Spadina Road and Avenue Road Dnte: February 16,2009 To: From: Toronto and East York Community
Draft Concept Alternatives Analysis for the Inaugural Airport Program September 2005
 Section 10 Preferred Inaugural Airport Concept 10.0 Introduction The Preferred Inaugural Airport Concept for SSA was developed by adding the preferred support/ancillary facilities selected in Section 9
November 11, 2009 BY . Planning and Growth Management Department 110 Laurier Avenue West, 4 th Floor Ottawa, Ontario K1P 1J1. Dear Mr.
 November 11, 2009 Planning and Growth Management Department 110 Laurier Avenue West, 4 th Floor Ottawa, Ontario K1P 1J1 BY E-MAIL Attention: Mr. Don Herweyer Dear Mr. Herweyer: Reference: Abbott-Fernbank
Freymond Aggregates Quarry Bay Lake Rd., Twp. of Faraday
 Freymond Aggregates Quarry Bay Lake Rd., Twp. of Faraday Traffic Brief South Site Entrance Prepared by: Tranplan Associates PO Box 455 Lakefield, ON K0L 2H0 www.tranplan.com Prepared for: EcoVue Consulting
Madison Metro Transit System
 Madison Metro Transit System 1101 East Washington Avenue Madison, Wisconsin, 53703 Administrative Office: 608 266 4904 Fax: 608 267 8778 TO: FROM: SUBJECT: Plan Commission Timothy Sobota, Transit Planner,
Site Location and Setting
 Memorandum Date: To: From: Subject: Kristy Le, Gary Black Steve Orem Santa Teresa County Park Historic Area Traffic and Parking Study Hexagon Transportation Consultants, Inc. has completed a traffic and
4. Safety Concerns Potential Short and Medium-Term Improvements
 NH Route 104 Access Management Study Page 19 4. Safety Concerns Potential Short and Medium-Term Improvements Potential safety improvement strategies are listed by priority based on field observations by
12, 14 and 16 York Street - Amendments to Section 16 Agreement and Road Closure Authorization
 REPORT FOR ACTION 12, 14 and 16 York Street - Amendments to Section 16 Agreement and Road Closure Authorization Date: April 27, 2018 To: Toronto and East York Community Council From: Senior Strategic Director,
FORT LAUDERDALE-HOLLYWOOD INTERNATIONAL AIRPORT ENVIRONMENTAL IMPACT STATEMENT DRAFT
 D.3 RUNWAY LENGTH ANALYSIS Appendix D Purpose and Need THIS PAGE INTENTIONALLY LEFT BLANK Appendix D Purpose and Need APPENDIX D.3 AIRFIELD GEOMETRIC REQUIREMENTS This information provided in this appendix
ITS. Intermountain Transportation Solutions Traffic Studies Transportation Analysis Signal Design Site Planning. January 9, 2013
 ITS Intermountain Transportation Solutions Traffic Studies Transportation Analysis Signal Design Site Planning Raymond Wright, P.E. City of Spokane Transportation Department 11707 East Sprague Avenue,
According to FAA Advisory Circular 150/5060-5, Airport Capacity and Delay, the elements that affect airfield capacity include:
 4.1 INTRODUCTION The previous chapters have described the existing facilities and provided planning guidelines as well as a forecast of demand for aviation activity at North Perry Airport. The demand/capacity
Transport Impact Assessment
 Transport Impact Assessment Springbok Hotel Erf 5206, Springbok Northern Cape March 2018 5th Floor Imperial Terraces Carl Cronje Drive Tyger Waterfront Bellville, 7530 (021) 914 6211 (T) e mail: mail@itsglobal.co.za
ROUTE 122 CORRIDOR STUDY ---- Bedford County and Bedford City, Virginia
 ROUTE 122 CORRIDOR STUDY ---- Bedford County and Bedford City, Virginia Developed by Region 2000 Regional Commission In cooperation with Bedford County, Virginia City of Bedford, Virginia Virginia Department
HAMPTON ROADS CROSSINGS PATRIOTS CROSSING AND HRBT
 HRTPO Board Meeting March 21, 2013 Agenda ITEM #9: HAMPTON ROADS CROSSINGS PATRIOTS CROSSING AND HRBT Congestion at the Hampton Roads Bridge-Tunnel (HRBT) on I-64 has long been identified as a problem
10.0 Recommendations Methodology Assumptions
 10.0 Recommendations To accommodate the projected growth of the I-526 corridor, this report has summarized potential improvement strategies that were separated into four categories, TDM, Modal, Traffic
Western Development Lands Transportation Brief Richmond Village, (Ottawa), ON Mattamy Homes. Prepared By: Stantec Consulting Ltd.
, ON Mattamy Homes. Prepared By: Stantec Consulting Ltd.") Western Development Lands Transportation Brief Richmond Village, (Ottawa), ON Mattamy Homes Prepared By: Stantec Consulting Ltd. March 2012 RICHMOND VILLAGE, OTTAWA, ON TRANSPORTATION BRIEF APRIL 2013
Western Development Lands Transportation Brief Richmond Village, (Ottawa), ON Mattamy Homes Prepared By: Stantec Consulting Ltd. March 2012 RICHMOND VILLAGE, OTTAWA, ON TRANSPORTATION BRIEF APRIL 2013
US 380 FEASIBILITY STUDY
 US 380 FEASIBILITY STUDY Denton County CSJ(s): 0135-10-061, 0135-10-062 Public Meeting(s): January 15 & 22, 2019 WELCOME US 380 Denton County Feasibility Study DALLAS DISTRICT PUBLIC MEETING January 15
Central Coast Origin-Destination Survey
 Central Coast Origin-Destination Survey July 2016 Central Coast Origin-Destination Survey Prepared for: Santa Barbara County Association of Governments San Luis Obispo Council of Governments Ventura County
8 CROSS-BOUNDARY AGREEMENT WITH BRAMPTON TRANSIT
 8 CROSS-BOUNDARY AGREEMENT WITH BRAMPTON TRANSIT The Transportation Services Committee recommends the adoption of the recommendations contained in the following report dated May 27, 2010, from the Commissioner
This section evaluates the projected traffic operations and circulation impacts associated with the proposed upgrade and expansion of the LWRP.
 4.5 TRAFFIC AND CIRCULATION This section evaluates the projected traffic operations and circulation impacts associated with the proposed upgrade and expansion of the LWRP. 4.5.1 Environmental Setting Existing
Macleod Trail Corridor Study. Welcome. Macleod Trail Corridor Study Open House. Presentation of Proposed Design Concepts
 Macleod Trail Corridor Study Welcome Macleod Trail Corridor Study Open House Presentation of Proposed Design Concepts Study Purpose Develop a corridor plan for Macleod Trail that aligns with The City s:
5 Rail demand in Western Sydney
 5 Rail demand in Western Sydney About this chapter To better understand where new or enhanced rail services are needed, this chapter presents an overview of the existing and future demand on the rail network
FUTURE PASSENGER PROCESSING. ACRP New Concepts for Airport Terminal Landside Facilities
 FUTURE PASSENGER PROCESSING ACRP 07-01 New Concepts for Airport Terminal Landside Facilities In association with: Ricondo & Associates, TransSolutions, TranSecure RESEARCH Background Research Objective
Strategic Signal Timing Changes = BIG Results. Barbara Jones, PE, PTOE DGL Consulting Engineers, LLC Senior Traffic Engineer
 Strategic Signal Timing Changes = BIG Results Barbara Jones, PE, PTOE DGL Consulting Engineers, LLC Senior Traffic Engineer Pre Signal Timing Updates Signal Timing Updates Average Retiming Interval Percent
Section 106 Update Memo #1 Attachment D. Traffic Diversion & APE Expansion Methodology & Maps
 Section 106 Update Memo #1 Attachment D Traffic Diversion & APE Expansion Methodology & Maps I-65/I-70 North Split Interchange Reconstruction Project (Des. Nos. 1592385 & 1600808) Traffic Diversion and
MARSHALL Subdivision. Township of Springwater, County of Simcoe. Traffic Brief for: Ontario Inc. Type of Document: Final Report
 MARSHALL Subdivision Township of Springwater, County of Simcoe Traffic Brief for: 489469 Ontario Inc. Type of Document: Final Report Project Number: JDE 1521 Date Submitted: October 19 th, 2016 10 / 19
NORTH FRASER PERIMETER ROAD WEST CORRIDOR DEFINITION STUDY
 NORTH FRASER PERIMETER ROAD WEST CORRIDOR DEFINITION STUDY MAY 2011 SW1132SWD NORTH FRASER PERIMETER ROAD WEST CORRIDOR DEFINITION STUDY TABLE OF CONTENTS 1.0 INTRODUCTION... 1 2.0 CURRENT TRAVEL PATTERNS
Watts St westbound thru
 Executive Summary At the request of the Hudson Square Business Improvement District, Sam Schwartz Engineering, DPC (Sam Schwartz) has completed a technical analysis of various congestion pricing and/or
Research Report Agreement T4118, Task 24 HOV Action Plan HOV ACTION PLAN
 Research Report Agreement T4118, Task 24 HOV Action Plan HOV ACTION PLAN by John M. Ishimaru Senior Research Engineer Duane Wright Systems Analyst Programmer Mark E. Hallenbeck Director Jaime Kang Research
# 7. Date of Meeting: September 2, 2015 BOARD OF SUPERVISORS BUSINESS MEETING ACTION ITEM SUBJECT:
 BOARD OF SUPERVISORS BUSINESS MEETING ACTION ITEM Date of Meeting: September 2, 2015 # 7 SUBJECT: ELECTION DISTRICT: CRITICAL ACTION DATE: STAFF CONTACTS: Traffic Congestion and Safety Improvements at
Project Deliverable 4.1.3d Individual City Report - City of La Verne
 Pomona Valley ITS Project Project Deliverable 4.1.3d Individual City Report - City of La Verne Prepared by: April 19, 2002 099017000.1 Copyright 2002, Kimley-Horn and Associates, Inc TABLE OF CONTENTS
TRAFFIC & PARKING STUDY FOR PROPOSED BIRMINGHAM BOUTIQUE HOTEL
 TRAFFIC & PARKING STUDY FOR PROPOSED BIRMINGHAM BOUTIQUE HOTEL Prepared for LORIENT CAPTIAL LLC Birmingham, MI By GIFFELS WEBSTER Washington Township, MI April 2017 i CONTENTS EXECUTIVE SUMMARY. ii INTRODUCTION.
Construction Staging Adelaide Street West
 REPORT FOR ACTION Construction Staging Adelaide Street West Date: October 6, 2016 To: Toronto and East York Community Council From: Acting Director, Transportation Services, Toronto and East York District
Longmont to Boulder Regional Trail Jay Road Connection DRAFT FINAL REPORT
 Longmont to Boulder Regional Trail Jay Road Connection DRAFT FINAL REPORT December 2018 Project Summary Boulder County, Colorado, in partnership with the City of Boulder, is evaluating options for multi-use
AGENDA ITEM 5 D WAKULLA ENVIRONMENTAL INSTITUTE (WEI) TRAIL FEASIBILITY STUDY
 TRAIL FEASIBILITY STUDY") March 19, 2018 AGENDA ITEM 5 D WAKULLA ENVIRONMENTAL INSTITUTE (WEI) TRAIL FEASIBILITY STUDY TYPE OF ITEM: Action STATEMENT OF ISSUE The Wakulla Environmental Institute (WEI) Trail is one of several trails
March 19, 2018 AGENDA ITEM 5 D WAKULLA ENVIRONMENTAL INSTITUTE (WEI) TRAIL FEASIBILITY STUDY TYPE OF ITEM: Action STATEMENT OF ISSUE The Wakulla Environmental Institute (WEI) Trail is one of several trails
Table of Contents. List of Tables
 Table of Contents 1. Introduction... 1 2. Service Recommendations... 1 A. Extend Service on Fort Belvoir to New Post Exchange/Commissary Complex... 1 B. Improve Service Frequencies on Sunday from Current
FINAL. Bicycle/Pedestrian Feasibility Study City of DeBary Dirksen Drive Trail. Prepared For: Volusia County MPO
 City of DeBary Dirksen Drive Trail FINAL Prepared By: Reynolds, Smith and Hills, Inc. Prepared For: Volusia County MPO September 2007 Table of Contents INTRODUCTION...1 PROJECT PURPOSE AND SCOPE...2 PHYSICAL
TABLE OF CONTENTS. 1 P age
 TABLE OF CONTENTS PROJECT DESCRIPTION... 2 PROJECT LOCATION... 5 PROEJCT PARTIES... 8 GRANT FUNDS AND SOURCES/ USES OF PROJECT FUNDS... 8 PRIMARY SELECTION CRITERIA/ QUALITY OF LIFE... 9 RESULTS OF BENEFIT
US Route 3 Corridor Study: Phase I. Town of Boscawen & City of Franklin, New Hampshire
 US Route 3 Corridor Study: Phase I Town of Boscawen & City of Franklin, New Hampshire January 27, 2004 US Route 3 Corridor Study: Phase I, NH City of Franklin Franklin Plantation For the Town of Boscawen
Frequently Asked Questions on the Route 29 Solutions Improvements Projects
 Frequently Asked Questions on the Route 29 Solutions Improvements Projects Background What are the Route 29 Solutions improvement projects? These projects include the Route 29/250 Interchange ( Best Buy
Alternatives Analysis City of Newport Beach Sunset Ridge Park Project December 14, 2011
 Alternatives Analysis City of Newport Beach Sunset Ridge Park Project December 14, 2011 Alternatives Analysis for Vehicular Access: This report supplements the project s certified EIR s Alternatives Analysis.
Provincial Railway Technical Standards
 GENERAL: INDEX: The standards and requirements listed in this document are intended for use on provincially regulated railway public grade crossings. These standards are considered the minimum requirements
HDR itrans Consulting Inc. 100 York Blvd., Suite 300 Richmond Hill, ON L4B 1J8 Tel: (905) Fax: (905)
 Fax: (905)") !" # $ !" # $ Consulting Inc. 100 York Blvd., Suite 300 Richmond Hill, ON L4B 1J8 Tel: (905) 882-4100 Fax: (905) 882-1557 www.itransconsulting.com November 2009 %&'('$&$ 1. West Brampton Road Network...
!" # $ !" # $ Consulting Inc. 100 York Blvd., Suite 300 Richmond Hill, ON L4B 1J8 Tel: (905) 882-4100 Fax: (905) 882-1557 www.itransconsulting.com November 2009 %&'('$&$ 1. West Brampton Road Network...
Southern Oregon Transportation Engineering, LLC
 Southern Oregon Transportation Engineering, LLC 112 Monterey Drive - Medford, Or. 97504 Office 541.608.9923 Cell 541.941.4148 Email: Kwkp1@Q.com August 12, 2013 Mike Faught, Public Works Department City
Pattullo Bridge Replacement Project
 Pattullo Bridge Overview This document will: Explain the challenges facing the Pattullo Bridge today Share how we propose moving forward translink.ca PAGE 1 History By Order of the Lieutenant Governor
FEASIBILITY STUDY REFINED CONCEPT 1 PROJECT A
 VIRGINIA DEPARTMENT OF TRANSPORTATION I-85 / I-95 INTERCHANGE FEASIBILITY STUDY REFINED CONCEPT 1 PROJECT A Columbia Rd REFINED CONCEPT 1 PROJECT A Bellevue Rd COST: $3.3M Siege Rd Eliminate the loop ramp
FEASIBILITY CRITERIA
 This chapter describes the methodology and criteria used to evaluate the feasibility of developing trails throughout the study areas. Land availability, habitat sensitivity, roadway crossings and on-street
Rappahannock-Rapidan Regional Commission 2010 Travel Time Survey
 Rappahannock-Rapidan Regional Commission 2010 Travel Time Survey Rappahannock Rapidan Regional Commission 420 Southridge Pkwy. Suite 106 Culpeper, VA 22701 June 16, 2010 Introduction Travel time, or the
rtc transit Before and After Studies for RTC Transit Boulder highway UPWP TASK Before Conditions
 rtc transit Before and After Studies for RTC Transit UPWP TASK 3403-11-14 Before Conditions Report Boulder highway June 2011 Before and After Studies for RTC Transit BOULDER HIGHWAY BEFORE STUDY UPWP Task
APPENDIX J MODIFICATIONS PERFORMED TO THE TOR
 APPENDIX J MODIFICATIONS PERFORMED TO THE TOR This appendix summarizes the modifications that were performed in years 2012 and 2017 to rectify calculation errors that were observed in the data presented
Route 29 Solutions Projects
 Your guide to the Route 29 Solutions Projects For full details & continued engagement please visit www.route29solutions.org The Route 29 Solutions Package is a $230 million investment into the improvement
Chapter 14 Route Window C12 Mile End Park and Eleanor Street shafts. Transport for London
 Chapter 14 Route Window C12 Mile End Park and Eleanor Street shafts MILE END PARK AND ELEANOR STREET SHAFTS 14 Route Window C12 Mile End Park and Eleanor Street shafts Introduction 14.1 Crossrail s twin
Yonge Street / Highway 401 Improvements Update. Public Works and Infrastructure Committee. General Manager, Transportation Services
 PW9.7 STAFF REPORT ACTION REQUIRED Yonge Street / Highway 401 Improvements Update Date: October 26, 2015 To: From: Wards: Reference Number: Public Works and Infrastructure Committee General Manager, Transportation
%g 109 %g 9. %g 99. %g 9. %g 4. %g 4 %g ,95 (/ 1. Route 109 Corridor Study. %g 35. Corridor Study Area Study Area. Sanford.
 %g 4A %g 109 %g 4 Sanford %g 4 %g 109 %g 99 North Berwick Wells 3 0 3 Miles Route 109 Corridor Study %g 9 %g 109 %g 9A %g9a %g 9 Kennebunk.-,95 W N S E EXIT 2 MEETING HOUSE RD BRAGDO N RD 20 2 %g1 1 (/
CHAPTER 4: ALTERNATIVES
 MSP Long Term Comprehensive Plan Update Metropolitan Airports Commission 4.1 INTRODUCTION CHAPTER 4: ALTERNATIVES Several alternatives were developed and evaluated based on their capability to meet the
Mount Pleasant (42, 43) and Connecticut Avenue (L1, L2) Lines Service Evaluation Study Open House Welcome! wmata.com/bus
 and Connecticut Avenue (L1, L2) Lines Service Evaluation Study Open House Welcome! wmata.com/bus") Mount Pleasant (42, 43) and Connecticut Avenue (L1, L2) Lines Service Evaluation Study Open House Welcome! Study Overview and Timeline Phase 1: Collect and Analyze Data Project Kickoff, September 2017
Mount Pleasant (42, 43) and Connecticut Avenue (L1, L2) Lines Service Evaluation Study Open House Welcome! Study Overview and Timeline Phase 1: Collect and Analyze Data Project Kickoff, September 2017
Traffic Management Plan 2018
 Traffic Management Plan 2018 Jesuit College Preparatory School of Dallas Amendment to Planned Development No. 353 Dallas, Texas June 6, 2018 Prepared for Jesuit College Preparatory School of Dallas Prepared
Appendix 4.1 J. May 17, 2010 Memorandum from CTPS to the Inter Agency Coordinating Group
 Appendix 4.1 J May 17, 2010 Memorandum from CTPS to the Inter Agency Coordinating Group CTPS CENTRAL TRANSPORTATION PLANNING STAFF Staff to the Boston Region Metropolitan Planning Organization MEMORANDUM
Construction underway. STATUS: 229 5,190 5,419 5,305 STIP REFERENCE #FR /01/2013
 FREDERICK COUNTY STATE HIGHWAY ADMINISTRATION -- Frederick County -- Line 1 PROJECT: I-7, Baltimore National Pike INTERSTATE CONSTRUCTION PROGRAM DESCRIPTION: Widen I-7 east of MD 355 to east of MD 144
user s guide to Transportation Improvements in Astoria Planning Efforts outside Astoria for more information, contact:
 The Miles Crossing/ Jeffers Garden transportation plan (underway), will identify needed improvements to the Warrenton Astoria Highway and local street improvements to serve expected growth in the Miles
PDF compression, OCR, web optimization using a watermarked evaluation copy of CVISION PDFCompressor
 o U.S. Department Washington Division Suite 501 Evergreen Plaza of Transportation 711 South Capitol Way Olympia, Washington 98501-1284 Federa' Highway (360) 753-9480 Administration (360) 753-9889 (FAX)
TORONTO TRANSIT COMMISSION REPORT NO.
 Revised: March/13 TORONTO TRANSIT COMMISSION REPORT NO. MEETING DATE: November 18, 2013 SUBJECT: YONGE-EGLINTON AND EGLINTON WEST INTERCHANGE STATIONS METROLINX EGLINTON CROSSTOWN LIGHT RAIL TRANSIT PROJECT
METROBUS SERVICE GUIDELINES
 METROBUS SERVICE GUIDELINES In the late 1990's when stabilization of bus service was accomplished between WMATA and the local jurisdictional bus systems, the need for service planning processes and procedures
MEMORANDUM. for HOV Monitoring on I-93 North and the Southeast Expressway, Boston Region MPO, November, 2011.
 MEMORANDUM Date: January 12, 2012 To: Congestion Management Process Files From: Seth Asante, Ryan Hicks, and Efi Pagitsas MPO Staff Re: Historical Trends: Travel Times and Vehicle Occupancy Levels for