DATABASE HEALTH INDEX - DASHBOARD
|
|
|
- Michael Park
- 5 years ago
- Views:
Transcription
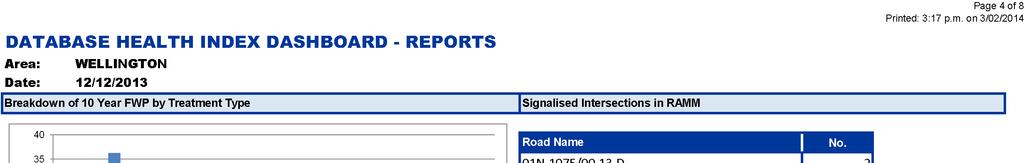
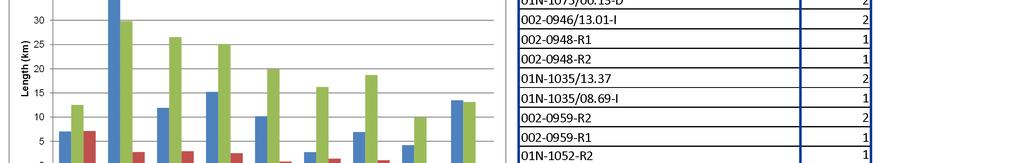
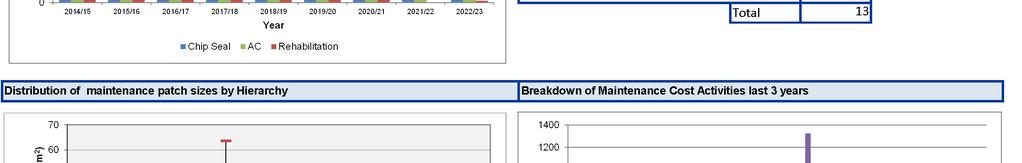
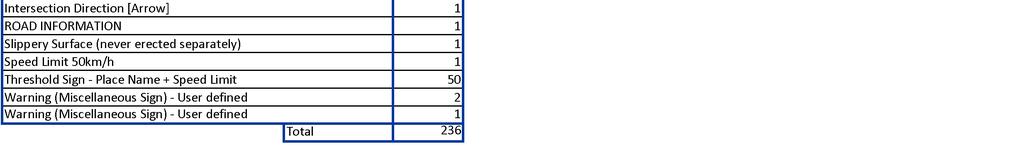
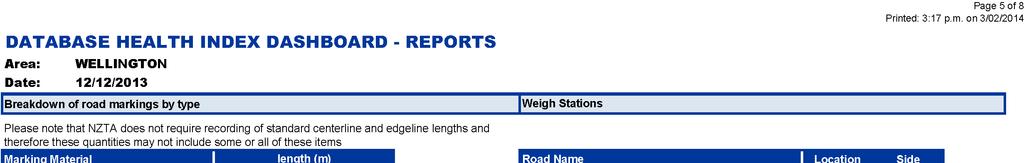
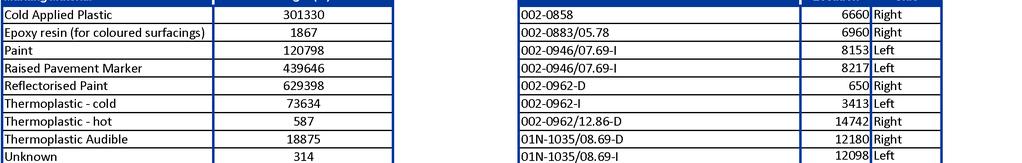
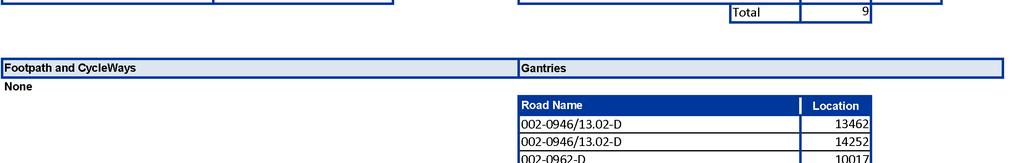
1 Page 1 of 8 DATABASE HEALTH INDEX - DASHBOARD Carriageway Asset Inventory Collected Data Non-Carriageway Asset Inventory Area: Date: WELLINGTON 12/12/2013 Category Measures Result Measure Capital Projects Surfacing Pavement Layer KEY: Expected Value 2.8% Grade % Grade 3 2.3% 2.2% 52.9% Grade 3 Grade 3 1.6% Grade 3 3.9% Road Marking Breakdown of road markings by type % Proportion of very long (> 2000m) TLs 0.0% Treatment Length Proportion of TLs with < 80% coverage of major surfacing 14.3% Forward Works Programme 82.2% 14/11/ % 0.0% 70.0% Grade 3 Carriageway Rating Percentage rated in last year 96.8% High Speed Data Maintenance Activity Miscellaneous Traffic Count Structures Drainage Surface Water Channels Signs Streetlights Footpaths & Cycleways Signal Controlled Intersections Major capital projects completed v RAMM (in last 6-30 months) Minor capital or safety improvement projects v RAMM (in last 6-30 months) % of Network surfaced in RAMM over previous 4 15 months % Surfaces at least 50% older than expected age % of Network with no surfacing Illogical Records inc. % (SAC with chipseal, Low and high widths, Alignment of traffic volumes v pavement use) Proportion of Network with layer Information New layer length in previous 6 30 months Illogical records (Pavement Layers v Incorrect Surfacing) Proportion of very short (< 20m) TLs % updated in last 5 years Date FWP last updated Proportion of network identified for treatment in next ten years (from FWP) FWP v surfacings (% surfacings in last year conflicting with first 2 years of FWP excluding 2nd coats) Evidence of active MIS strategy, reasons for treatments listed and detailed % network meeting standards for roughness, rutting and texture (Roads surveyed in last year) % network meeting standards for FWD (Roads surveyed in last 5years) % network meeting standards for SCRIM (Roads surveyed in last year) Items per km for PA and SU cost groups in previous 4 15 months v Regional Average Spread of location in previous 4-15 months (proportion located at carriageway start) Distribution of maintenance patch sizes by Hierarchy Breakdown of Maintenance Cost Activities % of Maintenance Activity where fault type is "Unknown" No. of test pits with layer data recorded No. of LTPP sites recorded in RAMM Latest ADT Counts Latest ADT Estimates % loading estimate (i.e. not default) No. of Pavement Type "Bridge" v No. of Bridges > 50m in length in BDS No. Large Culverts v No. BDS Retaining Walls Gantries ( for locations) Barriers in RAMM (m) End Treatments in RAMM Culverts per km v Regional Average (Rural) Catchpits per km v Regional Average (Urban) Manholes per km v Regional Average (Urban) Subsoil Drains per km v Regional Average (Rural) % of Drainage (Construction Date in previous 4 15 months) Surfaced SWC per km v Regional Average (Urban) Earth SWC per km v Regional Average (Rural) Sealed SWC renewal activity (Construction Date in previous 4 27 months) Signs per km v Regional Average Large Signs >4.0m 2 ( for quantity by type) ITS VMS % of Signs with renewal date in last 4-15 months No. Frangible bases in RAMM (no posts in RAMM) Streetlights per km v Regional Average Frangible Base type no. Shear Base type no. % of Streetlight Poles with renewal date in last 4 15 months Duplicates or near duplicates plus poles with no light or bracket Total length of Footpath and Cycleways (see attached tables for listings) Signal Controlled Intersections ( for locations) On or exceeding target One grade, or between 0 and 15 below captured value Greater than one grade, or 15 below captured value 74.8% 63.2% Grade % 150.0% 0.7% 0.7% 41 no. - 2 no. - 31/12/ /12/ % 60.0% Grade 3 7.5% Grade no no m % 123.8% 128.6% 90.7% 0.1% Grade % 77.1% 1.7% Grade % 236 no no % Grade no % 26 no no. - Performance 0.0% Grade 4 0.0% Category Expected Value no Rest Areas Number of rest areas 7 no Weigh Stations Number of Weigh Stations ( for locations) 9 no
2 Page 2 of 8 DATABASE HEALTH INDEX DASHBOARD - PROJECTS Area: WELLINGTON Date: 12/12/2013 Major capital projects completed v RAMM (in last 6-30 months) In RAMM (Y/N/P) Project Name SH RS Dir RP Comments Year Y Muldoons Re-alignment /13 N Memorial Park Underpass Phase 1 01N 1075 D /13 Y Waterfall Rd Median Barrier 01N 1023 I&D Barrier construction date "25/12/2010" 11/12 N Ngauranga 4 Laning 01N 1068 I lanes No Pavement structure or surfacing details, construction dates missing in drainage, markings etc 11/12 Terrace Tunnel 01N M&E Not Recorded in RAMM 11/12 Y P2P Clearway 01N /12 P River Road I&D D Missing surface and pavement structure details 10/11 Start Name missing in Carriageway table (end name from Y Horokiwi Median 2 962/12.86 D 12.7 previous section D Missing) 10/11 Minor safety works v RAMM (in last 6-30 months) In RAMM (Y/N/P) Project Name SH RS Dir RP Comments Year N Mikimiki Barrier B /13 Y Opaki L 8255 "No Engine Braking" 12/13 N Renal St RAB Upgrade B /13 Y Whakatiki St /07.69 I 7870 Speed Limit Sign 12/13 Y Rimutaka Barriers installation & 0931 B 12/13 Y Petone Bowl Entrance Barrier I /13 Y ATP /13 Y Transpower Barriers B Installed Jan /13 Y Drop out temp speed limit /02.80 B Speed Limit Signs 12/13 Y Barriers /13 Y Ngaio Rd 01N 1012 B 4455 Give Way x2 keep left 12/13 Y Beach Rd Paekakariki Int 01N 1023/08.22 B /13 Y Pukerua Bay 'Toilet Signs' 01N /13 Misc Sign Upgrades 01N To be completed 12/13 Y ATP 01N 12/13 Y Norfolk Rd "Give Way" x R /12 Whakatiki St dura-post installation I&D Not Recorded in RAMM 11/12 Y Sign Upgrades B Various new signs June /12 Y SH1 P2P Clearways 01N /12 Y Newlands Rd Off Ramp Signs and Markings 01N 1066 R1 & R5 Signs and edgeline 11/12 Y Otaki Puffin Crossing 01N 0995 B /12 Y SH Off ramp 'wrong way' signage 12 signs installed 12 Off Ramps 11/12 Y Wairarapa crossing points (Carterton) B New signs installed 10/11 Y Cashmere Oaks Streetlighting R /11 Y Waihakeke/Hughes Line N Markings No Painted Date 10/11 Y Masterton Cycle Marking L&R /11 Y Wiltons Rd Markings No Painted Date 10/11 Y Wairarapa crossing points (Greytown) /05.78 B New signs installed 10/11 Y Rimutaka Barriers B /11 Y Akatarawa Intersection Improvements B Markings, Catchipit. Channels No constructed date 10/11 N Moonshine curve alignment Decreasing side has no surface data 10/11 Y Dowse-Petone Speed Limit Change I&D /11 Y Horokiwi Road Intersection Dir No pavement layer details for entire RS I&D 10/11 Y Petone VMS HOROKIWI_CYCLE PETONE_CYCLE_SIGN 10/11 Y Belmont School Barrier I I /11 Y Petone Off Ramp Cycle signs R1 L&R 60 10/11 Y Grounsell HSRS I HSRS PSKID 10/11 Y Petone HSRS I HSRS PSKID 10/11 Y Tauherenikau Bridge Barrier & SACWS B Bridge Railing with missing construction date SACWC installation dates missing 10/11 Y Haywords Hill widening/dish channel /02.80 B /11 Y Postgate Drive RAB /02.80 B /11 Y Waikanae Wide centreline trial 01N 1012 B Painted Date Missing 10/11 Y Raumati Rd PW Signs 01N 1023 R 440 PW Sign x1 Road Narrows 10/11 Y Sang Sue Streetlighing 01N 1023 Streetlighting? Has been updated 03/ /11 Y Raumati Rd LTB Remarking 01N 1023 B Markings No Painted Date 10/11 Y Kaiwharawhara Barrier 01N 1068 I&D /11 P? Forest Lakes 01N 0995 B ? 10/11 Y Takapu Rd Visibility Improvements 01N 1050/0630 I&D Markings updated 10/11 Y Calabar Road Separation Kerb 01N 1076/02.08 I&D /11
 Culverts (Rural) Catchpit (Urban) Manholes (urban) Subsoil Drain (Rural) (m per km) Surfaced SWC (Urban) (m per km) Earth SWC (Rural) (m per km) Signs")
3 Page 3 of 8 DATABASE HEALTH INDEX - REGIONAL AVERAGES Area: WELLINGTON Date: 12/12/2013 Regional Averages Hierarchy Asset Maintenance Costs (no. of pavement and surfacing faults per km) Culverts (Rural) Catchpit (Urban) Manholes (urban) Subsoil Drain (Rural) (m per km) Surfaced SWC (Urban) (m per km) Earth SWC (Rural) (m per km) Signs Streetlights Region High Volume National Strategic Regional Strategic Regional Connector Regional Distributor Regional Average for route type Wellington Hawkes Bay Taranaki M&O Gisborne Manawatu Whanganui M&O Regional Average for route type Wellington Hawkes Bay Taranaki M&O Gisborne Manawatu Whanganui M&O Regional Average for route type Wellington Hawkes Bay Taranaki M&O Gisborne Manawatu Whanganui M&O Regional Average for route type Wellington Hawkes Bay Taranaki M&O Gisborne Manawatu Whanganui M&O Regional Average for route type Wellington Hawkes Bay Taranaki M&O Gisborne Manawatu Whanganui M&O Regional Average for route type Wellington Hawkes Bay Taranaki M&O Gisborne Manawatu Whanganui M&O Regional Average for route type Wellington Hawkes Bay Taranaki M&O Gisborne Manawatu Whanganui M&O Regional Average for route type Wellington Hawkes Bay Taranaki M&O Gisborne Manawatu Whanganui M&O Regional Average for route type Wellington Hawkes Bay Taranaki M&O Gisborne Manawatu Whanganui M&O Regional Average

4


5
 Minor capital or safety improvement projects v RAMM (in last 6-30 months) % of Network surfaced in RAMM over previous 4 15 months % Surfaces 50% older than")
6 Page 6 of 8 DATABASE HEALTH INDEX - PARAMETERS Pavement Inventory Capital Projects Surfacing Pavement Layer Measures Description Data Source Grading Greater than Less than Major capital projects completed v RAMM (in last 6-30 months) Minor capital or safety improvement projects v RAMM (in last 6-30 months) % of Network surfaced in RAMM over previous 4 15 months % Surfaces 50% older than expected age % of Network with no surfacing Illogical records (SAC with chipseal, Low and high widths, Alignment of traffic volumes v pavement use) Proportion with layer information New Layer length in 6 30 months Illogical records (Pavement layers v Incorrect Surfacing) Proportion of major capital projects completed within in 6-30 months that have been catpured in RAMM Proportion of minor capital or safety improvement projects completed within in 6-30 months that have been catpured in RAMM Total length of Network with surface date between 4-15 months old / total length of network Total length of Network with surface date > 50% older than expected age / total length of network Total length of Network with no surface material / total length of network No. Records with inconsistencies / No carriageway sections Total length of Network with layer material / total length of network Total length of Network with layer date between 6-30 months old / total length of network Total No. illogical Records / total No treatment lengths NZTA Regional Office, RAMM 8% 5% 8% Grade 3 2% 5% Grade 4 2% 3% 3% 7% Grade 3 7% 15% Grade 4 15% 3% 5% Grade 3 1% 3% Grade 4 1% NZTA Target Grade NZTA Regional Office, RAMM RAMM surface_structure, carr_way, treatment_length RAMM surface_structure, carr_way RAMM pave_structure, carr_way, treatment_length RAMM carr_way, treatment_length RAMM treatment_length, carr_way RAMM carr_way, c_surface, traffic_loading, traffic_loading_dtl RAMM treatment_length, carr_way Grade 3 Road Marking Breakdown of road markings by type Total road marking length by type RAMM carr_way, markings Treatment Length Forward Works Programme Collected Data Carriageway Rating High Speed Data Proportion of very short < 20m TLs Total length of Network with length < 20m / RAMM carr_way, treatment_length total length of network Proportion of very long > 2000m Total length of Network with length > 2000m / RAMM carr_way, treatment_length TLs total length of network Proportion of TLs with < 80% Total length of Network with < 80% coverage RAMM carr_way, treatment_length coverage of major surfacing of major surfacings / total length of network % updated in last 5 years Total No treatment lengths updated in last 5 RAMM carr_way, treatment_length years / total No TL's Date FWP Last Updated Proportion of network identified for treatment in next ten years (date last updated) FWP v surfacings (% surfacings in last year conflicting with first 2 years of FWP exc 2nd coats) Evidence of active MIS strategy, reasons for treatments listed and detailed Percentage rated in last year % network meeting standards for roughness, rutting and texture (Roads surveyed in last year) % network meeting standards for FWD (Roads surveyed in last 5 years) % network meeting standards for SCRIM (Roads surveyed in last year) Date FWP last updated Length of network identified for treatment in the 10 year FWP / total network length Total length of Network with surfacings with dates in last year with a treatment scheduled in first 2 years of FWP (excl 2nd coats) / total length in first 2 years of FWP Total length of Network with MIS strategy present / Total Network Length Total network length rated in the last year / total network length Total length of network with roughness, rutting and texture surveyed in the last year / total network length Total length of network with FWD surveyed in the last 5 years / total network length Total length of network with SCRIM surveyed in the last year / total network length RAMM treatment_length, fw_cell_treatment, fw_programme_cell, fw_programme_hdr, fw_treatment RAMM treatment_length, fw_cell_treatment, fw_programme_cell, fw_programme_hdr, fw_treatment RAMM treatment_length, fw_cell_treatment, fw_programme_cell, fw_programme_hdr, fw_treatment RAMM treatment_length, fw_cell_treatment, fw_programme_cell, fw_programme_hdr, fw_treatment RAMM carr_way, treatment_length, rating RAMM carr_way, treatment_length, hsd_rough, hsd_rutting,hsd_texture RAMM carr_way, treatment_length,falling_weight RAMM carr_way, treatment_length,skid_resistance 2% 2% 5% Grade 3 5% 6% Grade 4 8%
7 Page 7 of 8 DATABASE HEALTH INDEX - PARAMETERS Maintenance Costs Measures Description Data Source Grading Greater than Less than Items per km for PA and SU cost groups in previous 4 15 months vs Regional Average Spread of location in previous 4-15 months (proportion located at carriageway start) Distribution of maintenance patch sizes by Hierarchy Total number of pavement and surfacing activity in last 4-15 months/total Carriageway Length vs Regional Average Total number of pavement and surfacing activity in last 4-15 months at carriageway start / Total pavement and surfacing activity Distribution of maintenance patch sizes by State Highway Classification RAMM carr_way, mc_cost RAMM carr_way, mc_cost RAMM carr_way, mc_cost NZTA Target Grade Breakdown of Maintenance Cost Activities Breakdown of maintenance cost actvities by type for the last 3 years by State Highway Classification RAMM carr_way, mc_cost % of Maintenance Activity where fault type is "Unknown" Percentage of maintenance cost activity recorded as unknown for the last 3 years. RAMM carr_way, mc_cost Miscellaneous No. Test Pits with layer data recorded No. of LTPP Sites recorded in RAMM Total number of test pit records RAMM carr_way, pave_test_pit_hdr Total number of LTPP Sites RAMM carr_way, ud_ltpp Latest ADT Counts Latest date of counts RAMM traffic_loading Traffic Count Latest ADT Estimates Latest date of Estimates RAMM traffic_loading Non-Carriageway Asset Inventory % loading estimate (i.e. not default) No. Pavement Type "Bridge" v No. Bridges > 50m in length in BDS No. Large Culverts v No. BDS Total no. loading estimates in last year / total no carriageway sections Total No. Bridge pavement type in RAMM vs Total No. Bridges >50m in length in BDS that carry the State Highway Total No. Culverts with an area >= 3.4m 2 vs Total No. culverts in BDS RAMM carriageway, traffic_loading, carr_way, traffic_loading_dtl RAMM carr_way, BDS RAMM carr_way, drainage, BDS Structures Retaining Walls Total No. Retaining Walls RAMM carr_way, retaining_wall Gantries Total No. Gantries RAMM carr_way, minor_structure Barriers in RAMM(m) Total Length Barriers (excludes SR, HR, OTHER, GREAT) RAMM carr_way, railings Drainage Surface Water Channels Culverts per km v Regional Average (Rural) Catchpits per km v Regional Average (Urban) Manholes per km v Regional Average (Urban) Subsoil Drains per km v benchmark Regional Average (Rural) % of Drainage (Construction Date in previous 4 15 months) Surfaced SWC per km v Regional Average (Urban) Earth SWC per km v Regional Average (Rural) Sealed SWC Renewal Activity (Construction Date in previous 4 27 months) Total No. of culverts per km Rural (Includes CUL, SDCUL, OFCUL) vs regional average per km Total No. of catchpits per kmurban (includes CP1,CP2,CP3,SUMP,GRID, SP) vs regional average per km Total No. of manholes per km Urban (includes MHOLE, DCHM) vs regional average per km Length of subsoil drains per km Rural vs regional average per km Total No. of drainage structures renewed or replaced in last 4-15 months / total no. of drainage structures Length of surfaced SWC per km Urban vs regional average per km Length of Earth SWC per kmrural vs regional average per km Length of surfaced SWC renewed or replaced in last 4-15 months / total length of surfaced SWC RAMM carr_way, drainage RAMM carr_way, drainage RAMM carr_way, drainage RAMM carr_way, drainage 4% RAMM carr_way, drainage 2% 4% Grade 3 1% 2% Grade 4 1% RAMM carr_way, sw_channel RAMM carr_way, sw_channel 4% RAMM carr_way, sw_channel 2% 4% Grade 3 1% 2% Grade 4 1%
8 Page 8 of 8 DATABASE HEALTH INDEX - PARAMETERS Measures Description Data Source Grading Greater than Less than Signs per km v Regional Average Total No. of signs per km vs regional average per km RAMM carr_way, signs NZTA Target Grade Large Signs >4.0m 2 Total No. of large signs with a sign face greater than 4.0m 2 RAMM carr_way, signs Signs ITS VMS Total No. of ITS Assets (3VMS, 3MVMS, 3VMSS, 3VSS) and its_state = "In Service" RAMM carr_way, ud_its % of Signs with renewal date in previous 4 15 months Total No. of signs renewed or replaced in last 4-15 months / total number of signs 6% 4% 6% RAMM carr_way, signs Grade 3 2% 4% Grade 4 2% No. Frangible bases in RAMM Total No of signs with frangible bases, type includes (SJ and BP) RAMM signs, sign_to_post_join, sign_post Streetlights per km v benchmark Total No. of street lights per km vs regional average per km RAMM carr_way, sl_pole Frangible Base type no. Total No. of street lights with frangible bases RAMM carr_way, sl_pole Streetlights Shear Base type no. Total No. of street lights with shear bases RAMM carr_way, sl_pole Footpath & Cycleways % of Street lights with renewal date in previous 4 15 months Duplicates or near duplicates plus poles with no light or bracket Total Length of footpath and cycleways (see attached tables for listing) Total No. of street lights renewed or replaced in last 4-15 months / total number of street lights Total No. Poles with no brackets attached, total No. brackets with no light attached, total No. poles with duplicate road_id, location, offset_side, offset RAMM carr_way, sl_pole RAMM carr_way, sl_pole, sl_bracket, sl_light 6% 4% 6% Grade 3 2% 4% Grade 4 2% Total length of footpath and cycleways RAMM carr_way, features Signal Controlled intersections No. Signal Controlled Intersections ( for loactions) Number of signal Controlled Intersections (SIGINT) RAMM carr_way, features Rest Areas Number of rest areas Total No of rest areas RAMM carr_way, features Weigh Station No. Weigh stations Number of weighs Stations (WSTAT) RAMM carr_way, minor_structure
DATABASE HEALTH INDEX - DASHBOARD
 Page 1 of 8 DATABASE HEALTH INDEX - DASHBOARD Carriageway Asset Inventory Area: Date: CENTRAL WAIKATO M&O 10/10/2013 Category Measures Result Measure Capital Projects Surfacing Pavement Layer Major capital
NLTF 2020/21 ($000) Funding Priority NLTF 2018/19 ($000) NLTF 2019/20 ($000)
 Funding Priority NLTF 2018/19 ($000) NLTF 2019/20 ($000)") Funding Priority Wellington - Carterton District Council - Local road improvements Low cost / low risk improvements 2018-21 Local Roads 2 341 HM 53% 1,050 194 149 214 Approved Street Light LED conversion
Funding Priority Wellington - Carterton District Council - Local road improvements Low cost / low risk improvements 2018-21 Local Roads 2 341 HM 53% 1,050 194 149 214 Approved Street Light LED conversion
6 Road infrastructure
 6 Road infrastructure 51 ƨƨsummary New Zealand does not score highly for its road infrastructure when compared to other developed nations. This may partly be due to geography and population size, which
Wellington $312 $49 $456 OVERVIEW WELLINGTON REGIONAL SUMMARY
 National Land Transport Programme 2015 18 Wellington WELLINGTON REGIONAL SUMMARY OVERVIEW The Wellington region is made up of a number of cities, urban areas and supporting rural hinterland. The city is
Wellington region CITY RIDES URBAN CYCLEWAYS PROGRAMME
 CITY RIDES PROGRAMME Wellington region Since 006, the number of people commuting by bike in the capital has almost doubled. In recognition of the key role that active modes, including cycling, have in
Report. Recommendation: Mayor and Councillors. To: District Engineer and Roading Manager. From: Date: 11 th April 2012
 Report To: From: Mayor and Councillors District Engineer and Roading Manager Date: 11 th April 2012 File reference: Portfolio holder: Document: 873742 Appendix A: 873811 Appendix B: 871432 Councillor Harris
Auckland Transport Quarterly Indicators Report 2018/19
 Attachment 1 Auckland Transport ly Indicators Report 218/19 September 218 Table of Contents Page 2. 1. Executive summary 2. External indicators 3. Performance by Key Priority 3.1 Deliver an efficient and
Seek the Board s approval for the Donald Place kerb and channel renewal to progress to final design, tender and construction; and
 3. DONALD PLACE - KERB AND CHANNEL RENEWAL General Manager responsible: General Manager City Environment Officer responsible: Transport and City Streets Manager Author: Michelle Flanagan, Streets Capital
WELLINGTON $422 MILLION $614 MILLION $83 MILLION 22% SPEND $1.9 BILLION
 WELLINGTON WELLINGTON $1.9 BILLION FORECAST TOTAL WELLINGTON INVESTMENT The Wellington region s transport challenges are dominated by the region s concentration of population in the metropolitan cities,
Expected from the initial 5-year funding package for State Highways (2006/07 to 2010/11) SH1, Cape Reinga SH1, Waitiki Land to Cape Reinga Stage 2*
 SH1, Cape Reinga SH1, Waitiki Land to Cape Reinga Stage 2*") KEY DELIVERABLES Expected from the initial 5-year funding package for State Highways (2006/07 to 2010/11) BUILT AND OPENED PROJECTS BUILT SH1, Cape Reinga SH1, Waitiki Land to Cape Reinga Stage 2* SH1,
KEY DELIVERABLES Expected from the initial 5-year funding package for State Highways (2006/07 to 2010/11) BUILT AND OPENED PROJECTS BUILT SH1, Cape Reinga SH1, Waitiki Land to Cape Reinga Stage 2* SH1,
Operations Committee. District Engineer and Roading Manager
 Report To: From: Operations Committee District Engineer and Roading Manager Date: 3 rd November 2014 Document: 1281760 File reference: Appendix A: 1281901 Appendix B: 1274346 Meeting date: 12 th November
Insert 3: Upper Hutt. Insert 2: Masterton
 Legend: -4 Injury Crash Sites 5 >5 Injury Crash Sites Napier Castle Wind Farm Hill Site Palmerston North SH50A Hastings SH SH Insert Masterton Insert 3 Havelock North SH Wellington Insert 1: Napier City
Project Manager: Neil Beckett. Prepared by: Gerald Wen. Reviewed by: Neil Beckett. Approved for issue by: Neil Beckett
 Traffic Volumes Monthly Report May 2009 This report has been prepared for the benefit of the NZ Transport Agency (NZTA). No liability is accepted by this company or any employee or sub-consultant of this
D L R C C T R A F F I C N E W S
 D L R C C T R A F F I C N E W S Saturday, 4 th February 2017 to Friday, 10 th February 2017 A public service provided by Municipal Services Department of Dún Laoghaire-Rathdown County Council. Listed below
REINZ figures show lowest number of properties sold for the month of December for 7 years
 17 January 2019 For immediate release REINZ figures show lowest number of properties sold for the month of December for 7 years The 2018 year ended with a fizz rather than a bang, with the lowest number
50MAX Book of Maps. North Island Wellington Region. November of 20
 50MAX Book of Maps Wellington Region November 2018 1 of 20 50MAX Book of Maps Version: November 2018 6 BSN: 305 Legend 6 State Highway 50MAX Restrictions 6 BSN: 107 6 BSN: 458 6 BSN: 225 For detailed information
Wichita Falls MPO - MTP Project List 1 of 6
 Wichita Falls MPO - MTP Project List 1 of 6 FUNDING SCHEDULE FOR WICHITA FALLS MPO 2015-2040 M TxDOT Ten-Year Plan 2016-2026 TxDOT STATE, PROJECTS (TABLE I) ESTIMATED STATUS HIGHWAY CSJ PROJECT LIMITS
HIGHWAY RAIL GRADE CROSSING CONSOLIDATION PROGRAM
 HIGHWAY RAIL GRADE CROSSING CONSOLIDATION PROGRAM To decrease unnecessary train traffic exposure to life and property, promote public safety, and improve traffic conditions, the Texas Department of Transportation
FHWA P/N Guidelines. Corridor Relationship. Highway 22 Segment 1 - US 169 to CSAH 2 Relevance / Documentation of Need
 Highway 22 Segment 1 - US 169 to CSAH 2 Vehicle Mobility Congestion Intersection Congestion Existing Conditions - Based on Highway Capacity Manual methodology, corridor level of service is currently LOS
New Zealand vehicle travel Data issues and trends. Prepared by Haobo Wang and Stuart Badger Transport Knowledge Hub seminar, November 2017
 New Zealand vehicle travel Data issues and trends Prepared by Haobo Wang and Stuart Badger Transport Knowledge Hub seminar, November 2017 Contents Background Data issues with VKT estimation Our proposed
Regional summary - Wellington
 Regional summary Wellington Regional summary - Wellington This is a summary of data relevant to transportation in this region, viewed from a Land Transport NZ perspective. It s purpose is to inform the
BUSINESS ZONE - OPTION 400 (Western footpath) Have your say. Love the Bay Delivering on the Cycleway
 Have your say. Love the Bay Delivering on the Cycleway") BUSINESS ZONE - OPTION 400 (Western footpath) Have your say Love the Bay Delivering on the Cycleway Consultation open from 31 July to 13 August 2017 1 Introduction After the Love the Bay community-based
BUSINESS ZONE - OPTION 400 (Western footpath) Have your say Love the Bay Delivering on the Cycleway Consultation open from 31 July to 13 August 2017 1 Introduction After the Love the Bay community-based
Major Scheme Business Case Summary Report for Programme Entry
 Paper A Heart of South West Local Transport Board Major Scheme Business Case Summary Report for Programme Entry M5 Junction 25, Taunton July 2016 1 SCHEME SUMMARY Scheme Name M5 Junction 25, Taunton Date
2008 DEKALB COUNTY TRANSPORTATION PLAN (UPDATE)
") 2008 DEKALB COUNTY TRANSPORTATION PLAN (UPDATE) TABLE OF CONTENTS Introduction 1 Transportation Planning Activities 2 Identification of Problem Areas and Recommended Solutions 7 DeKalb County Projects
2008 DEKALB COUNTY TRANSPORTATION PLAN (UPDATE) TABLE OF CONTENTS Introduction 1 Transportation Planning Activities 2 Identification of Problem Areas and Recommended Solutions 7 DeKalb County Projects
Prices rise in every region in New Zealand bar Auckland and Nelson leading to record price for NZ ex Auckland
 15 November 2017 For immediate release Prices rise in every region in New Zealand bar Auckland and Nelson leading to record price for NZ ex Auckland Prices rose in 14 of New Zealand s 16 regions for the
Report to: Greater Cambridge Partnership Joint Assembly 18 January A10 Foxton level crossing bypass and travel hub
 Report to: Greater Cambridge Partnership Joint Assembly 18 January 2018 Lead officer: Chris Tunstall GCP Director of Transport A10 Foxton level crossing bypass and travel hub 1. Purpose 1.1 The list of
$244 $45 OVERVIEW National Land Transport Programme Bay of Plenty BAY OF PLENTY REGIONAL SUMMARY
 2015 18 National Land Transport Programme Bay of Plenty BAY OF PLENTY REGIONAL SUMMARY OVERVIEW Transport investment in the Bay of Plenty is targeted to support significant residential growth, new industrial
LYNDHURST NEW URBAN DEVELOPMENT AREA STRUCTURE PLAN. Lyndhurst New Urban Development Area Structure Plan OUTCOMES AND PERFORMANCE STANDARDS
 APPENDIX 15.1-3 LYNDHURST NEW URBAN DEVELOPMENT AREA STRUCTURE PLAN Purpose of the Structure Plan Lyndhurst New Urban Development Area Structure Plan OUTCOMES AND PERFORMANCE STANDARDS LSP-P1 The District
Kaiwaka and Kaipara District. Council. Working in Partnership
 Kaiwaka and Kaipara District Council Working in Partnership Action Plan September 2014 2 1 Introduction Kaiwaka has been established for approximately 150 years. In recent years it has been known as the
MUNICIPALITY OF ANCHORAGE
 MUNICIPALITY OF ANCHORAGE ANCHORAGE PARKS & RECREATION Memorandum PRC 08-56 DATE: 5 August 2008 TO: FROM: SUBJECT: Parks & Recreation Commission Holly Spoth-Torres, Park Planner PRC 08-56 Far North Bicentennial
Transport Indicators Report June 2018
 Transport Indicators Report June 2018 Board Meeting 21 August 2018 Recommendation That the Board: i. Receives this report. Executive summary 1. The attached Monthly and Quarterly Indicator Reports provide
CLEM7 Project South Community Liaison Group Meeting #29
 CLEM7 Project South Community Liaison Group Meeting #29 Venue: Date: 19 May 2009 Time: Attendees: Apologies: Distribution: Leckhampton House, Shafston Avenue, Kangaroo Point 6pm CLG MEMBERS: Joy Logie,
Report on the Crafthole Traffic Light Project 3 rd July th September 2017
 Report on the Crafthole Traffic Light Project 3 rd July 2017 4 th September 2017 Brief History The village of Crafthole sits on the B3247 road, one of the 2 Gateways to the Rame Peninsula, the other being
Road Signs, Markings and Their Meaning
 Road Signs, Markings and Their Meaning FUNCTIONS OF ROAD SIGNS AND MARKINGS 1. Guides 2. Directs 3. Warns 4. Informs 5. Prohibits 6. Regulates CLASSIFICATION OF ROAD SIGNS 1. Warning 2. Regulatory 3. Informatory
29 June Eastern Region 15/16 Program Presentation
 29 June 2015 Eastern Region 15/16 Program Presentation 2972516 Content VicRoads - Our Region, Our Direction VicRoads 15/16 Statewide Program VicRoads 15/16 Regional Program Questions Eastern Region Eastern
Unravelling regional insight
 Unravelling regional insight By Steve Riley, TIA Insight Specialist (May 2017) Introduction While national-level insight provides a clear picture of how the tourism industry performs in New Zealand, a
Risk Maps. Risk Maps how the sections were identified
 2007-2011 Risk Maps Risk Maps how the sections were identified For the purpose of comparing the level of risk of crashes between different parts of the network, the state highway network was broken up
Welcome to the Illinois High-Speed Rail Chicago to St. Louis Construction Update Meeting. Today s meeting will provide an overview of the Program,
 Welcome to the Illinois High-Speed Rail Chicago to St. Louis Construction Update Meeting. Today s meeting will provide an overview of the Program, updates on construction to be held in this area, and how
THE NORTHERN CORRIDOR IMPROVEMENTS PROJECT
 THE NORTHERN CORRIDOR IMPROVEMENTS PROJECT The Northern Corridor Improvements Project is the last link in the Western Ring Route, connecting the north with the west long SH1 and SH18. Major benefits of
Highway Operational Standards
 Highway Operational Standards 2018-2028 April 2018 cambridgeshire.gov.uk Cambridgeshire County Council s Highway Operational Standards CONTENTS Section Pages 1. Introduction 1 2. Asset Descriptions 3 3.
ADDENDUM 2 APPENDIX D STANDARD DRAWINGS
 ADDENDUM 2 APPENDIX D STANDARD DRAWINGS Overview This Addendum to Appendix D Standard Drawings replaces Standard Drawing Figures 001 to 020 with new Standard Drawings EDCM 301 to EDCM 704 - as listed below.
Community Advisory Panel Meeting #
 Community Advisory Panel Meeting # 6 02.13.19.. Agenda Welcome and Introductions Community Conversations City Council Meeting Debrief Review Citywide Tunnel Video (North Portal Only) Churchill Pedestrian
Att. A, AI 46, 11/9/17
 Total s San Diego Metropolitan Transit System POLICY 42 PERFORMANCE MONITORING REPORT Page 1 of 6 Date: 11/8/17 OBJECTIVE Develop a Customer-Focused and Competitive System The following measures of productivity
Rangitikei District Council
 Rangitikei District Council Assets/Infrastructure Committee Meeting Order Paper Thursday 14 July 016 9:30 a.m. Contents 1 3 4 Welcome Council Prayer Apologies/Leave of absence Confirmation of Order of
ROADWAY INVENTORY. The biggest and badest
 ROADWAY INVENTORY The biggest and badest Thanks in Advance for your Attention THE CONFERENCE 2 Presentation Overview Roadway Inventory Purpose Extent Structure Content Maintenance Use Availability Challenges
Appendix 6 Fulbourn Greenway Review
 Appendix 6 Fulbourn Greenway Review Nigel Brigham & Associates A report for 1 Introduction This report is based on fieldwork carried out in 2016 to review the Greenway network around Cambridge as shown
Michigan s Engineering Safety Program for Local Roadways
 Michigan s Engineering Safety Program for Local Roadways Local Road Safety Peer Exchange October 2018 Timothy J. Gates, Ph.D., P.E., P.T.O.E. Michigan State University Andrew Ceifetz, P.E. WSP For More
1. Case Study Area and Character Sections
 ARAGO STREET 1. Case Study Area and Character Sections Case Study Area Calle Aragó is an important streets in the centre of Barcelona. The street belongs to the Eixample district. The origins of Barcelona
SOUTH GLOS COUNCIL UPDATE FOR SUSCOM - JANUARY 2016
 SOUTH GLOS COUNCIL UPDATE FOR SUSCOM - JANUARY 2016 Go Ultra Low City Bid Success Announced on Monday 25 January, the Department for Transport (DfT) allocated 7M to the four West of England authorities
Appendix 9 Melbourn Greenway Review
 Appendix 9 Melbourn Greenway Review Nigel Brigham & Associates A report for 1 Introduction This report is based on fieldwork carried out in 2016 to review the Greenway network around Cambridge as shown
TRAFFIC CONTROL DEVICES MANUAL FOR WORK ZONES
 TRAFFIC CONTROL DEVICES MANUAL FOR WORK ZONES SUMMARY Work zone activities often create conditions on the travelled way that are hazardous particularly at night when the ability of motorists to see is
Culpeper District. Albemarle County Monthly Report. September 2012
 Culpeper District Albemarle County Monthly Report September 2012 Special Issues Bridges on Route 745, Arrowhead Valley Road The road will be closed at the Rail Road Bridge on the southern end of the road
PAVEMENT CONDITION REPORT
 PAVEMENT CONDITION REPORT Department of Facility Maintenance December 2012 TABLE OF CONTENTS Executive Summary...1 Figure 1. Inputs to Pavement Condition Index...1 Figure 2. Summary Oahu Pavement Condition
MEMORANDUM OF UNDERSTANDING WITH BUSINESS IMPROVEMENT DISTRICTS WITHIN BIRMINGHAM
 MEMORANDUM OF UNDERSTANDING WITH BUSINESS IMPROVEMENT DISTRICTS WITHIN BIRMINGHAM For services in respect of: Highway Maintenance and Management Car Parking Traffic Management Signatories: For Birmingham
Presentation to the British Irish Airport s EXPO John Heffernan Chief Development Officer, Dublin Airport
 Presentation to the British Irish Airport s EXPO John Heffernan Chief Development Officer, Dublin Airport 1 DUBLIN-LONDON 28.4 No.1 +2,200 MILLION PASSENGERS BUSIEST ROUTE IN EUROPE &No. 2 IN THE WORLD
District Construction Progr am. John R. Kasich, Ohio Governor Jerry Wray, ODOT Director Steve Mary, P.E., District Deputy Director
 District 8 2014 Construction Progr am Preble Greene Butler Warren Clinton Lebanon Hamilton Clermont Serving Butler, Clermont, Clinton, Greene, Hamilton, Preble and Warren Counties. John R. Kasich, Ohio
Rangitīkei District Council
 Rangitīkei District Council Assets and Infrastructure Committee Meeting Agenda Thursday 9 August 2018 9:30 AM Contents 1 Welcome...3 2 Council Prayer...3 3 Apologies/leave of Absence...3 4 Members conflict
Mayor and Councillors. District Engineer and Roading Manager. Councillor Harris
 Report To: From: Mayor and Councillors District Engineer and Roading Manager Date: 1 st February 2011 File reference: Document: 690387 Portfolio holder: Councillor Harris Meeting date: 9 th February 2011
A. From I-68 in Monongalia County, West Virginia to SR 6119 in Fayette County, Pennsylvania 1
 Mon-Fayette Transportation Project A. From I-68 in Monongalia County, West Virginia to SR 6119 in Fayette County, Pennsylvania 1 The Mon/Fayette Transportation Project (MFTP) from I-68 in West Virginia
Date: 11/6/15. Total Passengers
 Total San Diego Metropolitan Transit System POLICY 42 PERFORMANCE MONITORING REPORT Page 1 of 6 OBJECTIVE Develop a Customer-Focused and Competitive System The following measures of productivity and service
D L R C C T R A F F I C N E W S
 D L R C C T R A F F I C N E W S Saturday, 24 th June 2017 to Friday, 30 th June 2017 A public service provided by Municipal Services Department of Dún Laoghaire-Rathdown County Council. Listed below are
Ermine Street Environmental Enhancements
 Ermine Street Environmental Enhancements As part of Urban&Civic s commitment to minimise the impacts and maximise the benefits of the Alconbury Weald development, the design team have worked up a scheme
FY TIP Fiscal Constraint 2017 Total Commitments. agencies (the Michigan Department of programmed in the Kalamazoo Area
 KALAMAZOO AREA TRANSPORTATION STUDY FY 2017-2020 TRANSPORTATION IMPROVEMENT PROGRAM MARCH 2019 AMENDMENTS The program is developed using the continuing, What is the TIP? cooperative, and comprehensive
Christ Church Grammar School, Claremont
 Christ Church Grammar School, Claremont TRAFFIC MANAGEMENT AND TRANSPORT PLAN Prepared for CHRIST CHURCH GRAMMAR SCHOOL Prepared by Uloth and Associates 11 Sep 2014; Updated 17 Aug 2015; 29 July 2016,
Auckland Transport - Transport Indicators Report June 2013
 Thousands Auckland Transport Transport Indicators Report June 213 Economic Indicators 5 4 3 2 1 % 1 2 3 4 9 8 3 2 1 Auckland Economic Activity Composite index of Economic Activity Auckland Source : ANZ
Launceston and Tamar Valley Traffic Vision
 Launceston and Tamar Valley Traffic Vision A MAJORITY LIBERAL GOVERNMENT WILL: Address growing congestion issues in the Launceston and Tamar Valley road network Provide high productivity freight movement
Speed control humps - Scotland, England and Wales
 Traffic Advisory Leaflet 3/91 September 1991 Speed control humps - Scotland, England and Wales Introduction Road humps are an extremely effective means of keeping vehicle speeds low. The standard round
Transit s forecasts of expenditure in Waikato for the next 10 years are set out in Table WK1.
 WAIKATO STATE HIGHWAY PLAN EXECUTIVE SUMMARY Transit s forecasts of expenditure in Waikato for the next 10 years are set out in Table WK1. These forecasts of expenditure are based on a 10-year plan of
Commercial Accommodation Monitor: April 2017
 Commercial Accommodation Monitor: April 2017 Hawke s Bay i Reproduction of material Material in this report may be reproduced and published, provided that it does not purport to be published under government
ACORNS PROJECTS LIMITED
 ACORNS PROJECTS LIMITED A4 London Road, M4 J5 to Sutton Lane, Slough, Berkshire Combined Stage 1 and 2 Road Safety Audit For Slough Borough Council Prepared by Acorns Projects Limited Safety Traffic Project
Modelled Territorial Authority Gross Domestic Product (MTAGDP)
") RESEARCH EVALUATION ANALYTICS UNCLASSIFIED Modelled Territorial Authority Gross Domestic Product (MTAGDP) 2018 Methodology Table of Contents 1. Summary... 3 1.1 Caveats and disclaimers... 3 2. Methodology...
RESEARCH EVALUATION ANALYTICS UNCLASSIFIED Modelled Territorial Authority Gross Domestic Product (MTAGDP) 2018 Methodology Table of Contents 1. Summary... 3 1.1 Caveats and disclaimers... 3 2. Methodology...
Have your say on Let s Get Wellington Moving PUBLIC FEEDBACK IS OPEN UNTIL FRIDAY 15 DECEMBER 2017
 Have your say on Let s Get Wellington Moving PUBLIC FEEDBACK IS OPEN UNTIL FRIDAY 15 DECEMBER 2017 Getting Wellington moving Let s Get Wellington Moving is a joint initiative between Wellington City Council,
Committee. Presentation Outline
 CW-33-15 11/9/2015 Community and Corporate Services Committee November 10, 2015 1 Presentation Outline Background Vision and Objectives Study Process and Timeline Public and Stakeholder Engagement Organization
Smart Motorways Programme
 Smart Motorways Programme M27 Junction 4 to 11 Smart Motorway Response to Statutory Instrument Consultation The introduction of variable mandatory speed limits July 2018 Contents Executive Summary 3 1.
Quiet Zone Process. Background:
 Background: In order to reduce the impact of train horns on municipalities, the FRA (Federal Railroad Administration) has provided communities with the option to establish a QZ (Quiet Zone). A quiet zone
Manawatu Gorge update 2 December
 Manawatu Gorge update 2 December It s been another full-on week at the gorge. Observation tracks have been made, survey points (nails) have been set, tree felling and scrub clearing is done and the benching
Parking Amendments - Bay Street, between Harbour Street and Queens Quay West (York Street, Bay Street, and Yonge Street Ramp Removal)
") REPORT FOR ACTION between Harbour Street and Queens Quay West (York Street, Bay Street, and Yonge Street Ramp Removal) Date: October 26, 2017 To: Toronto and East York Community Council From: Acting Director,
REPORT FOR ACTION between Harbour Street and Queens Quay West (York Street, Bay Street, and Yonge Street Ramp Removal) Date: October 26, 2017 To: Toronto and East York Community Council From: Acting Director,
State Route 8 Corridor. Northern Summit County s Path to Success
 State Route 8 Corridor Northern Summit County s Path to Success Construction Guide: 2008-2009 State Route 8 corridor work description State Route 8 Corridor 10 projects $262 million With its close proximity
1 PROJECT STATUS UPDATE 2 ND CONCESSION FROM BRISTOL ROAD TO DOANE ROAD TOWNS OF EAST GWILLIMBURY AND NEWMARKET
 Report No. 3 of the Regional Council Meeting of March 28, 2013 1 PROJECT STATUS UPDATE 2 ND CONCESSION FROM BRISTOL ROAD TO DOANE ROAD TOWNS OF EAST GWILLIMBURY AND NEWMARKET The recommends: 1. Receipt
50MAX Book of Maps. North Island Bay of Plenty Region. March of 18
 50MAX Book of Maps North Island Bay of Plenty Region March 2019 1 of 18 50MAX Book of Maps Version: March 2019 North Island North Island BSN: 305 Legend State Highway 50MAX Restrictions BSN: 458 BSN: 225
REGIONAL TRANSPORT COMMITTEE
 REGIONAL TRANSPORT COMMITTEE Report of the Regional Transport Committee of the Waikato Regional Council held in the Council Chamber, Waikato Regional Council Office, 401 Grey Street Hamilton East at 9.32
GISBORNE DISTRICT COUNCIL BUSINESS CASE PROPOSAL. Eastland Port Access. Pedestrian Safety Rakaiatane Rd. Page 1 of 4
 GISBORNE DISTRICT COUNCIL BUSINESS CASE PROPOSAL Eastland Port Access Pedestrian Safety Rakaiatane Rd Page 1 of 4 Introduction This proposal has been developed by Gisborne District Council (GDC) to provide
United States Department of the Interior National Park Service. Boundary Expansion Listed in National Register January 11, 2017
 NPS Form 10900-a (Rev. 8/2002) OMB No. 10240018 United States Department of the Interior National Park Service Boundary Expansion Listed in National Register January 11, 2017 National Register of Historic
Trail # NW Tuesday, June DESIGN. Provide an Review the Provide an. Project Goals: System system. wayfinding
 I. Welcome / Introductions Bethany Creek Trail #2 Segment 3 Neighborhood Meeting #1 Bethany Presbyterian Church 15505 NW Springville Road, Portland, OR 97229 Tuesday, June 26, 2018 @ 6:00PM Meeting Minutes
PERTH-ADELAIDE CORRIDOR STRATEGY
 INTRODUCTION The Royal Automobile Association of SA Inc (RAA), the State s principal advocate for motorists on a broad range of motoring-related issues, represents the views of more than 560,000 South
ATVANS Trail Assessment for Five Bridge Lakes Wilderness Area Report and Recommendation. December 28, Prepared by.
 ATVANS Trail Assessment for Five Bridge Lakes Wilderness Area Report and Recommendation December 28, 2011 Prepared by Peter Bush Background This report documents the results and recommendations of an all-terrain
Whether travelling on two wheels or two feet, we help communities stay active and sustainable.
 Creating pathways Whether travelling on two wheels or two feet, we help communities stay active and sustainable. Stantec is a local leader in providing cycleway expertise to clients throughout New Zealand.
Other Principle Arterials Minor Arterial Major Collector Minor Collector Local
 CHAPTER 10 TRANSPORTATION Introduction The system of public roads in East Pikeland Township is decidedly rural in character. Since the 1984, the road network has remained much the same, with the addition
Concessions and Permits
 Concessions and Permits ot og ers op e rato rs speci roups ri d ers tg se re s ur ph a r ph h ts to st u d e n es church or ike clubs film b m n orie a ai nt ee te n i al event orga ools n i s er sch s
Town Centre Improvements Plan
 Phase 1 Experience Barnsley External Works Phase 1 Town Hall Open Space Lancaster Gate side of Town Hall Shambles Street Footway and Kerbing North Side (St Mary s Place to Church street) St Mary s Place
CONFIRMED BENCHMARKS UPDATED JUNE 26, 1991
 CONFIRMED BENCHMARKS UPDATED JUNE 26, 1991 1. Chiseled square on southwest side of street light base, in median of Gus Thomasson Rd., 40' northeast of centerline of Jamaica Way. Elevation: 536.49 2. Chiseled
Annual Listing of Federally Obligated Projects in Santa Barbara County Federal Fiscal Year (October 1, 2014 to September 30, 2015)
") Annual Listing of Federally Obligated Projects in County Federal Fiscal Year 2015 (October 1, 2014 to September 30, 2015) Annual List of Projects with Federal Funding for Federal Fiscal Year 2015 Federal
Annual Listing of Federally Obligated Projects in County Federal Fiscal Year 2015 (October 1, 2014 to September 30, 2015) Annual List of Projects with Federal Funding for Federal Fiscal Year 2015 Federal
Appendix 8: Coding of Interchanges for PTSS
 FILE NOTE DATE 23 October 2012 AUTHOR SUBJECT Geoffrey Cornelis Appendix 8: Coding of Interchanges for PTSS 1. Introduction This notes details a proposed approach to improve the representation in WTSM
Current Amendment or Modification. Prior Amendment or Modification. All other Amendments and Modifications
 Individual HIGHWAYS Bridge - On State System SR46598 P-4 Region 4 Bridge - On System Pool CDOT Region 4 Bridge Federal National Highway Performance Program - - 956 483 719 719 2,877 State State Highway
BOARD OF SUPERVISORS AND VIRGINIA DEPARTMENT OF TRANSPORTATION JOINT PUBLIC HEARING
 BOARD OF SUPERVISORS AND VIRGINIA DEPARTMENT OF TRANSPORTATION JOINT PUBLIC HEARING Date of Hearing: September 14, 2016 #1 SUBJECT: ELECTION DISTRICT: Proposed FY2017-FY2022 Secondary Road Six-Year Plan
Next Generation Cycleway Design. Improving connectivity and cycling behaviours through design
 Next Generation Cycleway Design Improving connectivity and cycling behaviours through design Safe segregation between Place Users to offer improved safety and a defined space for each user group Elevated
NZ price index relative to peak
 Media release 7 April, 2014 Residential property value growth plateaus The latest monthly property value index shows that nationwide residential values for March have increased 8.8% over the past year,
NZ population projections through to For SARINZ. By: Gordon Cessford & Bronek Kazmierow B Kazmierow Recreation and Tourism Consulting
 NZ population projections through to 2030 For SARINZ By: Gordon Cessford & Bronek Kazmierow B Kazmierow Recreation and Tourism Consulting Origins Sponsors: SARINZ NZ Oil and Gas Supporters - SARINZ stakeholders
Values increasing throughout most of the country. NZ price index relative to peak
 Media release 11 th February Values increasing throughout most of the country The latest monthly property value index shows that nationwide residential values increased further in January. Values are up
Response to the London Heathrow Airport Expansion Public Consultation
 Response to the London Heathrow Airport Expansion Public Consultation Summary This report sets out the response to the Heathrow Airport s consultation on airport expansion and airspace change. The consultation