REINZ figures show lowest number of properties sold for the month of December for 7 years
|
|
|
- Geraldine Douglas
- 5 years ago
- Views:
Transcription
, source of the most complete and")
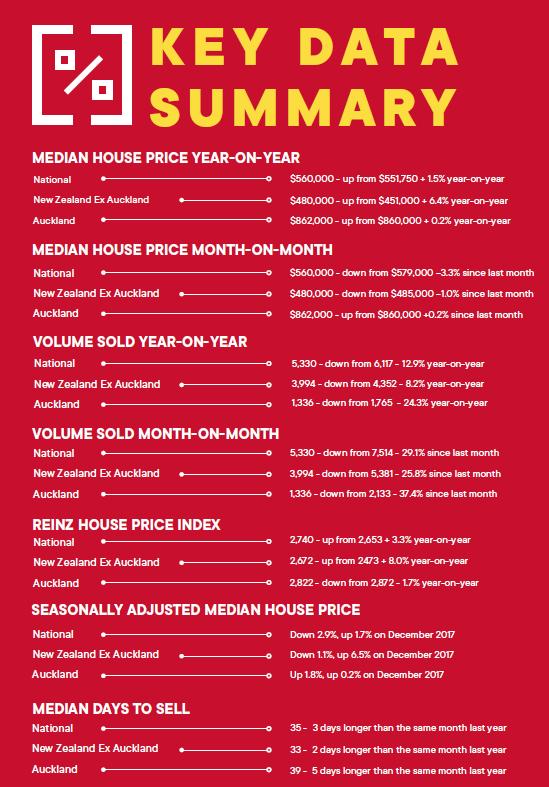
1 17 January 2019 For immediate release REINZ figures show lowest number of properties sold for the month of December for 7 years The 2018 year ended with a fizz rather than a bang, with the lowest number of residential properties sold for the month of December for 7 years, according to the latest data from the Real Estate Institute of New Zealand (REINZ), source of the most complete and accurate real estate data in New Zealand. In December 2018, the number of houses sold across New Zealand decreased by -12.9% year-onyear to 5,330, down from 6, fewer houses. For New Zealand excluding Auckland, the number of properties sold decreased by -8.2% when compared to December 2017, from 4,352 down to 3, fewer houses and the lowest for the month of December in 5 years. In Auckland, the number of properties sold decreased by -24.3% year-on-year and was the lowest for the month of December in 10 years. Bindi Norwell, Chief Executive at REINZ says: While December is usually a quiet month as people focus on Christmas holidays, December 2018 was extremely quiet with the lowest number of properties sold for the month of December for seven years. Additionally, 12 out of 16 regions saw an annual decrease in the number of properties sold. With national listing levels down -11.3% in November and -13.3% in December, it s not entirely surprising that December was a quiet month in terms of sales volumes. However, what we re hearing is that part of the lower sales volumes can also be attributed to some vendors understanding of the value of their home. A realistic approach to market value may help vendors sell their property in a more reasonable timeframe, points out Norwell. Regions with the largest annual fall in volumes were: Auckland: -24.3% (from 1,765 to 1, fewer houses) Taranaki: -23.0% (from 161 to fewer houses) the lowest for the month of December since December 2013 Wellington: -16.2% (from 792 to fewer houses) Otago: -14.6% (from 391 to fewer houses) Southland: -13.4% (from 142 to fewer houses) the lowest since April However, there were some regions that saw an annual increase in sales volumes during December including: West Coast: +42.9% (from 28 to 40 an additional 12 houses) Tasman: +29.4% (from 51 to 66 an additional 15 houses) Gisborne: +15.2% (from 46 to 53 an additional 7 houses)
2 Hawke s Bay: +7.2% (from 195 to 209 an additional 14 houses). Clean sweep for regional house price rises December saw the national median increase by 1.5% from $551,750 in December 2017 to $560,000 in December Prices for New Zealand excluding Auckland increased by 6.4% to $480,000 up from $451,000 in December In Auckland, prices rose by 0.2% to $862,000 up from $860,000 in December Only one region experienced a record median price the Bay of Plenty with a 2.0% increase taking the median to $610,000 up from $598,000 in December Whilst the Bay of Plenty was the only region with a record median price achieved in December, in actual fact it was a strong month from a price perspective as every region in New Zealand saw an annual increase in the median price. The last time all regions saw annual price increases was back in June 2017, says Norwell. Additionally, Auckland finished the year in a strong position with the highest price for the region in 9 months at $862,000. Breaking the region down, Auckland City saw an annual increase of 7.8% resulting in the highest median price for the City in six months at $986,000 and Waitakere City had a 6.2% increase to record median price of $828,000. However, on the flip side, North Shore City median prices fell -11.6% to $980,000 and Franklin District saw a fall of -4.2% to $680,000, continues Norwell. REINZ House Price Index (HPI) The REINZ House Price Index for New Zealand, which measures the changing value of property in the market, increased 3.3% year-on-year to 2,740. The HPI for New Zealand excluding Auckland increased 8.0% from December 2017 to a new record high of 2,672. The Auckland HPI decreased -1.7% year-on-year to 2,822. The REINZ HPI again saw 11 out of 12 regions experience an increase over the past 12 months, highlighting the continued strength of the property market. The only exception was Auckland. In December the Manawatu/Wanganui region again had the highest annual growth rate, a 17.7% increase to a new record high of 2,867, followed by Gisborne/Hawke s Bay in second place with an annual growth rate of 13.7% to a new record high of 2,654 and in third place was Otago with a 12.4% annual increase to a new record high of 2,867. Last month we noted that Waikato s index had overtaken Auckland s index, the first time Auckland s index had been overtaken since March However, December has seen another three regions join Waikato in overtaking Auckland s index Manawatu/Wanganui, Taranaki and Otago. Days to Sell The median number of days to sell a property nationally increased by 3 days from 32 to 35 when compared to December last year. For New Zealand excluding Auckland, the median days to sell increased on an annual basis by 2 days from 31 to 33. Auckland saw the median number of days to sell a property increase by 5 days from 34 to 39 the highest days to sell for the month of December since December 2001.
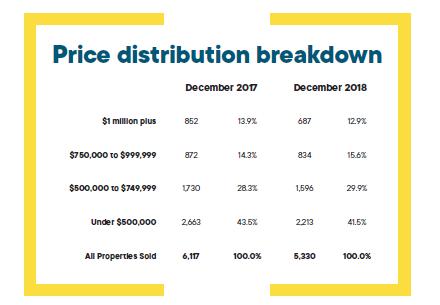
3 For the sixth month in a row, Southland has the lowest days to sell of all regions at 23 days, down from 27 at the same time last year. Auctions Auctions were used in 11.0% of all sales across the country in December, with 584 properties selling under the hammer this is down from the same time last year, when 13.7% of properties (836) were sold via auction. This is the lowest percentage of auctions for 11 months. For the eleventh month in a row, Gisborne had the highest percentage of auctions across the country with 35.8% (or 19 properties) in the region sold under the hammer up from 32.6% (15 properties) in December Auckland saw the second largest percentage of auctions on 19.5% (260 properties) down from 26.2% in December 2017 (462 properties). The Bay of Plenty maintained its spot of having the third highest level of auctions in the country with 15.1% (61 properties) sold under the hammer, down from 18.4% (80 properties) for the same period last year. Inventory The number of properties available for sale nationally decreased by -1.8% from 24,610 to 24,158 a decrease of 452 properties compared to 12 months ago. The is the largest decrease in 5 months. December again saw 7 regions with an annual increase in inventory levels. Regions with the largest increase were: Marlborough: +9.9% from 333 to 366 an additional 33 properties Taranaki: +7.6% from 603 to 649 an additional 46 properties Northland: +7.5% from 1,338 to 1,439 an additional 101 properties. Regions with the biggest falls in inventory were: Gisborne: -48.1% from 160 to fewer properties Otago: -33.3% from 676 to fewer properties Manawatu/Wanganui: -24.4% from 1,088 to fewer properties. Gisborne has the lowest level of inventory with only 5 weeks inventory the lowest level ever seen on record, followed by Wellington with only 6 week s inventory the lowest level of inventory since October Otago and Hawke s Bay both only have 8 weeks inventory available to prospective purchasers. Inventory levels are a real concern at the moment for the industry, particularly with Gisborne having the lowest level of inventory any region has ever had since REINZ began keeping inventory records back in January In December, Gisborne only had 83 properties available for sale. If no new listings came onto the market in January, in roughly 5 weeks time there will be no properties for sale at all which will further drive up prices in the area, concludes Norwell. Price Bands The number of homes sold for less than $500,000 across New Zealand fell from 43.5% of the market (2,663 properties) in December 2017 to 41.5% of the market (2,213 properties) in December The number of properties sold in the $500,000 to $750,000 bracket increased from 28.3% in December 2017 (1,730 properties) to 29.9% in December 2018 (1,596 properties).
4 At the top end of the market, properties sold for more than $1 million decreased from 13.9% in December 2017 (852 houses) to 12.9% in December 2018 (687 houses). ENDS Notes to Editors The monthly REINZ residential sales reports remain the most recent, complete and accurate statistics on house prices and sales in New Zealand. They are based on actual sales reported by real estate agents. These sales are taken as of the date that a transaction becomes unconditional, up to 5:00pm on the last business day of the month. Other surveys of the residential property market are based on information from Territorial Authorities regarding settlement and the receipt of documents by the relevant Territorial Authority from a solicitor. As such, this information involves a lag of four to six weeks before the sale is recorded. For further information, please contact Dee Crooks, Head of Communications at REINZ, on
5
6
7
8 House Price Index Index From Level Month Months Year Year* Peak New Zealand % 0.1% 3.3% 8.6% -0.5% NZ excl. Auckland % 2.2% 8.0% 8.6% New High Northland % -1.5% 8.4% 11.5% -1.6% Auckland % -2.3% -1.7% 8.6% -3.0% Waikato % 2.8% 6.4% 11.2% -0.1% Bay of Plenty % 1.9% 8.0% 12.0% New High Gisborne/Hawke's Bay % 2.5% 13.7% 11.6% New High Manawatu-Wanganui % 3.0% 17.7% 9.9% New High Taranaki % 4.9% 5.7% 5.7% -0.4% Wellington % 2.9% 10.2% 9.8% New High Tasman/Nelson/Marlborough/ % 2.9% 7.0% 8.0% New High West Coast Canterbury % 1.2% 1.3% 2.2% -1.0% Otago % 1.8% 12.4% 11.2% New High Southland % 3.0% 11.9% 8.5% New High Source: REINZ * = Compound Growth Rate
Prices rise in every region in New Zealand bar Auckland and Nelson leading to record price for NZ ex Auckland
 15 November 2017 For immediate release Prices rise in every region in New Zealand bar Auckland and Nelson leading to record price for NZ ex Auckland Prices rose in 14 of New Zealand s 16 regions for the
Autumn Provides Few Falls For Real Estate Market
 News Release 11 May 2011 Autumn Provides Few Falls For Real Estate Market The national housing market recorded a lift in volumes during the month of April, with the seasonally adjusted number of sales
NZ price index relative to peak
 Media release 7 April, 2014 Residential property value growth plateaus The latest monthly property value index shows that nationwide residential values for March have increased 8.8% over the past year,
Quick quarterly statistics
 Issue 21 tember 218 Quick quarterly statistics page 1 Economic activity quarterly page 2 Employment quarterly page 3 Household welfare quarterly page 4 Tourism activity annual page 5 Spotlight Cruise ship
Auckland Median Price. Auckland Region Sales Volumes Past 5 Years. REINZ Auckland Region Analysis for March Past 5 Years.
 39202 39202 REINZ Auckland Region Analysis for March 2012 Commentary Sales volume in the Auckland region increased by more than 37% compared with February 2012, with North Shore City and Auckland City
Regional delivery in the ITP sector
 Regional delivery in the ITP sector This document provides an overview of the institutes of technology and polytechnics (ITP) sector delivery by region, and highlights key changes since 212. Number of
Values increasing throughout most of the country. NZ price index relative to peak
 Media release 11 th February Values increasing throughout most of the country The latest monthly property value index shows that nationwide residential values increased further in January. Values are up
NZ price index relative to peak
 Media release 10 February Property value growth rate slows The latest monthly property value index shows that nationwide residential values for January have increased 9.6% over the past year, and 2.2 over
Unravelling regional insight
 Unravelling regional insight By Steve Riley, TIA Insight Specialist (May 2017) Introduction While national-level insight provides a clear picture of how the tourism industry performs in New Zealand, a
6 Road infrastructure
 6 Road infrastructure 51 ƨƨsummary New Zealand does not score highly for its road infrastructure when compared to other developed nations. This may partly be due to geography and population size, which
New Zealand vehicle travel Data issues and trends. Prepared by Haobo Wang and Stuart Badger Transport Knowledge Hub seminar, November 2017
 New Zealand vehicle travel Data issues and trends Prepared by Haobo Wang and Stuart Badger Transport Knowledge Hub seminar, November 2017 Contents Background Data issues with VKT estimation Our proposed
Netball NZ U17 Champs 2016 Draw Monday 18 th Thursday 21 st July 2016 North Canterbury Netball Centre, Rangiora
 Monday 18 th Thursday 21 st July 2016 North Canterbury Netball Centre, Rangiora Pools Pool A Zone Pool B Zone Pool C Zone Pool D Auckland 1 N Wellington (A) Black C Waitakere 1 N Dunedin S North Canterbury
Air travel projections for the Transport Outlook An overview. Haobo Wang, Ministry of Transport
 Air travel projections for the Transport Outlook An overview Haobo Wang, Ministry of Transport Four projection models for air transport Domestic O&D based regional air passenger flows (Number of domestic
NZ population projections through to For SARINZ. By: Gordon Cessford & Bronek Kazmierow B Kazmierow Recreation and Tourism Consulting
 NZ population projections through to 2030 For SARINZ By: Gordon Cessford & Bronek Kazmierow B Kazmierow Recreation and Tourism Consulting Origins Sponsors: SARINZ NZ Oil and Gas Supporters - SARINZ stakeholders
NZ price index relative to peak
 Media release 13 th March 2012 Nationwide values continue to increase Nationwide residential property values have continued to gradually increase according to the QV index for February. Values are up 1.1%
 . Hawke's Bay RTO Area Monthly Guest Nights 200 Guest nights (000) 2013/14 2014/15 2015/16 150 100 50 0 A M J J A S O N D J F M Source: Statistics New Zealand Hawke's Bay RTO Area Monthly Guest Nights
TOURISM NEW ZEALAND OUR VISITORS UNDERSTANDING HISTORIC VIEW TOTAL ARRIVALS YE JUNE 2016
 TOURISM JAPAN 94K NEW ZEALAND UNDERSTANDING OUR VISITORS GERMANY 91K CHINA 397K 1 UK 214K 7% USA 258K 8% Our market infographics are drawn from two different sources. HISTORIC VIEW: Past Visitor Research
 Northland RTO Area Monthly Guest Nights 400 300 Guest nights (000) 2013 2014 2015 200 100 0 J F M A M J J A S O N D Source: Statistics New Zealand 40 30 20 Percent Northland RTO Area Monthly Guest Nights
The Current State of Enforcement under the RMA
 The Current State of Enforcement under the RMA Karenza de Silva, Environmental Lawyer Environmental Law Conference, 2 March 218, Thomson Reuters New Zealand The To pass a law and not have it enforced is
NEW ZEALAND REGIONAL TOURISM FORECASTS
 NEW ZEALAND REGIONAL TOURISM FORECASTS 21-216 NELSON RTO AUGUST 21 www.tourismresearch.govt.nz Tourism Strategy Group Ministry of Economic Development Contents Introduction 1 1. Summary for Nelson RTO
NEW ZEALAND REGIONAL TOURISM FORECASTS
 NEW ZEALAND REGIONAL TOURISM FORECASTS 21-216 LAKE TAUPO RTO AUGUST 21 www.tourismresearch.govt.nz Tourism Strategy Group Ministry of Economic Development Contents Introduction 1 1. Summary for Lake Taupo
NEW ZEALAND REGIONAL TOURISM FORECASTS
 NEW ZEALAND REGIONAL TOURISM FORECASTS 21-216 ROTORUA RTO AUGUST 21 www.tourismresearch.govt.nz Tourism Strategy Group Ministry of Economic Development Contents Introduction 1 1. Summary for Rotorua RTO
NEW ZEALAND REGIONAL TOURISM FORECASTS
 NEW ZEALAND REGIONAL TOURISM FORECASTS 21-216 QUEENSTOWN RTO AUGUST 21 www.tourismresearch.govt.nz Tourism Strategy Group Ministry of Economic Development Contents Introduction 1 1. Summary for Queenstown
Subnational Population Estimates
 Image description. Hot Off The Press. End of image description. Embargoed until 10:45am 20 October 2006 Subnational Population Estimates At 30 June 2006 Highlights The population growth of both the North
36% 64% 57% 43% Base: Total Sample - Excluding Residents (n=2,433) Base: Total Sample (n=2,480)
 Base: Total Sample (n=2,480)") Angus & Associates Ltd. 2017 The majority of the domestic travel market (87%) have visited, with one in four having visited within the past 12 months. Unsurprisingly, attracts a high proportion of visitors
Angus & Associates Ltd. 2017 The majority of the domestic travel market (87%) have visited, with one in four having visited within the past 12 months. Unsurprisingly, attracts a high proportion of visitors
Commercial Accommodation Monitor: April 2017
 Commercial Accommodation Monitor: April 2017 Hawke s Bay i Reproduction of material Material in this report may be reproduced and published, provided that it does not purport to be published under government
Common Assessment Task
 Common Assessment Task Unit Standard 24731 Demonstrate knowledge of destination New Zealand Level: 2 Credit: 4 Version: 2 School: Student Name: Date of Assessment: Demonstrate knowledge of destination
Freight Movements in the Upper North Island
 Freight Movements in the Upper North Island Presentation 4 September 2009 Freight Key driver supporting economic growth Planning and management of freight Good information Role of NFDS Current patterns
Commercial Accommodation Monitor: October 2017
 Commercial Accommodation Monitor: October 2017 Hawke s Bay i Reproduction of material Material in this report may be reproduced and published, provided that it does not purport to be published under government
Project Manager: Neil Beckett. Prepared by: Gerald Wen. Reviewed by: Neil Beckett. Approved for issue by: Neil Beckett
 Traffic Volumes Monthly Report May 2009 This report has been prepared for the benefit of the NZ Transport Agency (NZTA). No liability is accepted by this company or any employee or sub-consultant of this
Megan Williams & Lynn Robinson Sustainability Advocates
 Megan Williams & Lynn Robinson Sustainability Advocates Why care about Sustainability Who s signed up? 700 No. signups 600 500 400 300 200 100 0 Who s signed up? - RTOs Auckland Tourism, Events and
Commercial Accommodation Monitor: December 2017
 Commercial Accommodation Monitor: December 2017 Queenstown i Reproduction of material Material in this report may be reproduced and published, provided that it does not purport to be published under government
AUCKLAND DESTINATION OVERVIEW
 AUCKLAND DESTINATION OVERVIEW AUGUST 218 An in-depth overview of Auckland s visitor economy from the latest arrival, accommodation, spend and cruise data through to past five- commentary. Prepared September
Castlepoint, Wararapa. newzealand.com. japan. Market information about our Visitors and our Active Considerers
 Castlepoint, Wararapa japan Market information about our Visitors and our Active Considerers newzealand.com PAST VISITORS HISTORIC VIEW TOTAL ARRIVALS YE SEPTEMBER 2017 CHINA 408K 1 JAPAN 102K UK 246K
Risk Maps. Risk Maps how the sections were identified
 2007-2011 Risk Maps Risk Maps how the sections were identified For the purpose of comparing the level of risk of crashes between different parts of the network, the state highway network was broken up
AUCKLAND DESTINATION OVERVIEW
 AUCKLAND DESTINATION OVERVIEW September 218 An in-depth overview of Auckland s visitor economy from the latest arrival, accommodation, spend, cruise and event data through to past five- commentary. Prepared
AUCKLAND DESTINATION OVERVIEW
 AUCKLAND DESTINATION OVERVIEW JUNE 218 An in-depth overview of Auckland s visitor economy from the latest arrival, accommodation, spend and cruise data through to past five-year commentary. Prepared July
NEW ZEALAND TRENDS IN PROPERTY AND CONSTRUCTION MARCH 2010
 NEW ZEALAND TRENDS IN PROPERTY AND CONSTRUCTION MARCH 2010 OFFICES AROUND THE WORLD 1300 ASK RLB (Aust.) 0508 ASK RLB (NZ) AMERICAS ASIA EMEA OCEANIA CANADA Calgary Toronto CARIBBEAN Barbados Grand Cayman
AUCKLAND DESTINATION OVERVIEW
 AUCKLAND DESTINATION OVERVIEW JULY 218 An in-depth overview of Auckland s visitor economy from the latest arrival, accommodation, spend and cruise data through to past five-year commentary. Prepared August
2015 REPRESENTATIVE TEAM RESULTS
 2015 REPRESENTATIVE TEAM RESULTS QBE INSURANCE ITM CUP 14 August Bay Of Plenty ASB Bay Park Stadium 11 20 20 August Wellington QBE Stadium 0 43 30 August Southland Homestead Stadium 26 25 5 September Hawkes
D R O N E T R A C K E R. making your world possible
 D R O N E T R A C K E R 2 0 1 8 1 C O N T E N T S Background 3 Number of responses recreational vs commercial operators Profile of a recreational operator 5 Profile of a commercial operator 9 Business
CRUISE TOURISM S CONTRIBUTION TO THE NEW ZEALAND ECONOMY 2017
 CRUISE TOURISM S CONTRIBUTION TO THE NEW ZEALAND ECONOMY 2017 21 August 2017 CRUISE TOURISM S CONTRIBUTION TO THE NEW ZEALAND ECONOMY 2017 Prepared for New Zealand Cruise Association Document reference:
mymarket Report How is the market?
 mymarket How is the market? Otago August 2015 The latest property market update for the Otago region. Helping you with your property decisions. mymarket Otago house prices are growing across the board,
AUCKLAND DESTINATION OVERVIEW
 AUCKLAND DESTINATION OVERVIEW October 218 An in-depth overview of Auckland s visitor economy from the latest arrival, accommodation, spend, cruise and event data through to past five- commentary. Prepared
Urban Area Concordance
 Urban Area Concordance Territorial Authority by Region by Urban Area Estimated Population at 30 June 2013 Estimated Resident Territorial Authority Region Urban Area Classification Population at 30 June
TOURISM NEW ZEALAND OUR VISITORS UNDERSTANDING HISTORIC VIEW TOTAL ARRIVALS YE SEPTEMBER 2017
 TOURISM NEW ZEALAND UNDERSTANDING OUR VISITORS GERMANY 104K 3% CHINA 408K 11% JAPAN 102K 3% UK 246K 7% USA 320K 9% Our market infographics are drawn from two different sources. HISTORIC VIEW: Past Visitor
Accommodation Survey: November 2009
 Embargoed until 10:45am 19 January 2010 Accommodation Survey: November 2009 Highlights Compared with November 2008: International guest nights were up 2 percent, while domestic guest nights were down 1
Milford Sound, Fiordland. newzealand.com. germany. Market information about our Visitors and our Active Considerers
 Milford Sound, Fiordland germany Market information about our Visitors and our Active Considerers newzealand.com PAST VISITORS HISTORIC VIEW TOTAL ARRIVALS YE SEPTEMBER 2017 CHINA 408K 11% JAPAN 102K 3%
Whangaroa Harbour, Northland. newzealand.com. united kingdom. Market information about our Visitors and our Active Considerers
 Whangaroa Harbour, Northland newzealand.com united kingdom Market information about our Visitors and our Active Considerers PAST VISITORS HISTORIC VIEW TOTAL ARRIVALS YE SEPTEMBER 2017 CHINA 408K 11% JAPAN
Mood of the Nation New Zealanders' perceptions of international visitors
 Mood of the Nation New Zealanders' perceptions of international visitors Contents 1 Background and approach 3 2 Key insights 6 3 Detailed insights 10 4 Appendix: measures by region 31 2 1 Background and
united states of america
 Split Apple Rock, Nelson Tasman newzealand.com united states of america Market information about our Visitors and our Active Considerers PAST VISITORS HISTORIC VIEW TOTAL ARRIVALS YE SEPTEMBER 2017 CHINA
The Hobbit: An Unexpected Journey World Premiere Visitor Research. January 2013
 The Hobbit: An Unexpected Journey World Premiere Visitor Research January 2013 Contents Background page 3 Approach page 4 Research Results - Hobbit Market Attendees page 5 - Survey Questions page 6 - Respondent
New Zealand Education. New Adventure Every Day
 A New Zealand Education New Adventure Every Day A WARM WELCOME Welcome to New Zealand, where you can gain a world-class education, make lifelong friendships, have unbeatable experiences and learn new ways
2017 Asheville and Buncombe County Real Estate Market Analysis
 2017 Asheville and Buncombe County Real Estate Market Analysis Summary This report examines the Asheville and Buncombe County residential real estate market for 2017 and compares the current real estate
Using the Index of Multiple Deprivation (IMD) to understand the drivers of deprivation in your district
 to understand the drivers of deprivation in your district") Using the Index of Multiple Deprivation (IMD) to understand the drivers of deprivation in your district Rachael McMillan Waikato Plan Programme Manager Purpose Understanding drivers of deprivation is important
Using the Index of Multiple Deprivation (IMD) to understand the drivers of deprivation in your district Rachael McMillan Waikato Plan Programme Manager Purpose Understanding drivers of deprivation is important
BERL Regional Rankings 2011
 BERL Regional Rankings 2011 Jason Leung-Wai Kelly Dustow Wilma Molano BERL #5214 BERL Regional Rankings 2011 1 Summary... 2 2 Introduction... 3 3 The Economic Context... 5 3.1 International... 5 3.2 National...
Infrastructure Strategies 2015
 Far North District Council http://www.fndc.govt.nz/your-council/strategic-planning/long-term-plan-2015-2025/ltp1525-11-30-year-infrastructure-strategy.pdf Kaipara District Council http://www.kaipara.govt.nz/site/kaiparadistrictcouncil/files/pdf/a-
Tourism Export Council New Zealand &
 Tourism Export Council New Zealand & Tourism Distribution Channels February 2015 Tourism Export Council who are we, what do we do? Founded 1971 Private sector 50 Inbound tour operator members (ITOs) 200
ECONOMIC INDICATORS. The West Coast of NZ
 ECONOMIC INDICATORS The West Coast of NZ 213 WEST COAST AT A GLANCE GDP $ 1.47billion GDP GROWTH 27-12 AVERAGE HOUSEHOLD INCOME $ 86, PER ANNUM Source: REAR 213 1.5%(NZ #2) PER ANNUM Source: BERL 213
Modelled Territorial Authority Gross Domestic Product (MTAGDP)
") RESEARCH EVALUATION ANALYTICS UNCLASSIFIED Modelled Territorial Authority Gross Domestic Product (MTAGDP) 2018 Methodology Table of Contents 1. Summary... 3 1.1 Caveats and disclaimers... 3 2. Methodology...
RESEARCH EVALUATION ANALYTICS UNCLASSIFIED Modelled Territorial Authority Gross Domestic Product (MTAGDP) 2018 Methodology Table of Contents 1. Summary... 3 1.1 Caveats and disclaimers... 3 2. Methodology...
Annual Gross Domestic Product (Production Measure)
") June 2017 Executive Summary Page 2 Latest Quarter Economic Trends page 3 Economic Outlook page 4 Labour Force page 5 Retail Activity page 6 Building Activity page 7 Tourism Trends page 8 Local Authorities
June 2017 Executive Summary Page 2 Latest Quarter Economic Trends page 3 Economic Outlook page 4 Labour Force page 5 Retail Activity page 6 Building Activity page 7 Tourism Trends page 8 Local Authorities
1 st and 2 nd Quarters 2018 Asheville and Buncombe County Real Estate Market Analysis
 1 st and 2 nd Quarters 2018 Asheville and Buncombe County Real Estate Market Analysis Summary The housing market in Asheville and Buncombe County had fewer home sales in the 2 nd quarter of 2018 compared
TOTAL MOBILITY AROUND NEW ZEALAND. A regional guide to using the Total Mobility scheme
 TOTAL MOBILITY AROUND NEW ZEALAND A regional guide to using the Total Mobility scheme NZ Transport Agency First published 2010 Updated September 2017 ISBN 978-0-478-37127-7 (print) ISBN 978-0-478-37128-4
Sponsor & Exhibitor. Prospectus September 2018 Dunedin
 Sponsor & Exhibitor Prospectus 14 16 September 2018 Dunedin Physiotherapy Conference 2018 The Physiotherapy New Zealand Conference 2018 is the preeminent professional development event of the year, and
San Juan County Real Estate Dollar Volume
 San Juan County Real Estate Dollar Volume 2014 $228,363,943 $256,620,333 2013 2012 $171,347,017 $201,915,885 2011 2010 2009 $125,443,472 $140,618,144 $140,034,284 2008 $203,392,953 $0 $50,000,000 $100,000,000
Mobile Black Spot Fund update
 Mobile Black Spot Fund update Late information item provided to Taranaki RTC 6 September 2017 meeting The Mobile Black Spot Fund (MBSF) announcement made on 30 August 2017 included reasonably significant
PAYS SECTION. Nouvelle-Zélande Centre de stockage de produits dérivés. En vigueur depuis le: 06/03/2018 Date de publication 06/03/2018
 PAYS SECTION Nouvelle-Zélande Centre de stockage de produits dérivés En vigueur depuis le: 06/03/2018 Date de publication 06/03/2018 00147 Liste en vigueur s2048 R & M Storage Limited Temuka Canterbury
TOTAL MOBILITY AROUND NEW ZEALAND. A regional guide to using the Total Mobility scheme
 TOTAL MOBILITY AROUND NEW ZEALAND A regional guide to using the Total Mobility scheme NZ Transport Agency First published 2010 Updated March 2018 ISBN 978-0-478-37127-7 (print) ISBN 978-0-478-37128-4 (online)
25/01/ /01/ / 5. CFNZ1 Clevedon Fields New Zealand Limited Auckland Auckland, wbu. CS22 Alliance Group Limited Invercargill Southland wbu
 25/01/2019 25/01/2019 00170 CFNZ1 Clevedon Fields New Zealand Limited Auckland Auckland 15/11/2011 CS22 Alliance Group Limited Invercargill Southland 23/10/2018 DSP12 Progressive Meats Limited Hastings
ConvenƟon Delegate Survey Report
 Sector Trends Evidence, Monitoring & Governance Branch ConvenƟon Delegate Survey Report Year to December 2017 April 2018 Ministry of Business, InnovaƟon and Employment (MBIE) Hīkina Whakatutuki LiŌing
New Zealand Personal Locator Beacon (PLB) Hire Outlets List Compiled by NZ Mountain Safety Council March 2017
 Hire Outlets List Compiled by NZ Mountain Safety Council March 2017") The below list of Personal Locator Beacon (PLB) hire outlets has been collated to the best of our knowledge, please get in touch with us if you know of anywhere else which also hires out PLBs info@mountainsafety.org.nz
The below list of Personal Locator Beacon (PLB) hire outlets has been collated to the best of our knowledge, please get in touch with us if you know of anywhere else which also hires out PLBs info@mountainsafety.org.nz
Market Watch. April 2017
 Market Watch April 2017 Table of Contents Summary.2 Overview The Private Sector New Zealand.3 New Projects to the Pipeline.5 In the Pipeline Early Planning, In Planning, Tendering 6 Projects starting.8
mymarket Report How is the market?
 mymarket How is the market?,, Tokoroa & Spring 2016 The latest property market update for the Central North Island region. Helping you with your property decisions. mymarket The property market has seen
Contents
 2 Contents... 5... 5... 5... 5... 5... 6... 7... 8... 9... 10... 13... 13... 13... 14... 15... 24... 24... 25... 26... 28... 28... 28... 28... 29... 29... 30... 30... 32... 37... 42... 52... 56... 58...
COUNTRY SECTION. New Zealand Meat of farmed game. Validity date from 24/08/2018 Date of publication 24/08/2018. List in force
 COUNTRY SECTION New Zealand Meat of farmed game Validity date from 24/08/2018 Date of publication 24/08/2018 00168 List in force CFNZ1 Clevedon Fields New Zealand Limited Auckland Auckland CP, wbu 15/11/2011
MAA [FI] SECTION. Uusi-Seelanti Kotieläiminä pidettyjen sorkka- ja kavioeläinten liha. Voimassa alkaen 23/10/2018. [fi] Date of publication 24/10/2018
![MAA [FI] SECTION. Uusi-Seelanti Kotieläiminä pidettyjen sorkka- ja kavioeläinten liha. Voimassa alkaen 23/10/2018. [fi] Date of publication 24/10/2018](/thumbs/93/111845986.jpg "MAA [FI] SECTION. Uusi-Seelanti Kotieläiminä pidettyjen sorkka- ja kavioeläinten liha. Voimassa alkaen 23/10/2018. [fi] Date of publication 24/10/2018") MAA [FI] SECTION Uusi-Seelanti Kotieläiminä pidettyjen sorkka- ja kavioeläinten liha Voimassa alkaen 24/10/2018 [fi] Date of publication 24/10/2018 00213 [fi] List in force CFNZ1 Clevedon Fields New Zealand
MAA [FI] SECTION Uusi-Seelanti Kotieläiminä pidettyjen sorkka- ja kavioeläinten liha Voimassa alkaen 24/10/2018 [fi] Date of publication 24/10/2018 00213 [fi] List in force CFNZ1 Clevedon Fields New Zealand
Meat & Wool Sector General Outlook embargo until 14 august 2009
 Meat & Wool Sector General Outlook embargo until 14 august 2009 Presentation to: NZAAA Conference Marlborough Convention Centre Blenheim 31 July 2009 P09025 Topics Pastoral Land Use Change Livestock Changes
Total mobility around New Zealand. A user s guide to the Total Mobility scheme in the different regions around New Zealand
 Total mobility around New Zealand A user s guide to the Total Mobility scheme in the different regions around New Zealand OUR PURPOSE CREATING TRANSPORT SOLUTIONS FOR A THRIVING NEW ZEALAND NZ Transport
Otago Economic Overview 2013
 Final report May 2014 www.berl.co.nz Background Author(s): Mark Cox, Hugh Dixon and Masrur Alam Khan DISCLAIMER All work is done, and services rendered at the request of, and for the purposes of the client
Accommodation Survey: February 2013
 Accommodation Survey: February 2013 Embargoed until 10:45am 11 April 2013 Key facts In February 2013, after removing seasonal variation: New Zealand guest nights rose 2.3 percent, following a fall of 4.1
New Zealand s 2011 Rugby World Cup: A Tourism Perspective
 New Zealand s 2011 Rugby World Cup: A Tourism Perspective Executive Summary... 3 Figure 1: Regional spread of international RWC visitors... 4 Figure 2: Seasonally adjusted monthly visitor numbers to New
JOURNAL ECONOMIC PERTH & KINROSS Q1-Q2 2018
 For more information regarding the content of this publication, please contact: Marek Styczen, Project Officer - Enterprise Planning & Development The Environment Service Perth & Kinross Council Pullar
NEW ZEALAND TRENDS IN PROPERTY AND CONSTRUCTION SECOND QUARTER 2012
 NEW ZEALAND TRENDS IN PROPERTY AND CONSTRUCTION SECOND QUARTER 2012 OFFICES AROUND THE WORLD 0508 ASK RLB OCEANIA EMEA ASIA AMERICAS AUSTRALIA Adelaide Brisbane Cairns Canberra Darwin Gold Coast Melbourne
The Corcoran Report 2Q 2018 EAST END
 The Corcoran Report 2Q 2018 EAST END 2Q2018 EAST END 2 Contents SOUTH FORK PAGE 3 NORTH FORK PAGE 6 LUXURY MARKET PAGE 8 LAND PAGE 9 COMMERCIAL PAGE 9 INVENTORY PAGE 9 Methodology & Source Welcome to the
Number of people tested
 Auckland NEW WORLD Birkenhead - - - Auckland NEW WORLD Clendon Manurewa 190 126 78 Auckland NEW WORLD Eastridge Orakei - - - Auckland NEW WORLD Green Bay 90 125 77 Auckland NEW WORLD Milford 133 132 80
Residential Property Price Index
 An Phríomh-Oifig Staidrimh Central Statistics Office 24 January 2012 Residential Property Price Index Residential Property Price Index December 2011 Dec 05 Dec 06 Dec 07 Dec 08 National Dec 09 Dec 10 Excluding
[BA] COUNTRY [BA] SECTION. [ba] New Zealand. [ba] Validity date from 23/10/2013 [ba] Date of publication 10/10/2013. [ba] List in force
![[BA] COUNTRY [BA] SECTION. [ba] New Zealand. [ba] Validity date from 23/10/2013 [ba] Date of publication 10/10/2013. [ba] List in force](/thumbs/89/98610107.jpg "[BA] COUNTRY [BA] SECTION. [ba] New Zealand. [ba] Validity date from 23/10/2013 [ba] Date of publication 10/10/2013. [ba] List in force") [BA] COUNTRY [BA] SECTION [ba] New Zealand [ba] Validity date from 23/10/2013 [ba] Date of publication 10/10/2013 00153 [ba] List in force CFNZ1 Clevedon Fields New Zealand Limited Auckland Auckland [ba]
[BA] COUNTRY [BA] SECTION [ba] New Zealand [ba] Validity date from 23/10/2013 [ba] Date of publication 10/10/2013 00153 [ba] List in force CFNZ1 Clevedon Fields New Zealand Limited Auckland Auckland [ba]
Facial Eczema Risk and Incidence Monitor Report
 Facial Eczema Risk and Incidence Monitor Report Weekly Summary Week 2-17 January 219 FE Risk -National trends in spore count levels (% elevated above 3, spg) % elevated spore counts (>3,/g) 8 7 6 4 3 2
mymarket Report How is the market?
 mymarket How is the market?,, Tokoroa & Autumn 2017 The latest property market update for the Central North Island region. Helping you with your property decisions. mymarket After more than seven years
MARKETBEAT. Queenstown Regional. Residential
 Winter 2016 MARKETBEAT RESEARCH NEWSLETTER Queenstown Regional Queenstown is booming. A surging tourism sector drawing in more workers, coupled with an increasing wave of lifestylers and rising investor
Analysing the performance of New Zealand universities in the 2010 Academic Ranking of World Universities. Tertiary education occasional paper 2010/07
 Analysing the performance of New Zealand universities in the 2010 Academic Ranking of World Universities Tertiary education occasional paper 2010/07 The Tertiary Education Occasional Papers provide short
Media Kit Updated February 2013
 Media Kit Updated February 2013 Stuff.co.nz In such a dynamic and fast-evolving digital landscape Fairfax is committed to delivering to advertisers needs. Stuff.co.nz is designed for good usability and
RESEARCH INDUSTRIAL SNAPSHOT
 RESEARCH INDUSTRIAL SNAPSHOT GREATER LONDON AND WESTERN HOME COUNTIES H2 2017 GREATER LONDON & WESTERN HOME COUNTIES LOGISTICS & INDUSTRIAL RESEARCH Introduction As the UK economy continues to grow so
FORECAST REPORT 86 NEW ZEALAND TRENDS IN PROPERTY AND CONSTRUCTION. FIRST Quarter 2018
 FORECAST REPORT 86 NEW ZEALAND TRENDS IN PROPERTY AND CONSTRUCTION FIRST Quarter 2018 OFFICES AROUND THE WORLD Africa Americas EUROPE Oceania Botswana Gaborone Mauritius Saint Pierre Mozambique Maputo
NEGARA BAGIAN. Selandia Baru Pabrik pengolahan. Tanggal Validitas dari 23/02/2018 Tanggal publikasi 23/02/2018. Daftar yang berlaku
 NEGARA BAGIAN Selandia Baru Pabrik pengolahan Tanggal Validitas dari 23/02/2018 Tanggal publikasi 23/02/2018 00099 Daftar yang berlaku 517 Alaron Products Limited Nelson Nelson 11/12/2015 5BW New Zealand
Policy National s plan for regional New Zealand. Policy highlights. Backing our regions. Delivering for New Zealanders
 Policy 2017 National s plan for regional New Zealand Backing our regions Policy highlights New Zealand is a nation of opportunities and that s all because of the hard work and enterprise of New Zealanders,
RESEARCH INDUSTRIAL SNAPSHOT
 RESEARCH INDUSTRIAL SNAPSHOT GREATER LONDON AND WESTERN HOME COUNTIES H1 2017 GREATER LONDON & WESTERN HOME COUNTIES LOGISTICS & INDUSTRIAL RESEARCH Introduction Our report provides an insight into the
MOTIVATORS TO VISIT: TRAVEL BEHAVIOUR:
 Angus & Associates Ltd. 2017 MOTIVATORS TO VISIT: While the majority of visitors to Queenstown in Q2 2017 were in the region for a holiday/vacation or short-break, the proportion of domestic visitors in
New Zealand Historic Places Trust
 New Zealand Historic Places Trust Bruce Chapman 1 July 2011-31 December 2011 International Travel Purpose (eg, attending conference on...) Nature (eg, hotel costs, travel, etc) Location/s 23 08 2011 $25.00
Facial Eczema Risk and Incidence Monitor Report
 Facial Eczema Risk and Incidence Monitor Report Weekly Summary Week - April 0 FE Risk -National trends in spore count levels (% elevated above 30,000 spg) % elevated spore counts (>30,000/g) 0 70 60 50