Att. A, AI 46, 11/9/17
|
|
|
- Dayna Flynn
- 5 years ago
- Views:
Transcription
1 Total s San Diego Metropolitan Transit System POLICY 42 PERFORMANCE MONITORING REPORT Page 1 of 6 Date: 11/8/17 OBJECTIVE Develop a Customer-Focused and Competitive System The following measures of productivity and service quality are used to ensure that services are focused on providing competitive and attractive transportation that meets our customers needs. Route Categories FY 2015 FY 2016 FY 2017 # Change # Change % Change % Change FY15 - FY16 FY16 - FY17 FY15 - FY16 FY16 - FY17 Urban Frequent 36,613,236 32,643,690 30,825,404 (3,969,546) (1,818,286) -10.8% -5.6% Urban Standard 11,444,117 10,503,448 9,646,605 (940,669) (856,843) -8.2% -8.2% Rapid 4,822,450 6,114,007 6,280,924 1,291, , % 2.7% Express 2,117,727 2,161,620 2,191,658 43,893 30, % 1.4% Circulator 774, , ,301 (12,157) (20,709) -1.6% -2.7% Premium/Rapid Express 304, , ,562 (12,014) (5,214) -3.9% -1.8% Rural 76,000 72,129 75,488 (3,871) 3, % 4.7% All Fixed-Route Bus Modes 56,152,487 52,549,680 50,048,942 (3,602,807) (2,500,738) -6.4% -4.8% Demand-Responsive 475, , ,091 46,838 6, % 1.3% Light Rail (Blue, Orange, Green) 40,049,516 39,577,369 37,607,470 (472,147) (1,969,899) -1.2% -5.0% Light Rail (Silver) 32,944 36,607 31,749 3,663 (4,858) 11.1% -13.3% System Total s 96,710,269 92,685,816 88,217,252 (4,024,453) (4,468,564) -4.2% -4.8% NOTES : MTS system-wide ridership declined 4.8%. Fixed-route bus ridership decreased 4.8% overall. The Transit Optimization Plan (TOP) was approved by the Board in September 2017 with the goal of identifying unproductive segments, and markets where added service could increase ridership. Ridership on MTS' Demand-Responsive service, the federally-mandated American with Disabilities Act complementary paratransit service, continued to grow, but the rate of growth decreased compared to FY16 due to new enforcement strategies of ensuring the benefit serves those individuals who qualify under federal ADA guidelines. Average Weekday s Route Categories FY 2015 FY 2016 FY 2017 # Change # Change % Change % Change FY15 - FY16 FY16 - FY17 FY15 - FY16 FY16 - FY17 Urban Frequent 121, , ,380 (14,505) (5,532) -11.9% -5.2% Urban Standard 39,288 35,503 32,620 (3,785) (2,883) -9.6% -8.1% Rapid 15,958 20,009 20,836 4, % 4.1% Express 7,807 7,860 7, % 0.7% Circulator 2,963 2,909 2,844 (54) (65) -1.8% -2.2% Premium/Rapid Express 1,278 1,181 1,131 (97) (50) -7.6% -4.2% Rural (12) 0-3.4% 0.0% All Fixed-Route Bus Modes 189, , ,063 (14,349) (7,647) -7.6% -4.4% Demand-Responsive 1,708 1,876 2, % 24.4% Light Rail (Blue, Orange, Green) 123, , ,211 (1,505) (6,440) -1.2% -5.3% Light Rail (Silver) % 57.0% System Avg. Weekday Pass. 314, , ,988 (15,648) (13,491) -5.0% -4.5% NOTES : The average weekday passenger statistics show how many passengers ride MTS on a typical weekday. For FY17, there is a 4.5% decrease in system-wide average weekday passengers (down 13,491 passengers per average weekday). Similar to Total s on buses, the average weekday ridership decreases in the Urban Frequent category reflect customers utilizing Rapid services. A-1
2 s per Revenue Hour San Diego Metropolitan Transit System POLICY 42 PERFORMANCE MONITORING REPORT Page 2 of 6 Date: 11/8/17 Route Categories FY 2015 FY 2016 FY 2017 % Change % Change FY15 - FY16 FY16 - FY17 Urban Frequent % -4.8% Urban Standard % -10.4% Rapid % 3.0% Express % 0.8% Circulator % -2.7% Premium/Rapid Express % 0.0% Rural % 6.0% All Fixed-Route Bus Modes % -4.9% Demand-Responsive % -4.8% Light Rail (Blue, Orange, Green) % -4.9% Light Rail (Silver) % -26.6% System Riders Per Rev. Hour % -5.3% NOTES : The passengers per revenue hour metric shows how any added or removed revenue hours (in-service hours plus layover hours) relate to ridership increases or decreases. Increasing riders per revenue hour would indicate that the system is more efficient, for example, carrying more passengers with the same number of buses. Weekday s per In-Service Hour The passengers per in-service hour measure is related to the above passengers per revenue hour, but shows how many passengers are carried while the vehicle is in-service picking up passengers, excluding layover time. Analyzing this figure helps MTS to understand how effective it is at providing the right level of service, instead of how efficiently MTS is grouping trips and breaks together for a vehicle to operate (revenue hours). Route Categories FY 2015 FY 2016 FY 2017 % Change % Change FY15 - FY16 FY16 - FY17 Urban Frequent % -2.8% Urban Standard % -4.6% Rapid % 3.3% Express % -0.3% Circulator % -1.8% Premium/Rapid Express % -3.5% Rural % 6.8% All Fixed-Route Bus Modes % -2.2% Demand-Responsive N/A N/A N/A N/A N/A Light Rail (Blue, Orange, Green) % -2.8% Light Rail (Silver) % -3.4% System Riders/In-Svc. Hour % -2.6% NOTES : Compared to FY16, MTS system-wide passengers per in-service hour decreased slightly 2.6% to 56.6 passengers per in-service hour in FY17. For FY17, fixed-route bus passengers per in-service hour experienced a decrease of 2.2% to 36.4 passengers per in-service hour. A-2
3 On-Time Performance San Diego Metropolitan Transit System POLICY 42 PERFORMANCE MONITORING REPORT Page 3 of 6 Date: 11/8/17 On-time performance (OTP) is measured at each bus timepoint for every trip; buses departing timepoints within 0-5 minutes of the scheduled time are considered to be "on-time." Trolley trips arriving at their end terminal within 0-5 minutes of the scheduled time are considered to be "ontime." OTP is measured by service change period in order to show the results of scheduling changes. MTS goal for on-time performance is 85% for Urban Frequent and Rapid bus routes, and 90% for Trolley and all other bus route categories. Each route is continually evaluated to determine if performance below the target is a result of issues that MTS controls, such as driver performance or scheduling, or situations outside MTS direct control, such as construction, traffic congestion, and passenger issues. Performance of fixed bus routes is heavily impacted by construction, stop signs and stop lights, and traffic when they travel through high density corridors. Route Categories Service Change Period Sept Jan June 2016 Sept Jan GOAL Urban Frequent 83.0% 83.1% 82.7% 83.0% 81.8% 85.0% Urban Standard 82.2% 84.0% 81.9% 83.6% 83.3% 90.0% Rapid 87.5% 89.7% 89.7% 88.1% 86.1% 85.0% Express 75.6% 85.5% 73.7% 74.3% 82.7% 90.0% Circulator 79.8% 86.6% 83.8% 83.9% 73.6% 90.0% Premium/Rapid Express 85.4% 87.9% 87.1% 85.6% 80.5% 90.0% Rural N/A N/A N/A N/A N/A Demand-Responsive N/A N/A N/A N/A N/A Light Rail (Blue, Orange, Green) 94.7% 92.6% 88.2% 92.0% 93.9% 90.0% Light Rail (Silver) 90.0% 94.3% 95.5% 96.8% 97.3% 90.0% System On-Time Performance 82.6% 85.0% 82.7% 83.5% 82.7% NOTES : Overall, on-time performance remained between 80% and 85%. As of the January 2017 service change, two route categories have met their goal while five categories did not. The Rapid bus mode met its goals, as signal priority measures, and limited stops helped reliability and performance. The two Trolley modes also met their goal, benefitting from the completion of Trolley Renewal construction and activities. The remaining bus modes continue to be challenged by traffic congestion, roadwork and associated detours, lack of transit priority treatments, and traffic calming measures that slow bus service. MTS has recently installed AVL equipment on buses that provides more robust on-time performance reporting capabilities. This data will be used to improve on-time performance. Additonally, service changes related to the Transit Optimization Plan (TOP) in January 2018, could also improve on-time performance. Preventable Accidents per 100,000 Miles Operator FY 2015 FY 2016 FY 2017 MTS Directly-Operated Bus MTS Contracted Fixed-Route Bus Demand-Responsive MTS Rail (Fleet) NOTES : The rate of preventable accidents for Directly-Operated and contracted bus services' improved in FY17 while the number of accidents involving a light rail vehicle increased. Trolley operators were not cited or deemed to be at-fault for any accidents in FY17. For bus and Trolley operations, continued operator retraining and safety awareness programs are held throughout the year to improve the operator average for this safety metric. Accidents are reviewed regularly to determine if a different operator action may have improved the outcome. A-3
4 Mean Distance Between Failures (MDBF) San Diego Metropolitan Transit System POLICY 42 PERFORMANCE MONITORING REPORT Page 4 of 6 Date: 11/8/17 Operator FY 2015 FY 2016 FY 2017 % Change % Change FY15-FY16 FY16-FY17 MTS Directly-Operated Bus 12,943 9,463 9, % 1.4% MTS Contracted Fixed-Route Bus 8,479 5,927 6, % 10.7% Demand-Responsive 58,730 50,130 49, % -1.0% MTS Rail 5,987 6,335 6, % 9.0% NOTES : The rate of mechanical failures for both Directly-Operated and Contracted bus services improved from FY16 to FY17. Trolley shows an increase in MDBF compared to FY16 as well. Complaints per 100,000 s Operator FY 2015 FY 2016 FY 2017 % Change % Change FY15-FY16 FY16-FY17 MTS Directly-Operated Bus % -22.2% MTS Contracted Fixed-Route Bus % -12.3% Demand-Responsive % 18.3% MTS Rail % -20.0% General System % -11.9% NOTES : In FY16 and FY17, MTS saw a decrease in the number of passenger complaints. Over the past three two years, MTS has worked to direct all complaints to a centralized call number, and track all complaints and employee responses to a database. The effort to centralize complaints for Demand-Responsive occurred over FY16 and FY17, hence the significant increase, concurrently the new ADA certification also generated complaints. MTS ensures printed materials contain the one call number, and staff are trained on procedures to log complaints, comments, and suggestions from passengers. OBJECTIVE Develop a Sustainable System The following measures are used to ensure that transit resources are deployed efficiently and do not exceed budgetary constraints. These resources may be increased over the budgeted amounts in order to respond to heavy passenger loads, special events, or unplanned detours due to construction or route changes. They may be lower than budgeted if underperforming services are reduced, or if not all of the planned capacity is required to meet the ridership demand. Revenue Hours Operator FY17 Budget FY17 Actual # Diff % Diff MTS Directly-Operated Bus 824, ,300 (2,661) -0.3% MTS Contracted Fixed-Route Bus 992,233 1,000,081 7, % Demand-Responsive 274, ,840 (6,513) -2.4% MTS Rail 501, ,197 (10,811) -2.2% System 2,592,555 2,580,418 (12,137) -0.5% NOTES : In FY17, all modes remained relatively unchanged to compared to what was budgeted. Revenue Miles Operator FY17 Budget FY17 Actual # Diff % Diff MTS Directly-Operated Bus 9,689,251 9,626,387 (62,864) -0.6% MTS Contracted Fixed-Route Bus 10,303,454 10,340,647 37, % Demand-Responsive 4,708,525 4,803,000 94, % MTS Rail 8,488,071 8,728, , % System 33,189,301 33,498, , % NOTES : In FY17, all modes remained relatively unchanged to compared to what was budgeted. A-4
5 San Diego Metropolitan Transit System POLICY 42 PERFORMANCE MONITORING REPORT Page 5 of 6 Weekday Peak-Vehicle Requirement This measure shows the maximum number of vehicles that are on the road at any one time (a weekday peak period) in order to provide the levels of service that have been scheduled. Operator June 2016 June 2017 # Change FY16-FY17 MTS Directly-Operated Bus MTS Contracted Fixed-Route Bus (4) Demand-Responsive (9) MTS Rail Date: 11/8/17 NOTES : All bus service peak vehicle requirements remained largely the same. Trolley's peak car requirement remained consistent between FY16 and FY17. MTS Access' peak vehicle requirement has decreased over the past year, due to decreased service operated. In Service Speeds (MPH) (Weekday) Operator June 2016 June 2017 % Change FY16-FY17 MTS Directly-Operated Bus % MTS Contracted Fixed-Route Bus % MTS Rail % NOTES : In-service speeds have remained relatively flat year-over-year. In-Service/Total Miles (Weekday) The in-service miles per total miles ratio is only calculated for MTS in-house operations, as contractors are responsible for bus and driver assignments (runcutting) for MTS Contract Services. Operator June 2016 June 2017 % Change FY16-FY17 MTS Directly-Operated Bus 85.2% 84.8% -0.4% MTS Contracted Fixed-Route Bus N/A N/A N/A MTS Rail 99.3% 99.3% 0.0% NOTES : Ratios have remained stable over the two service periods reported for MTS Directly-Operated Bus and MTS Trolley operations. In-Service/Total Hours (Weekday) As with the mileage statistic, 'in service hours' per total hours are only calculated for MTS in-house operations. Operator June 2016 June 2017 % Change FY16-FY17 MTS Directly-Operated Bus 75.7% 75.8% 0.1% MTS Contracted Fixed-Route Bus N/A N/A N/A MTS Rail (Layover Included) 93.3% 97.6% 4.3% NOTES : Efficiency of scheduling has kept the ratio generally consistent over time, with only a minor change from FY16 to FY17. A-5
6 San Diego Metropolitan Transit System POLICY 42 PERFORMANCE MONITORING REPORT Page 6 of 6 Date: 11/8/17 Farebox Recovery Ratio This metric measures the percent of total operating cost recovered through fare revenue. The Transportation Development Act (TDA) has a requirement of 31.9 percent system-wide for fixed-route services (excluding regional routes which have a 20 percent requirement). Operator FY 2015 FY 2016 FY 2017 % Change % Change FY15-FY16 FY16-FY17 MTS Fixed-Route Bus (exc PrExp) 35.6% 34.9% 32.3% -0.7% -2.6% MTS Premium Exp./Rapid Express 51.4% 56.4% 52.7% 5.0% -3.7% Demand-Responsive 13.5% 12.7% 14.0% -0.8% 1.3% MTS Rail 56.8% 55.6% 51.0% -1.2% -4.6% System Farebox Recovery Ratio 40.5% 39.6% 36.5% -0.9% -3.1% The farebox recovery ratios for all fixed-route services continue to exceed the Transportation Development Act (TDA) target. Subsidy Per This metric is the amount of public subsidy required to provide service for each unlinked passengers boarding (measured as total operating cost minus fare revenue, divided by total passengers). MTS' goal is to improve route-category average year-over-year. Operator FY 2015 FY 2016 FY 2017 % Change % Change FY15-FY16 FY16-FY17 Urban Frequent $1.56 $1.76 $ % 5.3% Urban Standard $1.58 $1.64 $ % 14.9% Rapid $2.86 $2.42 $ % -9.1% Express $3.27 $3.39 $ % -6.8% Circulator $1.94 $2.21 $ % -8.7% Premium Exp./Rapid Express $3.91 $3.29 $ % 24.1% Rural $9.25 $9.56 $ % -2.6% All Fixed-Route Bus Modes $1.77 $1.90 $ % 4.7% Demand-Responsive $31.25 $31.37 $ % -10.5% Light Rail (Blue, Orange, Green) $0.78 $0.82 $ % 1.2% Light Rail (Silver) $7.78 $7.06 $ % 14.3% System Subsidy Per Pass. $1.51 $1.61 $ % 2.5% Overall, system-wide subsidy per passenger increased to $1.65 in FY17. For fixed-route bus service, subsidy per passenger increased from $1.90 in FY16 to $1.99 in FY17 (4.7%). Light rail subsidy per passenger increased from $0.82 to $0.83 over the last year. A-6
7 11/8/2017 Route FY 2017 ANNUAL ROUTE STATISTICS Annual s Avg. Weekday s s/ Revenue Hour Subsidy per Farebox Recovery Cost Per Blue 17,524,753 55, $ % $1.49 Orange 8,930,210 27, $ % $2.45 Green 11,152,507 32, $ % $2.54 Silver 31, $ % $ ,228,261 4, $ % $ ,600 3, $ % $ ,502,966 5, $ % $ ,914 2, $ % $ ,756 2, $ % $ ,096 1, $ % $ ,809,987 8, $ % $ ,303 1, $ % $ ,873 1, $ % $ ,328,883 4, $ % $ ,030,597 6, $ % $ ,777,236 5, $ % $ , $ % $ , $ % $ ,144 2, $ % $ , $ % $ , $ % $ ,283 1, $ % $ ,579,905 4, $ % $ , $ % $ ,498 1, $ % $ ,238,797 4, $ % $ ,116,538 3, $ % $ , $ % $ , $ % $ , $ % $ , $ % $ , $ % $ ,527 1, $ % $ , $ % $ , $ % $ ,947 2, $ % $ ,022 3, $ % $ /202 2,337,168 8, $ % $ , $ % $ ,067,873 6, $ % $ ,451,717 4, $ % $ ,476 1, $ % $ , $ % $9.60 A-7
8 11/8/2017 Route FY 2017 ANNUAL ROUTE STATISTICS Annual s Avg. Weekday s s/ Revenue Hour Subsidy per Farebox Recovery Cost Per , $ % $ ,830 1, $ % $ , $ % $ ,182 1, $ % $ , $ % $ , $ % $ ,708 3, $ % $ ,263 2, $ % $ , $ % $ ,141 1, $ % $ , $ % $ , $ % $ , $ % $ ,006 1, $ % $ , $ % $ , $ % $ , $ % $ ,088 2, $ % $ ,583 1, $ % $ , $ % $ /872 97, $ % $ / ,679 1, $ % $ , $ % $ $ % $ $ % $ , $ % $ ,236 2, $ % $ (Note 1) 173, $ % $ ,850 1, $ % $ /907 2,043,532 6, $ % $ / , $ % $ , $ % $ , $ % $ ,841 1, $ % $ ,230,944 7, $ % $ ,146,682 3, $ % $ /934 1,663,576 5, $ % $ ,702 1, $ % $ , $ % $ , $ % $ ,565 1, $ % $ ,343,108 4, $ % $ ,507 1, $ % $ ,465 1, $ % $ , $ % $ , $ % $ , $ % $3.63 A-8
9 11/8/2017 Route FY 2017 ANNUAL ROUTE STATISTICS Annual s Avg. Weekday s s/ Revenue Hour Subsidy per Farebox Recovery Cost Per , $ % $ , $ % $ ,273 1, $ % $ (SVCC) (Note 2) 33, $ % $ (SVCC) (Note 2) 29, $ % $ (SVCC) (Note 2) 23, $ % $ (SVCC) (Note 2) 21, $ % $3.18 MTS ACCESS 529,091 2, $ % $37.36 By Route Category Annual s Avg. Weekday s s/ Revenue Hour Subsidy per Farebox Recovery Cost Per Urban Frequent 30,825, , $ % $2.99 Urban Standard 9,646,605 32, $ % $3.01 Rapid (Note 3) 6,280,924 20, $ % $3.49 Express 2,191,658 7, $ % $4.58 Circulator 741,301 2, $ % $3.16 Premium/Rapid Express 287,562 1, $ % $7.89 Rural (Note 4) 75, $ % $11.38 All Fixed-Route Bus Modes 50,048, , $ % $3.17 Demand-Responsive 529,091 2, $ % $37.36 Light Rail (Blue, Orange, Green) 37,607, , $ % $2.03 Light Rail (Silver) 31, $ % $12.56 System Totals 88,217, , $ % $2.89 Note 1: City of Coronado subsidized fares for summer service on Route 904. Note 2: SVCC fares and one-half of the subsidy are paid for by NCTD. Note 3: SANDAG reimburses MTS for the net operating cost (operating cost less fare revenue) using TransNet funds for Routes 201/202, 204, 235, & 237. Note 4: Routes 888, 891, 892, and 894 receive federal rural operating subsidy. A-9
10 San Diego Metropolitan Transit System POLICY 42 TITLE VI MONITORING REPORT Page 1 of 3 Title VI Compliance The indicators below are required by the FTA to be monitored by and reported to the MTS Board. They measure the quantity and quality of service that MTS provides to minority and non-minority populations, as defined in FTA Circular B (2012).The circular defines a minority route as, "a route that has at least 1/3 of its total revenue mileage in a Census block or block group, or traffic analysis zone(s) with a percentage of minority population that exceeds the percentage of minority population in the transit service area. " Route Headway, On-Time Performance, and Load Factor Weekday Headway Vehicle Load Factor (VLF) Category/ Did 20% of trips What % of trips Route exceed vehicle load exceeded vehicle (*Seasonal Peak Base factor? load factor. Changes) (Note 3) (Note 3) Minority Route On-Time Performance Rapid Express/Premium Express Goal 30 min. n/a % Max 90% % % Express Goal 30 min. n/a % Max 90% 20 15/ % 50 15/ % 60 15/ % % / % VLF goal = 1.00 (minibus) 44% / % Light Rail Goal n/a 15 min % Max 90% Blue % Orange % Green % Silver Operates selected days only 97% Rapid Goal n/a 15 min % Max 85% 201/ % % % % / % Urban Frequent Goal n/a 15 min % Max 85% % % % % % 7 6/ % 8* Summer headway = 15 min. 85% 9* Summer headway = 15 min. 84% % % % % / % / % % % % % % 906/ % % % 933/ % % % % Notes DATE: 11/8/17 A-10
11 Category/ Route (*Seasonal Changes) Weekday Headway Peak Base San Diego Metropolitan Transit System POLICY 42 TITLE VI MONITORING REPORT Page 2 of 3 Vehicle Load Factor (VLF) Did 20% of trips exceed vehicle load factor? (Note 3) What % of trips exceeded vehicle load factor. (Note 3) Minority Route Notes On-Time Performance Urban Standard Goal n/a 30 min % Max 85% % VLF goal = 1.00 (minibus) 82% % % Operates peaks only 85% 35 15/ % % % Operates Sundays only 78% % % % % % % VLF goal = 1.00 (minibus) 74% % % % % % % 871/ % 874/ % % 916/ % % % % % VLF goal = 1.00 (minibus) 84% VLF goal = 1.00 (minibus) 91% % % % % Circulator Goal n/a 60 min % Max 90% % % % % % 904* % % % DATE: 11/8/17 A-11
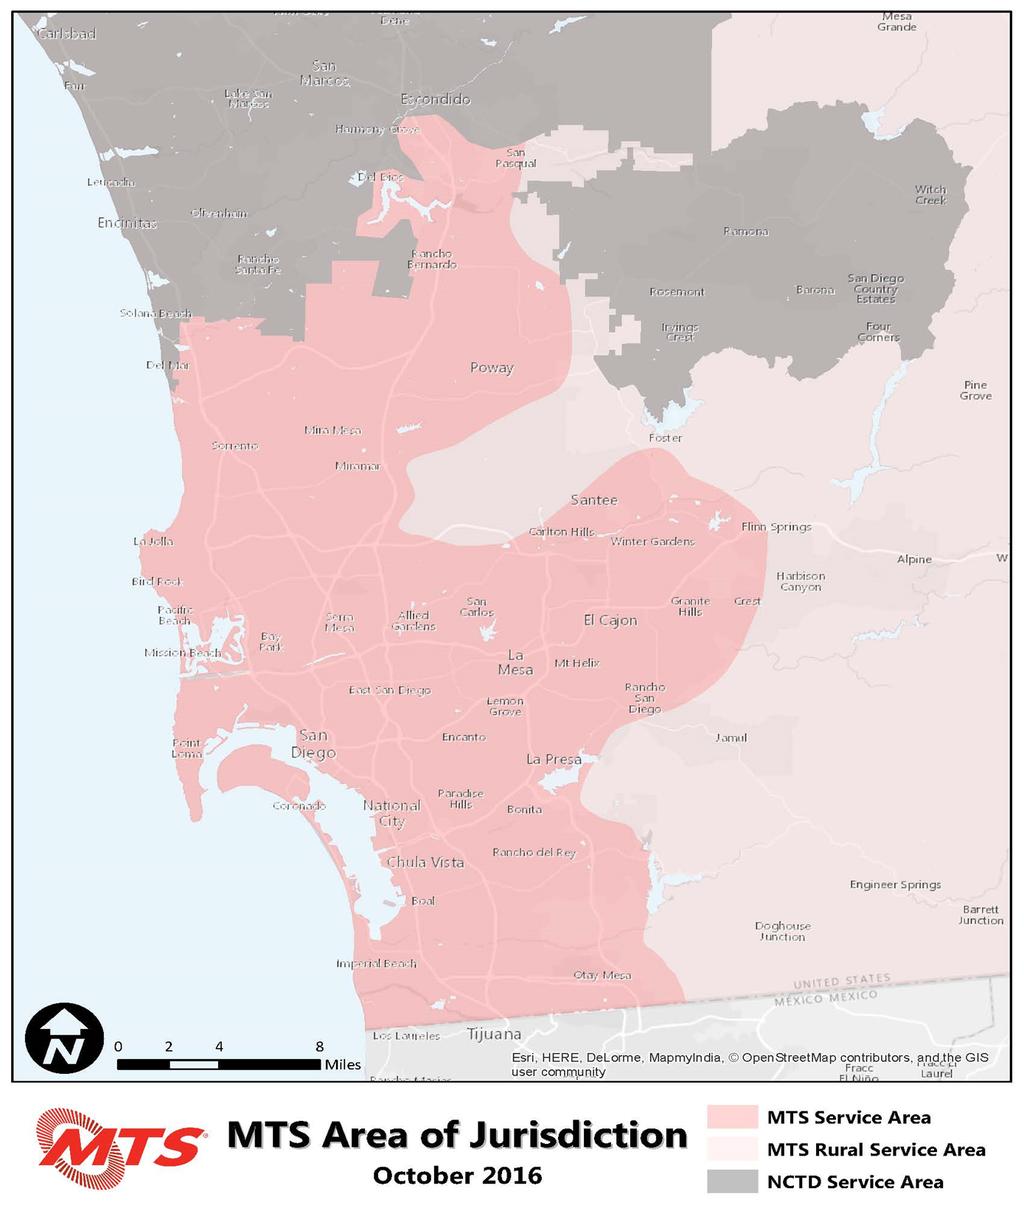
12 Category/ Route (*Seasonal Changes) Weekday Headway Peak Base San Diego Metropolitan Transit System POLICY 42 TITLE VI MONITORING REPORT Page 3 of 3 Vehicle Load Factor (VLF) Did 20% of trips exceed vehicle load factor? (Note 3) What % of trips exceeded vehicle load factor. (Note 3) Minority Route Notes On-Time Performance Circulator (SVCC) (Note 1) Goal 60 min. n/a % Max 90% 972 ~ ~ ~ ~ Rural (Note 2) Goal n/a n/a n/a n/a n/a Note 1: Routes 972, 973, 978, are 979 are timed to the COASTER schedule and wait for passengers to transfer from the COASTER. Trips with an overflow of passengers use an additional standby bus located at the COASTER station. Note 2: Rural & Demand Response services have no specific Policy 42 goals for on-time performance, headway, or vehicle load. Note 3: No route exceeded the 20% vehicle load factor. Service Availability DATE: 11/8/17 Goal 80% of residents or jobs within ½ mile of a bus stop or rail station in urban area 100% of suburban residences within 5 miles of a bus stop or rail station. Actual % of residents within 1/2 mile of a bus stop or rail station in urban % of jobs within 1/2 mile of a bus stop or 94.0% 90.5% % of suburban residents within 5 miles of a bus stop or rail station: 99.9% One return trip at least 2 days/week to destinations from rural villages (defined as Lakeside and Alpine). Available Service: Route 848 serves Lakeside seven days a week and Route 864 serves Alpine seven days a week. See attached map entitled 'Metropolitan Transit System Area of Jurisdiction.' A-12
13 A-13
Date: 11/6/15. Total Passengers
 Total San Diego Metropolitan Transit System POLICY 42 PERFORMANCE MONITORING REPORT Page 1 of 6 OBJECTIVE Develop a Customer-Focused and Competitive System The following measures of productivity and service
METROBUS SERVICE GUIDELINES
 METROBUS SERVICE GUIDELINES In the late 1990's when stabilization of bus service was accomplished between WMATA and the local jurisdictional bus systems, the need for service planning processes and procedures
Sound Transit Operations December 2014 Service Performance Report. Ridership
 Ridership Total Boardings by Mode Mode Dec-13 Dec-14 % YTD-13 YTD-14 % ST Express 1,266,130 1,396,787 10.3% 16,605,299 17,661,976 6.4% Sounder 248,710 285,016 14.6% 3,035,735 3,361,317 10.7% Tacoma Link
Sound Transit Operations January 2014 Service Performance Report. Ridership
 Ridership Total Boardings by Mode Mode Jan-13 Jan-14 % YTD-13 YTD-14 % ST Express 1,343,290 1,426,928 6.2% 1,343,290 1,426,928 6.2% Sounder 245,135 256,775 4.7% 245,135 256,775 4.7% Tacoma Link 86,229
TRANSPORTATION SERVICE Actual
 PERFORMANCE REPORT-THIRD QUARTER VISION TO DELIVER REGIONAL MULTI-MODAL TRANSPORTATION SERVICES AND INFRASTRUCTURE IMPROVEMENTS THAT SIGNIFICANTLY AND CONTINUALLY INCREASE TRANSIT MARKET SHARE. MISSION
Transit Performance Report FY (JUNE 30, 2007)
") Transit Performance Report FY 2006-2007 (JUNE 30, 2007) J ANUARY 2008 TRANSIT PERFORMANCE REPORT FY 2006 2007 (JUNE 30, 2007) Transit Performance Report I SSUED: JANUARY 2008 The Transit Performance Report
Transit Performance Report FY 2006-2007 (JUNE 30, 2007) J ANUARY 2008 TRANSIT PERFORMANCE REPORT FY 2006 2007 (JUNE 30, 2007) Transit Performance Report I SSUED: JANUARY 2008 The Transit Performance Report
PERFORMANCE REPORT DECEMBER 2017
 PERFORMANCE REPORT DECEMBER 2017 Note: New FY2018 Goal/Target/Min or Max incorporated in the Fixed Route and Connection Dashboards. Keith A. Clinkscale Performance Manager INTRODUCTION/BACKGROUND Keith
PERFORMANCE REPORT NOVEMBER 2017
 PERFORMANCE REPORT NOVEMBER 2017 Note: New FY2018 Goal/Target/Min or Max incorporated in the Fixed Route and Connection Dashboards. Keith A. Clinkscale Performance Manager INTRODUCTION/BACKGROUND In June
Sound Transit Operations June 2016 Service Performance Report. Ridership
 Ridership Total Boardings by Mode Mode Jun-15 Jun-16 % YTD-15 YTD-16 % ST Express 1,622,222 1,617,420-0.3% 9,159,934 9,228,211 0.7% Sounder 323,747 361,919 11.8% 1,843,914 2,099,824 13.9% Tacoma Link 75,396
MONTHLY OPERATIONS REPORT SEPTEMBER 2015
 MONTHLY OPERATIONS REPORT SEPTEMBER 215 Table of Contents SEPTEMBER 215 Section Page September Highlights... 3 Strategic Goals Progress Update... 4 Ridership... 6 Revenue... 9 Expenses... 1 System Summary...
SAMTRANS TITLE VI STANDARDS AND POLICIES
 SAMTRANS TITLE VI STANDARDS AND POLICIES Adopted March 13, 2013 Federal Title VI requirements of the Civil Rights Act of 1964 were recently updated by the Federal Transit Administration (FTA) and now require
Sound Transit Operations March 2018 Service Performance Report. Ridership
 March 218 Service Performance Report Ridership Total Boardings by Mode Mar-17 Mar-18 % YTD-17 YTD-18 % ST Express 1,622,116 1,47,79-4.6% 4,499,798 4,428,14-1.6% Sounder 393,33 39,6.% 1,74,96 1,163,76 8.3%
PERFORMANCE REPORT DECEMBER Performance Management Office
 PERFORMANCE REPORT DECEMBER 2018 Performance Management Office INTRODUCTION/BACKGROUND Performance Management Office FIXED ROUTE DASHBOARD FY 2019 Safety Max Target Goal Preventable Collisions per 100k
Sound Transit Operations August 2015 Service Performance Report. Ridership
 Ridership Total Boardings by Mode Mode Aug-14 Aug-15 % YTD-14 YTD-15 % ST Express 1,534,241 1,553,492 1.3% 11,742,839 12,354,957 5.2% Sounder 275,403 326,015 18.4% 2,139,086 2,463,422 15.2% Tacoma Link
MONTHLY OPERATIONS REPORT DECEMBER 2015
 MONTHLY OPERATIONS REPORT DECEMBER 215 Table of Contents DECEMBER 215 Section Page December Highlights... 3 Strategic Goals Progress Update... 4 Ridership... 6 Revenue... 9 Expenses... 1 System Summary...
About This Report GAUGE INDICATOR. Red. Orange. Green. Gold
 ATTACHMENT A About This Report The Orange County Transportation Authority (OCTA) operates a countywide network of local, community, rail connector, and express bus routes serving over 6, bus stops. OCTA
ATTACHMENT A.7. Transit Division Performance Measurements Report Fiscal Year Fourth Quarter
 TTCHMENT.7 Transit Division Performance Measurements Report Fiscal Year 2012-13 Fourth Quarter Introduction The Orange County Transportation uthority (OCT) operates a countywide network of local, community,
Chapter 3. Burke & Company
 Chapter 3 Burke & Company 3. WRTA RIDERSHIP AND RIDERSHIP TRENDS 3.1 Service Overview The Worcester Regional Transit Authority (WRTA) provides transit service to over half a million people. The service
Board of Directors Information Summary
 Regional Public Transportation Authority 302 N. First Avenue, Suite 700, Phoenix, Arizona 85003 602-262-7433, Fax 602-495-0411 Board of Directors Information Summary Agenda Item #6 Date July 11, 2008 Subject
Appendix A: Regional Fare Policy, SANDAG
 cover Appendix A: Regional Fare Policy, SANDAG BOARD POLICY NO. 029 REGIONAL FARE POLICY AND COMPREHENSIVE FARE ORDINANCE Purpose: To establish guidelines for setting a uniform, fair, and equitable areawide
FIXED ROUTE DASHBOARD JULY 2018
 FIXED ROUTE DASHBOARD JULY 2018 Safety Max Target Goal Preventable Collisions per 100k Miles Non-Preventable Collisions per 100k Miles Total Incidents per 10,000 Boardings 1.6 1.3 0.8 2.63 2.1 2.0 1.60
Sound Transit Operations January 2018 Service Performance Report. Ridership
 January 218 Service Performance Report Ridership Total Boardings by Mode Jan-17 Jan-18 % YTD-17 YTD-18 % ST Express 1,3,33 1,7,91.3% 1,3,33 1,7,91.3% Sounder 367,33 416,8 13.3% 367,33 416,8 13.3% Tacoma
LA Metro Rapid - Considerations in Identifying BRT Corridors. Martha Butler LACMTA, Transportation Planning Manager Los Angeles, California
 LA Metro Rapid - Considerations in Identifying BRT Corridors Martha Butler LACMTA, Transportation Planning Manager Los Angeles, California LA Metro Transportation planner/coordinator, designer, builder
APPENDIX B COMMUTER BUS FAREBOX POLICY PEER REVIEW
 APPENDIX B COMMUTER BUS FAREBOX POLICY PEER REVIEW APPENDIX B COMMUTER BUS FAREBOX POLICY PEER REVIEW The following pages are excerpts from a DRAFT-version Fare Analysis report conducted by Nelson\Nygaard
Matt Miller, Planning Manager Margaret Heath-Schoep, Paratransit & Special Projects Manager
 DATE May 2, 218 Item #12 TO FROM GCTD Board of Directors Matt Miller, Planning Manager Margaret Heath-Schoep, Paratransit & Special Projects Manager MS SUBJECT I. EXECUTIVE SUMMARY This quarterly report
Sound Transit Operations March 2017 Service Performance Report. Ridership. Total Boardings by Mode
 March 217 Service Performance Report Ridership ST Express Sounder Tacoma Link Link Paratransit Mar-16 Mar-17 % 1,83,4 1,621,49 2.4% 37,496 82,631 1,264,47 3,821 Total Boardings by Mode 389,98 87,39 1,89,43,297
Sound Transit Operations February 2018 Service Performance Report. Ridership
 February 218 Service Performance Report Ridership Total Boardings by Mode Feb-17 Feb-18 % YTD-17 YTD-18 % ST Express 1,373,96 1,372,88 -.1% 2,877,294 2,88,719.1% Sounder 314,96 32,187 11.9% 681,923 768,69
PERFORMANCE REPORT JANUARY Keith A. Clinkscale Performance Manager
 PERFORMANCE REPORT JANUARY 2018 Keith A. Clinkscale Performance Manager INTRODUCTION/BACKGROUND Keith A. Clinkscale Performance Manager FIXED ROUTE DASHBOARD JANUARY 2018 Safety Max Target Goal Preventable
September 2014 Prepared by the Department of Finance & Performance Management Sub-Regional Report PERFORMANCE MEASURES
 September 2014 Prepared by the Department of Finance & Performance Management 2013 Sub-Regional Report PERFORMANCE MEASURES REGIONAL PERFORMANCE MEASURES RTA staff has undertaken the development of a performance
DRT Performance Measurement: the U.S. Experience
 DRT Performance Measurement: the U.S. Experience FOR ANYBODY GOING ANYWHER IN LA HABRA International Conference on Demand Responsive Transportation Breckenridge, Colorado September 2016 DRT Performance
Sound Transit Operations January 2017 Service Performance Report. Ridership. Total Boardings by Mode
 January 217 Service Performance Report Ridership ST Express Sounder Tacoma Link Link Paratransit Jan-16 Jan-17 % 1,433,7 1,3,33 4.9% 331,27 7,121 98,411 3,633 Total Boardings by Mode 363,6 74,823 1,76,914
October REGIONAL ROUTE PERFORMANCE ANALYSIS
 October 2018 2017 REGIONAL ROUTE PERFORMANCE ANALYSIS The Council s mission is to foster efficient and economic growth for a prosperous metropolitan region Metropolitan Council Members Alene Tchourumoff
Peer Performance Measurement February 2019 Prepared by the Division of Planning & Market Development
 2017 Regional Peer Review Peer Performance Measurement February 2019 Prepared by the Division of Planning & Market Development CONTENTS EXECUTIVE SUMMARY... 3 SNAPSHOT... 5 PEER SELECTION... 6 NOTES/METHODOLOGY...
Existing Services, Ridership, and Standards Report. June 2018
 Existing Services, Ridership, and Standards Report June 2018 Prepared for: Prepared by: Contents Overview of Existing Conditions... 1 Fixed Route Service... 1 Mobility Bus... 34 Market Analysis... 41 Identification/Description
SUB-REGIONAL PERFORMANCE MEASURES
 SUB-REGIONAL PERFORMANCE MEASURES 29 REPORT Overall regional performance is a function of five major areas: Service Coverage - monitors both how much service is available to people in the region (in terms
Regional Fare Change Overview. Nick Eull Senior Manager of Revenue Operations Metro Transit
 Regional Fare Change Overview Nick Eull Senior Manager of Revenue Operations Metro Transit Committee of the Whole April 5 th, 2017 Today s Presentation Fare change goals and considerations Public engagement
Mount Pleasant (42, 43) and Connecticut Avenue (L1, L2) Lines Service Evaluation Study Open House Welcome! wmata.com/bus
 and Connecticut Avenue (L1, L2) Lines Service Evaluation Study Open House Welcome! wmata.com/bus") Mount Pleasant (42, 43) and Connecticut Avenue (L1, L2) Lines Service Evaluation Study Open House Welcome! Study Overview and Timeline Phase 1: Collect and Analyze Data Project Kickoff, September 2017
Mount Pleasant (42, 43) and Connecticut Avenue (L1, L2) Lines Service Evaluation Study Open House Welcome! Study Overview and Timeline Phase 1: Collect and Analyze Data Project Kickoff, September 2017
APPENDIX B. Arlington Transit Peer Review Technical Memorandum
 APPENDIX B Arlington Transit Peer Review Technical Memorandum Arlington County Appendix B December 2010 Table of Contents 1.0 OVERVIEW OF PEER ANALYSIS PROCESS... 2 1.1 National Transit Database...2 1.2
PTN-128 Reporting Manual Data Collection and Performance Reporting
 2016 PTN-128 Reporting Manual Data Collection and Performance Reporting Sponsored by the Texas Department of Transportation Table of Contents PTN-128 WHAT, WHY AND WHO... 6 What is the PTN-128... 13 Why
SRTA Year End Fixed Route Ridership Analysis: FY 2018
 SRTA Year End Fixed Route Ridership Analysis: FY 2018 2018 Contents Introduction... 1 A. Key Terms Used in this Report... 1 Key Findings... 2 A. Ridership... 2 B. Fare Payment... 4 Performance Analysis
Quarterly Report Transit Bureau, Local Transit Operations. First Quarter, Fiscal Year 2015 (July 2014 September 2014) ART & STAR
 ART & STAR") Quarterly Report Transit Bureau, Local Transit Operations First Quarter, Fiscal Year 2015 (July 2014 September 2014) ART & STAR A Arlington Transit ART 1) Introduction The purpose of ART is to provide
Quarterly Report Transit Bureau, Local Transit Operations First Quarter, Fiscal Year 2015 (July 2014 September 2014) ART & STAR A Arlington Transit ART 1) Introduction The purpose of ART is to provide
Title VI Service Equity Analysis
 Pierce Transit Title VI Service Equity Analysis Pursuant to FTA Circular 4702.1B September 2013 Service Change February 2013 Page intentionally left blank PIERCE TRANSIT TITLE VI SERVICE EQUITY ANALYSIS
The 15-day comment period will run from Thursday, April 4, 2019 to 4pm on Wednesday April 18, 2019.
 Proposed Service Standards-Title VI Program Update 2019 April 3, 2019 The Cape Ann Transportation Authority is seeking input on service standards and service policies proposed as part of the Title VI Program
CHAPTER 5: Operations Plan
 CHAPTER 5: Operations Plan Report Prepared by: Contents 5 OPERATIONS PLAN... 5-1 5.1 Proposed Service Changes... 5-2 5.1.1 Fiscal Year 2017... 5-2 5.1.2 Fiscal Year 2018... 5-6 5.1.3 Fiscal Year 2019...
2017/2018 Q3 Performance Measures Report. Revised March 22, 2018 Average Daily Boardings Comparison Chart, Page 11 Q3 Boardings figures revised
 2017/2018 Q3 Performance Measures Report Revised March 22, 2018 Average Daily Boardings Comparison Chart, Page 11 Q3 Boardings figures revised Contents Ridership & Revenue... 1 Historical Revenue & Ridership...
2017/ Q1 Performance Measures Report
 2017/2018 - Q1 Performance Measures Report Contents Ridership & Revenue... 1 Historical Revenue & Ridership... 1 Revenue Actual vs. Planned... 3 Mean Distance Between Failures... 5 Maintenance Cost Quarter
Bristol Virginia Transit
 Bristol Virginia Transit 1 Transit Overview Bristol Virginia Transit (BVT) is a Federally Funded and certified urban area transit system. BVT began operation in its current form in 1982. In Fiscal Year
MERRIMACK VALLEY REGIONAL TRANSIT AUTHORITY (MVRTA) PERFORMANCE MEASURES: FIXED ROUTE
 PERFORMANCE MEASURES: FIXED ROUTE") PERFORMANCE MEASURES: FIXED ROUTE IT IS OUR GOAL TO IMPROVE FIXED ROUTE SERVICE ON ALL LEVELS, ON A CONTINUOUS BASIS. IN ORDER TO DO THIS, WE HAVE ESTABLISHED BENCHMARKS TO MEASURE PERFORMANCE. THIS INFORMATION
PERFORMANCE MEASURES: FIXED ROUTE IT IS OUR GOAL TO IMPROVE FIXED ROUTE SERVICE ON ALL LEVELS, ON A CONTINUOUS BASIS. IN ORDER TO DO THIS, WE HAVE ESTABLISHED BENCHMARKS TO MEASURE PERFORMANCE. THIS INFORMATION
Operational Performance
 Customer Services, Operations, and Safety Committee Board Action/Information Item III-A January 10, 2008 Operational Washington Metropolitan Area Transportation Authority Board Action/Information Summary
Establishes a fare structure for Tacoma Link light rail, to be implemented in September 2014.
 RESOLUTION NO. R2013-24 Establish a Fare Structure and Fare Level for Tacoma Link MEETING: DATE: TYPE OF ACTION: STAFF CONTACT: PHONE: Board 09/26/2013 Final Action Ric Ilgenfritz, Executive Director,
January 2019 Monthly Performance Report
 Date: February 19, 2019 To: From: Subject: General Manager Board of Directors Timothy Kea Budget & Grants Department January 2019 Monthly Performance Report The monthly systemwide ridership decreased 0.5%
FY Transit Needs Assessment. Ventura County Transportation Commission
 FY 18-19 Transit Needs Assessment Ventura County Transportation Commission Contents List of Figures and Appendices.. 2 Appendices... 1 Chapter 1: Introduction What is the Ventura County Transportation
Transit System Performance Update
 Clause 5 in Report No. 4 of Committee of the Whole was adopted, without amendment, by the Council of The Regional Municipality of York at its meeting held on March 29, 2018. 5 2017 Transit System Performance
Title VI Service Monitoring Program
 SFMTA Municipal Transportation Agency Image: Historic Car number 1 and 162 on Embarcadero Title VI Service Monitoring Program 11 5 2013 SAN FRANCISCO, CALIFORNIA Title VI Overview Title VI of the Civil
December 2018 Monthly Performance Report
 Date: January 16, 2019 To: From: Subject: General Manager Board of Directors Timothy Kea Budget & Grants Department December 2018 Monthly Performance Report The monthly systemwide ridership decreased 1.4%
Bus Operations Report
 Third Quarter FY 216 (January 1 - March 31, 216) Wednesday April 27, 216 Operations Ridership: 783,194 passengers used in the third quarter. This represents a 2% increase over the same period in FY 215.
DRAFT Service Implementation Plan
 2017 Service Implementation Plan October 2016 SECTION NAME 2017 Service Implementation Plan October 2016 2017 SERVICE IMPLEMENTATION PLAN TABLE OF CONTENTS Table of Contents... I List of Tables... III
METRO OPERATIONS COMMITTEE
 Los Angeles County Metropolitan Transportation Authority Item 1 CHIEF OPERATIONS OFFICER S S REPORT METRO OPERATIONS COMMITTEE Lonnie Mitchell Chief Operations Officer May 19, 20 1 Employee Recognition
Scorecard Key Performance Indicators
 Scorecard Key Performance Indicators 1 st Quarter 2013 NICE Bus Fixed Route NICE Bus Fixed Route Definitions Scheduled Revenue Hours Full Trip Revenue Hours Lost Runs Missed Revenue Hours Lost Actual Hours
All Door Boarding Title VI Service Fare Analysis. Appendix P.3
 All Door Boarding Title VI Service Fare Analysis Appendix P.3 Metro Board Report Los Angeles County Metropolitan Transportation Authority One Gateway Plaza 3rd Floor Board Room Los Angeles,
8 CROSS-BOUNDARY AGREEMENT WITH BRAMPTON TRANSIT
 8 CROSS-BOUNDARY AGREEMENT WITH BRAMPTON TRANSIT The Transportation Services Committee recommends the adoption of the recommendations contained in the following report dated May 27, 2010, from the Commissioner
Attachment C: 2017/2018 Halifax Transit Year End Performance Report. 2017/2018 Year End Performance Measures Report
 Attachment C: 2017/2018 Halifax Transit Year End Performance Report 2017/2018 Year End Performance Measures Report Contents Annual Key Performance Indicators (KPIs)... 1 Weekday Cost per Passenger... 1
SAN DIEGO ASSOCIATION OF GOVERNMENTS COMPREHENSIVE FARE ORDINANCE
 SAN DIEGO ASSOCIATION OF GOVERNMENTS COMPREHENSIVE FARE ORDINANCE An Ordinance Establishing a Regional Fare Pricing Schedule & Revenue Allocation Formula The San Diego Association of Governments (SANDAG)
CURRENT SHORT-RANGE TRANSIT PLANNING PRACTICE. 1. SRTP -- Definition & Introduction 2. Measures and Standards
 CURRENT SHORT-RANGE TRANSIT PLANNING PRACTICE Outline 1. SRTP -- Definition & Introduction 2. Measures and Standards 3. Current Practice in SRTP & Critique 1 Public Transport Planning A. Long Range (>
YOSEMITE AREA REGIONAL TRANSPORTATION SYSTEM
 YOSEMITE AREA REGIONAL TRANSPORTATION SYSTEM Short Range Transit Plan Prepared for the Merced County Association of Governments/YARTS Prepared by LSC Transportation Consultants, Inc. YOSEMITE AREA REGIONAL
VCTC Transit Ridership and Performance Measures Quarterly Report
 VCTC Transit Ridership and Performance Measures Quarterly Report Overview Quarter 2 Fiscal Year 2018-2019 This report provides performance measures for VCTC Intercity Bus Service covering the FY 2018-19
1 DEMAND RESPONSE OVERVIEW
 1 DEMAND RESPONSE OVERVIEW Forty-nine transit agencies in Ohio operate demand response service, not including demand response services operated as part of the transit service provided in conjunction with
Service Performance 2013 Networked Family of Services
 Service Performance 2013 Networked Family of Services Overview RTD s Mission is: "To meet our constituents' present and future public transit needs by offering safe, clean, reliable, courteous, accessible
Administrative Operations Report
 Fiscal Year 2017/18 Administrative Operations Report November 1, 2018 Prepared by: El Dorado County Transit Authority 6565 Commerce Way Diamond Springs, CA 95619 (530) 642-5383 www.eldoradotransit.com
ESCAMBIA COUNTY AREA TRANSIT MTAC REPORT
 ESCAMBIA COUNTY AREA TRANSIT MTAC REPORT November 8, 2017 Meeting Escambia County Area Transit 1515 W. Fairfield Drive Pensacola, FL 32501 850-595-3228 INTRODUCTION 2 Summary Background MTAC ECAT Benchmarks
Fiscal Management and Control Board. Fare Policy October 16, Draft for Discussion & Policy Purposes Only
 Fiscal Management and Control Board Fare Policy October 16, 2015 1 Components of Fares Fare Level Different types of pricing by: By mode By time of day By distance By rider type (reduced fare) Subscription
New System. New Routes. New Way. May 20, 2014
 Route Optimization I N I T I A T I V E New System. New Routes. New Way. May 20, 2014 1 Welcome Blueprint for Transportation Excellence (BTE) 20 year strategic plan Blueprint 2020 JTA s five-year plan for
RTA ScoreCard December 2009
 Background and Context RTA ScoreCard December 2009 Chapter 25 of the Acts of 2009 modernized the transportation systems of the Commonwealth and created the new MassDOT. Section 6 of this law established
RULES AND REGULATIONS
 RULES AND REGULATIONS FOR METROBUS OPERATIONS OCTOBER 1996 (Revised by Board resolution February 10, 2000) Washington Metropolitan Area Transit Authority 600 Fifth Street, NW! Washington, DC 20001 PURPOSE
Peer Performance Measurement February 2019 Prepared by the Division of Planning & Market Development
 2017 Sub-Regional Peer Review Peer Performance Measurement February 2019 Prepared by the Division of Planning & Market Development CONTENTS EXECUTIVE SUMMARY... 3 NOTES/METHODOLOGY... 6 AGENCIES... 7
REVIEW OF SUN METRO LIFT SERVICES
 REVIEW OF SUN METRO LIFT SERVICES Prepared for Review by Linda Cherrington, Research Scientist Suzie Edrington, Associate Research Scientist Zachary Elgart, Associate Transportation Researcher Shuman Tan,
Board Box. February Item # Item Staff Page 1. Key Performance Indicators M. Thompson Financial Report for Dec H.
 Board Box February 2016 Item # Item Staff Page 1. Key Performance Indicators M. Thompson 2-8 2. Financial Report for Dec. 2015 H. Rodriguez 9-13 ITEM 1 February 15, 2016 TO: FROM: RE: BOARD OF DIRECTORS
Title VI Service Equity Analysis
 Pierce Transit Title VI Service Equity Analysis Pursuant to FTA Circular 4702.1B NE Tacoma Service May 2016 Pierce Transit Transit Development Dept. PIERCE TRANSIT TITLE VI SERVICE EQUITY ANALYSIS TABLE
Mobile Farebox Repair Program: Setting Standards & Maximizing Regained Revenue
 Mobile Farebox Repair Program: Setting Standards & Maximizing Regained Revenue Michael J. Walk, Chief Performance Officer Larry Jackson, Directory of Treasury Maryland Transit Administration March 2012
RACINE COUNTY PUBLIC TRANSIT PLAN:
 RACINE COUNTY PUBLIC TRANSIT PLAN: 2013-2017 Recommended Transit Service Improvement Plan NEWSLETTER 3 SEPTEMBER 2013 This newsletter describes the final recommended public transit plan for the City of
Executive Summary. Introduction. Community Assessment
 Executive Summary Introduction The Red Rose Transit Authority (RRTA) Transit Development Plan provides an evaluation of existing RRTA fixed route services, with the outcome being practical recommendations
Alternatives: Strategies for Transit Systems Change
 Alternatives: Strategies for Transit Systems Change There is a broad array of options for modification of transit operations to make it more cost effective and efficient. These are typically examined to
Interstate 90 and Mercer Island Mobility Study APRIL Commissioned by. Prepared by
 Interstate 90 and Mercer Island Mobility Study APRIL 2017 Commissioned by Prepared by Interstate 90 and Mercer Island Mobility Study Commissioned by: Sound Transit Prepared by: April 2017 Contents Section
SAN LUIS OBISPO TRANSIT + SAN LUIS OBISPO RTA JOINT SHORT RANGE TRANSIT PLANS: SERVICE STRATEGIES. Presented by: Gordon Shaw, PE, AICP; Principal
 SAN LUIS OBISPO TRANSIT + SAN LUIS OBISPO RTA JOINT SHORT RANGE TRANSIT PLANS: SERVICE STRATEGIES Presented by: Gordon Shaw, PE, AICP; Principal Project Status Review of existing services and setting complete
COLT RECOMMENDED BUSINESS PLAN
 COLT RECOMMENDED BUSINESS PLAN 2008 INTRODUCTION The past decade has been one of change in Lebanon County and this situation is expected to continue in the future. This has included growth in population,
Fixed-Route Operational and Financial Review
 Chapter II CHAPTER II Fixed-Route Operational and Financial Review Chapter II presents an overview of route operations and financial information for KeyLine Transit. This information will be used to develop
Table of Contents. List of Tables
 Table of Contents 1. Introduction... 1 2. Service Recommendations... 1 A. Extend Service on Fort Belvoir to New Post Exchange/Commissary Complex... 1 B. Improve Service Frequencies on Sunday from Current
Follow-up to Proposed Fare Changes for FY2013
 Finance & Administration Committee Information Item I-A January 19, 2012 Follow-up to Proposed Fare Changes for FY2013 1 of 22 Washington Metropolitan Area Transit Authority Board Action/Information Summary
Implementation Guidelines and Performance Measures Special Transportation for Seniors and People with Disabilities (Paratransit) Program
 Program") FY 2019-20 FINAL December 2018 Implementation Guidelines and Performance Measures Special Transportation for Seniors and People with Disabilities (Paratransit) Program Implementation Guidelines These guidelines
FY 2019-20 FINAL December 2018 Implementation Guidelines and Performance Measures Special Transportation for Seniors and People with Disabilities (Paratransit) Program Implementation Guidelines These guidelines
Community Feedback and Survey Participation Topic: ACCESS Paratransit Services
 Community Feedback and Survey Participation Topic: ACCESS Paratransit Services Fall 2014 Valley Regional Transit DEAR SURVEY PARTICIPANT, In summer 2014, staff from Valley Regional Transit and the transportation
Manual vs. Automatic Operation and Operational Restrictions
 Customer Services, Operations, and Safety Committee Board Information Item IV-B March 11, 2010 Manual vs. Automatic Operation and Operational Restrictions Page 81 of 91 Washington Metropolitan Area Transit
P.O. Box 1749 Halifax, Nova Scotia B3J 3A5 Canada Item No Transportation Standing Committee April 23, 2019
 P.O. Box 1749 Halifax, Nova Scotia B3J 3A5 Canada Item No. 12.1.1 Transportation Standing Committee April 23, 2019 TO: Chair and Members of Transportation Standing Committee SUBMITTED BY: ORIGINAL SIGNED
OCTA s ACCESS Service The Way to Go!!!!
 SUMMARY The Orange County Transit Authority (OCTA) is responsible for the public transportation services in Orange County. It provides fixed-route public transportation, rail service, manages the State
Federal Subsidies to Passenger Transportation December 2004
 U.S. Department of Transportation Bureau of Transportation Statistics Federal Subsidies to Passenger Transportation December 2004 Federal Subsidies to Passenger Transportation Executive Summary Recent
FY Year End Performance Report
 Overall Ridership Big Blue Bus carried 18,748,869 passengers in FY2014-2015, a 0.3% reduction from the year prior. This negligible reduction in ridership represents the beginnings of a reversal from a
Table of Contents. TRANSIT DEVELOPMENT PLAN UPDATE i
 Table of Contents Chapter 1. Introduction... 1 Chapter 2. Financial Review... 3 2.1 Operating Costs... 3 2.2 Capital Costs... 3 2.3 Revenues... 4 2.4 Overall Funding Implications... 4 Chapter 3. Service
MONTHLY REPORT SEPTEMBER 2017
 MONTHLY REPORT 2017 SUN SHUTTLE RIDERSHIP ROUTE PASSENGERS: CURRENT YEAR PRIOR YEAR AMOUNT PERCENTAGE BUDGET AMOUNT PERCENTAGE TOTAL PASSENGERS 17,250 20,318 (3,068) -15.1% 18,231 (981) -5.4% CALENDAR
1 YORK REGION TRANSIT/ VIVA SYSTEM PERFORMANCE
 Report No. 6 of the Transportation Services Committee Regional Council Meeting of June 23, 2011 1 YORK REGION TRANSIT/ VIVA SYSTEM PERFORMANCE The Transportation Services Committee recommends: 1. Receipt
P.O. Box 1749 Halifax, Nova Scotia B3J 3A5 Canada Item No Transportation Standing Committee October 25, 2018
 P.O. Box 1749 Halifax, Nova Scotia B3J 3A5 Canada Item No. 12.1.2 Transportation Standing Committee October 25, 2018 TO: Chair and Members of Transportation Standing Committee SUBMITTED BY: Original Signed
APPENDIX 2 TORONTO TRANSIT COMMISSION SERVICE STANDARDS AND DECISION RULES FOR PLANNING TRANSIT SERVICE
 APPENDIX 2 TORONTO TRANSIT COMMISSION SERVICE STANDARDS AND DECISION RULES FOR PLANNING TRANSIT SERVICE Contents 1 Introduction... 1 2 Network Design Standards... 2 2.1 Transit Service Classifications...