Know your market and build your business. How understanding target markets and local demographic/economic information can help local business
|
|
|
- Shon Newman
- 6 years ago
- Views:
Transcription

1 Know your market and build your business How understanding target markets and local demographic/economic information can help local business March 24, 2015
2 About informed decisions.id stands for informed decisions and our work is to provide decision makers within government and the business community with readily accessible, easy to use information about the people living in their communities of interest and the characteristics of their local economy. We provide these tools to over 250 councils around Australia and a growing list of commercial clients..

3 Today s presentation - Give you a fish, or teach you to fish?

4 1. Where can I find more customers?
5 1. Where can I find more customers? In this presentation, we will examine a number of free, handy tools to help you find more customers, understand your local market, uncover potential, scout suitable locations for your business and even discover the emerging new trends that you will need to know to be ahead of the game. But first, we need to look at some segmentation theory


6 2. To find WHERE they are, first we need to know WHO they are Before we can start to find more customers, we need to know who they are.

7 Are your customers people (end users) or businesses/organisations? Or maybe both?
8 Segmentation Either way, we need to do some segmentation. We need to know the common characteristics of our customers, whether they are individual people or businesses.
9 Market Segmentation 1. Demographic Age Gender Family size Family lifecycle Generation: baby-boomers, Generation X, etc. Income Work type (e.g. part or full time) Occupation Education Ethnicity Nationality Religion Social class
10 Segmentation 2. Geographic Region: by continent, country, state, or even neighbourhood Size of metropolitan area: segmented according to size of population Population density: often classified as urban, suburban, or rural Climate: according to weather patterns common to certain geographic regions

11 Segmentation Who buys your products? What % are local? Local buyers vs other areas B2B locally? How can you get more? What type of businesses buy? Why? End Consumers do they tend to be a particular type of consumer? Families Mothers Aged Young etc Retailers etc
12 Common demographic household types Single Young couple no kids Young family Family Empty nesters Older Lone person

13 Local demographics Who lives here? (and buys here) What is the household style and is this changing? Who are the emerging groups, and where? What industries do they work in? How do they get to work? Where do they travel to?
14 Common B2B economic factors What industries are located here? How are they doing? Do we have a competitive advantage? How is employment growth by industry? What are the most productive industries? How many businesses are in this industry? Where are they located? Where do their workers come from?
15 Common questions Where to locate my business Where/how to concentrate my marketing target marketing How to find suitable employees qualified, experienced How to get a better deal on business finance How to find local industries that are growing How to see if local businesses could potentially buy my products Am I flogging a dead horse? Maybe there are better horses to be on?
16 Demographics
17 Economic profile
18 Getting a better rate on your business loan
19 Population Forecast
20 What do we know Increasing population Including growth in both younger age groups and ageing population Where will most ageing occur Redlynch, Lamb Range Where will we see most growth in families Mt Peter Wrights Creek, Gordonvale-Goldsborough, Smithfield Where will we see most growth in empty nesters Smithfield, Mt Peter Wrights Creek Emerging languages Japanese, Filipino
21 What are the trends in Cairns? - Population TREND Cairns Queensland Population (ERP June 2013) Population change (ERP) ,102 4,656,803 25,320, 19.2% growth 16.18% growth Population (Census UR) 145, 374 4,332,732 Population change (Census UR) ,939, 12.33% growth Gain of 441, % Dwelling change ,878, 10.58% growth 10% growth Average household size Decrease from 2.54 to 2.49 Stable at 2.57
22 Population change summary Persons Change Suburbs No. % Babinda - Rural South 4,133 4, % Bayview Heights 4,150 4, % Bentley park 7,423 5,381 2, % Brinsmead 5,236 5, % Bungalow - Portsmith 2,400 2, % Cairns City 2,181 1, % Cairns North 4,439 3, % Clifton Beach 2,978 2, % Earlville 3,851 3, % Edge Hill 3,867 3, % Edmonton 9,932 8,016 1, % Freshwater - Stratford - Aeroglen 3,636 3, % Gordonvale - Goldsborough - Mount Peter 7,319 6,070 1, % Holloways Beach - Mechans Beach 3,224 3, % Kamerunga - Caravonica & District 2,876 3, % Kanimbla 2,359 1, % Kewarra Beach 5,310 4, % Manoora 5,695 5, % Manunda 4,972 5, % Mooroobool 6,805 6, % Mossman - Cooya Beach & District 4,071 3, % Mount Sheridan 7,986 7, % Palm Cove - Ellis Beach 1,652 1, % Parramatta Park 3,222 2, % Port Douglas - Oak Beach and District 4,520 4, % Redlynch - Lamb Range 8,644 6,077 2, % Smithfield 3,713 3, % Trinity Beach 4,738 3, % Trinity Park 2, , % Westcourt 3,907 3, % White Rock 4,481 3, % Whitfield 4,192 4, % Wonga - Daintree & District 2,201 2, % Woree 4,828 4, % Yorkeys Knob 2,768 2, % Cairns Regional Council 156, ,612 18, %
23 What are the trends in Cairns? - Age TREND Cairns Queensland Median age 35, slight increase 36, stable Number of 0-4 year olds 7.6%, increasing 6.9% decreasing Number of year olds (baby boomers) 18.4%, increasing 18.2%, increasing Number aged %, increasing 13.1%, increasing

24 What are the trends in Cairns? - Age

25 What are the trends in Cairns? - Age
26 What are the trends in Cairns? - Families TREND Cairns Queensland Older couples 5.7%, increasing 8.7%, increasing Couples with young children 16.1%, increasing 16.9%, increasing One parent families with young children 6.3%, increasing 4.7%, decreasing Older lone persons 6.4%, increasing 8.1%, increasing

27 What are the trends in Cairns? - Families

28 What are the trends in Cairns? - Families
29 What are the trends in Cairns? - Families
30 What are the trends in Cairns? - Families

31 What are the trends in Cairns? - Families
32 What are the trends in Cairns? - Families
33 What are the trends in Cairns? - Diversity TREND Cairns Queensland % overseas born 20.3%, increase from 18.1% in % up from 17.9% in 2006 Speaking non-english language at home 11.2%, up from 9.2% in %, up from 7.8% in 2006 Dominant birthplaces UK, NZ, Papua New Guinea UK, NZ, South Africa Emerging birthplaces Philippines, India, South Africa India, China, Philippines Indigenous 13,481 people, 9.3% 3.6%
34 What are the trends in Cairns? - Diversity
35 What are the trends in Cairns? - Diversity
36 What are the trends in Cairns? - Diversity
37 What are the trends in Cairns? - Diversity
38 What are the trends in Cairns? Socio-economic TREND Cairns Queensland Median Household income (weekly) $1,201, up 14.3% since 2006 $1,235, up 19.6% since 2006 Mortgage payments (weekly) $433, up 48.3% since 2006 $426 up 42% since 2006 Rental payments (weekly) $257, up 31.8% since 2006 $300 up 50% since 2006

39 What are the trends in Cairns? Socio-economic
40 What are the trends in Cairns? Socio-economic

41 What are the trends in Cairns? Socio-economic
42 What are the trends in Cairns? Socio-economic

43 What are the trends in Cairns? Socio-economic

44 What are the trends in Cairns? Socio-economic
45 What are the trends in Cairns? - Employment TREND Cairns Queensland Unemployment rate 5,477 people, 7.4%, up from 4.3% in %, up from 4.7% in 2006 Participation rate 65.4%, decrease from 65.9% in % increase from 61.9% in 2006 Dominant industries Emerging industries Health Care and Social Assistance, Retail and Accommodation and Food Services Education & Training, Public Administration & Safety Health Care, Retail, Construction Professional, Scientific and Technical Services, Mining and Education & Training
46 What are the trends in Cairns? - Employment
47 What are the trends in Cairns? - Employment
48 What are the trends in Cairns? - Employment
49 What are the trends in Cairns? - Employment
50 What are the trends in Cairns? - Employment
51 What are the trends in Cairns? Growth in part-time Employment

52 Key industries for Value-added
53 Key industries for output
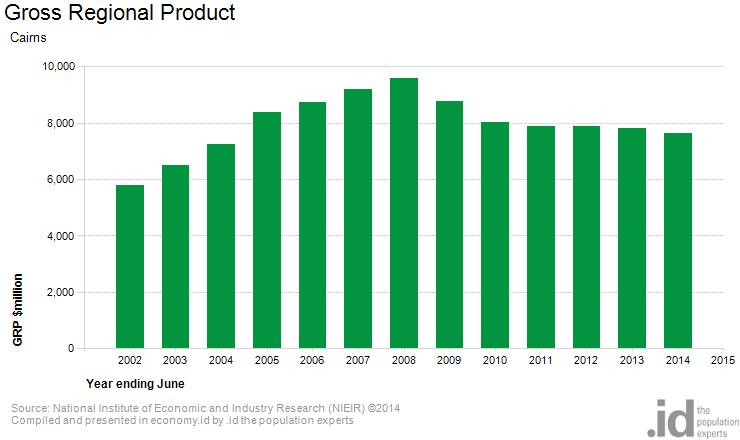
54 GRP
55 GRP movement
56 Tools available Cairns Regional Council subscribes to a range of.id tools to help understand key trends and plan for the future of the City.
At a Glance Organic Home Delivery
 NSW Sydney Many Sydney suburbs, Wollongong, and Berry on the South Coast. Doorstep Organics http://organicdeliverysydney.com.au/ Rozelle 2039 Sydney CBD, Summer Hill, Norther Beaches, Eastern Suburbs,
The Yorke & Mid North (State Govt) Region. Workforce Wizard Region Report
 Region. Workforce Wizard Region Report") The Yorke & Mid North (State Govt) Region Workforce Wizard Region Report Table of Contents Executive Summary 3 Population and Social Characteristics 4 Current Population 4 Age Groups 4 Key Populations
The Yorke & Mid North (State Govt) Region Workforce Wizard Region Report Table of Contents Executive Summary 3 Population and Social Characteristics 4 Current Population 4 Age Groups 4 Key Populations
123, 133. Fares. Timetable information. 123 James Cook University to Cairns Central. 133 Cairns City bus station to Stockland Earlville
 Fares Fares are calculated on the number of zones you use in your journey. Fare zone calculator Zone Destination zone 3 4 5 6 20 3 1 2 3 4 4 4 2 1 2 3 3 5 3 2 1 2 2 6 4 3 2 1 2 20 4 3 2 2 1 *special City
Contents Manningham at a Glance... 6 Location and Area... 6 Manningham Activity Centres... 6 Manningham Suburbs... 6 Population... 8 Forecast... 9 For
 Contents Manningham at a Glance... 6 Location and Area... 6 Manningham Activity Centres... 6 Manningham Suburbs... 6 Population... 8 Forecast... 9 Forecast 2011 2036... 9 Population Forecast... 9 Gross
The Cairns lifestylepreneur movement. Connectivity facilitating the rise of entrepreneurialism in Cairns
 The Cairns lifestylepreneur movement Connectivity facilitating the rise of entrepreneurialism in Cairns KPMG Partner Bernard Salt founded and heads KPMG Demographics, a specialist advisory group that looks
110, 110N, 111. Fares. Timetable information. 110 Cairns Central to Palm Cove 110N Late night on demand service 111 Cairns Central to Kewarra Beach
 Fares Fares are calculated on the number of zones you use in your journey. Fare zone calculator Zone Destination zone 1 2 3 4 5 20 1 1 2 3 4 5 6 2 2 1 2 3 4 5 3 3 2 1 2 3 4 4 4 3 2 1 2 3 5 5 4 3 2 1 2
Cairns. QLD (Far North Queensland)
") Cairns QLD (Far North Queensland) Key Influences Sea Change, Transport Infrastructure, Boom Towns, Government Policy, Education-Medical Infrastructure Highlights Strong population growth; revival of tourism
Cairns QLD (Far North Queensland) Key Influences Sea Change, Transport Infrastructure, Boom Towns, Government Policy, Education-Medical Infrastructure Highlights Strong population growth; revival of tourism
INTERNATIONAL VISITOR SURVEY PAPUA NEW GUINEA
 INTERNATIONAL VISITOR SURVEY PAPUA NEW GUINEA PAPUA NEW GUINEA TOURISM PROJECT PROJECT OBJECTIVES Objective 1 Objective 2 Objective 3 Grow tourism arrivals to PNG by working with government and private
Demographic Rankings
 demographics 82 Demographic Rankings Second highest level of educational attainment of major Canadian cities Calgary ranked #3 in Top 10 Places to Raise Kids Calgary ranked #19 in Overall Ranking MoneySense
Demographic Profile 2013 census
 Demographic Profile 2013 census This profile provides basic population and demographic information on the residents of the Hauraki District. Population and demographic information is important for targeting
2015 VISITOR ARRIVALS SUMMARY
 2015 VISITOR ARRIVALS SUMMARY 1. Arrivals Summary: Despite some challenges, Papua New Guinea received over 198,685 international visitors in 2015, an increase of 4% or additional 7,000 arrivals compared
110, 110N, 111. Fares. Timetable information N 111. Route descriptions 110. Ticket options 110N. Fare zone calculator
 Fares Fares are calculated on the number of zones you use in your journey. Fare zone calculator Zone Destination zone 1 2 3 4 5 20 1 1 2 3 4 5 6 2 2 1 2 3 4 5 3 3 2 1 2 3 4 4 4 3 2 1 2 3 5 5 4 3 2 1 2
SHARE
 SHARE 1300 737 782 www.realestateinvestar.com.au SHARE 1300 737 782 www.realestateinvestar.com.au brings you powerful, easy-to-use software to help you find, analyse, research and track investment property
Figure 1.1 St. John s Location. 2.0 Overview/Structure
 St. John s Region 1.0 Introduction Newfoundland and Labrador s most dominant service centre, St. John s (population = 100,645) is also the province s capital and largest community (Government of Newfoundland
Cairns Airport Aircraft Noise Information Report. Quarter (July to September)
") Cairns Airport Aircraft Noise Information Report Quarter 3 2012 (July to September) 1 Version Control Version Number Detail Prepared by Date 1 - Environment 19 December 2012 Airservices Australia. All
Cairns Airport Aircraft Noise Information Report Quarter 3 2012 (July to September) 1 Version Control Version Number Detail Prepared by Date 1 - Environment 19 December 2012 Airservices Australia. All
State of the Shared Vacation Ownership Industry. ARDA International Foundation (AIF)
") State of the Shared Vacation Ownership Industry ARDA International Foundation (AIF) This paper includes a high-level overview of the timeshare industry with a core focus on financial growth, owner demographics
State of the Shared Vacation Ownership Industry ARDA International Foundation (AIF) This paper includes a high-level overview of the timeshare industry with a core focus on financial growth, owner demographics
East Dunbartonshire Area Profile
 East Dunbartonshire Area Profile May 2015 Contents Executive Summary.. page 3 Introduction.. page 6 Population page 7 Age Structure. page 9 Population Estimates..page 11 Population Projections page 13
East Dunbartonshire Area Profile
 East Dunbartonshire Area Profile May 2014 Contents Executive Summary.. page 3 Introduction.. page 6 Population page 7 Age Structure. page 9 Population Projections page 11 Life Expectancy page 12 Ethnicity.
Statistical Picture of Aboriginal and Torres Strait Islander School Students in Australia
 Chapter 2 Statistical Picture of Aboriginal and Torres Strait Islander School Students in Australia Statistical Picture The Australian Bureau of Statistics (ABS) reported that the estimated resident Aboriginal
OUTLOOK EAST LEPPINGTON
 OUTLOOK EAST LEPPINGTON A CONTEXT ON BUSINESS, CULTURE, LIFESTYLE AND RESIDENTIAL Located within the rapidly expanding South West Growth Centre of Sydney, the East Leppington Precinct is well positioned
Page 1. Economic Impact Assessment of the Palm Island Community Company
 Page 1 Economic Impact Assessment of the Palm Island Community Company INCORPORATING: Empower North is a group of expert consultants providing select clients with an integrated service across the specialist
Annual Gross Domestic Product (Production Measure)
") June 2017 Executive Summary Page 2 Latest Quarter Economic Trends page 3 Economic Outlook page 4 Labour Force page 5 Retail Activity page 6 Building Activity page 7 Tourism Trends page 8 Local Authorities
June 2017 Executive Summary Page 2 Latest Quarter Economic Trends page 3 Economic Outlook page 4 Labour Force page 5 Retail Activity page 6 Building Activity page 7 Tourism Trends page 8 Local Authorities
Measuring the changing face of Global Sydney
 Measuring the changing face of Global Sydney Contents Global Migration Index P.1 Key findings P.2 Trends P.5 Future releases P.8 A Global Sydney Globalisation has brought society more closely together
APPENDIX 8. Leeds Socio-Economic Baseline Report. Report. July Metro and Leeds City Council
 APPENDIX 8 Leeds Socio-Economic Baseline Report Report July 2009 Prepared for: Prepared by: Metro and Leeds City Council Steer Davies Gleave West Riding House 67 Albion Street Leeds LS1 5AA +44 (0)113
Appendix 3 REMPLAN Economic Impact Modelling: New Energy Port Hedland Waste to Energy Project
 Public Environmental Review Boodarie Waste to Energy and Materials Recovery, Port Hedland Appendix 3 REMPLAN Economic Impact Modelling: New Energy Port Hedland Waste to Energy Project NEW ENERGY PORT HEDLAND
Hokitika Gorge, West Coast. newzealand.com INDIA. Market information about our Visitors and our Active Considerers
 Hokitika Gorge, West Coast INDIA Market information about our Visitors and our Active Considerers newzealand.com PAST VISITORS HISTORIC VIEW TOTAL ARRIVALS YE MARCH 2018 AUS 1,495K 39% INDIA 63K 2% USA
State of the Economy St. John's Metro
 State of the Economy St. John's Metro September 2017 Published by: Economic Development, Culture & Partnerships Division Department of Community Services City of St. John's Email: business@stjohns.ca Economic
Investor Briefings First-Half FY2016 Financial Results
 Cedar Woods Properties Limited Investor Briefings First-Half FY2016 Financial Results 26 February 2016 Cedar Woods Presentation 2 Snapshot of Achievements in FY2016 Extensive portfolio of residential estates
Domestic VFR travel to NSW
 Domestic VFR travel to NSW Year ended December 2015 INTRODUCTION The and (VFR) market is of considerable importance to Australia and NSW. It is the second largest purpose of visit segment, after the Holiday
The Economic Impact of Tourism on the District of Thanet 2011
 The Economic Impact of Tourism on the District of Thanet 2011 Prepared by: Tourism South East Research Unit 40 Chamberlayne Road Eastleigh Hampshire SO50 5JH CONTENTS 1. Summary of Results 1 2. Table of
Case study: outbound tourism from New Zealand
 66 related crime, less concerned about the stability and certainty offered by booking a package holiday, and may choose to be independent travellers, organizing their travel and itinerary themselves. Tourists
ASCOT SUBURB PROFILE
 ASCOT SUBURB PROFILE CONTENTS SUBURB HIGHLIGHTS 2 3 4 4 5 5 ASCOT & SURROUNDS LOCATION & LIFESTYLE DEMOGRAPHICS EMPLOYMENT FUTURE INFRASTRUCTURE WA MARKET TRENDS ACCESSIBILITY ENTERTAINMENT & RECREATION
State of the Economy St. John's Metro
 State of the Economy St. John's Metro May 2017 Published by: Economic Development, Culture & Partnerships Department of Community Services City of St. John's Email: business@stjohns.ca Economic Updates
Coffs Harbour s Evolving Cultural Identity
 Coffs Harbour s Evolving Cultural Identity Culture is one of the most powerful forces in our world. It's central to what we see, how we make sense of our world, and how we express ourselves 700 different
Sustainable Urban Development. Presentation to WVCC 1 December 2010
 Sustainable Urban Development Presentation to WVCC 1 December 2010 Introduction Paul Carmody Hindmarsh (Consultation Manager) Tony Adams CB Richard Ellis (Planners) Simon Parsons PTW (Architects) Brett
Economic Impact Analysis. Tourism on Tasmania s King Island
 Economic Impact Analysis Tourism on Tasmania s King Island i Economic Impact Analysis Tourism on Tasmania s King Island This project has been conducted by REMPLAN Project Team Matthew Nichol Principal
2.1 HISTORIC CONTEXT. View looking South from Main & 6th circa Typical logging scene with bullocks and skid road, 1885
 2.1 HISTORIC CONTEXT View looking North from Main & 7th circa 1889 View looking South from Main & 6th circa 1893 Typical logging scene with bullocks and skid road, 1885 The history of the Mt. Pleasant
ECONOMIC PROFILE PARK CITY & SUMMIT COUNTY, UTAH
 ECONOMIC PROFILE PARK CITY & SUMMIT COUNTY, UTAH Prepared by the Park City Chamber of Commerce & Visitors Bureau PO Box 1630, Park City, UT 84060 1.800.453.1360 Economic Profile Packet Sections 1. Introduction
AQUIS RESORT AT THE GREAT BARRIER REEF PTY LTD ENVIRONMENTAL IMPACT STATEMENT VOLUME 4 CHAPTER 24 TRANSPORT
 AQUIS RESORT AT THE GREAT BARRIER REEF PTY LTD ENVIRONMENTAL IMPACT STATEMENT VOLUME 4 CHAPTER 24 TRANSPORT 24. TRANSPORT 24.1 ROAD NETWORK 24.1.1 Existing Situation Performance of a road link has been
Chapter 1: The Population of NHS Greater Glasgow and Clyde
 Population Estimate (thousands) Chapter 1: The Population of NHS Greater Glasgow and Clyde Population Trends and Projections National Records of Scotland estimated (NRS SAPE) 1 the 2013 NHS Greater Glasgow
CHAPTER 2 COUNTY PROFILE
 COUNTY PROFILE CHAPTER 2: COUNTY PROFILE This chapter provides a profile of Amador County, California, in the planning context of parks and recreation services. This profile includes a description of the
Moderator: Greg Guatto, President & CEO, Aspen Properties
 Session C2 2:10pm ONE SIZE DOES NOT FIT ALL: UNDERSTANDING THE FACTS & FALLACIES BETWEEN EDMONTON & CALGARY AND HOW THEY ARE PERFORMING IN TODAY S ECONOMY Moderator: Greg Guatto, President & CEO, Aspen
POPULATION INTRODUCTION
 POPULATION INTRODUCTION The socio-economic data available at the time of this writing is a conglomeration of data provided by the Kentucky State Data Center, OKI Regional Council of Governments, 2010 U.S.
Norfolk Island tourism industry
 Norfolk Island tourism industry Significance of tourism The tourism industry is Norfolk Island s main export and is a major driver of the Island s economy. Using expected distribution and value of tourist
Land area 1.73 million km 2 Queensland population (December 2015) Brisbane population* (June 2015)
 Brisbane population* (June 2015)") Queensland - 18 Queensland OVERVIEW Queensland is nearly five times the size of Japan, seven times the size of Great Britain, and two and a half times the size of Texas. Queensland is Australia s second
Queensland - 18 Queensland OVERVIEW Queensland is nearly five times the size of Japan, seven times the size of Great Britain, and two and a half times the size of Texas. Queensland is Australia s second
The Economic Impact of Tourism on Calderdale Prepared by: Tourism South East Research Unit 40 Chamberlayne Road Eastleigh Hampshire SO50 5JH
 The Economic Impact of Tourism on Calderdale 2015 Prepared by: Tourism South East Research Unit 40 Chamberlayne Road Eastleigh Hampshire SO50 5JH CONTENTS 1. Summary of Results 1 2. Table of Results Table
Tim Hunter Christchurch & Canterbury Tourism Steve Clarke Canterbury Earthquake Recovery Authority (CERA) Disaster & Rebuild 16 January 2015
 Disaster & Rebuild 16 January 2015") Tim Hunter Christchurch & Canterbury Tourism Steve Clarke Canterbury Earthquake Recovery Authority (CERA) Disaster & Rebuild 16 January 2015 Every country has a disaster paradigm Flood Tropical Storm Bush
Tim Hunter Christchurch & Canterbury Tourism Steve Clarke Canterbury Earthquake Recovery Authority (CERA) Disaster & Rebuild 16 January 2015 Every country has a disaster paradigm Flood Tropical Storm Bush
Cairns Airport Aircraft Noise Information Report
 Cairns Airport Aircraft Noise Information Report Quarter 4 2013 (October to December) 1 Version Control Version Number Detail Prepared by Date 1 - Environment February 2014 Airservices Australia. All rights
The Hume Workforce Development Committee
 The Hume Workforce Development Committee Hume Regional Development Australia Accommodation and Food Labour Market Snapshot Workforce Planning Australia March 2012 Workforce Planning Australia - www.workforceplanning.com.au
The Economic Impact of Tourism on Scarborough District 2014
 The Economic Impact of Tourism on Scarborough District 2014 Prepared by: Tourism South East Research Unit 40 Chamberlayne Road Eastleigh Hampshire SO50 5JH CONTENTS 1. Summary of Results 1 2. Table of
2012 Coach & Charter Seminar. 21 February 2012 Presented by Amanda Coghlan Strategic Insights Analyst
 2012 Coach & Charter Seminar 21 February 2012 Presented by Amanda Coghlan Strategic Insights Analyst Destination NSW Lead Government agency for the NSW tourism and events sectors Established as a statutory
TOURISM NEW ZEALAND OUR VISITORS UNDERSTANDING <1% <1% <1% HISTORIC VIEW TOTAL ARRIVALS YE APRIL 2017
 TOURISM JAPAN 102K 3% NEW ZEALAND UNDERSTANDING OUR VISITORS Our market infographics are drawn from two different sources. HISTORIC VIEW: Past Visitor Research This is information collected about those
North Lanarkshire. Skills Assessment January SDS-1163-Jan16
 North Lanarkshire Skills Assessment January 2016 SDS-1163-Jan16 Acknowledgement The Regional Skills Assessment Steering Group (Skills Development Scotland, Scottish Enterprise, the Scottish Funding Council
Rotorua. newzealand.com. argentina. Market information about our Visitors and our Active Considerers
 Rotorua argentina Market information about our Visitors and our Active Considerers newzealand.com PAST VISITORS HISTORIC VIEW TOTAL ARRIVALS YE MARCH 2018 AUS 1,495K 39% INDIA 63K 2% USA 340K 9% GERMAN
JATA Market Research Study Passenger Survey Results
 JATA Market Research Study Passenger Survey Results Prepared for the Jackson Area Transportation Authority (JATA) April, 2015 3131 South Dixie Hwy. Suite 545 Dayton, OH 45439 937.299.5007 www.rlsandassoc.com
What will Mackay be like in 5 years time?
 What will Mackay be like in 5 years time? Information booklet Presentation to Mackay Region Chamber of Commerce by Dr Kim Houghton Director Strategic Economic Solutions 4 September 2013 Strategic Economic
BE PART OF MORE MORE
 BE PART OF Welcome to Arsenal Yards Just west of Boston, along the Charles River, where Cambridge meets Boston, the next great neighborhood is underway. A one million + square foot mixed-use redevelopment
Mayor Julia Leu Douglas Shire Council
 Mayor Julia Leu 2018 Where the rainforest meets the reef Douglas Shire is known for its spectacular rainforest covered ranges, beautiful beaches, agriculture, Indigenous culture and a diversity of vibrant
June TEQ Marketing Strategy 2025 Executive Summary
 June 2017 TEQ Marketing Strategy 2025 Executive Summary Vision and The Opportunity Tourism and Events Queensland s (TEQ) Marketing Strategy 2025 provides a platform to realise the TEQ vision of inspiring
State of the Economy St. John's Metro
 State of the Economy St. John's Metro Published by: Department of Economic Development, Tourism & Culture City of St. John's Email: business@stjohns.ca Although every effort has been made to ensure the
BE PART OF MORE MORE
 BE PART OF Welcome to Arsenal Yards Just west of Boston, along the Charles River, where Cambridge meets Boston, the next great neighborhood is underway. A one million + square foot mixed-use redevelopment
Holmview, BRISBANE QLD
 Holmview, BRISBANE QLD HAVEN HILL - LOCATION Holmview PRIME LOCATION LOCATION Holmview is part of the Logan City Council region and is located nearly half way between the Gold Coast and Brisbane on the
Using the Arts to Bolster Your County s Economy
 Using the Arts to Bolster Your County s Economy The Honorable Allison Mays Washington County, Virginia Board of Supervisors Director of Corporate and Government Relations, Barter Theatre Washington County
East Lothian. Skills Assessment January SDS-1154-Jan16
 East Lothian Skills Assessment January 2016 SDS-1154-Jan16 Acknowledgement The Regional Skills Assessment Steering Group (Skills Development Scotland, Scottish Enterprise, the Scottish Funding Council
Sunshine Coast Residential Market
 Sunshine Coast Residential Market Warwick Temby HIA Executive Director, QLD HOUSING INDUSTRY ASSOCIATION April 2010 Overview Look at international, national and local events that are shaping the outlook
CRUISE ACTIVITY IN BARCELONA. Impact on the Catalan economy and socioeconomic profile of cruise passengers (2014)
") CRUISE ACTIVITY IN BARCELONA Impact on the Catalan economy and socioeconomic profile of cruise passengers (2014) 2 CRUISE ACTIVITY IN BARCELONA 2014 Impact on the Catalan economy and socioeconomic profile
CRUISE ACTIVITY IN BARCELONA Impact on the Catalan economy and socioeconomic profile of cruise passengers (2014) 2 CRUISE ACTIVITY IN BARCELONA 2014 Impact on the Catalan economy and socioeconomic profile
WRIGHT DENMAN PROSPECT AREA PROFILE MACRO PLAN DIMASO
 WRIGHT DENMAN PROSPECT AREA PROFILE CONTENTS WHY CANBERRA? PG 04 INVEST IN THE MOLONGLO VALLEY PG 06 3 PROPERTY GROUP PG 08 DETAILED INVESTMENT ANALYSIS PG 11 Population Growth Demographics Tenure & Typology
Population, Territory and Sustainable Development The Case of the Caribbean Sub Region
 Population, Territory and Sustainable Development The Case of the Caribbean Sub Region Author: Godfrey St. Bernard Sir Arthur Lewis Institute of Social and Economic Studies The University of the West Indies
HEALTH SECTOR ECONOMIC INDICATORS REPORT
 HEALTH SECTOR ECONOMIC INDICATORS REPORT For: Mid North Coast Local Health District Report prepared by: April 2013 Table of Contents Introduction 3 Executive Summary 4 Output 5 Value-Added 7 Workforce
Manawatu District Economic Profile
 Manawatu District Economic Profile Our community Population has grown by 1,000 residents since 2014 to reach 29,800. Population is 86.4% European, with Maori 14.3% of the population. This compares with
The RV Travellers. Coming ready or not!
 The RV Travellers Coming ready or not! About the research Focused on travellers using free rest areas Also covers CMCA members Desktop research Standard market research accuracy Based on random sampling
VisitScotland Scottish Accommodation Occupancy Survey October to December Quarterly Report
 VisitScotland Scottish Accommodation Occupancy Survey October to December Quarterly Report Contents Overview... 3 Executive Summary... 3 Quarter 3 Data Update... 4 Serviced Accommodation... 4 Serviced
Central Highlands Regional Population Forum
 Central Highlands Regional Population Forum, Emerald, 18 February 25 Central Highlands Regional Population Forum Presenters: Alison Taylor and Ross Barker Planning Information and Forecasting Unit Department
Whangaroa Harbour, Northland. newzealand.com. united kingdom. Market information about our Visitors and our Active Considerers
 Whangaroa Harbour, Northland newzealand.com united kingdom Market information about our Visitors and our Active Considerers PAST VISITORS HISTORIC VIEW TOTAL ARRIVALS YE SEPTEMBER 2017 CHINA 408K 11% JAPAN
Milford Sound, Fiordland. newzealand.com. germany. Market information about our Visitors and our Active Considerers
 Milford Sound, Fiordland germany Market information about our Visitors and our Active Considerers newzealand.com PAST VISITORS HISTORIC VIEW TOTAL ARRIVALS YE SEPTEMBER 2017 CHINA 408K 11% JAPAN 102K 3%
Regional Universities Network. Introduction. Regional Universities Network. Economic Impact of the Universities in the Regional Universities Network
 Regional Universities Network Economic Impact of the Universities in the Regional Universities Network Introduction The Regional Universities Network (RUN) is a network of six universities with headquarters
Sunshine Coast: Kawana Health Campus. December 2013
 Sunshine Coast: Kawana Health Campus December 2013 Kawana Health Campus Residential development at Birtinya* Overview The Kawana Health Campus will comprise state-of-the-art public and private hospital
Economic Impact of Tourism in Hillsborough County September 2016
 Economic Impact of Tourism in Hillsborough County - 2015 September 2016 Key findings for 2015 Almost 22 million people visited Hillsborough County in 2015. Visits to Hillsborough County increased 4.5%
More information at
 Report Information More information at https://www.htfmarketreport.com/reports/1266534 Global Flight Control Computer Market Research Report 2018 Report Code: HTF1266534 Pages: 91 Price: 1-User PDF : $
CHAPTER 3: COMMUNITY PROFILE
 CHAPTER 3: COMMUNITY PROFILE Chapter 3 includes the following information: 1. Community Context 2. The Land 3. The People Who Live Here 4. The Housing Landscape 5. The Economy 6. Past and Future Growth
Queensland Economic Update
 Queensland Economic Update Chamber of Commerce & Industry March 2018 cciq.com.au Queensland Economic Update: Summary National Accounts GDP expanded 2.3% during calendar year 2017. QLD state final demand
PROFILE OF THE PUERTO RICAN POPULATION IN UNITED STATES AND PUERTO RICO: 2008
 PROFILE OF THE PUERTO RICAN POPULATION IN UNITED STATES AND PUERTO RICO: 2008 Sonia G. Collazo, Camille L. Ryan, Kurt J. Bauman U.S. Census Bureau Housing and Household Economic Statistics Division This
Ontario Tourism Facts & Figures
 IN THIS ISSUE Economic Outlook Ontario and Canada Tourism Statistics International Border Crossings International Travel Account Accommodations Tourism Related Employment Visitor Inquiries Travel Price
Is uneven economic growth dividing Australian society? 14 March 2017
 Is uneven economic growth dividing Australian society? 14 March 2017 Outline Growing national economy hides a concerning spatial distribution. The big cities and mineral production are driving the national
Land area 1.73 million km 2 Queensland population (as at 31 December 2017) Brisbane population* (preliminary estimate as at 30 June 2017)
 Brisbane population* (preliminary estimate as at 30 June 2017)") Queensland - 11 Queensland OVERVIEW Queensland is nearly five times the size of Japan, seven times the size of Great Britain, and two and a half times the size of Texas. Queensland is Australia s second
Queensland - 11 Queensland OVERVIEW Queensland is nearly five times the size of Japan, seven times the size of Great Britain, and two and a half times the size of Texas. Queensland is Australia s second
2017 VISITOR STATISTICS WASHINGTON, DC
 2017 VISITOR STATISTICS WASHINGTON, DC TOTAL VISITATION TO WASHINGTON, DC WASHINGTON, DC (DISTRICT OF COLUMBIA) VISITORS (IN MILLIONS) 20 15 10 5 Overseas Domestic 14.9 1.0 13.9 15.9 1.1 16.6 16.3 1.4
The Residential Outlook for South Australia
 The Residential Outlook for South Australia Matthew King Economist HOUSING INDUSTRY ASSOCIATION February 2011 Overview Economic backdrop Other important matters Interest rates & bank lending Renovations
Washington, DC 2013 Visitor Statistics
 Washington, DC 2013 Visitor Statistics Washington, DC 2013 Visitor Statistics TOTAL VISITATION TO WASHINGTON, DC In Millions 20 18 16 14 15.8 15.4 1.0 0.8 14.8 15.1 14.9 1.0 1.0 1.0 15.9 1.1 16.6 1.4 16.3
Tried & True Markets: France Germany UK
 Tried & True Markets: France Germany UK Agenda Facts & Figures: France Germany UK A huge piece of the European cake! The characteristic travelers from France, Germany & UK Summary & general tips Questions
Coastal Tourism The End of the Line or a Renaissance Waiting to Happen? Jason Freezer Associate Director National Coastal Tourism Academy
 Coastal Tourism The End of the Line or a Renaissance Waiting to Happen? Jason Freezer Associate Director National Coastal Tourism Academy 60 73 67 106 247 241 243 238 Coastal Tourism Big Business at a
Land area 1.73 million km 2 Queensland population (as at December 2016) Brisbane population* (preliminary estimate as at 30 June 2016)
 Brisbane population* (preliminary estimate as at 30 June 2016)") Queensland - 11 Queensland OVERVIEW Queensland is nearly five times the size of Japan, seven times the size of Great Britain, and two and a half times the size of Texas. Queensland is Australia s second
Queensland - 11 Queensland OVERVIEW Queensland is nearly five times the size of Japan, seven times the size of Great Britain, and two and a half times the size of Texas. Queensland is Australia s second
Puerto Ricans in Georgia, the United States, and Puerto Rico, 2014
 Issued September 2016 Centro DS2014GA-14 Puerto Ricans in Georgia, the United States, and Puerto Rico, 2014 In 2014, an estimated 89,462 Puerto Ricans lived in Georgia and accounted for 1.7 percent of
WHY INVEST IN QUEENSLAND URBIS MARKET OUTLOOK
 WHY INVEST IN QUEENSLAND URBIS MARKET OUTLOOK WHO IS URBIS? PERTH AUSTRALIA ADELAIDE BRISBANE GOLD COAST SYDNEY MELBOURNE Urbis is an integrated multi-disciplinary consulting firm with a unique and comprehensive
The Economic Impact of Tourism in Buncombe County, North Carolina
 The Economic Impact of Tourism in Buncombe County, North Carolina 2017 Analysis September 2018 Introduction and definitions This study measures the economic impact of tourism in Buncombe County, North
Projected demand for independent schools in New South Wales over the next 40 years: Summary report
 Projected demand for independent schools in New South Wales over the next 40 years: Summary report Association of Independent Schools of New South Wales 22 October 2014 Glossary ABS ACT AIS ASGS DAE FTE
The Economic Impact of Tourism on Oxfordshire Estimates for 2013
 The Economic Impact of Tourism on Oxfordshire Estimates for 2013 County and District Results September 2014 Prepared by: Tourism South East Research Unit 40 Chamberlayne Road Eastleigh Hampshire SO50 5JH
California: Housing Bellwether or Not?
 California: Housing Bellwether or Not? GSU Economic Forecasting Conference November 19, 2014 Robert A. Kleinhenz, Ph.D. Chief Economist,, LAEDC Outline Economic Comparisons: California Georgia Los Angeles
WHAT ARE THE TRENDS TO LOOK OUT FOR?
 WHAT ARE THE TO LOOK OUT FOR? Prepared by IPK International on behalf of ITB Berlin, The World s Leading Travel Trade Show INTRODUCTION The global tourism industry continues its success story with another
DUNOON PROFILE May 2014
 www.hie.co.uk DUNOON PROFILE May 2014 DUNOON PROFILE INTRODUCTION The Dunoon profile uses 2011 Census data and other available data sources to present an up-to-date analysis of its population and labour
Puerto Ricans in Ohio, the United States, and Puerto Rico, 2014
 Issued April 2016 Centro DS2015US-12 Puerto Ricans in Ohio, the United States, and Puerto Rico, 2014 In 2014, Ohio had the tenth largest number of Puerto Ricans in the United States with 108,174 residents,