East Dunbartonshire Area Profile
|
|
|
- Esmond Milton Lawrence
- 5 years ago
- Views:
Transcription

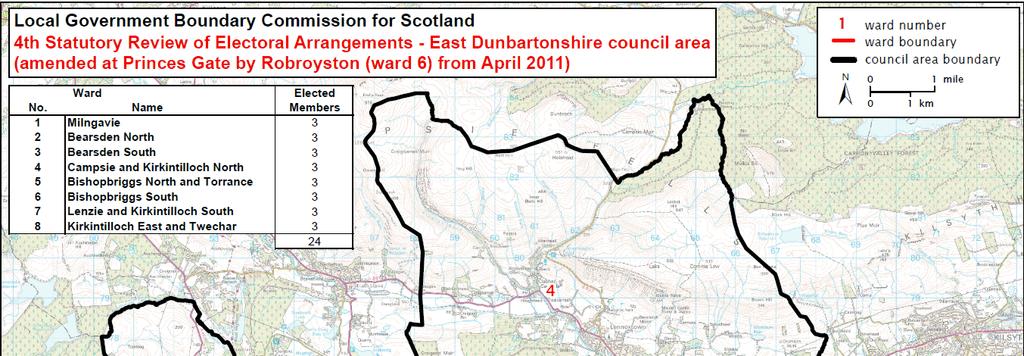
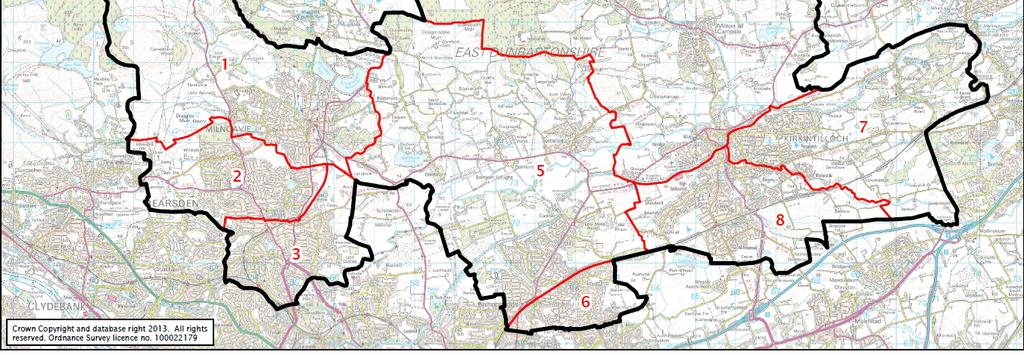
1 East Dunbartonshire Area Profile May 2015
2 Contents Executive Summary.. page 3 Introduction.. page 6 Population page 7 Age Structure. page 9 Population Estimates..page 11 Population Projections page 13 Life Expectancy page 14 Ethnicity. page 15 National Identity. page 16 Country of Birth.. page 17 Marital Status page 18 Language page 19 English language skills.. page 19 Language used at home. page 20 Religion.. page 21 Migration.. page 22 Housing.. page 23 Tenure. page 23 Household composition. page 24 Dwelling Type...page 26 Car and Van Availability page 27 Local Economy.. page 28 Employment and unemployment page 28 Economically active page 29 Economically inactive.. page 30 Job seekers allowance claimants. page 31 Occupation.. page 32 Education. page 33 Highest level of qualification.. page 33 1
3 School leaver destination.. page 35 Attainment.. page 36 Crime/Community Safety... page 37 Crime rates per 10,000 population. page 35 Accidental and deliberate fires.. page 38 Health.. page 39 General Health.. page 39 Limiting health problem or disability. page 40 Provision of unpaid care. page 41 Travel to work or study.. page 42 Active travel to work. page 43 Distance travelled to work.page 44 Scottish Index of Multiple Deprivation.. page 45 2
4 Executive Summary The East Dunbartonshire Area Profile provides an overview of the population and its detailed characteristics. The information is provided at Scotland, East Dunbartonshire and Ward level where data is available. The data used was from a variety of sources including the 2011 Census, NOMIS (official labour market statistics website) and Scottish Neighbourhood Statistics and was the most up to date at the time of writing this document. The Census in Scotland was conducted by National Records of Scotland and took place on 27 March 2011 and involved around 2 million households. The first census results were released by National Records of Scotland (NRS) in December 2012 with further results released on a rolling basis throughout Further data will continue to be released throughout 2014/15. All released data is available on the Scotland s Census website Key Findings 1. Since 2001, the population of East Dunbartonshire is estimated to have decreased by 3,217 people (-3%). Over the last ten years there has been a decrease in the number of children aged 15 and under. The highest increase was in the age group. This follows the projected population trend of an ageing population highlighted in the most recent population projections. 2. The Registrar General for Scotland s most recent population projections suggest that the population of East Dunbartonshire will decline by nearly 7% over the next 25 years. The overall projected population change is a result of a combination of natural change (the difference between the number of births and deaths) and migration. Based on these projections, by 2037, 16% of the population will be under 16 years of age, 50% will be aged 16-64, 33% aged 65 and over and 19% will be aged 75 and over. 3. According to National Records of Scotland, male and female life expectancy was highest in East Dunbartonshire. Males in East Dunbartonshire can expect to live for 80.5 years, nearly four years longer than the Scottish average. Females can expect to live for 83.9 years, nearly three years longer than Scotland as a whole. A high percentage of East Dunbartonshire residents (84.9%) reported in the Census that their health was very good or good, 2% higher than the Scottish average. 4. The 2011 Census shows that 4.2% of East Dunbartonshire s population were from a minority ethnic group, an increase of around 1% since the last census in The Asian population is the largest minority ethnic group (3.3%) in East Dunbartonshire. Within this, Indian is the largest individual category, accounting for 1.5% of the total population. 5. There were variations in the tenure of households by council area. East Dunbartonshire was one of only two local authorities where more than 80% of households owned their property (81.2%), this is 20% higher than the Scottish average of 61.6%. East Dunbartonshire also had a high percentage of car ownership across the area with 43.1% of households with access to one car or van and 30.2% with two cars or vans available for use. The majority of residents across East Dunbartonshire travelled to work or study by driving a car or van (45%), nearly 5% higher than the Scottish average. 6. Across East Dunbartonshire there were 28.4% one person households. East Dunbartonshire and Dumfries & Galloway had the highest proportion (11% of all households, 5,000 and 7,000 respectively) of households with all aged 65 and over families. 3
5 7. Employment is high with figures from NOMIS showing that East Dunbartonshire has a high percentage of people in employment (73.9%), nearly 2% higher than the Scottish average. However, there has been a slight decrease in the percentage of people in employment between 2013 and 2014 from 77.2% to 73.9%. Unemployment has remained stable with a very slight increase (0.1%) between 2013 and 2014 to 5.0%, just over 2% lower than the Scottish average. 8. Attainment and school leaver destinations are high across East Dunbartonshire. During 2012/13, 98.3% of pupils in East Dunbartonshire gained English and Maths at SCQF level 3 or above, 4% higher than the Scottish average (94.3%). The results of the school leaver destination return showed 93.1% of school leavers in a positive destination (higher education, further education, employment, voluntary work or training) in 2011/12 with this figure rising to 95.6% in 2012/ According to National Records of Scotland s recent Migration Report, East Dunbartonshire experienced a population increase due to in-migration combined with a very low natural change. During 2012/13 there was an estimated total net migration into East Dunbartonshire of 3,507 people and a total net migration out of 3,400 people resulting in a positive total net migration of 107 people. The first positive total net migration since 1994/95 was seen in 2011/12 (263 people). There has been a further positive net migration of 107 in 2012/13. Emerging Trends Overall East Dunbartonshire as a whole continues to compare favourably to Scotland and other local authority areas with a high percentage of home ownership, car ownership, low unemployment and high percentage of economically active residents. However, throughout this analysis, Ward 8 Kirkintilloch East & Twechar stands out as the most deprived of the Multi Member Wards. This is consistent with the findings of the Scottish Index of Multiple Deprivation The 2011 Census results show Kirkintilloch East & Twechar had the lowest percentage of owned homes and the highest percentage of council rented (16.6%) and other social rented (17.7%) accommodation compared to other Wards and East Dunbartonshire as a whole. It also had the highest percentage of those aged claiming job seekers allowance (4.9%) compared to other Wards and double that of East Dunbartonshire as a whole (2.4%). The census highlighted that the highest percentage of residents reporting their health as bad or very bad (7%) and their day to day activities limited because of a health problem or disability (11.2%) were found in the Kirkintilloch East & Twechar Ward. In contrast, 50% of homes in Bearsden South were owned outright, 11% higher than Kirkintilloch East & Twechar. Bearsden South also had the lowest percentage of council rented (1.4%) and other social rented (0.1%) accommodation compared to other Wards. Bearsden North had the lowest percentage of those aged claiming job seekers allowance (1%) and the lowest percentage of residents reporting their general health as bad or very bad (2.6%). Residents in Bearsden North reporting their day to day activities were limited a lot due to a health problem or disability was also low at 5.4%. Future The census is currently the only national survey that systematically captures and records information about the population at small areas. It provides the official population and socio-economic statistics. In the future there are expected to be changes to the ways in which population is measured. 4
6 The Beyond 2011 Programme was established by National Records of Scotland to explore the future provision of population and socio-demographic statistics in Scotland. The aim of the programme was to investigate a range of alternative solutions to the traditional census, including the possibility of using administrative sources or developing a more cost-effective and efficient census design. The decision to review the traditional census was agreed across the United Kingdom. National Records of Scotland announced on 27 March 2014 that it intends to focus on planning for a census in 2021 which will be primarily online, while offering alternative modes of completion where necessary. It also aims to make the best use of technology and administrative data in its design, building on the online approach used successfully in the 2011 Census. The decision to focus plans on a census in 2021 in Scotland was based on a variety of evidence, including results from research, stakeholder engagement, a user consultation and international experience. A final decision will be taken in 2016 on the basis of the business case. A programme of consultation and engagement will continue by National Records of Scotland to understand user requirements and shape the design of the 2021 Census. The findings from Beyond 2011 to date will be incorporated into the programme of work. Further research will be carried out to enable greater use of administrative data and surveys in the future. England and Wales (UK Statistics Authority) also plan to carry out a modernised census in 2021 building on an online approach. 5
7 Introduction The census is a count of all people and households in the country, and provides an estimate of the population and a detailed analysis of its characteristics. The 2011 Census in Scotland was conducted on 27 th March 2011 and involved around 2 million households. The census covers topics such as households, health, migration, ethnic group, national identity, religion, qualifications, employment and transport. The census counts everyone in Scotland once every ten years. It is the country s biggest statistics gathering exercise. From the public s responses to census questions, National Records of Scotland produce a range of anonymised statistics to provide an accurate snapshot of Scotland s population and reveal changes in Scotland s society since the last census in The census statistics are used by central and local government and other organisations to decide where public money will be spent, for example, on services such as education, transport, housing and health care. The first results from the census were released by National Records of Scotland in December 2012, over a year and a half after Census day, as it takes time to collect, process and check the vast amount of data collected in the census. National Records of Scotland tried to get the balance right between publishing the results as quickly as possible and ensuring that the quality of the information, upon which key decisions are based, is correct. Census data has been released in phases as the results are complex and time consuming to produce and there is a vast array of data to be produced. Later releases are more detailed and complex than the first release data. It would therefore take longer to publish results if all the data was to be published at once. This summary report sets out the key results from the 2011 Census that have been released at Local Authority and Ward level, revealing some of the mains issues for East Dunbartonshire. Where appropriate, it highlights changes that have occurred since the previous census. Data has also been used from a variety of other sources including NOMIS and Scottish Neighbourhood Statistics. Colour coding has been used throughout the tables in this document with green highlighting a positive variance and red highlighting a negative variance compared to East Dunbartonshire data. An uncoloured box indicates no variance. For example: No cars or vans East Dunbartonshire 19% Bearsden North 10.3% Red negative variance Campsie & Kirkintilloch North 22.6% Green positive variance Milngavie 19% No colour no variance 6
8 Population According to the 2011 Census East Dunbartonshire has an estimated population of 105,026, a decrease of 3,217 (-3%) since the 2001 census. In contrast Scotland s population increased by 5% since the last census, this represents the fastest growth rate between two censuses in the last century. The graph below shows the population of East Dunbartonshire and the eight Wards in 2001 and , ,000 80,000 60,000 40,000 20,000 0 Population Table 1 shows the population for the last two censuses of East Dunbartonshire and its Wards. Bearsden North, Bishopbriggs South, Kirkintilloch East & Twechar and Milngavie have all seen a decrease in their population since the last census, with Kirkintilloch East & Twechar seeing the largest decrease (-1969) of all the Ward areas. Bearsden South, Bishopbriggs North & Torrance, Campsie & Kirkintilloch North and Lenzie & Kirkintilloch South have all had an increase in their population over the last 10 years. The largest increase in population was in Bearsden South with an increase of 335 residents. Table 1: Population 2001 and Population 2011 Population Difference between 2001 and 2011 East Dunbartonshire 108, ,026-3,217 Bearsden North 14,974 13,909-1,065 Bearsden South 12,993 13, Bishopbriggs North & Torrance 13,753 13, Bishopbriggs South 12,635 12, Campsie & Kirkintilloch North 11,825 12, Kirkintilloch East & Twechar 14,714 12,745-1,969 Lenzie & Kirkintilloch South 13,503 13, Milngavie 13,846 13, Source: 2001 and 2011 Census 7
9 The chart below shows the structure of the population by 5 year age band in 2001 and It highlights the decrease in those aged 14 and under, along with a marked decrease in those aged The highest increase was in the age group, followed by those aged and This follows the predicted trend of an ageing population highlighted in the most recent population projections. East Dunbartonshire Population to 4 5 to 9 10 to to to to to to to to to to to to to to to to Figure 1: Population structure by age 2001 and 2011 The proportion of male and females in all Wards is consistent with East Dunbartonshire as a whole with a higher percentage of females than males. Table 2: Percentage male and female Total Population Percentage Males Percentage Females Scotland 5,295, % 51.5% East Dunbartonshire 105, % 51.8% Bearsden North 13, % 51.8% Bearsden South 13, % 51.9% Bishopbriggs North & Torrance 13, % 51.4% Bishopbriggs South 12, % 52.4% Campsie & Kirkintilloch North 12, % 52.2% Kirkintilloch East & Twechar 12, % 51.6% Lenzie & Kirkintilloch South 13, % 51.1% Milngavie 13, % 52.4% Source: 2011 Census 8

10 Age Structure The chart shows the percentage of children, working age and pensionable age residents in East Dunbartonshire. The percentage of children has decreased by around 2.5% since the 2001 Census, the working age population has also decreased by nearly 2%, and there has been a 4% rise in the percentage of the population aged over % East Dunbartonshire % 63% % Children (0-15) % of Working Age (16-64) % of Pensionable Age (65+) Source: 2011 Census Age Structure 65+ Years Table 3 shows the structure of the older population of East Dunbartonshire. The percentage of the population aged over 65 in Bearsden North (20.4%), Bearsden South (22.1%), Milngavie (21.7%) and Bishopbriggs North & Torrance (22.0%) was slightly higher than East Dunbartonshire as a whole (19.4%). Milngavie had the highest percentage of residents over the age of 75 (11.1%), followed by Bishopbriggs North & Torrance (10.5%), Bearsden South (10.4%) and Bearsden North(9.5%) who all had a higher percentage of over 75 s compared to East Dunbartonshire as a whole (9%). Kirkintilloch East & Twechar had the lowest percentage of those aged 65+ (15.5%), 75+ (6.7%) and 85+ (1.4%) compared to other Wards. Milngavie had the highest percentage of residents aged 85+ (2.9%) compared to other Wards and East Dunbartonshire as a whole (2.1%). Table 3: Age structure 65+ years Total 65+ Percentage of population Percentage of population Percentage of population 85+ Scotland 5,295, , % 408, % 105, % East Dunbartonshire 105,026 20, % 9, % 2, % Bearsden North 13,909 2, % 1, % % Bearsden South 13,328 2, % 1, % % Bishopbriggs North & Torrance 13,807 3, % 1, % % Bishopbriggs South 12,309 2, % % % Campsie & Kirkintilloch North 12,047 2, % % % Kirkintilloch East & Twechar 12,745 1, % % % Lenzie & Kirkintilloch South 13,645 2, % 1, % % Milngavie 13,236 2, % 1, % % Source: 2011 Census 9
11 Age Structure 0-64 years Table 4 below shows the broad age structure of East Dunbartonshire. The age structure of East Dunbartonshire is broken down as follows 4.9% of the population was aged 0-4 years, 12.9% aged 5-15 and 62.7% aged between years. When compared to Scotland East Dunbartonshire had a slightly lower percentage of children under the age of 4 (0-4) and those aged and had a slightly higher percentage of 5-15 year olds. Kirkintilloch East & Twechar had the highest percentage of children aged 0-4 years (5.9%). Bearsden North had the highest percentage of children aged 5-15 years (14.4%) compared to other wards in East Dunbartonshire and nearly 2% more than East Dunbartonshire as a whole. Bishopbriggs South and Campsie & Kirkintilloch North also had a slightly higher percentage of residents aged (65.5% and 65.2% respectively) when compared to East Dunbartonshire (62.7%). Table 4: Age structure aged 0-64 years Total 0-4 % % % Scotland 5,295, , % 623, % 3,488, % East Dunbartonshire 105, % % 65, % Bearsden North 13, % 2, % 8, % Bearsden South 13, % 1, % 8, % Bishopbriggs North & Torrance 13, % 1, % 8, % Bishopbriggs South 12, % 1, % 8, % Campsie & Kirkintilloch North 12, % 1, % 7, % Kirkintilloch East & Twechar 12, % 1, % 8, % Lenzie & Kirkintilloch South 13, % 1, % 8, % Milngavie 13, % 1, % 8, % Source: 2011 Census 10
12 Population Estimates The population estimates are based on the 2011 Census. The population is aged on one year (that is, the 0 year olds become 1 year olds, and so on), the number of births in the year are added, the number of deaths subtracted and adjustments are made for estimated migration and other changes in special populations. It is important to remember that while the number of births and deaths are considered to be almost complete, there is no comprehensive source of migration data for moves within Scotland, or to and from the rest of the UK and the rest of the world. Estimates of migration are made using the best proxy sources available including General Medical Practitioner (GP) registrations and survey information. Therefore, any error in the population estimates is likely to be due to the migration estimates, particularly the international estimates. Further information on population estimates can be found on the National Records of Scotland website The following tables and information are from the Mid 2013 Population Estimates which were produced by National Records of Scotland and published on the 26 June Age Structure The table below provides the broad age structure of East Dunbartonshire. According to the 2013 mid-year population estimates 5% of the population of East Dunbartonshire were aged 0-4, 12.5% were aged 5-15 and 61.9% of the population were aged East Dunbartonshire had a slightly lower percentage of children aged 0-4 and those aged when compared to Scotland (5.5%) and had a slightly higher percentage of children aged 5-15 years. Compared to other Wards Kirkintilloch East & Twechar had the highest percentage of children aged 0-4 (6.1%), this was also higher than East Dunbartonshire as a whole (5.5%). Bishopbriggs North & Torrance had the lowest percentage of children aged 0-4 (3.8%) compared to other Wards. Compared to other Wards Lenzie & Kirkintilloch South had the lowest percentage of children aged 5-15 years (11.6%) and Bearsden North had the highest percentage (14.2%). The highest percentage of residents aged were in Bishopbriggs South (64.9%) and Bearsden South had the lowest percentage of residents in this age group (58.7%). Table 5: Age structure aged 0-64 (2013 mid-year estimates) Total 0-4 % % % Scotland % % % East Dunbartonshire % % % Bearsden North % % % Bearsden South % % % Bishopbriggs North & Torrance % % % Bishopbriggs South % % % Campsie & Kirkintilloch North % % % Kirkintilloch East & Twechar % % % Lenzie & Kirkintilloch South % % % Milngavie % % % Source: 2013 Mid-Year Population Estimates 11
13 The table below shows the age structure of the older population. According to the 2013 mid-year population estimates for East Dunbartonshire, 20.8% of the population were aged 65 and over, 9.7% were aged 75 and over and 2.5% were aged 85 and over. Compared to other Wards Bearsden South had the highest percentage of people aged 65 and over (24.4%) followed by Bishopbriggs North and Torrance (23.9%), Milngavie (22.8%) and Bearsden North (21.7%). Kirkintilloch East & Twechar had the lowest percentage of residents aged 65 and over (17.2%) followed by Bishopbriggs South (17.9%), Campsie & Kirkintilloch North (18.9%) and Lenzie & Kirkintilloch South (19.4%). Bearsden South and Bishopbriggs North & Torrance had the highest percentage of residents aged 75+ (both 11.9%). Kirkintilloch East & Twechar had the lowest percentage of residents in this age group (7.4%), just over 2% lower than East Dunbartonshire as a whole. Bearsden South had the highest percentage of residents in the 85+ age group (3.8%) and Kirkintilloch East & Twechar had the lowest percentage of residents in this age group (1.6%). Table 6: Age structure 65+ years (2013 mid-year estimates) Total 65+ Percentage of population Percentage of population Percentage of population 85+ Scotland % % % East Dunbartonshire % % % Bearsden North % % % Bearsden South % % % Bishopbriggs North & Torrance % % % Bishopbriggs South % % % Campsie & Kirkintilloch North % % % Kirkintilloch East & Twechar % % % Lenzie & Kirkintilloch South % % % Milngavie % % % Source: 2013 Mid-Year Population Estimates The proportion of male and females in all Wards is consistent with East Dunbartonshire as a whole with a higher percentage of females than males, apart from Lenzie and Kirkintilloch South which has slightly more males than females. Table 7: Percentage male and female (2013 mid-year estimates) Total Percentage Percentage Population Males Females Scotland % 51.5% East Dunbartonshire % 51.5% Bearsden North % 51.4% Bearsden South % 52.4% Bishopbriggs North & Torrance % 51.6% Bishopbriggs South % 52.2% Campsie & Kirkintilloch North % 52.2% Kirkintilloch East & Twechar % 52.0% Lenzie & Kirkintilloch South % 48.2% Milngavie % 52.2% Source: 2013 Mid-Year Population Estimates 12
14 Population Projections Recent population projections by the Registrar General for Scotland suggest that the population of East Dunbartonshire will decline by -6.8% over the next 25 years. This is a slight improvement from the 2010 based projections where the decrease was projected to be -9.8%. The overall projected population change is a result of a combination of natural change (the difference between the number of births and deaths) and migration. East Dunbartonshire is projected to experience decreases from both migration and natural change. Significantly the number of children (0-15 years) is projected to decrease by % during this period, whilst the population of pensionable age is expected to rise by 25.4%. The working age population is predicted to decrease by -17.2%. The highest population increase will be seen in those aged 75 and over with a predicted increase of 93%. The graph below shows the projected change in population for East Dunbartonshire over the next 25 years. 30,000 Population Projections ,000 20,000 15,000 10, , Source: National Records of Scotland, Population Projections for Scottish Areas (2012 based) Based on these projections, by 2037, 16.2% of the population will be under 16 years of age, 50.3% will be aged 16-64, 33.5% aged 65 and over and 19.5% of the population will be 75 and over. It should be noted that population projections have limitations. A projection is a calculation showing what happens if particular assumptions are made. The sub-national projections are trend based. They are, therefore, not policy based forecasts of what the government expects to happen. Many social and economic factors influence population change including policies adopted by both central and local government. The relationships between the various factors are complex and largely unknown. 13
15 Life Expectancy According to National Records of Scotland male and female life expectancy was highest in East Dunbartonshire Council area. Males in East Dunbartonshire can expect to live for 80.5 years, nearly four years longer than the Scottish average. Females can expect to live for 83.9 years, nearly three years longer than Scotland as a whole. 84 Life Expectancy at birth East Dunbartonshire Scotland Males Females Source: National Records of Scotland life expectancy for areas in Scotland, The table below shows that life expectancy in East Dunbartonshire has been increasing for both males and females over the last ten years, male life expectancy has increased 3.4 years and 3.5 years for females. Table 8: Life Expectancy Males Females Scotland 73.5 years 75.1 years 76.9 years 78.8 years 79.9 years 81.0 years East Dunbartonshire 77.1 years 78.1 years 80.5 years 80.4 years 82.4 years 83.9 years Source: National Records of Scotland Life Expectancy for Administrative Areas within Scotland
16 Ethnicity The census question on ethnicity changed between 2001 and In 2011, tick boxes were added for White: Polish and White: Gypsy/Traveller, African was also included as a separate category. Table 5 shows the broad ethnic breakdown of East Dunbartonshire. 4.2% of people in East Dunbartonshire were from minority ethnic groups, an increase of 1% since the 2001 Census. The Asian population was the largest minority ethnic group (3.3%) in East Dunbartonshire. Within this, Indian was the largest individual category, accounting for 1.5% of the total population. Bearsden South had the highest proportion of residents from an Asian community at 6.7%, followed by Bearsden North (4.9%) and Bishopbriggs South (4.8%). The majority of East Dunbartonshire residents were white Scottish (88.6%), 4% higher than the Scottish average. Kirkintilloch East & Twechar had the highest percentage of residents that were white Scottish (94%) compared to other Wards. East Dunbartonshire Ethnicity White Scottish White Other British White Irish White - Polish White Other Asian Other ethnic Groups Source: 2011 Census Table 9: Broad ethnic group as a percentage of population White Scottish White Other British White Irish 15 White - Polish White Other Asian, Asian Scottish or Asian British Other ethnic Groups Scotland 84.0% 7.9% 1.0% 1.2% 1.9% 2.7% 1.4% East Dunbartonshire 88.6% 4.8% 1.2% 0.1% 1.1% 3.3% 0.9% Bearsden North 84% 6.6% 1.4% 0.1% 1.9% 4.9% 0.8% Bearsden South 83% 5.6% 1.1% 0.1% 1.7% 6.7% 0.8% Bishopbriggs North & 89% 4.3% 1.6% 0.1% 1.0% 3.0% 0.4% Torrance Bishopbriggs South 89% 2.6% 1.6% 0.2% 0.8% 4.8% 0.6% Campsie & Kirkintilloch North 91% 4.8% 0.9% 0.4% 0.8% 1.2% 0.3% Kirkintilloch East & Twechar 94% 2.9% 0.9% 0.1% 0.7% 0.7% 0.2% Lenzie & Kirkintilloch South 91% 4.6% 0.9% 0.1% 0.7% 2.1% 0.5% Milngavie 88% 6.6% 1.2% 0.1% 1.2% 2.6% 0.5% Source: 2011 Census
17 National Identity The 2011 Census collected data on national identity for the first time. The majority of residents in East Dunbartonshire (60.2%) reported their national identity as Scottish, which was reflected across all Wards. Kirkintilloch East & Twechar had the highest percentage of residents who reported they had a Scottish Identity at 72.7% and Bearsden South had the lowest at 50.8%. When compared to other Wards Bearsden South had the highest percentage of residents that reported their national identity as Scottish and British. Table 10: National identity as a percentage of population All People Scottish Identity Only British Identity Only Scottish and British Identities Only Scottish and any other identities English Identity Only Any other combinat ion of UK identities (UK only) Other Identity only Other Identity and at least one UK Identity Scotland 5,295, % 8.4% 18.3% 1.9% 2.3% 2.0% 4.4% 0.3% East Dunbartonshire 105, % 8.7% 24.7% 1.9% 1.1% 1.4% 1.8% 0.2% Bearsden North 13, % 11.7% 27.6% 2.7% 1.1% 2.2% 2.7% 0.4% Bearsden South 13, % 10.8% 29.8% 2.7% 1.3% 1.7% 2.6% 0.4% Bishopbriggs North & Torrance 13, % 8.5% 25.5% 1.9% 1.0% 1.2% 1.8% 0.2% Bishopbriggs South 12, % 7.5% 21.6% 2.0% 0.7% 0.9% 1.6% 0.2% Campsie & Kirkintilloch North 12, % 7.1% 22.3% 1.5% 1.2% 1.4% 1.7% 0.1% Kirkintilloch East & Twechar 12, % 5.3% 18.2% 1.1% 1.1% 0.6% 0.9% 0.04% Lenzie & Kirkintilloch South 13, % 8.0% 25.3% 1.5% 0.9% 1.1% 1.4% 0.1% Milngavie 13, % 9.9% 26.3% 2.1% 1.2% 1.9% 2.0% 0.3% Source: 2011 Census 16
 this was reflected across all Wards. Of those East Dunbartonshire residents that were born outside Scotland 5.")
. Bearsden North had the lowest percentage of residents born in Scotland (84.")
18 Country of Birth Every Council area in Scotland experienced an increase between 2001 and 2011 in the proportion of people born outside the UK. The majority of East Dunbartonshire residents were born in Scotland (89.2%) this was reflected across all Wards. Of those East Dunbartonshire residents that were born outside Scotland 5.7% were born in England, 3.1% in other countries, 0.6% in Northern Ireland, 0.2% in Wales, 0.4% in Republic of Ireland and 0.8% were born in EU countries. Kirkintilloch East & Twechar had the highest percentage of residents reporting they were born in Scotland (94%). Bearsden North had the lowest percentage of residents born in Scotland (84.6%) with one of the highest percentages of residents born in England (7.6%) and other countries (5.0%) along with Bearsden South and Milngavie. East Dunbartonshire -country of birth Scotland England Northern Ireland Wales Republic of Ireland EU Countries Other Countries Table 11: Country of birth All People Scotland England Northern Ireland Wales Republic of Ireland EU Countries Other Countries Scotland 5,295, % 8.7% 0.7% 0.3% 0.4% 2.6% 4.0% East Dunbartonshire 105, % 5.7% 0.6% 0.2% 0.4% 0.8% 3.1% Bearsden North 13, % 7.6% 1.0% 0.3% 0.4% 1.1% 5.0% Bearsden South 13, % 6.5% 0.8% 0.2% 0.5% 0.9% 5.3% Bishopbriggs North & Torrance 13, % 5.1% 0.5% 0.2% 0.5% 0.8% 2.5% Bishopbriggs South 12, % 3.5% 0.3% 0.1% 0.4% 0.7% 3.2% Campsie & Kirkintilloch North 12, % 5.3% 0.5% 0.3% 0.4% 1.0% 2.0% Kirkintilloch East & Twechar 12, % 3.7% 0.4% 0.1% 0.3% 0.6% 1.0% Lenzie & Kirkintilloch South 13, % 5.6% 0.5% 0.2% 0.4% 0.6% 2.3% Milngavie 13, % 7.6% 0.6% 0.3% 0.4% 0.9% 3.1% Source: 2011 Census 17
19 Marital Status The 2011 Census question on marital status was extended from that asked in 2001 to include new categories for registered same-sex civil partnerships. In East Dunbartonshire 55% of the population aged 16 and over were married, 10% higher than the Scottish average and 28.2% were single. Bearsden North, Bearsden South, Bishopbriggs & Torrance and Milngavie all had a slightly higher proportion of people aged 16 and over who are married (62.2%, 61.5%, 58.7% and 55.5% respectively) compared to East Dunbartonshire as a whole. Kirkintilloch East & Twechar had the highest proportion of people aged over 16 who were single at 35.1%, this ward also had the highest percentage of people who were separated (but still legally married or still legally in a same sex civil partnership) 4.2% and divorced 8.2%. Milngavie and Bishopbriggs North & Torrance had the highest percentage of people aged over 16 who were widowed or were the surviving partner from a same-sex civil partnership (8.9%), followed by Kirkintilloch East & Twechar (8.3%). Table 12: Marital status of population aged 16 and over All people aged 16 and over Percentage Single (never married or never registered a same-sex civil partnership) Percentage Married Percentage in a registered same-sex civil partnership Percentage Separated (but still legally married or still legally in a samesex civil partnership Percentage divorced or formerly in same sex civil partnership which is now legally dissolved % widowed or surviving partner from a same-sex civil partnership Scotland 4,379, % 45.2% 0.2% 3.2% 8.2% 7.8% East Dunbartonshire 86, % 55.0% 0.1% 2.7% 5.9% 8.0% Bearsden North 9, % 62.2% 0.1% 1.8% 5.1% 7.6% Bearsden South 11, % 61.5% 0.2% 2.1% 4.4% 7.9% Bishopbriggs North & Torrance 11, % 58.7% 0.1% 2.1% 4.2% 8.9% Bishopbriggs South 10, % 51.3% 0.1% 3.2% 6.1% 7.6% Campsie & Kirkintilloch North 11, % 50.2% 0.2% 3.4% 7.7% 7.5% Kirkintilloch East & Twechar 10, % 44.1% 0.1% 4.2% 8.2% 8.3% Lenzie & Kirkintilloch South 9, % 54.8% 0.1% 2.7% 6.3% 7.1% Milngavie 10, % 55.5% 0.1% 2.7% 6.0% 8.9% Source: 2011 Census 18
20 Language The 2011 Census asked questions on proficiency in spoken English and on languages other than English used at home (for the first time). English Language Skills Levels of English proficiency in East Dunbartonshire were high and above the average for Scotland. Overall, 94.9% of people aged 3 and over can speak, read and write English with only 0.2% with no skills in English. This was reflected across all of the eight wards as shown in the table below. Kirkintilloch East & Twechar had the highest percentage of people aged 3 and over who speak but do not read or write English (3%), closely followed by Campsie & Kirkintilloch North (2.8%) when compared to other Wards and East Dunbartonshire as a whole (2.6%). Kirkintilloch East & Twechar also had the highest percentage of people who understand English but do not speak, read or write English (2.2%). Bearsden North, Bearsden South, Bishopbriggs North & Torrance, Lenzie & Kirkintilloch South and Milngavie all had a slightly higher percentage of residents that speak, read and write English compared to East Dunbartonshire. Table 13: Proficiency in English, all people aged 3 and over All people aged 3 and over Underst ands but does not speak, read or write English Speaks, reads and writes English Speaks but does not read or write English Speaks and reads but does not write English Reads but does not speak or write English Other combin ation of skills in English No skills in English Scotland 5,118, % 93.8% 3.0% 0.7% 0.04% 0.4% 0.2% East Dunbartonshire 101, % 94.9% 2.6% 0.6% 0.03% 0.3% 0.1% Bearsden North 13, % 95.5% 2.6% 0.6% 0.01% 0.27% 0.06% Bearsden South 12, % 95.5% 2.2% 0.7% 0.02% 0.31% 0.18% Bishopbriggs North & Torrance 13, % 95.1% 2.4% 0.6% 0.04% 0.33% 0.08% Bishopbriggs South 11, % 94.6% 2.6% 0.5% 0.02% 0.36% 0.20% Campsie & Kirkintilloch North 11, % 94.6% 2.8% 0.5% 0.04% 0.29% 0.06% Kirkintilloch East & Twechar 12, % 93.5% 3.0% 0.7% 0.02% 0.46% 0.04% Lenzie & Kirkintilloch South 13, % 95.1% 2.5% 0.6% 0.04% 0.35% 0.03% Milngavie 12, % 95.0% 2.6% 0.6% 0.03% 0.30% 0.04% Source: 2011 Census 19


21 Language Used at Home East Dunbartonshire had a high percentage of people who reported that they used only English at home (94.8%). Bearsden North, Bearsden South and Bishopbriggs South had a slightly lower percentage of people reporting the language used at home as English. This corresponds with the slightly higher than average use of another language at home other than English. All wards across East Dunbartonshire had over 90% of people aged 3 and over who reported English as the only language used at home. East Dunbartonshire - language used at home English Only Gaelic Scots British Sign Language Polish Other Table 14: Language used at home, all people aged 3 and over All people aged 3 and over English Only Gaelic Scots British Sign Language Polish Other Scotland 5,118, % 0.5% 1.1% 0.2% 1.1% 4.5% East Dunbartonshire 101, % 0.4% 0.4% 0.2% 0.1% 4.2% Bearsden North 13, % 0.5% 0.3% 0.1% 0.1% 6.6% Bearsden South 12, % 0.6% 0.2% 0.1% 0.1% 7.6% Bishopbriggs North & Torrance 13, % 0.4% 0.2% 0.2% 0.03% 4.1% Bishopbriggs South 11, % 0.4% 0.2% 0.3% 0.2% 5.6% Campsie & Kirkintilloch North 11, % 0.3% 0.7% 0.1% 0.4% 1.9% Kirkintilloch East & Twechar 12, % 0.2% 0.6% 0.3% 0.1% 1.2% Lenzie & Kirkintilloch South 13, % 0.2% 0.4% 0.2% 0.1% 2.5% Milngavie 12, % 0.3% 0.4% 0.3% 0.1% 3.8% Source: 2011 Census 20
22 Religion The question on religion was introduced in the 2001 Census and is voluntary. In East Dunbartonshire 62.5% of the population stated they belonged to a Christian denomination. In terms of the Christian denominations 35.6% of the population in East Dunbartonshire belonged to the Church of Scotland and 22.3% stated they were Roman Catholic. The Other Christian group accounted for 4.6% of the population. A large percentage of residents reported they had no religion (28.2%) lower than the Scottish average of 36.7%. This can be seen across all Wards with Milngavie showing the highest percentage of residents stating they had no religion (31.5%). 2.43% of the population in Bearsden South reported that they were Muslim, 2.18% reported they were Sikh and 1% reported that they were Hindu. Table 15: Religion of population All People Church of Scotland Roman Catholic Other Christian Buddhist Hindu Jewish Muslim Sikh Other Religion No Religion Religion not stated Scotland 5,295, % 15.9% 5.5% 0.2% 0.3% 0.1% 1.4% 0.2% 0.3% 36.7% 7.0% East Dunbartonshire 105, % 22.3% 4.6% 0.1% 0.6% 0.1% 1.0% 0.9% 0.2% 28.2% 6.4% Bearsden North 13, % 16.3% 5.7% 0.16% 1.22% 0.12% 1.61% 1.32% 0.17% 28.5% 6.6% Bearsden South 13, % 15.5% 5.1% 0.25% 1.01% 0.12% 2.43% 2.18% 0.15% 28.7% 5.9% Bishopbriggs North & Torrance 13, % 27.6% 4.1% 0.12% 0.48% 0.06% 0.72% 0.96% 0.14% 25.2% 6.5% Bishopbriggs South 12, % 31.4% 3.3% 0.16% 0.63% 0.01% 1.66% 1.67% 0.18% 24.4% 6.0% Campsie & Kirkintilloch North 12, % 26.2% 4.1% 0.09% 0.14% 0.01% 0.28% 0.18% 0.19% 29.1% 6.9% Kirkintilloch East & Twechar 12, % 28.0% 3.4% 0.11% 0.03% 0.03% 0.20% 0.06% 0.19% 29.4% 6.5% Lenzie & Kirkintilloch South 13, % 18.9% 6.1% 0.10% 0.38% 0.07% 0.49% 0.34% 0.15% 29.1% 6.1% Milngavie 13, % 15.6% 4.6% 0.16% 0.63% 0.08% 0.51% 0.42% 0.23% 31.5% 6.6% Source: 2011 Census 21
23 Migration Migration is the movement of people from one place to another. Internal migration is when people migrate within the same country or region and international migration is when people migrate from one country to another. Migration is the most difficult component of population change to estimate as, unlike births and deaths, there is no comprehensive system for the registration of moves to or from the rest of the world, nor for moves within the UK. Official estimates of migration are therefore based on survey data and the best proxy data available. There are three key sources of migration data: The National Health Service Central Register (NHSCR) is used to calculate moves between NHS Board areas within the UK. It is also used to distribute estimates of international migration to NHS Board areas in Scotland. Community Health Index (CHI) is used to estimate migration at Council area and below. International Passenger Survey (IPS) provides information on moves into and out of Scotland with an origin or destination of outside UK. Total migration includes all migration to or from an area. For Scotland this would include moves to and from the rest of the UK and moves to and from overseas whilst for a Council or NHS Board area it would also include moves to and from other such areas in Scotland. The graph below shows the migration for East Dunbartonshire from 1994/95 to 2012/13. It shows there has been a negative net migration for East Dunbartonshire from 1995/96 to 2010/11. According to National Records of Scotland East Dunbartonshire experienced a population increase due to in-migration combined with a very low natural change. During 2012/13 there was an estimated total net migration into East Dunbartonshire of 3,507 people and a total net migration out of 3,400 people resulting in a positive total net migration of 107 people. The first positive total net migration since 1994/95 was seen in 2011/12 illustrated by the graph below. There has been a further positive net migration in 2012/ , / / / / / /200 0 Net migration 2000 / / / / / / / / / / / /12 /13 Net migration
24 Housing The type of tenure refers to whether the household is owned or rented. Tenure 39.8% of homes in East Dunbartonshire were owned outright this is 12% higher than the Scottish average. East Dunbartonshire also had a high percentage of homes owned with a mortgage or loan (41.4%) this figure was also higher than the Scottish average of 33.7%. Bearsden South had the highest percentage of homes owned outright (50.3%) compared to other Wards and East Dunbartonshire as a whole (39.8%). Kirkintilloch East & Twechar had the lowest percentage of homes owned with a mortgage or loan (35.7%) and Bishopbriggs South had the highest (45.0%). Kirkintilloch East & Twechar had the highest percentage of council rented homes (16.6%) and other social rented homes (17.7%) compared to East Dunbartonshire as a whole where 8.5% of homes were council rented and 3.5% were other social rented. Table 16: Tenure All Households Owned outright Owned with a mortgage or loan Shared owner - ship (part owned & part rented) Council rented Other social rented Private rented Rented: other Living rent free Scotland 2,372, % 33.7% 0.4% 13.2% 11.1% 11.1% 1.3% 1.3% East Dunbartonshire 43, % 41.4% 0.2% 8.5% 3.5% 5.1% 0.6% 0.9% Bearsden North 5, % 44.6% 0.1% 4.3% 0.6% 3.2% 0.5% 0.8% Bearsden South 5, % 43.1% 0.1% 1.4% 0.1% 4.0% 0.4% 0.6% Bishopbriggs North & Torrance 5, % 41.6% 0.1% 2.4% 0.9% 4.1% 0.6% 1.0% Bishopbriggs South 5, % 45.0% 0.2% 9.2% 2.0% 7.0% 0.7% 0.8% Campsie & Kirkintilloch North 5, % 42.6% 0.2% 13.5% 3.2% 7.4% 0.6% 0.8% Kirkintilloch East & Twechar 5, % 35.7% 0.1% 16.6% 17.7% 4.5% 0.9% 0.8% Lenzie & Kirkintilloch South 5, % 41.0% 0.4% 10.2% 1.1% 6.8% 0.7% 0.7% Milngavie 5, % 38.2% 0.1% 10.5% 2.2% 4.3% 0.7% 1.4% Source: 2011 Census 23
25 Household Composition A household is defined as one person living alone or a group of people (not necessarily related) living at the same address who share cooking facilities and share a living room or sitting room or dining area. A family is defined as a married, civil partnered or cohabiting couple (with or without children), or a lone parent with at least one child. Children may be classed as dependent or non-dependent. Dependent children are those aged under 16, or aged and in full-time education living with at least one parent, excluding those who have a spouse, partner or child living in the household. Table 14 outlines the following: East Dunbartonshire had 28.4% one person households. East Dunbartonshire had one of the highest proportions (11%) of households with all aged 65 and over families. Across East Dunbartonshire there were 46% of households with no children (excluding one person households) and 25.6% of households with children. This was slightly higher than the Scottish average of 41.8% of households with no children (excluding one person households) and 23.5% of households with children. This trend was also seen across all Wards in East Dunbartonshire. Bearsden North had the highest percentage of households with children (28%), Bearsden South had 50.6% of households with no children (excluding one person households). When comparing Wards Kirkintilloch East & Twechar had the highest percentage of one person households (32.5%), followed by Campsie & Kirkintilloch North (31.6%), Milngavie (30.8%) and Lenzie & Kirkintilloch South (29.2%). Bearsden North had the highest percentage of households with two adults and one or two children (17.1%), 3.5% higher than East Dunbartonshire as a whole. 24
26 Table 17: Household composition - Households All Households One person Household No adults or one adult and one or more children One adult aged 16 to 64 and one aged 65 and over and no children or two adults aged 65 and over and no children Two adults and one or two children Two adults aged 16 to 64 and no children Two adults and three or more children Three or more adults and one or more children Three or more adults and no children Scotland 2,372, % 5.3% 11.7% 12.0% 19.2% 2.0% 4.1% 10.9% East Dunbartonshire 43, % 4.1% 15.5% 13.6% 15.2% 2.4% 5.5% 15.3% Bearsden North 5, % 2.2% 17.5% 17.1% 14.7% 3.0% 5.9% 15.2% Bearsden South 5, % 2.6% 19.3% 14.5% 15.7% 2.4% 5.8% 15.6% Bishopbriggs North & Torrance 5, % 2.8% 18.1% 13.0% 13.5% 2.8% 6.1% 18.1% Bishopbriggs South 5, % 5.2% 12.9% 13.3% 14.5% 2.0% 6.4% 16.8% Campsie & Kirkintilloch North 5, % 4.4% 12.3% 13.6% 17.8% 2.0% 4.4% 13.9% Kirkintilloch East & Twechar 5, % 7.8% 11.3% 11.7% 14.6% 2.1% 5.0% 15.0% Lenzie & Kirkintilloch South 5, % 3.6% 15.8% 13.0% 16.3% 2.4% 5.5% 14.3% Milngavie 5, % 4.1% 16.2% 12.9% 14.7% 2.4% 4.9% 14.0% Source: 2011 Census 25
27 Dwelling Type A dwelling refers to the accommodation itself, for example a house or a flat and includes second homes that are not let our commercially. Caravans count as dwellings if they are someones main home. Kirkintilloch East & Twechar had the highest percentage of dwellings which are flats (28.02%) closely followed by Campsie & Kirkintilloch North (27.12) compared to other Wards and East Dunbartonshire as a whole. Bishopbriggs North & Torrance had the lowest percentage of dwellings which are flats (9.8%). Bearsden North and Bearsden South had the highest percentage of detached dwellings (45.25% and 43.62% respectively). Kirkintilloch East & Twechar had the lowest percentage of detached dwellings (11.32%). Kirkintilloch East & Twechar had the highest percentage of terraced dwellings (34.07%) when compared to other Wards. Table 18: Dwelling type % dwellings which are flats % dwellings which are terraced % dwellings which are semi detached % dwellings which are detached % dwellings attachment unknown Scotland East Dunbartonshire Bearsden North Bearsden South Bishopbriggs North & Torrance Bishopbriggs South Campsie & Kirkintilloch North Kirkintilloch East & Twechar Lenzie & Kirkintilloch South Milngavie Source: Scottish Neighbourhood Statistics
28 Car and Van Availability The 2011 Census asked respondents how many cars or vans were owned, or available for use by members of the household. East Dunbartonshire had 43.1% of households with one car or van available for use and 30.2% of households with two or more cars or vans available for use. 19% of households in East Dunbartonshire did not have access to a car or van, well below the Scottish average of 30.5%. All wards had between 41% and 44% of households with one car or van available for use which is in line with East Dunbartonshire as a whole. Bishopbriggs South, Campsie & Kirkintilloch North and Kirkintilloch East & Twechar had a higher percentage of households with no car or van available for use (23.3%, 22.6%, and 32.4% respectively) compared with East Dunbartonshire as a whole (19.0%). Bearsden North had the highest percentage of households with two or more cars or vans available for use (38.9%), nearly 9% higher than East Dunbartonshire and 17% higher than the Scottish average. Table 19: Car ownership No cars or vans One car or van Two cars or vans Three cars or vans Four cars or vans Scotland 30.5% 42.2% 21.6% 4.3% 1.3% East Dunbartonshire 19.0% 43.1% 30.2% 6.1% 1.6% Bearsden North 10.3% 41.7% 38.9% 7.0% 2.0% Bearsden South 9.9% 44.0% 37.1% 7.2% 1.9% Bishopbriggs North & Torrance 15.4% 43.8% 31.6% 7.1% 2.0% Bishopbriggs South 23.3% 44.9% 25.7% 5.0% 1.1% Campsie & Kirkintilloch North 22.6% 41.6% 27.6% 6.3% 1.9% Kirkintilloch East & Twechar 32.4% 42.6% 19.8% 4.1% 1.1% Lenzie & Kirkintilloch South 19.2% 43.3% 30.1% 6.2% 1.3% Milngavie 19.1% 43.3% 30.4% 5.6% 1.5% Source: 2011 Census 27
29 Local Economy Employment and Unemployment Table 15 below shows the percentage of economically active residents in East Dunbartonshire has increased since 2011 from 76.7% to 80.3% in The percentage of people in employment in East Dunbartonshire has increased by 5% since 2011 to 77.2% which is 7% higher than the Scottish average. Unemployment in East Dunbartonshire has decreased, in % of people were unemployed, nearly 3% less than the Scottish average of 7.8%. There has been a slight decrease (1.2%) in the percentage of those who are self-employed in East Dunbartonshire between 2012 and The percentage of self-employed across Scotland as a whole has remained fairly consistent from 2011 to Table 20: Employment and unemployment East Dunbartonshire Scotland 2012** 2013** 2014** 2012** 2013** 2014** Economically Active* 78.3% 80.3% 77.5% 77.0% 76.8% 77.5% In employment* 73.4% 77.2% 73.9% 70.8% 70.7% 72.0% Employees* 62.4% 67.4% 63.8% 62.2% 62.4% 63.5% Self Employed* 10.5% 9.3% 9.8% 8.1% 7.7% 7.9% Unemployed (model based)# 6.1% 4.9% 5.0% 7.9% 7.8% 7.1% Source: NOMIS *numbers are for those aged 16 and over, % is for those aged ** Annual figures relate to July June #numbers and % are for those aged 16 and over, % is a proportion of economically active 90.00% Employed and Unemployed 80.00% 70.00% 60.00% 50.00% 40.00% 30.00% 20.00% 10.00% Economically Active In employment Employees Self Employed Unemployed (model based) 0.00% East Dunbartonshire Scotland Source: NOMIS 28
30 Economically Active Table 16 and 17 below show the results from the census question that asked respondents about their economic activity the week before the census. A person was considered economically active if they were employed, selfemployed or unemployed but looking for work and able to start within two weeks. Full time students who were employed or looking for work and able to start within two weeks were also classed as economically active. Each person is only included in one category; for example, a full time student who also works part time will only be included in the Economically active: full time student category. Those classified as economically inactive include people not working/not looking for work as they may be retired, students, looking after their home or family, or long-term sick or disabled. Table 16 below shows that 39.7% of the working age population in East Dunbartonshire were full time employees, 13.5% were part-time employees and 8.6% were self-employed. Campsie & Kirkintilloch North had the highest percentage of working age population who were full time employees (42.5%) followed by Bishopbriggs South (41.7%) and Bishopbriggs North & Torrance (39.9%) all above the East Dunbartonshire average of 39.7%. Milngavie had the highest percentage of working age population who were part-time employees (14.5%) followed by Bishopbriggs South (14.2%) and Kirkintilloch East & Twechar (14.0%) all higher than the East Dunbartonshire average of 13.5%. Kirkintilloch East & Twechar and Campsie & Kirkintilloch North had a higher percentage of residents reporting they were unemployed but looking for work (6.0% and 4.3% respectively) compared to East Dunbartonshire as a whole (3.5%). Table 21: Economically active (all people aged 16-74) Employee part-time Employee full-time Selfemployed Unemployed Full-time Student Scotland 13.3% 39.6% 7.5% 4.8% 3.7% East Dunbartonshire 13.5% 39.7% 8.6% 3.5% 3.9% Bearsden North 13.6% 39.3% 10.4% 2.1% 4.2% Bearsden South 12.7% 38.5% 10.9% 2.3% 3.7% Bishopbriggs North & Torrance 13.0% 39.9% 9.0% 2.7% 4.6% Bishopbriggs South 14.2% 41.7% 7.2% 4.0% 4.2% Campsie & Kirkintilloch North 12.4% 42.5% 7.9% 4.3% 3.4% Kirkintilloch East & Twechar 14.0% 39.4% 5.3% 6.0% 3.6% Lenzie & Kirkintilloch South 13.6% 39.6% 8.0% 3.8% 3.8% Milngavie 14.5% 37.0% 10.1% 2.8% 3.8% Source: 2011 Census 29
31 Economically Inactive East Dunbartonshire had a higher percentage of people aged who reported they were retired (17.8%) compared to the Scottish average of 14.9%. Bearsden South had the highest percentage of residents who reported they were retired (20.3%), closely followed by Bishopbriggs North & Torrance (19.6%), Bearsden North (18.5%), Milngavie (18.4%) and Lenzie and Kirkintilloch South (18.2%), all higher than East Dunbartonshire as a whole (17.8%). Milngavie and Kirkintilloch East & Twechar had the highest percentage of residents who reported they looked after home or family (3.7% and 3.6% respectively). Bishopbriggs North & Torrance had the lowest percentage of residents reporting they looked after home or family (2.2%). Kirkintilloch East & Twechar had the highest percentage of working age residents who reported they were long term sick or disabled (6.9%), 3.5% higher than East Dunbartonshire as a whole. When compared to other Wards Bearsden South had the lowest percentage of working age residents who reported they were long term sick or disabled (1.6%). Table 22: Economically inactive (all people aged 16-74) Retired Student Looking after home or family Long term sick or disabled Other Scotland 14.9% 5.5% 3.6% 5.1% 1.9% East Dunbartonshire 17.8% 5.2% 3.1% 3.4% 1.2% Bearsden North 18.5% 5.9% 3.4% 1.7% 0.9% Bearsden South 20.3% 5.4% 3.5% 1.6% 1.1% Bishopbriggs North & Torrance 19.6% 5.8% 2.2% 2.2% 1.1% Bishopbriggs South 15.8% 4.5% 2.6% 4.4% 1.3% Campsie & Kirkintilloch North 16.5% 4.3% 3.1% 4.3% 1.2% Kirkintilloch East & Twechar 15.1% 4.5% 3.6% 6.9% 1.7% Lenzie & Kirkintilloch South 18.2% 5.3% 2.9% 3.5% 1.3% Milngavie 18.4% 5.3% 3.7% 3.1% 1.2% Source: 2011 Census 30
32 Job Seekers Allowance Claimants Table 18 shows the percentage of the population claiming job seekers allowance. East Dunbartonshire had a low percentage of the population aged that claim Job Seekers Allowance (JSA) (2.4%) when compared to the Scottish average (3.8%). When comparing Wards, Kirkintilloch East & Twechar had the highest percentage of the population aged claiming JSA (4.9%) followed by Campsie & Kirkintilloch North (3.3%) and Bishopbriggs South (2.9%). The table below shows that the age group with the highest percentage of JSA claimants are those aged this is reflected across all Wards and East Dunbartonshire as a whole. Kirkintilloch East & Twechar had the highest percentage of those aged claiming JSA (7.7%). Bearsden North had the lowest percentage of the population aged claiming JSA (1%). Table 23: Job seekers allowance claimants % of population claiming Job Seekers Allowance % of population aged claiming Job Seekers Allowance % of population aged claiming Job Seekers Allowance % of population aged claiming Job Seekers Allowance Scotland East Dunbartonshire Bearsden North Bearsden South Bishopbriggs North & Torrance Bishopbriggs South Campsie & Kirkintilloch North Kirkintilloch East & Twechar Lenzie & Kirkintilloch South Milngavie Source: Scottish Neighbourhood Statistics Q figures 31
33 Occupation In the 2011 Census, the occupations for employed people were derived from their job titles and brief descriptions of what they did in their main jobs. The largest category of occupation in East Dunbartonshire was a professional occupation (24.6%) which was 7.8% higher than the national average of 16.8%. The largest category of occupation across most Wards was professional occupations. Bearsden North had the highest percentage of residents employed in the professional occupations category (34.5%), followed by Bearsden South (31.9%). The largest category of occupation in Kirkintilloch East & Twechar was skilled trades occupations (13.5%) followed by professional occupations (13.0%). Table 24: Occupation All people aged in employment Managers, directors & senior officials Professional occupations Associate Professional & technical occupations Administr ative & secretarial occupations Skilled trades occupations Caring, leisure& service Sales & Customer Service Process, plant & machine operatives Elementary occupations 2,516,895 Scotland 8.4% 16.8% 12.6% 11.4% 12.5% 9.7% 9.3% 7.7% 11.6% East Dunbartonshire 50, % 24.6% 14.3% 12.4% 9.8% 8.3% 8.8% 5.0% 6.9% Bearsden North 6, % 34.5% 15.0% 11.1% 6.0% 6.2% 7.2% 2.9% 4.6% Bearsden South Bishopbriggs North & Torrance 6,287 6, % 31.9% 15.0% 11.8% 7.9% 6.0% 7.4% 3.0% 4.3% 10.0% 24.2% 15.4% 13.6% 10.0% 6.9% 9.2% 5.0% 5.7% Bishopbriggs South Campsie & Kirkintilloch South Kirkintilloch East & Twechar Lenzie & Kirkintilloch South 6, % 18.0% 13.2% 14.1% 12.2% 9.4% 10.8% 5.9% 8.2% 5, % 20.9% 13.5% 11.2% 12.0% 10.9% 8.4% 5.7% 8.3% 5, % 13.0% 11.4% 12.5% 13.5% 12.4% 10.7% 8.9% 11.8% 6, % 25.2% 15.1% 13.5% 9.1% 8.2% 8.4% 4.8% 6.3% Milngavie 6, % 27.7% 15.5% 11.6% 8.7% 7.2% 8.3% 4.1% 6.6% Source: 2011 Census 32
34 Education Highest Level of Qualification The 2011 Census question on qualifications asked respondents to indicate all the types of qualifications they held, including foreign qualifications, and was used to determine the highest level of qualification obtained by each respondent aged 16 and over. East Dunbartonshire had a higher percentage of residents aged 16 and over with a level 4 qualification (34.8%) compared to the Scottish average of 26.1%. 19.9% of East Dunbartonshire residents reported having no qualifications this was considerably lower when compared to Scotland (26.8%). Bearsden North had the highest percentage of residents with Level 4 qualifications (48.8%) followed by Bearsden South (46.1%), Milngavie (40.1%) and Lenzie & Kirkintilloch South (35.6%) all higher than the East Dunbartonshire average of 34.8%. Kirkintilloch East & Twechar had the highest percentage of people aged 16 and over with no qualifications (31%) and the lowest percentage with a level 4 qualification (17.3%). This Ward had the highest percentage of people aged 16 and over with a Level 1 qualification (26.3%). Table 25: Highest level of qualification No qualifications Level 1 Level 2 Level 3 Level 4 Scotland 26.8% 23.1% 14.3% 9.7% 26.1% East Dunbartonshire 19.9% 19.3% 16.3% 9.8% 34.8% Bearsden North 12.1% 14.2% 15.8% 9.2% 48.8% Bearsden South 14.2% 14.6% 16.0% 9.0% 46.1% Bishopbriggs North & Torrance 19.8% 19.6% 17.3% 10.0% 33.3% Bishopbriggs South 25.1% 22.3% 16.8% 10.6% 25.1% Campsie & Kirkintilloch North 22.1% 21.6% 15.8% 10.8% 29.6% Kirkintilloch East & Twechar 31.0% 26.3% 15.9% 9.5% 17.3% Lenzie & Kirkintilloch South 18.1% 19.7% 16.8% 9.7% 35.6% Milngavie 18.3% 16.9% 15.5% 9.3% 40.1% Source: 2011 Census Level 1: 0 Grade, Standard Grade, Access 3 Cluster, Intermediate 1 or 2, GCSE, CSE, Senior Certification or equivalent; GSVQ Foundation or Intermediate, SVQ level1 or 2, SCOTVEC Module, City and Guilds Craft or equivalent; Other school qualifications not already mentioned (including foreign qualifications) 33
35 Level 2: SCE Higher Grade, Higher, Advanced Higher, CSYS, A Level, AS Level, Advanced Senior Certificate or equivalent; GSVQ Advanced, SVQ level 3, ONC, OND, SCOTVEC National Diploma, City and Guilds Advanced Craft or equivalent. Level 3: HNC, HND, SVQ level 4 or equivalent; Other post-school but pre-higher Education qualifications not already mentioned (including foreign qualifications) Level 4 and above: Degree, Postgraduate qualifications, Masters, PhD, SVQ level 5 or equivalent; Professional qualifications (for example, teaching, nursing, accountancy); Other Higher Education qualifications not already mentioned (including foreign qualifications) 34
36 School Leaver Destination East Dunbartonshire had a high level of positive destinations for school leavers with 57.6% going on to higher education, 18% to further education, 16.8% into employment and 3.2% going into training. East Dunbartonshire had 20% more school leavers entering higher education (57.6%) compared to the Scottish average (36.5%). 3.6% of school leavers reported that they were unemployed and seeking employment or training, nearly 4% less than the Scottish average of 7.1%. Bearsden South and Bishopbriggs South had the highest percentage of school leavers who were unemployed and seeking employment or training (6.2% and 5.2% respectively) slightly higher than East Dunbartonshire as a whole (3.6%) but lower than the Scottish average (7.1%). Table 26: School leaver destinations 2012/13 % Higher Education % Further Education % Training % Employment % Unemployed & seeking employment or training % Unemployed & not seeking employment or training % Unknown Scotland 36.5% 27.8% 6.3% 20.9% 7.1% 1.2% 0.3% East Dunbartonshire 57.6% 18% 3.2% 16.8% 3.6% 0.8% 0% Bearsden North 68% 15.7% 0% 11.8% 3.3% 1.3% 0% Bearsden South 66.2% 13.8% 0% 13.8% 6.2% 0% 0% Bishopbriggs North & Torrance 59.1% 11.7% 1.3% 25.3% 1.9% 0.6% 0% Bishopbriggs South 52.3% 21.9% 4.5% 16.1% 5.2% 0% 0% Campsie & Kirkintilloch North 45.2% 20.5% 6.8% 22.6% 4.1% 0.7% 0% Kirkintilloch East & Twechar 39.4% 24.8% 8.8% 24.1% 1.5% 1.5% 0% Lenzie & Kirkintilloch South 61.3% 17.9% 2.9% 12.7% 4.0% 1.2% 0% Milngavie 68.8% 18.1% 1.4% 8.3% 2.8% 0.7% 0% Source: Scottish Neighbourhood Statistics 2012/13 35
37 Attainment The table below shows that East Dunbartonshire attainment is higher across all categories than the Scottish average. 2012/13 shows that 98.3% of pupils in East Dunbartonshire gained English and Maths at SCQF level 3 or above, 5% higher than the Scottish average (94.3%). The highest percentage of pupils gaining English and Maths at SCQF level 3 or above during 2012/13 was Campsie & Kirkintilloch North with 100%, followed by Bearsden North (99.4%) and Lenzie & Kirkintilloch South (99.3%). All Wards were above the Scottish average. Campsie & Kirkintilloch North and Lenzie & Kirkintilloch South both had 100% attainment for S4 pupils achieving 5 awards at SCQF level 3 and above. Table 27: Attainment S4: Percentage of pupils with English and Maths at SCQF level 3 or above : 2012/13 S4: Percentage of pupils with 5 awards at SCQF level 3 and above : 2012/13 S4: Percentage of pupils with 5 awards at SCQF level 4 and above : 2012/13 S4: Percentage of pupils with 5 awards at SCQF level 5 and above : 2012/13 Scotland 94.3% 94.4% 82% 39.4% East Dunbartonshire 98.3% 99% 93.8% 61% Bearsden North 99.4% 99.4% 98.1% 74.8% Bearsden South 97.5% 99.2% 97.5% 70% Bishopbriggs North & Torrance 98.1% 98.8% 95.7% 70.8% Bishopbriggs South 98.3% 98.8% 95.3% 61% Campsie & Kirkintilloch North 100% 100% 94.5% 45.3% Kirkintilloch East & Twechar 97.0% 98.2% 84.9% 34.9% Lenzie & Kirkintilloch South 99.3% 100% 94.6% 65.8% Milngavie 97.0% 97.8% 90.3% 66.4% Source: Scottish Neighbourhood Statistics 2012/13 36
38 Crime/Community Safety 2011/12 Crime Rates per 10,000 Population East Dunbartonshire is regarded as a safe place to live with the level of crime being significantly lower than the Scottish average with 1,022 crimes and offences per 10,000 of the population in 2011/12 compared to the Scottish average of 1,633. The rate of crime per 10,000 population in East Dunbartonshire was lower than the Scottish average in all categories shown in the table below. Table28: Number of crimes recorded by the police per 10,000 population 2013/14 Non sexual crimes of violence Sexual crimes Crimes of dishonesty Fireraising, vandalism, etc Other crimes Motor vehicle offences Misc offences Scotland East Dunbartonshire Source: Scottish Government recorded crime in Scotland 2013/14 The table below shows that East Dunbartonshire had the lowest rate of crime per 10,000 population compared to the surrounding local authority areas. Table 29: Total number of crimes and offences recorded by the police per 10,000 population 2013/14 Scotland 1,448 East Dunbartonshire 893 Stirling 1,439 West Dunbartonshire 1,640 North Lanarkshire 1,493 Glasgow 3,001 Total crimes and offences per 10,000 population Source: Scottish Government recorded crime in Scotland 2013/14 37
39 Accidental and Deliberate Fires Table 23 shows the number of accidental and deliberate fires in East Dunbartonshire and the Ward areas. In East Dunbartonshire during 2012/13 there were deliberate fires per 100,000 population. Campsie & Kirkintilloch North had the highest number of deliberate fires per 100,000 population (373.6) followed by Kirkintilloch East & Twechar (235.3) when comparing Wards. Bearsden South had the lowest number of deliberate fires per 100,000 population (75.9). Lenzie & Kirkintilloch South had the highest accidental dwelling fires per 100,000 population (89.7) followed by Campsie & Kirkintilloch North (81.2). Bishopbriggs North & Torrance had the lowest number of accidental dwelling fires per 100,000 population (22.9). Table 30: Number of fires Number of all fires Accidental dwelling fires per 100,000 population. : Deliberate fires (excluding chimney fires) per 100,000 population. : Scotland East Dunbartonshire Bearsden North Bearsden South Bishopbriggs North & Torrance Bishopbriggs South Campsie & Kirkintilloch North Kirkintilloch East & Twechar Lenzie & Kirkintilloch South Milngavie Source: Scottish Neighbourhood Statistics 38
40 Health General Health Respondents to the 2011 Census were asked to assess their own general health in order to respond to the health questions in the census questionnnaire. The table below shows the general health reported by residents during the census. 84.9% of residents in East Dunbartonshire reported their health as being very good or good, 2% higher than the national average. The percentage of East Dunbartonshire residents reporting their health was bad or very bad (4.3%) was lower than the national average (5.6%). All Wards had 80% or over of residents reporting they had very good or good health. Kirkintilloch East & Twechar had the highest percentage of residents reporting they had bad or very bad health (7%) followed by Campsie & Kirkintilloch North (5.2%) and Bishopbriggs South (4.8%) all higher when compared to East Dunbartonshire as a whole (4.3%). Bearsden North had the lowest percentage of residents who reported their health was bad or very bad (2.6%). Table 31: General health All People Very good or good health Fair health Bad health or very bad health Scotland 5,295, % 12.2% 5.6% East Dunbartonshire 105, % 10.8% 4.3% Bearsden North 13, % 8.4% 2.6% Bearsden South 13, % 9.6% 2.9% Bishopbriggs North & Torrance 13, % 10.8% 3.7% Bishopbriggs South 12, % 11.8% 4.8% Campsie & Kirkintilloch North 12, % 11.5% 5.2% Kirkintilloch East & Twechar 12, % 13.2% 7.0% Lenzie & Kirkintilloch South 13, % 10.6% 4.4% Milngavie 13, % 11.1% 3.7% Source: 2011 Census 39
41 Limiting Health Problem or Disability The 2011 Census asked people if their day to day activities were limited because of a health problem or disability which lasted, or was expected to last, at least 12 months, including those related to age. East Dunbartonshire had a high percentage of residents whose day to day activities were not limited by a health problem or disability (82.6%), 2% above the Scottish average. Bearsden North had the highest percentage of residents reporting their day to day activities were not limited by a health problem or disability (86.1%) and the lowest percentage of residents reporting their day to day activities were limited a lot (5.4%). Kirkintilloch East & Twechar had the highest percentage of residents who reported their day to day activities were limited a lot by a health problem or disability (11.2%) followed by Campsie & Kirkintilloch North (9.5%) and Bishopbriggs South (8.5%). Table 32: Limiting health problem or disability Total Population Day to day activities limited a lot Day to day activities limited a little Day to day activities not limited Scotland 5,295, % 10.1% 80.4% East Dunbartonshire 105, % 9.5% 82.6% Bearsden North 13, % 8.5% 86.1% Bearsden South 13, % 9.6% 84.2% Bishopbriggs North & Torrance 13, % 9.6% 82.9% Bishopbriggs South 12, % 9.7% 81.8% Campsie & Kirkintilloch North 12, % 9.4% 81.1% Kirkintilloch East & Twechar 12, % 10.2% 78.6% Lenzie & Kirkintilloch South 13, % 9.5% 82.9% Milngavie 13, % 9.9% 82.9% Source: 2011 Census 40
42 Provision of Unpaid Care In the census, a person was described as a provider of unpaid care if he or she looked after or gave help or support to a family member, friend, neighbour or other person because of long term physical or mental ill health or disability, or problems related to old age. 10.8% of residents across East Dunbartonshire provided unpaid care to relatives, friends or neighbours compared with 9.3% in Scotland. This equates to 7,223 people providing 1 to 19 hours unpaid care per week, while 2,501 provided care for over 50 hours per week. Bearsden South had the highest percentage of residents that provided 1 to 19 hours of unpaid care per week (8.0%) followed by Lenzie & Kirkintilloch South (7.8%) compared to other Wards in East Dunbartonshire. This is above the average for East Dunbartonshire (6.9%) and the national average for Scotland of 5.2%. Between 5.0% and 8.0% of residents in all Wards provided 1 to 19 hours of unpaid care per week all higher than the Scottish average of 5.2%. Kirkintilloch East & Twechar had the highest percentage of residents who provided 50 or more hours of unpaid care a week (2.8%). Table 33: Provision of unpaid care Provides no unpaid care Provides 1 to 19 hours unpaid care a week Provides 20 to 34 hours unpaid care a week Provides 35 to 49 hours unpaid care a week Provides 50 or more hours unpaid care a week Scotland 90.7% 5.2% 0.9% 0.8% 2.5% East Dunbartonshire 89.2% 6.9% 0.9% 0.7% 2.4% Bearsden North 89.6% 7.3% 0.7% 0.5% 1.9% Bearsden South 88.4% 8.0% 0.9% 0.6% 2.0% Bishopbriggs North & Torrance 88.8% 7.2% 1.0% 0.7% 2.4% Bishopbriggs South 89.6% 6.0% 1.0% 0.8% 2.6% Campsie & Kirkintilloch North 89.3% 6.6% 0.7% 0.7% 2.6% Kirkintilloch East & Twechar 89.7% 5.6% 1.1% 0.8% 2.8% Lenzie & Kirkintilloch South 89.2% 7.8% 1.0% 0.6% 2.3% Milngavie 88.9% 7.2% 0.9% 0.6% 2.3% Source: 2011 Census 41
43 Travel to Work or Study The Census asked respondents to define the mode of transport used to cover the longest part, by distance, of their usual journey to work or study. Increases were seen in almost every council area in the proportion of people driving to work between 2001 and The majority of residents in East Dunbartonshire travelled to work or study by car or van (45%), nearly 5% higher than the Scottish average (40.9%). Across all Wards the majority of residents travelled to work or study by car or van. Campsie & Kirkintilloch North had the highest percentage of residents travelling to work or study by car or van (49.1%), this Ward also had the highest percentage of residents travelling to work by bus, minibus or coach (17.4%). Both higher than East Dunbartonshire as a whole (45% and 10.5% respectively). Bearsden South had the highest percentage of residents travelling to work or study by train (12.8%), followed by Milngavie (11.0%), Bearsden North (10.4%) and Lenzie & Kirkintilloch South (9.9%), all higher than the East Dunbartonshire as a whole (8.2%). The percentage of residents working or studying mainly from home in East Dunbartonshire (9.5%) was lower than the Scottish average (11.3%). 10.3% of residents in Bearsden South, Kirkintilloch East & Twechar and Milngavie reported working or studying from home, nearly 1% higher than East Dunbartonshire as a whole. Table 34: Travel to work or study Work or study mainly from home Underground metro, light rail or tram Train Bus, minibus or coach Driving a car or van Taxi or minicab Passenger in a car or van Motorcycle, scooter or moped Bicycle On foot Other Scotland 11.3% 0.3% 3.5% 13.4% 0.7% 40.9% 9.0% 0.2% 1.3% 18.5% 0.9% East Dunbartonshire 9.5% 0.1% 8.2% 10.5% 0.9% 45.0% 9.3% 0.2% 0.7% 14.9% 0.6% Bearsden North 9.6% 0.2% 10.4% 6.3% 0.5% 45.3% 7.8% 0.1% 1.1% 18.1% 0.8% Bearsden South 10.3% 0.2% 12.8% 7.5% 0.6% 44.8% 11.0% 0.1% 1.0% 11.0% 0.7% Bishopbriggs North & Torrance 9.2% 0.2% 7.7% 12.3% 1.0% 45.6% 9.5% 0.2% 0.7% 12.8% 0.7% Bishopbriggs South 8.2% 0.2% 6.4% 14.2% 1.4% 43.5% 10.3% 0.2% 0.6% 14.5% 0.5% Campsie & Kirkintilloch North 9.3% 0.1% 3.2% 17.4% 0.9% 49.1% 8.4% 0.3% 0.4% 10.4% 0.5% Kirkintilloch East & Twechar 10.3% 0.03% 3.6% 13.7% 1.4% 42.4% 10.2% 0.2% 0.5% 17.3% 0.3% Lenzie & Kirkintilloch South 8.7% 0.1% 9.9% 7.4% 0.6% 45.7% 8.2% 0.1% 0.6% 18.2% 0.4% Milngavie 10.3% 0.1% 11.0% 6.4% 0.7% 43.4% 9.5% 0.2% 1.0% 16.7% 0.8% Source: 2011 Census 42
44 Active Travel to Work The graph below shows the percentage of people who cycled or walked to their place of work or study. East Dunbartonshire as a whole had a lower percentage of people who travelled to work on foot (14.9%) compared to the Scottish average (18.5%). Lenzie & Kirkintilloch South had the highest percentage of people who travelled to work on foot (18.2%), followed by Bearsden North (18.1%), Kirkintilloch East & Twechar (17.3%) and Milngavie (16.7%), all above the East Dunbartonshire average of 14.9%. Campsie & Kirkintilloch North had the lowest percentage of people who travelled to work on foot (10.4%). 0.7% of residents in East Dunbartonshire travelled to work or study by bicycle this was lower than the Scottish average of 1.3%. Bearsden North had the highest percentage of residents that travelled to work by bicycle (1.1%) followed by Bearsden South (1%) and Milngavie (1%). 20.0% 18.0% 16.0% 14.0% 12.0% 10.0% 8.0% 6.0% 4.0% 2.0% 0.0% Bicycle On foot 43
45 Distance Travelled to Work The table below shows the distance travelled to work by people aged in employment. The majority of people in East Dunbartonshire travelled between 5km and 10km to their place of work (30.1%), this was 13% higher than the Scottish average of 17.1%. In Bearsden South 41.7% of people travelled between 5km and 10km to their place of work this was the highest percentage when compared to all Wards. Milngavie had the highest percentage of people who worked or studied mainly from home (11.2%) this was closely followed by Bishopbriggs North & Torrance and Bearsden South both 10.8%. Campsie and Kirkintilloch North had the highest percentage of people who travelled between 10km and 20km to their place of work (37.3%), 15% higher than East Dunbartonshire as a whole. 13.1% of people in Bishopbriggs and Torrance travelled less than 2km to their place of work this was the highest of all the Wards with the lowest percentage in Bearsden South (4.3%). A small percentage of people in East Dunbartonshire travel 60km and over to their place of work (1.9%). Bearsden North had the highest percentage of people who travelled 60km and over to their place of work (3.0%) just over 1% higher than East Dunbartonshire as a whole. Table 35: Distance travelled to work Work or study mainly from home Less than 2km 2km to less than 5km 5km to less than 10kn 10km to less than 20km 20km to less than 30km 30km to less than 40km 40km to less than 60km 60km and over Other Scotland 10.8% 13.1% 19.2% 17.1% 15.1% 6.5% 2.9% 2.2% 2.0% 10.9% East Dunbartonshire 9.7% 7.6% 12.8% 30.1% 21.5% 3.6% 1.3% 1.2% 1.9% 10.3% Bearsden North 10.7% 4.6% 11.3% 39.5% 15.8% 3.7% 1.9% 1.1% 3.0% 8.3% Bearsden South 10.8% 4.3% 15.9% 41.7% 9.4% 3.5% 1.6% 1.0% 2.4% 9.4% Bishopbriggs North & Torrance 10.8% 13.1% 19.2% 17.1% 15.1% 6.5% 2.9% 2. 2% 2.0% 10.9% Bishopbriggs South 8.1% 8.6% 19.1% 36.8% 11.8% 1.6% 0.9% 0.7% 1.3% 11.4% Campsie & Kirkintilloch North 9.4% 7.3% 10.2% 15.3% 37.3% 5.0% 0.9% 1.5% 1.5% 11.5% Kirkintilloch East & Twechar 9.2% 11.0% 14.4% 17.9% 28.0% 4.7% 0.8% 1.1% 0.8% 12.1% Lenzie & Kirkintilloch South 8.3% 10.3% 10.4% 21.9% 31.0% 3.8% 1.3% 2.1% 1.7% 9.1% Milngavie 11.2% 7.8% 7.9% 27.3% 27.0% 3.9% 1.6% 0.7% 2.5% 10.1% Source: 2011 Census 44

46 Scottish Index of Multiple Deprivation Background The Scottish Index of Multiple Deprivation (SIMD) is regarded as the official measure of deprivation in Scotland and identifies small area concentrations of multiple deprivation. The Index provides a relative measure of deprivation, and is used to compare small areas (datazones) across Scotland by providing each zone with a unique ranking from most deprived (rank 1) to least deprived (rank 6,505). While the SIMD measures concentrations of deprivation it is not a measure of relative affluence and should not be used as such. For example, it is not possible to say the area ranked 6,505 is the most affluent in Scotland but it is possible to say it is the least deprived. Geography Datazones were developed by the then Scottish Executive during and are regarded as the core geography for the availability and analysis of statistics. Each datazone has a population of between 500 and 1,000 and the 6,505 datazones across Scotland have an average population of 808. East Dunbartonshire has 127 datazones (shown below). As can be seen from the map below towns and villages are marked by clusters of small datazones in contrast to the larger datazones found in rural areas. Datazones are coded with an eight digit identifier but are not specifically named. As such each datazone has been assigned to its relevant named intermediate geography, e.g. S is the village of Twechar. Following the 2011 Census the datazones are due to be redrawn to reflect changes in population and to continue to provide a reliable comparison to other datazones. Existing boundaries will be split or merged with other datazones if necessary but no other boundaries will change. East Dunbartonshire Datazones 45
East Dunbartonshire Area Profile
 East Dunbartonshire Area Profile May 2014 Contents Executive Summary.. page 3 Introduction.. page 6 Population page 7 Age Structure. page 9 Population Projections page 11 Life Expectancy page 12 Ethnicity.
Chapter 1: The Population of NHS Greater Glasgow and Clyde
 Population Estimate (thousands) Chapter 1: The Population of NHS Greater Glasgow and Clyde Population Trends and Projections National Records of Scotland estimated (NRS SAPE) 1 the 2013 NHS Greater Glasgow
SHETLAND AREA PROFILE
 www.hie.co.uk SHETLAND AREA PROFILE May 2014 SHETLAND AREA PROFILE INTRODUCTION The Shetland area profile uses 2011 Census data and other available data sources to present an up-to-date analysis of its
Devonport-Takapuna Local Board Profile
 Devonport-Takapuna Local Board Profile - Initial results from the Census February 2014 Social and Economic Research Team Research, Investigations and Monitoring Unit Auckland Council Map of Devonport-Takapuna
CAMPBELTOWN PROFILE May 2014
 www.hie.co.uk CAMPBELTOWN PROFILE May 2014 CAMPBELTOWN PROFILE INTRODUCTION The Campbeltown profile uses 2011 Census data and other available data sources to present an up-to-date analysis of its population
DUNOON PROFILE May 2014
 www.hie.co.uk DUNOON PROFILE May 2014 DUNOON PROFILE INTRODUCTION The Dunoon profile uses 2011 Census data and other available data sources to present an up-to-date analysis of its population and labour
The Changing Demography of Scotland. Kirsty MacLachlan National Records of Scotland
 The Changing Demography of Scotland Kirsty MacLachlan National Records of Scotland People (millions) Scotland s population, 1855 to 2009 6 5 4 3 2 1 0 1855 1870 1885 1900 1915 1930 1945 1960 1975 1990
Demographic Profile 2013 census
 Demographic Profile 2013 census This profile provides basic population and demographic information on the residents of the Hauraki District. Population and demographic information is important for targeting
Perth & Kinross Council. Community Planning Partnership Report June 2016
 Perth & Kinross Council Community Planning Partnership Report June 2016 Contents Foreword... 3 Section 1: Spring 2016 destination follow up of 2014/15 school leavers... 4 Background... 4 Section A: Initial
PORTREE PROFILE May 2014
 www.hie.co.uk PORTREE PROFILE May 2014 PORTREE PROFILE INTRODUCTION The Portree profile uses 2011 Census data and other available data sources to present an up-to-date analysis of its population and labour
DINGWALL PROFILE May 2014
 www.hie.co.uk DINGWALL PROFILE May 2014 DINGWALL PROFILE INTRODUCTION The Dingwall profile uses 2011 Census data and other available data sources to present an up-to-date analysis of its population and
North Lanarkshire. Skills Assessment January SDS-1163-Jan16
 North Lanarkshire Skills Assessment January 2016 SDS-1163-Jan16 Acknowledgement The Regional Skills Assessment Steering Group (Skills Development Scotland, Scottish Enterprise, the Scottish Funding Council
Your views matter and we hope you will help us to shape the future of fire and rescue in Scotland.
 SCOTTISH FIRE AND RESCUE SERVICE Draft Strategic Plan 2016-19 Overview The Scottish Fire and Rescue Service invites views on its draft Strategic Plan 2016-19. A cornerstone of our ongoing development of
The Economic Impact of Tourism Brighton & Hove Prepared by: Tourism South East Research Unit 40 Chamberlayne Road Eastleigh Hampshire SO50 5JH
 The Economic Impact of Tourism Brighton & Hove 2013 Prepared by: Tourism South East Research Unit 40 Chamberlayne Road Eastleigh Hampshire SO50 5JH CONTENTS 1. Summary of Results 1 1.1 Introduction 1 1.2
Inverness, Culloden and Suburbs Settlement Economic Overview
 Strategic planning and research Economic information December 2007 Inverness, Culloden and Suburbs Settlement Economic Overview Summary Between 2001 and 2006, the population of Inverness, Culloden and
Produced by: Destination Research Sergi Jarques, Director
 Produced by: Destination Research Sergi Jarques, Director Economic Impact of Tourism Epping Forest - 2014 Economic Impact of Tourism Headline Figures Epping Forest - 2014 Total number of trips (day & staying)
Produced by: Destination Research Sergi Jarques, Director
 Produced by: Destination Research Sergi Jarques, Director Economic Impact of Tourism Oxfordshire - 2015 Economic Impact of Tourism Headline Figures Oxfordshire - 2015 Total number of trips (day & staying)
The Economic Impact of Tourism on Scarborough District 2014
 The Economic Impact of Tourism on Scarborough District 2014 Prepared by: Tourism South East Research Unit 40 Chamberlayne Road Eastleigh Hampshire SO50 5JH CONTENTS 1. Summary of Results 1 2. Table of
Zimbabwe. Provincial Report Manicaland
 Zimbabwe Provincial Report Manicaland ZIMBABWE POPULATION CENSUS 2012 Population Census Office P.O. Box CY342 Causeway Harare Tel: 04-793971-2 04-794756 E-mail: census2012@zimstat.ac.zw Census Results
East Lothian. Skills Assessment January SDS-1154-Jan16
 East Lothian Skills Assessment January 2016 SDS-1154-Jan16 Acknowledgement The Regional Skills Assessment Steering Group (Skills Development Scotland, Scottish Enterprise, the Scottish Funding Council
Revalidation: data from the first five years
 Revalidation: data from the first five years Contents Our strategy at a glance Revalidation to date 02 Number of doctors revalidated 03 Trends in and decisions 04 Revalidation by gender Revalidation by
Gwynedd and Anglesey Housing and the Welsh Language Survey
 Gwynedd and Anglesey Housing and the Welsh Language Survey Executive summary and main conclusions July 2014 Produced by the Research and Analytics Service, Gwynedd Council research@gwynedd.gov.uk Research
QCOSS Regional Homelessness Profile Mackay Statistical Division
 QCOSS Regional Homelessness Profile Mackay Statistical Division March 2011 Council of Social Service Inc (QCOSS) March 2011 QCOSS would like to thank the Department of Communities for providing data from
Barbadians. imagine all the people. Barbadians in Boston
 Barbadians imagine all the people Barbadians in Boston imagine all the people is a series of publications produced by the Boston Redevelopment Authority for the Mayor s Office of Immigrant Advancement.
Produced by: Destination Research Sergi Jarques, Director
 Produced by: Destination Research Sergi Jarques, Director Economic Impact of Tourism Norfolk - 2017 Contents Page Summary Results 2 Contextual analysis 4 Volume of Tourism 7 Staying Visitors - Accommodation
The Economic Impact of Tourism on Calderdale Prepared by: Tourism South East Research Unit 40 Chamberlayne Road Eastleigh Hampshire SO50 5JH
 The Economic Impact of Tourism on Calderdale 2015 Prepared by: Tourism South East Research Unit 40 Chamberlayne Road Eastleigh Hampshire SO50 5JH CONTENTS 1. Summary of Results 1 2. Table of Results Table
Produced by: Destination Research Sergi Jarques, Director
 Produced by: Destination Research Sergi Jarques, Director Economic Impact of Tourism North Norfolk District - 2016 Contents Page Summary Results 2 Contextual analysis 4 Volume of Tourism 7 Staying Visitors
Produced by: Destination Research Sergi Jarques, Director
 Produced by: Destination Research Sergi Jarques, Director Economic Impact of Tourism Norfolk - 2016 Contents Page Summary Results 2 Contextual analysis 4 Volume of Tourism 7 Staying Visitors - Accommodation
APPENDIX 8. Leeds Socio-Economic Baseline Report. Report. July Metro and Leeds City Council
 APPENDIX 8 Leeds Socio-Economic Baseline Report Report July 2009 Prepared for: Prepared by: Metro and Leeds City Council Steer Davies Gleave West Riding House 67 Albion Street Leeds LS1 5AA +44 (0)113
Produced by: Destination Research Sergi Jarques, Director
 Produced by: Destination Research Sergi Jarques, Director Economic Impact of Tourism Oxfordshire - 2016 Economic Impact of Tourism Headline Figures Oxfordshire - 2016 number of trips (day & staying) 27,592,106
Population analysis of North West London for John Lyon s Charity
 Population analysis of North West London for John Lyon s Charity This note summarises the findings of our population analysis for the eight north west London boroughs in which John Lyon s Charity is active.
The Economic Impact of Tourism Brighton & Hove Prepared by: Tourism South East Research Unit 40 Chamberlayne Road Eastleigh Hampshire SO50 5JH
 The Economic Impact of Tourism Brighton & Hove 2014 Prepared by: Tourism South East Research Unit 40 Chamberlayne Road Eastleigh Hampshire SO50 5JH CONTENTS 1. Summary of Results 1 1.1 Introduction 1 1.2
Supporting lone parents into work: The British Experience. Jane Hall Dept for Work and Pensions
 Supporting lone parents into work: The British Experience Jane Hall Dept for Work and Pensions Overview Current number of lone parents in Great Britain Provision for lone parents from the 1990s - Work
Perth and Kinross Economic Journal Quarter (April - June 2016)
") For more information regarding the content of this publication, please contact: Marek Styczen, Project Officer - Enterprise Planning & Development The Environment Service Perth & Kinross Council Pullar
For more information regarding the content of this publication, please contact: Marek Styczen, Project Officer - Enterprise Planning & Development The Environment Service Perth & Kinross Council Pullar
Published by the Stationery Office, Dublin, Ireland. Government Publications Sales Office, Sun Alliance House, Molesworth Street, Dublin 2,
 Published by the Stationery Office, Dublin, Ireland. To be purchased from the: Central Statistics Office, Information Section, Skehard Road, Cork, Government Publications Sales Office, Sun Alliance House,
Domestic Tourism to South West Wales in 2006, 2007 and 2008 Factsheet
 Domestic Tourism to South West Wales in 2006, 2007 and 2008 Factsheet Introduction Published June 2009 This factsheet provides summary tables of key tourism figures to South West Wales in 2006, 2007 and
Taking Part 2015/16: WEST MIDLANDS
 Taking Part 2015/16: WEST MIDLANDS 1 This report provides an overview of the arts and cultural engagement of adults living in the West Midlands. Data is taken from the Taking Part Survey 2015/16 and makes
NOT FOR BROADCAST OR PUBLICATION BEFORE 00:01, TUESDAY 1 MARCH 2016
 PRESS RELEASE NOT FOR BROADCAST OR PUBLICATION BEFORE 00:01, TUESDAY 1 MARCH 2016 The Bank of Scotland Rural Quality of Life Survey tracks where living standards are highest in Great Britain by ranking
Insight Department: Scotland The key facts on tourism in 2016
 Insight Department: Scotland The key facts on tourism in 2016 September 2017 Executive Summary & Background Information In 2016 just under 14.5 million overnight tourism trips were undertaken in Scotland.
Glasgow and Clyde Valley
 Glasgow and Clyde Valley Skills Assessment January 2016 SDS-1188-Feb16 Acknowledgement The Regional Skills Assessment Steering Group (Skills Development Scotland, Scottish Enterprise, the Scottish Funding
The Economic Impact of Tourism on the District of Thanet 2011
 The Economic Impact of Tourism on the District of Thanet 2011 Prepared by: Tourism South East Research Unit 40 Chamberlayne Road Eastleigh Hampshire SO50 5JH CONTENTS 1. Summary of Results 1 2. Table of
NOT FOR BROADCAST OR PUBLICATION BEFORE HRS ON 16 DECEMBER
 NOT FOR BROADCAST OR PUBLICATION BEFORE 00.01 HRS ON 16 DECEMBER 2017 ORKNEY RETAINS ITS SPOT AS THE SECOND BEST PLACE TO LIVE IN THE UK Orkney second most desirable place to live with no other Scottish
Youth Retention: July Value of post secondary education in regional settings. Prepared for Luminosity Youth Summit.
 Youth Retention: Value of post secondary education in regional settings Prepared for Luminosity Youth Summit July 2013 Prepared by MID NORTH COAST NSW Table of contents Table of contents... 2 Introduction...
Contents Manningham at a Glance... 6 Location and Area... 6 Manningham Activity Centres... 6 Manningham Suburbs... 6 Population... 8 Forecast... 9 For
 Contents Manningham at a Glance... 6 Location and Area... 6 Manningham Activity Centres... 6 Manningham Suburbs... 6 Population... 8 Forecast... 9 Forecast 2011 2036... 9 Population Forecast... 9 Gross
Key Stats. 2.6 Percentage points. 1,050 New Jobs Filled Since launch 0.7% 17.7% 35.5% 230 Since last year 2.2% 14.8% Economy. Labour Market and Skills
 Key Stats Economy Employment rate % Get Oldham Working 2.6 Percentage points Labour Market and Skills Level 3 Qualifications % NEET % 1,050 New Jobs Filled Since launch Business 0.7% New businesses in
Caravan & Camping Park Sector Annual Report 2011
 W Scottish Accommodation Occupancy Surveys Caravan & Camping Park Sector Annual Report 211 211 TNS UK Limited JN218761 May 212 211 TNS UK Ltd P a g e Contents Executive summary p. 1 Survey method p. 3
Insight Department: Scotland The key facts on tourism in 2016
 Insight Department: Scotland The key facts on tourism in 2016 September 2017 Executive Summary & Background Information In 2016 just under 14.5 million overnight tourism trips were undertaken in Scotland.
Review of Primary and Community Care Services Provided in North Wales: Population Profile of North Wales
 Review of Primary and Community Care Services Provided in North Wales: Population Profile of North Wales Authors: Dr Rob Atenstaedt, Consultant in Public Health Medicine, NPHS (Local Public Health Director,
2006 RENO-SPARKS VISITOR PROFILE STUDY
 2006 RENO-SPARKS VISITOR PROFILE STUDY PREPARED FOR RENO-SPARKS CONVENTION & VISITOR AUTHORITY Study Conducted and Reported by 475 Hill Street, Suite 2 Reno, Nevada 89501 (775) 323-7677 www.infosearchintl.com
Pete Harrison Prestatyn Artisans Collective
 Pete Harrison Prestatyn Artisans Collective Old and Alone Not just an Isolated Incident. A Prescription against Loneliness. ArtisanWales About Prestatyn Artisans Collective We were formed in August 2013.
Introduction 3. Accommodation 4. Ireland Market 5. Activity Providers, Attractions, Retail and Transport 6. Overseas Market Performance 7.
 Contents Page No: Introduction 3 Accommodation 4 Ireland Market 5 Activity Providers, Attractions, Retail and Transport 6 Overseas Market Performance 7 Prospects 8 Factors Impacting on Performance 9 Operational
Commissioned by: Economic Impact of Tourism. Stevenage Results. Produced by: Destination Research
 Commissioned by: Produced by: Destination Research www.destinationresearch.co.uk December 2016 Contents Page Introduction and Contextual Analysis 3 Headline Figures 5 Volume of Tourism 7 Staying Visitors
Commissioned by: Visit Kent. Economic Impact of Tourism. Canterbury Results. Produced by: Destination Research
 Commissioned by: Visit Kent Produced by: Destination Research www.destinationresearch.co.uk November 2016 Contents Page Introduction and Contextual Analysis 3 Headline Figures 6 Volume of Tourism 8 Staying
Accommodation Survey: November 2009
 Embargoed until 10:45am 19 January 2010 Accommodation Survey: November 2009 Highlights Compared with November 2008: International guest nights were up 2 percent, while domestic guest nights were down 1
The Economic Impact of Tourism Eastbourne Prepared by: Tourism South East Research Unit 40 Chamberlayne Road Eastleigh Hampshire SO50 5JH
 The Economic Impact of Tourism Eastbourne 2016 Prepared by: Tourism South East Research Unit 40 Chamberlayne Road Eastleigh Hampshire SO50 5JH CONTENTS Page 1. Summary of Results 1 1.1 Introduction 1 1.2
Puerto Ricans in Connecticut, the United States, and Puerto Rico, 2014
 Issued April 2016 Centro DS2016US-8 Puerto Ricans in Connecticut, the United States, and Puerto Rico, 2014 In 2014, Connecticut was the 6th state with most Puerto Ricans (301,182) in the United States.
PROFILE OF THE PUERTO RICAN POPULATION IN UNITED STATES AND PUERTO RICO: 2008
 PROFILE OF THE PUERTO RICAN POPULATION IN UNITED STATES AND PUERTO RICO: 2008 Sonia G. Collazo, Camille L. Ryan, Kurt J. Bauman U.S. Census Bureau Housing and Household Economic Statistics Division This
JOURNAL ECONOMIC PERTH & KINROSS Q1-Q2 2018
 For more information regarding the content of this publication, please contact: Marek Styczen, Project Officer - Enterprise Planning & Development The Environment Service Perth & Kinross Council Pullar
July 2016 Employment and Skills Briefing
 The following information summarises the DWP: (Central England Group) State of the Group Report (July 2016) and provides a focus on East Midlands through District level, local authority, and LEP data.
Economic Impact of Tourism. Norfolk
 Economic Impact of Tourism Norfolk - 2009 Produced by: East of England Tourism Dettingen House Dettingen Way, Bury St Edmunds Suffolk IP33 3TU Tel. 01284 727480 Contextual analysis Regional Economic Trends
Annual Gross Domestic Product (Production Measure)
") June 2017 Executive Summary Page 2 Latest Quarter Economic Trends page 3 Economic Outlook page 4 Labour Force page 5 Retail Activity page 6 Building Activity page 7 Tourism Trends page 8 Local Authorities
June 2017 Executive Summary Page 2 Latest Quarter Economic Trends page 3 Economic Outlook page 4 Labour Force page 5 Retail Activity page 6 Building Activity page 7 Tourism Trends page 8 Local Authorities
Page 1. Economic Impact Assessment of the Palm Island Community Company
 Page 1 Economic Impact Assessment of the Palm Island Community Company INCORPORATING: Empower North is a group of expert consultants providing select clients with an integrated service across the specialist
SERIES NO. SDT: Government of Tonga
 SERIES NO. SDT: 38-116 Government of Tonga Statistics Department P.O. Box 149, Nuku alofa, Kingdom of Tonga Website: www.spc.int/prism/tonga/ E-mail: dept@stats.gov.to April 2018 Price: Table of Contents
Economic Impact of Tourism. Hertfordshire Results. Commissioned by: Visit Herts. Produced by:
 Commissioned by: Visit Herts Produced by: Destination Research www.destinationresearch.co.uk December 2016 Contents Page Introduction and Contextual Analysis 3 Headline Figures 5 Volume of Tourism 7 Staying
JATA Market Research Study Passenger Survey Results
 JATA Market Research Study Passenger Survey Results Prepared for the Jackson Area Transportation Authority (JATA) April, 2015 3131 South Dixie Hwy. Suite 545 Dayton, OH 45439 937.299.5007 www.rlsandassoc.com
Economic Impact of Tourism. Cambridgeshire 2010 Results
 Economic Impact of Tourism Cambridgeshire 2010 Results Produced by: Tourism South East Research Department 40 Chamberlayne Road, Eastleigh, Hampshire, SO50 5JH sjarques@tourismse.com http://www.tourismsoutheast.com
2. Recommendations 2.1 Board members are asked to: i. note the content of the May 2018 Renfrewshire Economic Profile.
 To: Leadership Board On: 20 June 2018 Report by: Director of Development and Housing Services Heading: Renfrewshire Economic Profile May 2018 1. Summary 1.1 This report is the second edition of a revised
Regional Spread of Inbound Tourism. VisitBritain Research, August 2018
 Regional Spread of Inbound Tourism VisitBritain Research, August 218 1 Contents Introduction Summary Key metrics by UK area Analysis by UK area Summary of growth by UK area Scotland Wales North East North
HEALTH SECTOR ECONOMIC INDICATORS REPORT
 HEALTH SECTOR ECONOMIC INDICATORS REPORT For: Mid North Coast Local Health District Report prepared by: April 2013 Table of Contents Introduction 3 Executive Summary 4 Output 5 Value-Added 7 Workforce
Puerto Ricans in Rhode Island, the United States, and Puerto Rico, 2013
 Issued September 2016 Centro DS2015US-07 Puerto Ricans in Rhode Island, the United States, and Puerto Rico, 2013 In 2013 an estimated 36,217 Puerto Ricans lived in Rhode Island and accounted for at least
Puerto Ricans in Ohio, the United States, and Puerto Rico, 2014
 Issued April 2016 Centro DS2015US-12 Puerto Ricans in Ohio, the United States, and Puerto Rico, 2014 In 2014, Ohio had the tenth largest number of Puerto Ricans in the United States with 108,174 residents,
Tourism to the Regions of Wales 2008
 Tourism to the Regions of Wales 28 Key Facts on UK Domestic Tourism North Wales North Wales accounts for 37% of all trips and 35% of all spend in Wales 87% of visits to North Wales are for holiday purposes
Coordinated Population Forecast for Clackamas County, its Urban Growth Boundaries (UGB), and Area Outside UGBs
, and Area Outside UGBs") Coordinated Population Forecast for Clackamas County, its Urban Growth Boundaries (UGB), and Area Outside UGBs 2017-2067 Prepared by Population Research Center College of Urban and Public Affairs Portland
Coordinated Population Forecast for Clackamas County, its Urban Growth Boundaries (UGB), and Area Outside UGBs 2017-2067 Prepared by Population Research Center College of Urban and Public Affairs Portland
Sarah Curtis Durham University and University of Edinburgh
 Varying mental health in the population across Scotland during the recent recession: what do we know and what are the implications for public health policy? Sarah Curtis Durham University and University
Estimates of the Economic Importance of Tourism
 Estimates of the Economic Importance of Tourism 2008-2013 Coverage: UK Date: 03 December 2014 Geographical Area: UK Theme: People and Places Theme: Economy Theme: Travel and Transport Key Points This article
IT S YOUR AREA. what s important? TYWYN AREA. WELL-BEING ASSESSMENT GWYNEDD AND MÔN Gwynedd and Môn Public Services Board
 IT S YOUR AREA. what s important? TYWYN AREA WELL-BEING ASSESSMENT GWYNEDD AND MÔN Gwynedd and Môn Public Services Board 2016 well-being assessment Gwynedd WANT to HAVE YOUR SAY? and Môn The new act has
The Economic Impact of Tourism New Forest Prepared by: Tourism South East Research Unit 40 Chamberlayne Road Eastleigh Hampshire SO50 5JH
 The Economic Impact of Tourism New Forest 2008 Prepared by: Tourism South East Research Unit 40 Chamberlayne Road Eastleigh Hampshire SO50 5JH CONTENTS Glossary of terms 1 1. Summary of Results 4 2. Table
2013 IRVING HOTEL GUEST SURVEY Final Project Report
 2013 IRVING HOTEL GUEST SURVEY Final Project Report Research prepared for the Irving Convention & Visitors Bureau by Destination Analysts, Inc. Table of Contents SECTION 1 Introduction 2 SECTION 2 Executive
Know your market and build your business. How understanding target markets and local demographic/economic information can help local business
 Know your market and build your business How understanding target markets and local demographic/economic information can help local business March 24, 2015 About informed decisions.id stands for informed
Projected demand for independent schools in New South Wales over the next 40 years: Summary report
 Projected demand for independent schools in New South Wales over the next 40 years: Summary report Association of Independent Schools of New South Wales 22 October 2014 Glossary ABS ACT AIS ASGS DAE FTE
Inverclyde Incapacity Benefit Claimant Profile
 Scottish Observatory for Work and Health University of Glasgow Inverclyde Incapacity Benefit Claimant Profile April 21 Judith Brown Joel Smith David Webster James Arnott Ivan Turok Ewan Macdonald Richard
Merseyside & Cheshire Local Authority Profile
 Injury Surveillance in the North West of England Merseyside & Cheshire Local Authority Profile St Helens Road Traffic Collisions April 2012 to March 2015 February 2016 Jennifer Germain, Simon Russell and
Holiday Habits Report. ABTA Consumer Survey 2015
 Holiday Habits Report ABTA Consumer Survey 2015 Number of holidays taken Our research findings suggest that growth in the number of holidays is being driven by more affluent consumers. Overall 77% of Britons
Rail Update Station Usage Statistics and Network Rail Performance
 Rail Update Station Usage Statistics and Network Rail Performance Committee Operations Date of meeting 26 January 2018 Date of report 21 December 2017 Report by Senior Director 1. Object of report To update
Statistical Picture of Aboriginal and Torres Strait Islander School Students in Australia
 Chapter 2 Statistical Picture of Aboriginal and Torres Strait Islander School Students in Australia Statistical Picture The Australian Bureau of Statistics (ABS) reported that the estimated resident Aboriginal
International Passenger Survey (IPS) Methodology. May 2017
 Methodology. May 2017") International Passenger Survey (IPS) Methodology May 2017 1 Contents Introduction IPS and VisitBritain Key concepts and definitions Sampling approach Collection of IPS data Producing national estimates
International Passenger Survey (IPS) Methodology May 2017 1 Contents Introduction IPS and VisitBritain Key concepts and definitions Sampling approach Collection of IPS data Producing national estimates
SOCIAL ENTERPRISE IN EDINBURGH: PEOPLE, PROFIT AND PLACE
 SOCIAL ENTERPRISE IN EDINBURGH: PEOPLE, PROFIT AND PLACE Introduction Edinburgh is a leading centre for social enterprise and home to some high profile organisations in the sector. With over 70 members,
STATISTICAL BULLETIN ON INTERNATIONAL ARRIVALS, DEPARTURES AND MIGRATION 2011 SERIES NO. SDT: Government of Tonga
 SERIES NO. SDT: 38-13 Government of Tonga STATISTICAL BULLETIN ON INTERNATIONAL ARRIVALS, DEPARTURES AND MIGRATION 2011 Statistics Department, P.O. Box 149, Nuku alofa, Kingdom of Tonga Website: www.spc.int/prism/tonga/
 CONTENTS FOREWORD... 3 1. INTRODUCTION... 4 1.1. General information... 4 1.2. The sample... 4 1.3. Questionnaires... 5 1.4. Changes in the 2007 questionnaire compared to 2004... 5 1.5. Data entry... 6
The regional value of tourism in the UK: 2013
 Article: The regional value of tourism in the UK: 2013 Estimates of the economic value of tourism within UK regions and sub-regions. It includes supply and demand data relating to tourism and tourism industries.
PEMBROKESHIRE & CORNWALL VISITOR SURVEYS 2011/12 COMPARING THE DESTINATIONS. February 2013
 PEMBROKESHIRE & CORNWALL VISITOR SURVEYS 2011/12 COMPARING THE DESTINATIONS February 2013 Prepared for: Visit / Destination Pembrokeshire Partnership Client Contact: Emma Rojano/ Mark Horner TERMS OF CONTRACT
Baggage Fees User Guide and Codebook. Angus Reid Institute
 Baggage Fees 2014 User Guide and Codebook Angus Reid Institute User Guide compiled by: Data Services, Academic Services Queen s University Library 2016 Table of Contents Introduction... 2 Metadata... 2
2011 POPULATION AND HOUSING CENSUS
 HELLENIC REPUBLIC HELLENIC STATISTICAL AUTHORITY Piraeus, 12 September 2014 2011 POPULATION AND HOUSING CENSUS Demographic and social characteristics of the Resident Population of Greece according to the
The Future of Street Lighting in Leeds November 2017 to January 2018 Public Consultation Document
 The Future of Street Lighting in Leeds November 2017 to January 2018 Public Consultation Document Should we turn off more street lights between midnight and 5:30 am? If so, how should we decide which ones
Methodology and coverage of the survey. Background
 Methodology and coverage of the survey Background The International Passenger Survey (IPS) is a large multi-purpose survey that collects information from passengers as they enter or leave the United Kingdom.
State of the Shared Vacation Ownership Industry. ARDA International Foundation (AIF)
") State of the Shared Vacation Ownership Industry ARDA International Foundation (AIF) This paper includes a high-level overview of the timeshare industry with a core focus on financial growth, owner demographics
State of the Shared Vacation Ownership Industry ARDA International Foundation (AIF) This paper includes a high-level overview of the timeshare industry with a core focus on financial growth, owner demographics
The Yorke & Mid North (State Govt) Region. Workforce Wizard Region Report
 Region. Workforce Wizard Region Report") The Yorke & Mid North (State Govt) Region Workforce Wizard Region Report Table of Contents Executive Summary 3 Population and Social Characteristics 4 Current Population 4 Age Groups 4 Key Populations
The Yorke & Mid North (State Govt) Region Workforce Wizard Region Report Table of Contents Executive Summary 3 Population and Social Characteristics 4 Current Population 4 Age Groups 4 Key Populations
Employment and Skills Briefing (March 2015)
") Neil Brown Policy and Intelligence Officer t: 0115 854 1313 e: neilb@emfec.co.uk The following information summarises the DWP (Central England Group) State of the Group Report March 2015 and provides a
Neil Brown Policy and Intelligence Officer t: 0115 854 1313 e: neilb@emfec.co.uk The following information summarises the DWP (Central England Group) State of the Group Report March 2015 and provides a
Construction Industry Focus Survey. Sample
 Construction Industry Focus Survey 1 CONTENTS Executive Summary 1 1. Leading Activity Indicator 2 2. Activity by sector and constraints Residential, Non-residential, Civil Engineering 3. Orders and Tenders
Commissioned by: Visit Kent. Economic Impact of Tourism. Dover Results. Produced by: Destination Research
 Commissioned by: Visit Kent Produced by: Destination Research www.destinationresearch.co.uk November 2016 Contents Page Introduction and Contextual Analysis 3 Headline Figures 6 Volume of Tourism 8 Staying