Contents Manningham at a Glance... 6 Location and Area... 6 Manningham Activity Centres... 6 Manningham Suburbs... 6 Population... 8 Forecast... 9 For
|
|
|
- Clare Carroll
- 5 years ago
- Views:
Transcription

1
2 Contents Manningham at a Glance... 6 Location and Area... 6 Manningham Activity Centres... 6 Manningham Suburbs... 6 Population... 8 Forecast... 9 Forecast Population Forecast... 9 Gross Regional Product Gross Regional Product table Economic Growth Registered Businesses Top 3 Industries with the most registered businesses Business Counts Turnover and Staff Size Building Approvals Residential versus non-residential building approvals Houses versus Other Residential Planning permit applications Manningham Jobs / Workforce Jobs Hours Worked Gender Age Groups Qualification Occupation Top Three Occupations in Manningham Income Residential Location of Workers Manningham Industry Focus Industry Overview Retail Trade Healthcare and Social Assistance Education and Training Accommodation and Food Services Professional, Scientific and Technical Services Manningham Residents / Labour Force P a g e
3 Local Labour Force Work Location of Residents Unemployment Rate Youth Unemployment Travel to Work Encouraging Local Shopping Manningham Tourism and Visitation Tourism Snapshot Visitor Profile Domestic Daytrip Visitors Domestic Overnight Visitors International Visitors Value of Tourism Appendium More Information Notes Data Source P a g e
4 4 P a g e

5

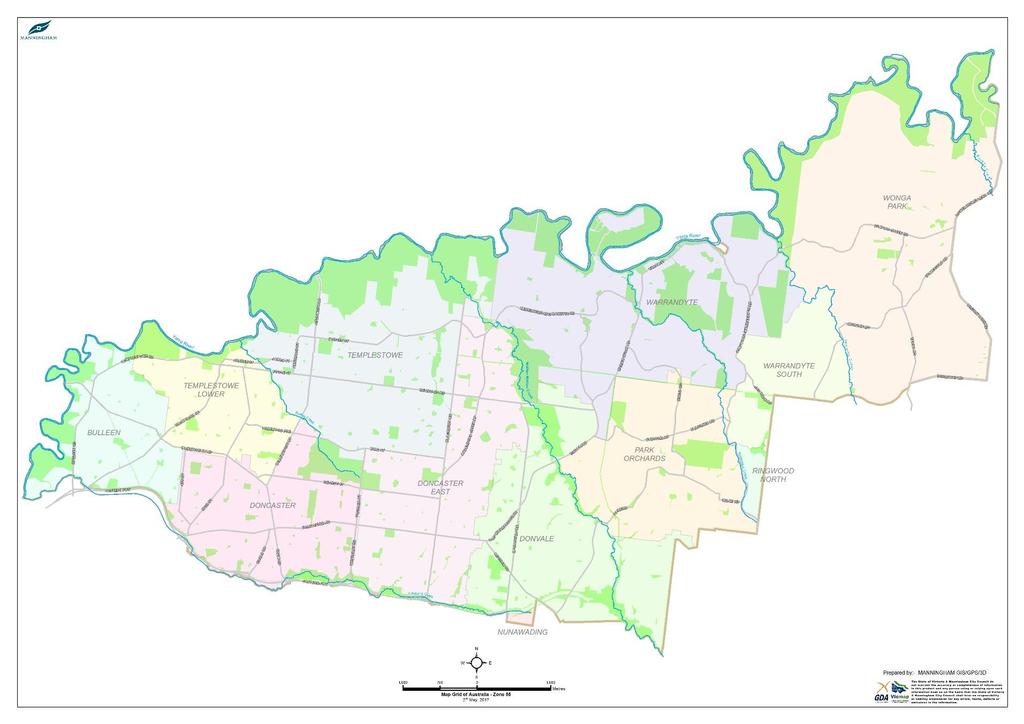
6 Manningham at a Glance Location and Area Manningham is situated in the eastern suburbs of Greater Melbourne. The City has a total land area of 114 square kilometres, including substantial green open spaces. The municipality is mostly defined by natural boundaries: the Yarra to the north and west, Koonung Creek to the south. The Mullum Mullum Creek divides Manningham into two distinct areas with the land to the west being urban in character and primarily rural/residential land to the east. Our transport network includes more than 40 bus routes, more than 45 kilometres of off-road bicycle trails and 850 kilometres of roads. Manningham Activity Centres Manningham Suburbs Manningham includes the following suburbs: Bulleen Doncaster Doncaster East Donvale / Nunawadding Park Orchards / Ringwood North Templestowe Templestowe Lower Warrandyte / Warrandyte South Wonga Park 6 P a g e
7 7 P a g e
8 Population Manningham s estimated residential population (ERP) for 2016 is 120,765 5 Year Age Groups Compared Against Greater Melbourne Compared to Greater Melbourne, Manningham has: A lower proportion of younger people AGED 0-24 YEARS (29.6% compared to 32.3%) A lower proportion of working aged group YEARS (44.7% compared to 49.5%) A higher proportion of empty nesters and retirees AGED YEARS (12.1% compared to 9.0%) A higher proportion of seniors and elderly AGED 70+ YEARS (13.57% compared to 9.3%) 8 P a g e
 An increase growth in the number of seniors AGED 70-84 YEARS (13.4% to 16.3% A drop in the proportion of COUPLES WITH CHILDREN HOUSEHOLDS (39% to 36.")
9 Forecast Forecast Comparison of general demographics between 2011 and 2036 Maintain a stable proportion of WORKING AGE GROUP YEARS (45% to 44.5%) An increase growth in the number of seniors AGED YEARS (13.4% to 16.3% A drop in the proportion of COUPLES WITH CHILDREN HOUSEHOLDS (39% to 36.4%) Population Forecast Forecast Population, Household and Average Household Size An increase in LONE PERDON HOUSEHOLDS (18.6% to 20/6%) An additional 14,048 DWELLINGS With the largest growth in the suburb of Doncaster Hill (1,139.1% compared to Citywide 33.7%) 9 P a g e
 of $3.")
10 Forecast Births, Death and Natural Increase/Decrease Births Deaths Natural increase/decrease 10,000 8,000 6,000 4,000 2, ,000-4,000-6,000-8, to to to to ,750 1,700 1,650 1,600 1,550 1,500 1,450 Gross Regional Product Manningham s economy has steadily grown over the past three years from a Gross Regional Product (GRP) of $3.355BN in 2014 to an estimated $3.364BN in 2016 Gross Regional Product table 10 P a g e
 11 P a")
11 Economic Growth ( ) 11 P a g e
12 Registered Businesses Total Number of registered businesses in Manningham in June ,878 The largest changes in the number of registered businesses between 2012 and 2015 were. Construction (+117 businesses) Health Care and Social Assistance (+116 businesses) Financial and Insurance Services (+98 businesses) Top 3 Industries with the most registered businesses (as a % of all businesses for 2015) Construction 16.54% Rental, Hiring and Real Estate Services 15.64% Professional, Scientific and Technical Services 14.09% Top 3 Industries Construction, 16.54% Rental, Hiring and Real Estate Services, 15.64% Professional, Scientific and Technical Services, 14.09% Business Counts by Industry Jun-12 Jun-13 Jun-14 Jun-15 Agriculture, Forestry and Fishing Mining Manufacturing Electricity, Gas, Water and Waste Services Construction 2,013 2,010 2,063 2,130 Wholesale Trade Retail Trade Accommodation and Food Services Transport, Postal and Warehousing Information Media and Telecommunications Financial and Insurance Services 1,384 1,380 1,416 1,482 Rental, Hiring and Real Estate Services 1,965 1,931 1,959 2,014 Professional, Scientific and Technical Services 1,907 1,821 1,826 1,814 Administrative and Support Services Public Administration and Safety Education and Training Health Care and Social Assistance Arts and Recreation Services Other Services Not Classified Total 12,823 12,575 12,694 12, P a g e
13 Business Council Change Business Counts Turnover and Staff Size Small business (under 5 employees) makes up 88.13% of all businesses in Manningham A majority (62.78%) of all business in Manningham turnover less than $200,000 Turnover Range No. % No. % No. % No. % Change Zero to $50k 5, % 5, % 5, % 4, % % $50k to less than $100k 4, % 4, % 4, % 3, % % $100k to less than $200K 4, % 4, % 3, % 3, % -9.51% $200k to less than $500k 3, % 3, % 3, % 3, % -1.79% $500k to less than $2m 2, % 2, % 2, % 2, % -0.75% $2m or more 1, % 1, % 1, % 1, % 8.73% Total 21, % 21, % 20, % 19, % -8.77% Workforce Size No. % No. % No. % No. % Change Non-Employing 13, % 13, % 12, % 11, % % 1-4 Staff 5, % 5, % 5, % 5, % -7.65% 5-19 Staff 1, % 1, % 1, % 1, % 1.46% Staff % % % % 1.20% 200+ Staff % % % % 0.00% Total 21, % 21, % 20, % 19, % -8.57% 13 P a g e
14 Business Staff Size Have 5-19 Employees, 9.62% Have Employees, 2.17% Have 200+ Employees, 0.09% Have 1-4 Employees, 27.32% Have no Employees, 60.81% (as a % of all businesses for 2015) Business Turnover $500k to less than $2m, 12.92% $2m or more, 5.70% Zero to $50k, 23.95% $200k to less than $500k, 18.59% $100k to less than $200K, 19.13% $50k to less than $100k, 19.70% (as a % of all businesses for 2015) 14 P a g e
15 Building Approvals There has been a strong increase in value of building approvals in the last ten years since From $ million in to $ million in Building and Dwelling Approvals Residential versus non-residential building approvals Commercial activity is a relatively small percentage (18% in 2016) of all building activity in Manningham Residential Building Approvals, 82% Non-residential Building Approvals, 18% (as a % of all building activity ) 15 P a g e
16 Houses versus Other Residential There has been an increase in other residential dwelling types in recent years. Majority of this has been seen in Doncaster Hill and other identified high growth areas, such as DDO8 and DDO9. Investment in Manningham is mostly focus mostly in the western suburbs of the City. The following map details planning permit applications in Manningham for 2013 through to P a g e

17 Planning permit applications P a g e

18
19 Manningham Jobs / Workforce Jobs There were 23,878 jobs located in Manningham in the Year ending June 2016 Workforce in Manningham by Industry (2011) Retail is the largest employer, generating 4,925 (20.6%) local jobs. Health Care and Social Assistance (15.1%) is the nest highest employer followed by Education & Training (11.4%). These industries also saw the largest growth in hobs ( ). Top 3 Industries with Largest Growth in Job Numbers Education and Training, +187 Retail Trade, +593 Health Care and Social Assistance, P a g e
20 Wholesale Trade saw the largest drop in employment (-36), followed by Manufacturing (- 32) and then Administrative and Support Services (-16) Industries with the Largest Drop in Job Number Wholesale Trade, -36 Manufacturing, -32 Administrative and Support Services, Hours Worked Less than half of those employed in the Retail Trade Industry work full-time (45%) Just under half of those employed in Health Care and Social Assistance work full-time (47%) Over half of those employed in the Education and Training work full-time (54%) A significant majority of those employed in the Professional, Scientific and Technical Services work full-time (71%) Proportion of Workforce Working Part-Time Victoria, 31.60% Melbourne SD, 30.20% Manningham, 46.49% 0.00% 10.00% 20.00% 30.00% 40.00% 50.00% 20 P a g e
21 Gender In comparison to men, women in the workplace were, More likely to have Worked Part-Time (59% compared to 35%) More likely to have completed A Diploma or Higher Degree (43% compared to 40%) Less likely to have Earned a higher income ($1,500 per week or more) For every one male worker in Manningham, there are 1.26 female workers. Workforce Gender Split Females Workers, 56% Male Workers, 44% Comparison of Income by Gender 21 P a g e
22 Comparison of Qualification by Gender Comparison of Employment Type by Gender 22 P a g e
23 Age Groups Compared to Greater Melbourne, Manningham has: A higher proportion of younger workers aged years (20.9% compared to 14.1%) A lower proportion of the working aged group years (58.2% compared to 69.7%) Higher proportion of older workers aged 55 + (20.9% compared to 16.2%) Workforce by Age Groups 80.00% 70.00% 60.00% 50.00% 40.00% 30.00% 20.00% 10.00% 0.00% 69.70% 58.20% 20.90% 20.90% 14.10% 16.20% Years Years 55+ Years Manningham Melbourne The largest change in the age structure of the workforce in Manningham between 2006 and 2011 were: years (+554 people) years (+514 people) 65+ years (+363 people) 23 P a g e
24 Qualification People who work in Manningham have a fairly similar spread of qualifications to Greater Melbourne with around 42% having a tertiary qualification and around 17% having a certificate. Workforce Qualifications No Qualification 34.70% 37.08% Certificate 18.50% 17.20% Advanced Diploma and Diploma 10.80% 12.59% Bachelor of higher degree 32% 29.70% 0.00% 5.00% 10.00% 15.00% 20.00% 25.00% 30.00% 35.00% 40.00% Melbourne Manningham Proportion of Manningham workforce with a Bachelor or Higher Degree has increased between 2006 and Bachelor or Higher Degree 36.90% 42.29% Occupation Compared to Greater Melbourne, people who work in Manningham are: More likely to be Sales Workers (17.8% compared to 9.9%) More likely to be Community and Personal Services Workers (14.6% compared to 8.9%) 24 P a g e
25 Between 2006 and 2011 the largest changes in the occupations held by Manningham workforce were: Sales workers (+646 people 17.56%) Community and personal services workers (+581 people 19.66%) Professionals (+260 people 5.42%) Labourers (-63 people -4.15%) Top Three Occupations in Manningham In combination these three occupations account for 53.4% of the workforce Top three occupations in Manningham Professionals, 20.93% Sales Workers, 17.88% Community and Personal Service Workers, 14.63% Income Overall 14.05% of Manningham s workforce earn a high income ($1,500 per week or more) and 41.45% earn a low income (less than $400 per week). This is significantly different to Greater Melbourne, 22.2% and 14.8% respectively. Income, over $1,500 per week Manningham, 14.05% Greater Melbourne, 22.20% Victoria, 19.10% 25 P a g e
26 Residential Location of Workers In % of Manningham s workforce were local residents. Whitehorse, Maroondah and Banyule were the top three places of residence outside of Manningham for its workforce. Residential Location of Workers Work in area but live outside, 54.79% Live and work in the same area, 45.21% 26 P a g e

27 Heat Map LGA of Residence for Workers in Manningham 27 P a g e

28
 Largest three industries in Manningham are Retail Trade, Health Care and Social Assistance and Education and Training.")
29 Manningham Industry Focus Industry Overview In combination the three largest industries account for 11,242 people in total (47.08% of the workforce.) Largest three industries in Manningham are Retail Trade, Health Care and Social Assistance and Education and Training. With Accommodation and Food Services and Professional, Scientific and Technical Services making up the top five. Largest Three Industries in Manningham (by employment) Retail Trade, 4,925 Health Care and Social Assistance, 3,599 Education and Training, 2,718 Manningham Output, by Industry Sector 29 P a g e
30 Retail Trade Retail Trade is the largest employer in Manningham employing 4,925 people, making up 20.63% of total employment. It generated the third largest output at $539 million or 9.1% of the total output of Manningham. The majority of the workforce; Are aged years (26%) Are female (64%) Have no qualification (56%) Earn less than $400 per week (45%) Have an occupation as a Sales Worker (63%) 30 P a g e
31 Retail Gender Split 3163, 64% 1762, 36% Employed - Males Employed - Females Retail Jobs: 4,925 Full Time Equivalents: 3,411 Jobs 31 P a g e
32 Healthcare and Social Assistance Healthcare and Social Assistance is the second largest employer in Manningham employing 3,599 people, making up 15.07% of total employment. It generated the seventh largest output at $407 million or 6.9% of the total output of Manningham. The majority of the workforce; Are aged (49.5%) Are female (75%) Have a bachelor degree (30.1%) Earn between $400 and $1,000 per week (43.3%) Have an occupation as a Community and Personal Service Worker (39.8%) 32 P a g e
33 Health Care Gender Split 897, 25% Health Care Jobs: 3, , 75% Employed - Males Employed - Females Full Time Equivalents: 2,838 Jobs 33 P a g e
34 Education and Training Education and Training is the third largest employer in Manningham employing 2,718 people, making up 11.38% of total employment. It generated the ninth largest output at $290 million or 4.9% of the total output of Manningham. The majority of the workforce; Are aged (69.8%) Are female (75%) Have a bachelor degree (40.8%) Earn over $1,000 per week (45.2%) Have an occupation as a Professional (62.8%) 34 P a g e
35 Education and Training Gender Split 674, 25% Education and Training Jobs: 2, , 75% Employed - Males Employed - Females Full Time Equivalents: 2,310 Jobs 35 P a g e
36 Accommodation and Food Services Accommodation and Food Services is the fourth largest employer in Manningham employing 2,022 people, making up 8.47% of total employment. It generated the tenth largest output at $236 million or 4.0% of the total output of Manningham. The majority of the workforce; Are aged (48.3%) Are equally male and female (50% each) Have no qualification (60.7%) Earn below $400 per week (53.9%) Have an occupation as Community and Personal Service Workers (32.4%) 36 P a g e
37 Accomod. and Food Services Gender Split Accomod. and Food Services Jobs: 2, , 50% Employed - Males 1020, 50% Employed - Females Full Time Equivalents: 1,358 Jobs 37 P a g e
38 Professional, Scientific and Technical Services Professional, Scientific and Technical Services is the fifth largest employer in Manningham employing 1,980 people, making up 8.29% of total employment. It generated the fourth largest output at $530 million or 8.9% of the total output of Manningham. The majority of the workforce; Are aged (26.2%) Are male (58% each) Have a bachelor degree of higher (51.1%) Earn over $1,000 per week (51.5%) Have an occupation as Professionals (52.6%) 38 P a g e
39 Prof., Scien., Tech Gender Split 836, 42% 1144, 58% Employed - Males Employed - Females Prof., Scient., and Tech Services Jobs: 1,980 Full Time Equivalents: 1,795 Jobs 39 P a g e

40
41 Dec-10 Mar-11 Jun-11 Sep-11 Dec-11 Mar-12 Jun-12 Sep-12 Dec-12 Mar-13 Jun-13 Sep-13 Dec-13 Mar-14 Jun-14 Sep-14 Dec-14 Mar-15 Jun-15 Sep-15 Dec-15 Mar-16 Jun-16 Manningham Residents / Labour Force Local Labour Force In Manningham, there are 55,827 residents in the local labour force. (Defined as people aged 15+ years that reside in the area and are employed or looking for work) The largest percentage are employed in Retail Trade (12.7%) Labour Force including Unemployment (Small Areas Labour Market June 2016) 64,000 62,000 60,000 58,000 56,000 54,000 52,000 50,000 48,000 Labour Force (Quarterly) No. of Employed No. of Unemployed Unemployment Rate Compared to Greater Melbourne, characteristics of the employed local labour force include the following: Higher level of Tertiary Qualifications (50.0% compared to 43.0%) Higher level of older workers Aged Years (16.3% compared to 13.0%) Higher use of Public Transport (13.0% compared to 11.6%) Higher proportion Earn a High Income (over $1,500 per week) (25.1% compared to 20.7%) Higher level of Working Part-Time (36.9% compared to 30.5%) Higher level of occupation as Professionals 28.0% compared to 24.4%) 41 P a g e
42 Labour Force Breakdown Industry (labour force includes employment and unemployment) Work Agriculture, Forestry and Fishing Mining Manufacturing 3, , Electricity, Gas, Water and Waste Services Construction 3, , Wholesale Trade 2, , Retail Trade 2,988 3, , Accommodation and Food Services 1,460 1, , Transport, Postal and Warehousing 1, , Information Media and Telecommunications , Financial and Insurance Services 2, , Rental, Hiring and Real Estate Services , Professional, Scientific and Technical Services 4,017 1, , Administrative and Support Services , Public Administration and Safety 1, , Education and Training 2,396 1, , Health Care and Social Assistance 3,019 3, , Arts and Recreation Services Other Services 1, , Inadequately described Not stated Not applicable^ 1,391 1, ,634 33,899 21,575 Total 33,893 19,010 2,924 55,827 33,899 21,575 ~Persons able but not participating in the Labour Force (mostly by choice) *Persons under the age of 15 ^Persons unemployed have no associated industry Full Time Labour Force Away from Part Time Not in Labour Force~ Not Stated/Not Applicable* Labour Force Breakdown Age (Labour Force includes employment and unemployment) Work 0-4 years , years , years , years 403 2, ,012 4, years 2,657 2, ,582 1, years 3, , years 3, , years 3,681 1, ,398 1, years 4,405 2, ,706 1, years 4,731 2, ,025 1, years 4,395 1, ,481 1, years 3,336 1, ,232 1, years 2,053 1, ,779 3, years ,924 4, years , years , years , years , years years years and ove Total 33,896 19,006 2,922 55,824 33,897 21,580 ~Persons able but not participating in the Labour Force (mostly by choice) *Persons under the age of 15 Full Time Labour Force Away from Part Time Total Total Not in Labour Force~ Not Stated/Not Applicable* 42 P a g e
 565 2,113 166 2,844 5,931 101 $300-$399 ($15,600-$20,799) 675 2,192 197 3,064 4,853 102 $400-$599 ($20,800-$31,199) 2,142 3,510 350 6,002 4,298 68 $600-$799")
43 Labour Force Breakdown Income (Labour Force includes employment and unemployment) Work Negative income Nil income ,484 7, $1-$199 ($1-$10,399) 392 3, ,024 3, $200-$299 ($10,400-$15,599) 565 2, ,844 5, $300-$399 ($15,600-$20,799) 675 2, ,064 4, $400-$599 ($20,800-$31,199) 2,142 3, ,002 4, $600-$799 ($31,200-$41,599) 4,076 2, ,812 2, $800-$999 ($41,600-$51,999) 4,313 1, ,977 1, $1,000-$1,249 ($52,000-$64,999) 4,906 1, , $1,250-$1,499 ($65,000-$77,999) 3, , $1,500-$1,999 ($78,000-$103,999) 5, , $2,000 or more ($104,000 or more) 6, , Not stated ,008 1,470 2,817 Not applicable ,265 Total 33,894 19,010 2,923 55,827 33,899 21,575 ~Persons able but not participating in the Labour Force (mostly by choice) *Persons under the age of 15 Full Time Labour Force Away from Part Time Total Not in Labour Force~ Not Stated/Not Applicable* Labour Force Breakdown Residential Location Full Time employment 5.54% 6.64% 8.93% 8.93% 14.16% 8.36% 5.67% 43 P a g e
44 Work Location of Residents 67.8% of Manningham s employed residents travel outside of the area to work The City of Melbourne, Whitehorse and Boroondara are the top three work locations for Manningham residents. Work location unknown, 11.4% Work Location of Residents Live and work in the area, 20.8% Live in the area, but work outside, 67.8% 44 P a g e

45 Residents Place of Work 45 P a g e

 Sep-16 Jun-16 Mar-16 Dec-15 Sep-15 0% 20% 40% 60% 80% 100% Bulleen Doncaster Doncaster East Donvale - Park Orchards Templestowe")
46 Unemployment Rate The unemployment rate in Manningham has gradually increased from 4.3% in September 2011 to 5.7% in September Warrandyte / Wonga Park has the lowest unemployment in Manningham at 1.6%, with a labour force of 6,097. Doncaster has the highest proportion at 8.7%, with a labour force of 10,324. Proportition of Unemployment (suburbs) Sep-16 Jun-16 Mar-16 Dec-15 Sep-15 0% 20% 40% 60% 80% 100% Bulleen Doncaster Doncaster East Donvale - Park Orchards Templestowe Templestowe Lower Warrandyte - Wonga Park (Small Area Labour Marketing, September 2016) Unemployment Rate (Small Area Labour Market, September 2016) by Location (sa2) 6.8% 6.5% 4.7% 1.6% 8.7% 7.0% 2.0% 46 P a g e
47 In the June 2016 quarter; Manningham had a Higher Unemployment rate than the Melbourne East (5.8% compared to 4.8%) Manningham is Slightly Lower Unemployment than Greater Melbourne (5.8% compared to 5.9%) Unemployment Rate (Quarterly) 8.0% 7.0% 6.0% 5.0% 4.0% 3.0% 2.0% 1.0% 0.0% Manningham (C) Melbourne East Greater Melbourne (GCCSA) Youth Unemployment Youth unemployment rate (aged years) in Manningham was 10.8% (2011), which is higher than the current general unemployment rate of 5.8%. This rate is consistent with the Melbourne Inner East (10.8%) and Melbourne Outer East (10.2%). This however is lower than the youth unemployment rate in Greater Melbourne (14.3%). Youth unemployment is only available at LGA level for the Census, the other rates are current for September P a g e
48 Travel to Work In 2011 most use method of travel (by gender) to work other than car only was they either did not go to work or worked from home. Most used mode to travel to work, location and gender Bulleen Templestowe Lower Templestowe Warrandyte - Wonga Park Donvale - Park Orchards Doncaster East Doncaster *Car as driver and car as passenger ^Other than Did not travel to work or worked from home Method of Travel to Work Most Common* Second Most Common^ Male Car 77.87% Truck 1.33% Female Car 72.89% Walked Only 1.83% Male Car 65.60% Walked Only 1.65% Female Car 68.92% Bus 2.30% Male Car 65.06% Walked Only 2.50% Female Car 63.04% Walked Only 1.99% Male Car 64.01% Walked Only 4.43% Female Car 61.79% Walked Only 3.05% Male Car 59.85% Truck 3.06% Female Car 60.89% Walked Only 1.14% Male Car 72.35% Bus 2.35% Female Car 69.94% Walked Only 2.42% Male Car 71.93% Bus 3.41% Female Car 67.32% Bus 4.25% Encouraging Local Shopping Manningham residents have a strong appreciation for local shopping centres and believe they cater to their everyday needs. Understanding our community survey / / /2016 My local shopping area provides for my 70% 83% 84% everyday needs 48 P a g e

49
50 Manningham Tourism and Visitation Tourism Snapshot Annual visitors to Manningham is 408,782 (average annual visitors ) Visiting Friends and Relatives is the highest reason for travel at 210,835 (51%), consisting of; 140,920 (46%) Domestic Daytrips Visitors 56,774 (71%) Domestic Overnight Visitors 19,463 (68%) International Visitors Visitor Profile Visitor Profile Domestic Day Domestic Overnight International Average stay (nights) Average spend per trip ($) $112 $834 $2,622 Average spend per night ($) - $302 $119 Domestic Daytrip Visitors For Melbourne East the average Domestic Daytrip Visitor is; More likely to come from Melbourne 50.9% (Regional Victoria 49.1%) More likely to be 55 years or older (44% of Domestic Daytrip Visitors) More likely to participate in Eat out / dine at a restaurant and / or café (29.8% of Domestic Daytrip Visitors) Top Five Activity participation by Domestic Daytrip Visitors (%) to Melbourne East Activity % of Domestic Daytrip Visitors Eat out / dine at a restaurant and / or café 29.8% Go shopping for pleasure 9.7% Picnics or BBQs 4.9% Sightseeing / Looking around 4.7% Pubs, clubs, discos etc 4.3% Domestic Overnight Visitors For Melbourne East the average Domestic Overnight Visitor is; More likely to come from Victoria (53.4% of Domestic Overnight Visitors) More likely to be 55 years or older (43% of Domestic Overnight Visitors) More likely to Travel alone (44.9% of Domestic Overnight Visitors) More likely to participate in Eat out / dine at a restaurant and / or café (51.5% of Domestic Overnight Visitors) 50 P a g e
51 Travel Party Type of Domestic Overnight Visitors (%) to Melbourne East Friends or Relatives travelling together - without children, 8.20% Friends or Relatives travelling together - with children, 2.50% Travelling Alone, 44.90% Family Group - parents and children, 16.60% Adult Couple, 27.90% Top Five Activity participation by Domestic Overnight Visitors (%) to Melbourne East Activity % of Domestic Overnight Visitors Eat out / dine at a restaurant and / or café 51.5% Go shopping for pleasure 32.2% Sightseeing / Looking around 15.1% Pubs, clubs, discos etc 14.3% Go to markets 9.7% Accommodation type for Domestic Overnight Visitors Accommodation type of Domestic Overnight Visitors (%) in Melbourne East 92% 4% 2% 1% 1% 1% Friends of relatives property Standard hotel/motel Inn (below 4 star) Luxury hotel or luxury resort (4 or 5 star) Serviced Apartment Rented house / apartment / flat or unit (not servied daily) Other 51 P a g e
52 International Visitors For Melbourne East the average International Visitor is: More likely to come from China (23.4% of International Visitors) More likely to be 55 years or older (41% of International Visitors) More likely to Stay with Friends or Relatives (89% of International Visitors) Top Five Origins of International Visitors (%) to Melbourne East Origin State % of Visitors China 23.4% New Zealand 12.1% Malaysia 10.5% United Kingdom 7.9% Other Asia 6.3% Accommodation type of International Visitors (%) in Melbourne East 89% 3% 2% 1% 1% 1% Friends of relatives property Standard hotel/motel Inn (below 4 star) Luxury hotel or luxury resort (4 or 5 star) Serviced Apartment Rented house / apartment / flat or unit (not servied daily) Other Value of Tourism Tourism in Manningham Output of Tourism in Manningham is $217,495,000 Tourism employs 1,258 people Tourism spend is more likely attributed to Retail Trade ($54,050,000 attributed to tourism in Manningham) Tourism employment is more likely in Retail Trade (494 persons in Manningham) 52 P a g e
53 Total Output with Tourism Sector 53 P a g e
54 Output Attributable to Tourism Total employment with Tourism Sector 54 P a g e
55 Employment Attributable to Tourism 55 P a g e

56
57 Appendium More Information This profile is part of a suite of demographic resources available from Manningham City Council which includes: Id Census data, Community Profile, Forecast REMPLAN Economic Profile Manningham City Council Manningham Business Notes Work Force refers to all persons working in Manningham, this includes those who reside outside of Manningham and commute to work Labour Force refers to all people who are a resident in the local area who are in the labour force (both employed and unemployed) regardless of where they work. Youth Unemployment Rate is based on 15 to 24 year olds seeking and available for work Data Source Australian Bureau of Statistics, Census of Population and Housing 2006 and 2011 Small Area Labour Markets September 2016 National Institute of Economic and Industry Research (NEIR) Remplan, Economy Profile ID Profile, Community Profile Urban Enterprise Melbourne s Visiting Friends and Relatives Segment Travel Behaviour & Visitor Characteristic of the VFR Market to Melbourne, Commissioned by Destination Melbourne Limited (August 2016) Manningham City Council 57 P a g e
The Yorke & Mid North (State Govt) Region. Workforce Wizard Region Report
 Region. Workforce Wizard Region Report") The Yorke & Mid North (State Govt) Region Workforce Wizard Region Report Table of Contents Executive Summary 3 Population and Social Characteristics 4 Current Population 4 Age Groups 4 Key Populations
The Yorke & Mid North (State Govt) Region Workforce Wizard Region Report Table of Contents Executive Summary 3 Population and Social Characteristics 4 Current Population 4 Age Groups 4 Key Populations
OVERVIEW Four year annual average to the year ending September 2014
 Dec-08 Mar-09 Jun-09 Sep-09 Dec-09 Mar-10 Jun-10 Sep-10 Dec-10 Mar-11 Jun-11 Sep-11 Dec-11 Mar-12 Jun-12 Sep-12 Dec-12 Mar-13 Jun-13 Sep-13 Dec-13 Mar-14 Jun-14 Sep-14 Visitors (000's) LGA PROFILE - Orange
HEALTH SECTOR ECONOMIC INDICATORS REPORT
 HEALTH SECTOR ECONOMIC INDICATORS REPORT For: Mid North Coast Local Health District Report prepared by: April 2013 Table of Contents Introduction 3 Executive Summary 4 Output 5 Value-Added 7 Workforce
OVERVIEW Four year annual average to the year ending September 2014
 LGA PROFILE - Mid-Western Regional OVERVIEW Key Measures Mid-Western Regional NSW Total Visitors (overnight and domestic daytrip) (000's) 524 80,316 Total Overnight Visitors (000's) 298 28,105 Total Nights
OVERVIEW Four year annual average to the year ending September 2014
 Dec-08 Mar-09 Jun-09 Sep-09 Dec-09 Mar-10 Jun-10 Sep-10 Dec-10 Mar-11 Jun-11 Sep-11 Dec-11 Mar-12 Jun-12 Sep-12 Dec-12 Mar-13 Jun-13 Sep-13 Dec-13 Mar-14 Jun-14 Sep-14 Visitors (000's) LGA PROFILE - Snowy
OVERVIEW Four year annual average to the year ending September 2014
 Dec-08 Mar-09 Jun-09 Sep-09 Dec-09 Mar-10 Jun-10 Sep-10 Dec-10 Mar-11 Jun-11 Sep-11 Dec-11 Mar-12 Jun-12 Sep-12 Dec-12 Mar-13 Jun-13 Sep-13 Dec-13 Mar-14 Jun-14 Sep-14 Visitors (000's) LGA PROFILE - Oberon
Cooma-Monaro Visitors. International overnight, domestic overnight and domestic daytrip visitors. Sep-11. Sep-10. Jun-11. Dec-11. Dec-10.
 OVERVIEW LGA PROFILE - Cooma-Monaro Key Measures Cooma- Monaro NSW Total Visitors (overnight and domestic daytrip) (000's) 301 80,316 Total Overnight Visitors (000's) 119 28,105 Total Nights (000's) 346
Manawatu District Economic Profile
 Manawatu District Economic Profile Our community Population has grown by 1,000 residents since 2014 to reach 29,800. Population is 86.4% European, with Maori 14.3% of the population. This compares with
OVERVIEW Four year annual average to the year ending September 2014
 Dec-08 Mar-09 Jun-09 Sep-09 Dec-09 Mar-10 Jun-10 Sep-10 Dec-10 Mar-11 Jun-11 Sep-11 Dec-11 Mar-12 Jun-12 Sep-12 Dec-12 Mar-13 Jun-13 Sep-13 Dec-13 Mar-14 Jun-14 Sep-14 Visitors (000's) LGA PROFILE - Great
Economic Impact Analysis. Tourism on Tasmania s King Island
 Economic Impact Analysis Tourism on Tasmania s King Island i Economic Impact Analysis Tourism on Tasmania s King Island This project has been conducted by REMPLAN Project Team Matthew Nichol Principal
ISRAEL- COUNTRY FACTS
 ISRAEL- COUNTRY FACTS ISRAEL-NEIGHBOURING COUNTRIES AND POLITICAL MAP Area: 22,072 sq. km Land area: 21,643 sq. km. Fast Facts Area of lakes: 429 sq. km. (Sea of Galilee 164 sq. km., the Dead Sea - 265
OVERVIEW Four year annual average to the year ending September 2014
 LGA PROFILE - OVERVIEW Total Visitors (overnight and domestic daytrip) (000's) 1,453 80,316 Total Overnight Visitors (000's) 749 28,105 Total Nights (000's) 2,728 154,563 Total Spend (overnight and domestic
OVERVIEW Four year annual average to the year ending September 2014
 Dec-08 Mar-09 Jun-09 Sep-09 Dec-09 Mar-10 Jun-10 Sep-10 Dec-10 Mar-11 Jun-11 Sep-11 Dec-11 Mar-12 Jun-12 Sep-12 Dec-12 Mar-13 Jun-13 Sep-13 Dec-13 Mar-14 Jun-14 Sep-14 Visitors (000's) LGA PROFILE - Newcastle
OVERVIEW. Currently South Australia contributes $6.3 billion to the Australian tourism economy.
 OVERVIEW Currently contributes $6.3 billion to the Australian tourism economy. has achieved 79 per cent of its $8.0 billion maximum potential by 2020. $6.3b $6.5b $8b 2016 2017 2020 Annual Visitor Summary
East Lothian. Skills Assessment January SDS-1154-Jan16
 East Lothian Skills Assessment January 2016 SDS-1154-Jan16 Acknowledgement The Regional Skills Assessment Steering Group (Skills Development Scotland, Scottish Enterprise, the Scottish Funding Council
OVERVIEW Four year annual average to the year ending September 2014
 LGA PROFILE - Tweed OVERVIEW Total Visitors (overnight and domestic daytrip) (000's) 1,444 80,316 Total Overnight Visitors (000's) 534 28,105 Total Nights (000's) 2,054 154,563 Total Spend (overnight and
OVERVIEW Four year annual average to the year ending September 2014
 Dec-08 Mar-09 Jun-09 Sep-09 Dec-09 Mar-10 Jun-10 Sep-10 Dec-10 Mar-11 Jun-11 Sep-11 Dec-11 Mar-12 Jun-12 Sep-12 Dec-12 Mar-13 Jun-13 Sep-13 Dec-13 Mar-14 Jun-14 Sep-14 Visitors (000's) LGA PROFILE - Eurobodalla
Blue Mountains Visitors. International overnight, domestic overnight and domestic daytrip visitors. Sep-11. Jun-11. Sep-10. Dec-10. Dec-11.
 Dec-08 Mar-09 Jun-09 Sep-09 Dec-09 Mar-10 Jun-10 Sep-10 Dec-10 Mar-11 Jun-11 Sep-11 Dec-11 Mar-12 Jun-12 Sep-12 Dec-12 Mar-13 Jun-13 Sep-13 Dec-13 Mar-14 Jun-14 Sep-14 Visitors (000's) OVERVIEW LGA PROFILE
OVERVIEW Four year annual average to the year ending September 2014
 Dec-08 Mar-09 Jun-09 Sep-09 Dec-09 Mar-10 Jun-10 Sep-10 Dec-10 Mar-11 Jun-11 Sep-11 Dec-11 Mar-12 Jun-12 Sep-12 Dec-12 Mar-13 Jun-13 Sep-13 Dec-13 Mar-14 Jun-14 Sep-14 Visitors (000's) LGA PROFILE - Port
uburbs Inner Eastern LLEN Region 27,298 FTE students in Government schools*** 177,361 * 397,525 Total population* 61,631 businesses 202,078 Boroondara
 uburbs Inner Eastern LLEN Region There are 55,952 young people aged 5-19 years old in the IELLEN region That's 15% of the total population 120 Primary and Secondary schools (Government, Catholic, Independent)
MINING IN TASMANIA: DINOSAUR OR DELIVERER?
 MINING IN TASMANIA: DINOSAUR OR DELIVERER? PRESENTATION TO A FORUM HOSTED BY THE ACADEMY OF TECHNOLOGICAL SCIENCES AND ENGINEERING (ATSE) FOR NATIONAL SCIENCE WEEK RACV APARTMENT HOTEL, HOBART 3 RD AUGUST
North Lanarkshire. Skills Assessment January SDS-1163-Jan16
 North Lanarkshire Skills Assessment January 2016 SDS-1163-Jan16 Acknowledgement The Regional Skills Assessment Steering Group (Skills Development Scotland, Scottish Enterprise, the Scottish Funding Council
Domestic VFR travel to NSW
 Domestic VFR travel to NSW Year ended December 2015 INTRODUCTION The and (VFR) market is of considerable importance to Australia and NSW. It is the second largest purpose of visit segment, after the Holiday
OVERVIEW Four year annual average to the year ending September 2014
 Dec-08 Mar-09 Jun-09 Sep-09 Dec-09 Mar-10 Jun-10 Sep-10 Dec-10 Mar-11 Jun-11 Sep-11 Dec-11 Mar-12 Jun-12 Sep-12 Dec-12 Mar-13 Jun-13 Sep-13 Dec-13 Mar-14 Jun-14 Sep-14 Visitors (000's) LGA PROFILE - Forbes
visitor insights 2016
 visitor insights 2016 table of contents Purpose of Report 3 Surf Coast Data Regions 3 Maps 3 Executive Summary 4 Summary of Total Visitation to Surf Coast 5 Total Visitation and Visitor Nights 5 Total
OVERVIEW Four year annual average to the year ending September 2014
 LGA PROFILE - Forbes OVERVIEW Total Visitors (overnight and domestic daytrip) (000's) 155 80,316 Total Overnight Visitors (000's) 69 28,105 Total Nights (000's) 191 154,563 Total Spend (overnight and domestic
OVERVIEW Four year annual average to the year ending September 2014
 Dec-08 Mar-09 Jun-09 Sep-09 Dec-09 Mar-10 Jun-10 Sep-10 Dec-10 Mar-11 Jun-11 Sep-11 Dec-11 Mar-12 Jun-12 Sep-12 Dec-12 Mar-13 Jun-13 Sep-13 Dec-13 Mar-14 Jun-14 Sep-14 Visitors (000's) LGA PROFILE - Tenterfield
Tamworth Regional Council Local Government Area NORTHERN INLAND NSW
 Tamworth Regional Council Local Government Area NORTHERN INLAND NSW Tamworth Regional Council Local Government Area At a Glance Tamworth is a thriving destination. It is the largest inland NSW city west
What will Mackay be like in 5 years time?
 What will Mackay be like in 5 years time? Information booklet Presentation to Mackay Region Chamber of Commerce by Dr Kim Houghton Director Strategic Economic Solutions 4 September 2013 Strategic Economic
Youth Retention: July Value of post secondary education in regional settings. Prepared for Luminosity Youth Summit.
 Youth Retention: Value of post secondary education in regional settings Prepared for Luminosity Youth Summit July 2013 Prepared by MID NORTH COAST NSW Table of contents Table of contents... 2 Introduction...
Domestic Youth Visitors to NSW
 Domestic Youth Visitors to NSW Year Ended June 2017 INTRODUCTION Destination NSW defines Youth or Millennials as persons aged 15 to 29. In partnership with Tourism Research Australia, qualitative research
The Outlook for the Residential Construction Industry Hunter and the Central Coast
 The Outlook for the Residential Construction Industry Hunter and the Central Coast Graham Wolfe HIA Chief Executive Industry Policy and Media HIA Industry Outlook Breakfast Newcastle February 2013 Backdrop:
LORD HOWE ISLAND MARINE PARK PROFILE OF LOCAL BUSINESSES. Department of Environment Climate Change & Water. Prepared For: Prepared By:
 LORD HOWE ISLAND MARINE PARK PROFILE OF LOCAL BUSINESSES Prepared For: Department of Environment Climate Change & Water Prepared By: Arche Consulting Pty Ltd Version: June 2010 Arche Consulting T + 61
Demographic Profile 2013 census
 Demographic Profile 2013 census This profile provides basic population and demographic information on the residents of the Hauraki District. Population and demographic information is important for targeting
MELBOURNE S WEST TOURISM RESEARCH
 MELBOURNE S WEST TOURISM RESEARCH COLLATION OF TOURISM RESEARCH AUSTRALIA DATA MAY 2017 WESTERN MELBOURNE TOURISM Urban Enterprise Urban Planning / Land Economics / Tourism Planning / Industry Software
Western Sydney Visitor Profile
 Western Sydney Visitor Profile Year Ended June 2017 This snapshot provides a profile of, and Daytrip who visited Western 1,2 VISITOR MARKET SIZE AND EXPENDITURE In the year ended (YE) June 17, the total
SHORT BREAKS TO NSW INTRODUCTION
 SHORT BREAKS TO NSW March 2016 INTRODUCTION This document provides demographic profile of domestic and international short break 1 visitors to NSW, and their travel behaviour. It makes comparisons in terms
Figure 1.1 St. John s Location. 2.0 Overview/Structure
 St. John s Region 1.0 Introduction Newfoundland and Labrador s most dominant service centre, St. John s (population = 100,645) is also the province s capital and largest community (Government of Newfoundland
ASCOT SUBURB PROFILE
 ASCOT SUBURB PROFILE CONTENTS SUBURB HIGHLIGHTS 2 3 4 4 5 5 ASCOT & SURROUNDS LOCATION & LIFESTYLE DEMOGRAPHICS EMPLOYMENT FUTURE INFRASTRUCTURE WA MARKET TRENDS ACCESSIBILITY ENTERTAINMENT & RECREATION
The Economic Base of Colfax County, NM. PREPARED BY: The Office of Policy Analysis at Arrowhead Center, New Mexico State University.
 The Economic Base of Colfax County, NM PREPARED BY: The Office of Policy Analysis at Arrowhead Center, New Mexico State University DATE: July 2016 The Economic Base of Colfax County, New Mexico Introduction
ATE 2015 Special series:
 ATE 2015 Special series: The Indian leisure market to NSW: Tier one VS. Tier two origin states INTRODUCTION June 2015 India s overseas travel potential particularly for leisure travel has been building
The Economic Impact of Tourism in North Carolina. Tourism Satellite Account Calendar Year 2013
 The Economic Impact of Tourism in North Carolina Tourism Satellite Account Calendar Year 2013 Key results 2 Total tourism demand tallied $26 billion in 2013, expanding 3.9%. This marks another new high
The Economic Impact of Tourism on Calderdale Prepared by: Tourism South East Research Unit 40 Chamberlayne Road Eastleigh Hampshire SO50 5JH
 The Economic Impact of Tourism on Calderdale 2015 Prepared by: Tourism South East Research Unit 40 Chamberlayne Road Eastleigh Hampshire SO50 5JH CONTENTS 1. Summary of Results 1 2. Table of Results Table
Economic Contribution of Tourism to NSW
 Economic Contribution of Tourism to NSW 2013-14 Tourism is a significant part of the NSW economy. In 2013-14, tourism contributed $34.9 billion (Tourism Consumption) to the NSW economy and employed 272,000
Regional Universities Network. Introduction. Regional Universities Network. Economic Impact of the Universities in the Regional Universities Network
 Regional Universities Network Economic Impact of the Universities in the Regional Universities Network Introduction The Regional Universities Network (RUN) is a network of six universities with headquarters
Employment characteristics of UK tourism industries in 2008
 Employment characteristics of UK tourism industries in 2008 Eddie Smith, Dominic Webber and Sean White Tourism Intelligence Unit, Office for National Statistics Summary This article uses an analysis of
CRUISE ACTIVITY IN BARCELONA. Impact on the Catalan economy and socioeconomic profile of cruise passengers (2014)
") CRUISE ACTIVITY IN BARCELONA Impact on the Catalan economy and socioeconomic profile of cruise passengers (2014) 2 CRUISE ACTIVITY IN BARCELONA 2014 Impact on the Catalan economy and socioeconomic profile
CRUISE ACTIVITY IN BARCELONA Impact on the Catalan economy and socioeconomic profile of cruise passengers (2014) 2 CRUISE ACTIVITY IN BARCELONA 2014 Impact on the Catalan economy and socioeconomic profile
SHETLAND AREA PROFILE
 www.hie.co.uk SHETLAND AREA PROFILE May 2014 SHETLAND AREA PROFILE INTRODUCTION The Shetland area profile uses 2011 Census data and other available data sources to present an up-to-date analysis of its
The Economic Impact of Poole s Visitor Economy 2015
 The Economic Impact of Poole s Visitor Economy 2015 Produced By The South West Research Company Ltd October 2016 Contents Page Introduction 3 Poole data 4 Dorset data 17 Introduction This report examines
Economic Impact of Tourism. Norfolk
 Economic Impact of Tourism Norfolk - 2009 Produced by: East of England Tourism Dettingen House Dettingen Way, Bury St Edmunds Suffolk IP33 3TU Tel. 01284 727480 Contextual analysis Regional Economic Trends
DUNOON PROFILE May 2014
 www.hie.co.uk DUNOON PROFILE May 2014 DUNOON PROFILE INTRODUCTION The Dunoon profile uses 2011 Census data and other available data sources to present an up-to-date analysis of its population and labour
The Economic Impact of Gloucestershire s Visitor Economy Forest of Dean district
 The Economic Impact of Gloucestershire s Visitor Economy 201 Forest of Dean district Produced on behalf of the Wye Valley and Forest of Dean Tourism Association By The South West Research Company Ltd January
172,650 persons (2016 est. resident population)
") 1 Regional Overview Population: 172,650 persons (2016 est. resident population) Growth Rate: 3.74% (2011 2016) 0.51% average annual growth Key Industries: Retail, Health Care and Social Assistance, Construction,
1 Regional Overview Population: 172,650 persons (2016 est. resident population) Growth Rate: 3.74% (2011 2016) 0.51% average annual growth Key Industries: Retail, Health Care and Social Assistance, Construction,
The Economic Impact of Gloucestershire s Visitor Economy Forest of Dean district
 The Economic Impact of Gloucestershire s Visitor Economy 2014 Forest of Dean district Produced on behalf of the Wye Valley and Forest of Dean Tourism Association By The South West Research Company Ltd
Puerto Ricans in Ohio, the United States, and Puerto Rico, 2014
 Issued April 2016 Centro DS2015US-12 Puerto Ricans in Ohio, the United States, and Puerto Rico, 2014 In 2014, Ohio had the tenth largest number of Puerto Ricans in the United States with 108,174 residents,
The Economic Impact of Tourism on Scarborough District 2014
 The Economic Impact of Tourism on Scarborough District 2014 Prepared by: Tourism South East Research Unit 40 Chamberlayne Road Eastleigh Hampshire SO50 5JH CONTENTS 1. Summary of Results 1 2. Table of
Produced by: Destination Research Sergi Jarques, Director
 Produced by: Destination Research Sergi Jarques, Director Economic Impact of Tourism Oxfordshire - 2015 Economic Impact of Tourism Headline Figures Oxfordshire - 2015 Total number of trips (day & staying)
2. Recommendations 2.1 Board members are asked to: i. note the content of the May 2018 Renfrewshire Economic Profile.
 To: Leadership Board On: 20 June 2018 Report by: Director of Development and Housing Services Heading: Renfrewshire Economic Profile May 2018 1. Summary 1.1 This report is the second edition of a revised
West Somerset 2015 Local data version
 West Somerset 2015 Local data version Introduction This report examines the volume and value of tourism and the impact of visitor expenditure on the local economy in West Somerset and Somerset county in
The Economic Impact of Tourism on the District of Thanet 2011
 The Economic Impact of Tourism on the District of Thanet 2011 Prepared by: Tourism South East Research Unit 40 Chamberlayne Road Eastleigh Hampshire SO50 5JH CONTENTS 1. Summary of Results 1 2. Table of
Appendix 3 REMPLAN Economic Impact Modelling: New Energy Port Hedland Waste to Energy Project
 Public Environmental Review Boodarie Waste to Energy and Materials Recovery, Port Hedland Appendix 3 REMPLAN Economic Impact Modelling: New Energy Port Hedland Waste to Energy Project NEW ENERGY PORT HEDLAND
THE 2006 ECONOMIC IMPACT OF TRAVEL & TOURISM IN INDIANA
 THE 2006 ECONOMIC IMPACT OF TRAVEL & TOURISM IN INDIANA A Comprehensive Analysis Prepared by: In Partnership with: PREPARED FOR: Carrie Lambert Marketing Director Indiana Office of Tourism Development
Produced by: Destination Research Sergi Jarques, Director
 Produced by: Destination Research Sergi Jarques, Director Economic Impact of Tourism Oxfordshire - 2016 Economic Impact of Tourism Headline Figures Oxfordshire - 2016 number of trips (day & staying) 27,592,106
Produced by: Destination Research Sergi Jarques, Director
 Produced by: Destination Research Sergi Jarques, Director Economic Impact of Tourism North Norfolk District - 2016 Contents Page Summary Results 2 Contextual analysis 4 Volume of Tourism 7 Staying Visitors
Produced by: Destination Research Sergi Jarques, Director
 Produced by: Destination Research Sergi Jarques, Director Economic Impact of Tourism Norfolk - 2016 Contents Page Summary Results 2 Contextual analysis 4 Volume of Tourism 7 Staying Visitors - Accommodation
Know your market and build your business. How understanding target markets and local demographic/economic information can help local business
 Know your market and build your business How understanding target markets and local demographic/economic information can help local business March 24, 2015 About informed decisions.id stands for informed
WHY INVEST IN QUEENSLAND URBIS MARKET OUTLOOK
 WHY INVEST IN QUEENSLAND URBIS MARKET OUTLOOK WHO IS URBIS? PERTH AUSTRALIA ADELAIDE BRISBANE GOLD COAST SYDNEY MELBOURNE Urbis is an integrated multi-disciplinary consulting firm with a unique and comprehensive
Fiji s Tourism Satellite Accounts
 Asia-Pacific Economic Statistics Week Bangkok 2 4 May 2016 Fiji s Tourism Satellite Accounts Mr. Bimlesh Krishna Divisional Manager Economic Statistics Fiji s Tourism Satellite Introduction The Tourism
NUNAVIK'S LABOUR MARKET AND EDUCATIONAL ATTAINMENT PARADOX
 NUNAVIK'S LABOUR MARKET AND EDUCATIONAL ATTAINMENT PARADOX Andrew Sharpe and Jasmin Thomas Presentation prepared for Mapping the Road Together to Sustainable Employment; Celebrating 25 Years. Katittavik
Produced by: Destination Research Sergi Jarques, Director
 Produced by: Destination Research Sergi Jarques, Director Economic Impact of Tourism Epping Forest - 2014 Economic Impact of Tourism Headline Figures Epping Forest - 2014 Total number of trips (day & staying)
Produced by: Destination Research Sergi Jarques, Director
 Produced by: Destination Research Sergi Jarques, Director Economic Impact of Tourism Norfolk - 2017 Contents Page Summary Results 2 Contextual analysis 4 Volume of Tourism 7 Staying Visitors - Accommodation
Self Catering Holidays in England Economic Impact 2015
 Self Catering Holidays in England Economic Impact 2015 An overview of the economic impact of self catering holidays in England Published by The South West Research Company Ltd March 2017 Contents Page
Economic Contribution of Tourism to NSW
 Economic Contribution of Tourism to NSW 2015-16 Tourism is a significant part of the NSW economy. In 2015-16, tourism contributed $38.1 billion (Tourism Consumption) to the NSW economy and employed 261,100
Devonport-Takapuna Local Board Profile
 Devonport-Takapuna Local Board Profile - Initial results from the Census February 2014 Social and Economic Research Team Research, Investigations and Monitoring Unit Auckland Council Map of Devonport-Takapuna
The Australian Defence Organisation and Tropical Australia: Its Socio-Economic Impact in Cairns, Darwin and Townsville
 The Australian Defence Organisation and Tropical Australia: Its Socio-Economic Impact in Cairns, Darwin and Townsville Dr Riccardo Welters School of Business, James Cook University Published by The Cairns
Chapter 1: The Population of NHS Greater Glasgow and Clyde
 Population Estimate (thousands) Chapter 1: The Population of NHS Greater Glasgow and Clyde Population Trends and Projections National Records of Scotland estimated (NRS SAPE) 1 the 2013 NHS Greater Glasgow
Domestic Caravan and Camping Travel to NSW YE December 2016
 This snapshot presents information on visitors to NSW who stayed in caravan and camping accommodation 1 in the year ended (YE) Dec 2016. 2 NSW VISITOR MARKET SIZE AND EXPENDITURE In YE Dec 2016, the total
The Economic Impact of West Oxfordshire s Visitor Economy 2015
 The Economic Impact of West Oxfordshire s Visitor Economy 2015 Produced on behalf of the West Oxfordshire District Council By The South West Research Company Ltd October 201 1 Contents Page Introduction
The Economic Impact of West Oxfordshire s Visitor Economy 2016
 The Economic Impact of West Oxfordshire s Visitor Economy 201 Produced on behalf of the West Oxfordshire District Council By The South West Research Company Ltd January 2018 1 Contents Page Introduction
Statistical Picture of Aboriginal and Torres Strait Islander School Students in Australia
 Chapter 2 Statistical Picture of Aboriginal and Torres Strait Islander School Students in Australia Statistical Picture The Australian Bureau of Statistics (ABS) reported that the estimated resident Aboriginal
MARKET OUTLOOK. 01 Walkability & Accessibility 02 Infrastructure & Employment 03 Demographics 04 Residential Analysis 06 Rental Analysis
 MARKET OUTLOOK EAST LEPPINGTON Located within the rapidly expanding South West Growth Centre of Sydney, the East Leppington Precinct is well positioned to benefit from the region s strong infrastructure
The Economic Impact of Tourism in Maryland. Tourism Satellite Account Calendar Year 2015
 The Economic Impact of Tourism in Maryland Tourism Satellite Account Calendar Year 2015 MD tourism economy reaches new peaks The Maryland visitor economy continued to grow in 2015; tourism industry sales
TOWNSVILLE NORTH QUEENSLAND QUARTERLY ECONOMIC SNAPSHOT
 TOWNSVILLE NORTH QUEENSLAND QUARTERLY ECONOMIC SNAPSHOT SEPTEMBER 2017 TOWNSVILLE NORTH QUEENSLAND QUARTERLY ECONOMIC SNAPSHOT SEPTEMBER 2017 The Townsville North Queensland Economic Snapshot provides
Asheville Metro Economic Report 2014 Second Quarter
 Asheville Metro Economic Report Johnson Price Sprinkle PA HIGHLIGHTS: ASHEVILLE METRO The Asheville metro area gained 2,400 more jobs than one year earlier, averaging a growth rate of 1.4 percent, continuing
Queensland Economic Update
 Queensland Economic Update Chamber of Commerce & Industry March 2018 cciq.com.au Queensland Economic Update: Summary National Accounts GDP expanded 2.3% during calendar year 2017. QLD state final demand
Chart 2. International Student Nights in NSW
 International Student Visitors to NSW Year Ended March 2017 INTRODUCTION The International Education segment in Australia and NSW has had a resurgence and is growing. According to the Department of Education
Palmerston North Retailing
 Palmerston North Retailing Introduction and General Experience My name is Peter Crawford and I am the Economic Policy Advisor for Palmerston North City Council. My qualifications include a BA (geography
Who s Staying in Our Parks?
 1 Who s Staying in Our Parks? VicParks Annual Conference 22/08/2017 Presented by Peter Clay GM for Research & Advocacy 2 WORKING COLLABORATIVELY WITH STATE ASSOCIATIONS Our research is undertaken in partnership
Economic Impact of Tourism. Cambridgeshire 2010 Results
 Economic Impact of Tourism Cambridgeshire 2010 Results Produced by: Tourism South East Research Department 40 Chamberlayne Road, Eastleigh, Hampshire, SO50 5JH sjarques@tourismse.com http://www.tourismsoutheast.com
The Economic Impact of Tourism in Buncombe County, North Carolina
 The Economic Impact of Tourism in Buncombe County, North Carolina 2017 Analysis September 2018 Introduction and definitions This study measures the economic impact of tourism in Buncombe County, North
How does my local economy function? What would the economic consequences of a project or action be?
 June 5th,2012 Client: City of Cortez Shane Hale Report Prepared for SBDC Ft. Lewis Report Prepared by Donna K. Graves Information Services Executive Summary - At the request of Joe Keck at the Small Business
The Economic Impact of Tourism on Galveston Island, Texas
 The Economic Impact of Tourism on Galveston Island, Texas 2017 Analysis Prepared for: Headline Results Headline results Tourism is an integral part of the Galveston Island economy and continues to be a
The Economic Impact of Tourism in Maryland. Tourism Satellite Account Calendar Year 2016
 The Economic Impact of Tourism in Maryland Tourism Satellite Account Calendar Year 2016 County Results Washington County, Visitors Washington County Visitors (thousands) Year Overnight Day Total Growth
The Economic Impact of Tourism in North Carolina. Tourism Satellite Account Calendar Year 2015
 The Economic Impact of Tourism in North Carolina Tourism Satellite Account Calendar Year 2015 Key results 2 Total tourism demand tallied $28.3 billion in 2015, expanding 3.6%. This marks another new high
VALUE OF TOURISM. Trends from
 VALUE OF TOURISM Trends from 2005-2015 March 2017 TABLE OF CONTENTS 1. Overview... 2 Key highlights in 2015... 2 2. Contributions to the economy... 4 TOURISM REVENUE... 5 Total revenue... 5 Tourism revenue
International market segments
 International market segments ATE13 SPECIAL SERIES - MALAYSIA leisure market April 2013 The Market Australia and Malaysia share historical links including education from the days of the Colombo Plan. From
The Economic Contribution of Cruise Tourism to the Southeast Asia Region in Prepared for: CLIA SE Asia. September 2015
 BREA Business Research & Economic Advisors The Economic Contribution of Cruise Tourism to the Southeast Asia Region in 2014 Prepared for: CLIA SE Asia September 2015 Business Research & Economic Advisors
Puerto Ricans in Rhode Island, the United States, and Puerto Rico, 2013
 Issued September 2016 Centro DS2015US-07 Puerto Ricans in Rhode Island, the United States, and Puerto Rico, 2013 In 2013 an estimated 36,217 Puerto Ricans lived in Rhode Island and accounted for at least
Panama City Beach Travel Market Economic Impact Report. Prepared for: Panama City Beach Convention & Visitors Bureau
 Panama City Beach 2016 Travel Market Economic Impact Report Presented by: Berkeley Young, President Young Strategies, Inc. Data Analysis: Larry D. Gustke, PhD Steve Morse, PhD Prepared for: Panama City
Page 1. Economic Impact Assessment of the Palm Island Community Company
 Page 1 Economic Impact Assessment of the Palm Island Community Company INCORPORATING: Empower North is a group of expert consultants providing select clients with an integrated service across the specialist