Land area 1.73 million km 2 Queensland population (December 2015) Brisbane population* (June 2015)
|
|
|
- Oscar Casey
- 6 years ago
- Views:
Transcription

1 Queensland - 18
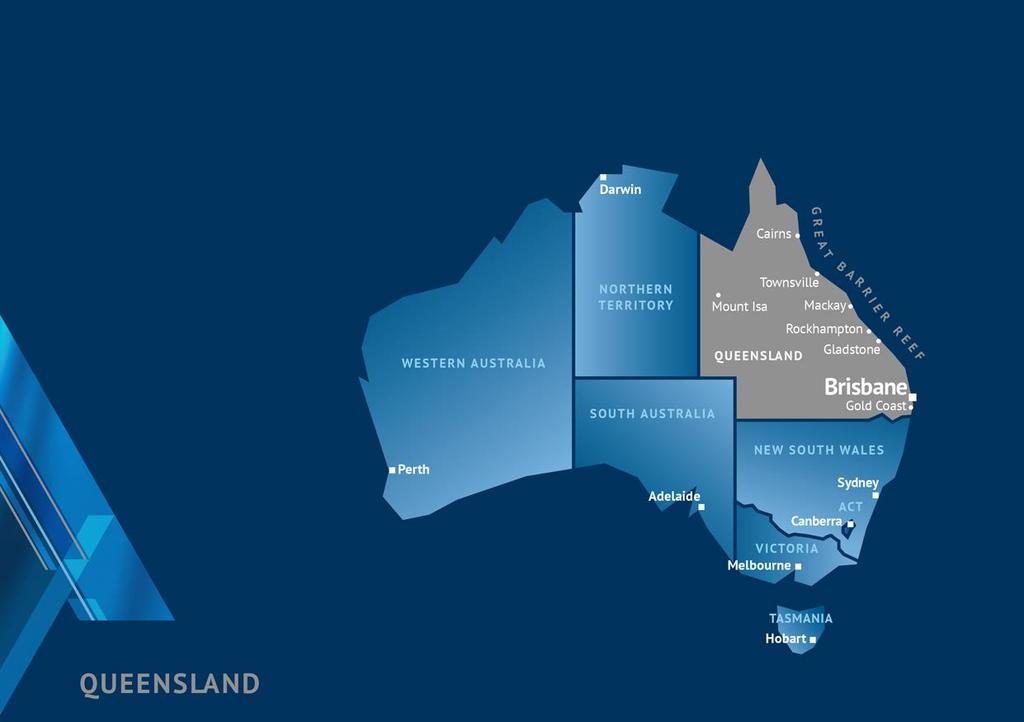
2 Queensland OVERVIEW Queensland is nearly five times the size of Japan, seven times the size of Great Britain, and two and a half times the size of Texas. Queensland is Australia s second largest state by land area, covering more than 22 per cent of the continent. The economy is the third largest in Australia, after New South Wales and Victoria. Queensland s natural wonder, the Great Barrier Reef, extends over some 2,000km, covering more than a quarter of the state s 7,400km of coastline. With a population of 4.81 million, more than 20 per cent of Australians live in Queensland. Around three million Queenslanders live in the state s south-east corner. Queensland Quick facts * Greater capital city statistical area ABS ** Total number of people employed. Data source: Tourism Research Australia, ABS, RBA, Queensland State Accounts. Land area 1.73 million km 2 Queensland population (December 2015) 4.81 million Brisbane population* (June 2015) 2.31 million Language English Currency Australian dollar (AUD) Gross State Product (year end June 2015) AUD301 billion (USD250 billion) Gross State Product, annual growth rate (long-run trend) 4.3% Flight time: Brisbane to Sydney 1.5 hours Workforce** (May 2016) 2.36 million Inflation rate (year end March 2016) 1.7% Overseas visitors (year end March 2016) 2.42 million Queensland - 19
3 Queensland s economic standing GROWTH Queensland s rate of economic growth has consistently outperformed the average of other advanced economies since the early 90s, a trend that is forecast to continue. Figure 8: Queensland s economic growth compared to advanced economies Note: onwards are forecasts/ projections. Data sources: ABS, IMF, Queensland Treasury Queensland - 20

4 Figure 9: Queensland s economic growth compared to Australia Queensland s economic growth has consistently outperformed the Australian average since the early 1990s, a trend that is forecast to continue in the near term. Note: onwards are forecasts/ projections. Data sources: ABS, Queensland Treasury, Australian Treasury, Queensland State Accounts. Queensland - 21
, 2013-14 reference year. Data sources: Queensland Treasury, various state budgets.")
5 Figure 10: Queensland s economic growth compared to other states 1 Queensland is forecast to have the strongest economic growth of all Australian states. 1 Chain volume measure (CVM), reference year. Data sources: Queensland Treasury, various state budgets. Queensland - 22
, 2013-14 reference year. * Public sector and utilities includes: public administration and safety; and electricity, gas, water, waste services.")
6 DIVERSE ECONOMY Figure 11: Australian states and territories economic output by sector 1 Similar to Australia, Queensland has a diverse economy with no single sector making up more than 12 per cent , Gross Value Added, chain volume measure (CVM), reference year. * Public sector and utilities includes: public administration and safety; and electricity, gas, water, waste services. ** Natural resources includes the extraction of naturally occurring mineral solids, such as coal and ores; liquid minerals, such as crude petroleum; and gases, such as natural gas. ***Other includes: dwellings; professional, scientific and technical services, accommodation and food services; other services; administrative and support services; arts and recreation. Data source: ABS Queensland - 23
7 Figure 12: Contributions to growth in Queensland s Gross State Product 1 Declining business investment due to the wind down of the resources investment boom has weighed on economic growth in recent years. However, business investment is forecast to return to a sustainable longer term growth path by Other expenditure categories such as household consumption (which represents close to 60 per cent of gross state product), dwelling investment, public consumption and investment and net exports are expected to contribute to economic growth over the forecast period. 1 Chain volume measure (CVM), reference year. Note: onwards are forecasts / projections. Data source: Queensland Treasury. Queensland - 24

8 Economic drivers EXPORTS Solid growth is expected across most key goods and service export categories going forward, including coal and tourism. The ramp up in LNG exports is forecast to drive overall growth in the value of Queensland s exports in the coming years. Figure 13: Queensland s exports - Total 1 1 Nominal value. Note: onwards are forecasts / projections. Data sources: ABS unpublished trade data, Queensland Treasury Queensland - 25
9 Figure 14: Queensland s exports - goods exports by country 1 Asia remains Queensland s most important export market, accounting for more than two-thirds of Queensland s exports in Share of total goods exports, per cent. Data sources: ABS unpublished trade data, Queensland Treasury. Queensland - 26

10 TOURISM Figure 15: Queensland s exports Services (Tourism) International tourist nights by country Strong growth in overseas visitor nights over the past two years has been driven by increases in the number of visitors from a range of countries including China and India. This trend has been supported by rising levels of disposable income and a falling Australian dollar and should continue into the future as the Asian middle class continues to grow. Data sources: Tourism Research Australia, Queensland Treasury Queensland - 27

11 EDUCATION Figure 16: Queensland s exports Services (Education) Overseas student commencements Strong increases in overseas vocational education and English language course student commencements have driven education exports in Queensland in recent years. *Vocational education is tertiary education and training that provides accredited training in job ready and technical skills. Data source: Austrade. Queensland - 28
12 Figure 17: Australian dollar and net services exports A lower Australian dollar supports exporters and import-competing businesses, including key services exports such as tourism and education. Data sources: RBA, Queensland State Accounts Queensland - 29
13 LABOUR MARKET Figure 18: Queensland s labour market The solid headline economic growth in Queensland in and is being driven by LNG exports, which tend to be less labour intensive. Consequently employment growth is expected to be moderate, leading to a relatively stable unemployment rate in the short term. Notes: Year-average terms onwards are forecasts/projections. Data sources: ABS, Queensland Treasury Queensland - 30

14 DEMOGRAPHICS Figure 19: Queensland s population growth compared to Australia s As the economy adjusts from heightened activity in resources construction, Queensland s population growth has slowed to around the national average. Note: onwards are forecasts/projections. Australia s population growth forecasts/projections, which are as at 31 December for a given year, are not directly comparable to Queensland s forecasts/projections which are in year-average terms. Data sources: ABS, Queensland Treasury, Australian Treasury Queensland - 31
15 Queensland s fiscal position QUEENSLAND GOVERNMENT S FISCAL PRINCIPLES The Government will target ongoing reductions in Queensland s relative debt burden, as measured by the General Government debt to revenue ratio. The Government will target a net operating surplus that ensures any new capital investment is funded primarily through recurrent revenues rather than borrowing. The capital program will be managed to ensure a consistent flow of works to support jobs and the economy and reduce the risk of backlogs emerging (measured as purchases of non-financial assets) Maintain competitive taxation by ensuring that the General Government sector own-source revenue remains at or below 8.5 per cent of gross state product, on average, over the forward estimates. Target full funding of long term liabilities such as superannuation and WorkCover Queensland in accordance with actuarial advice. Maintain a sustainable public service by ensuring that overall growth in fulltime equivalent employees, on average over the forward estimates, does not exceed population growth. Queensland - 32

16 Total grants* of around AUD27billion (including those from the Australian Government) are expected to account for 51 per cent of Queensland s total government revenue in REVENUES Figure 20: Queensland budgeted revenues AUD53.4 billion Figure 21: Queensland budgeted taxation revenues AUD13.1 billion 1 May not add to 100 per cent due to rounding. * Grants from the Australian Government are almost evenly split between general and specific purpose payments. General purpose payments include GST revenue grants and associated payments, are untied and used for both recurrent and capital purposes. Specific purpose payments are used to meet Australian Government and shared policy objectives. ** This comprises the taxes and levies listed in Figure 20. Data source: Queensland Government Budget Queensland - 33

17 Figure 22: Contribution of key items to revenue growth The key revenue sources of GST, tax and royalties are expected to grow at rates more consistent with long-run average rates over the coming years, as opposed to the rapid pace of growth observed for most of the 2000s. Data source: Queensland Treasury Queensland - 34
18 AUSTRALIAN GOVERNMENT FISCAL SUPPORT Horizontal fiscal equalisation involves the payments of grants (from the revenue raised from the Goods and Services Tax (GST)) to Australian states and territories with the aim of giving all states the capacity to provide services and associated infrastructure to the same standard. In grants from the Australian Government will account for 48.7 per cent of Queensland s revenue. Australia is one of only nine countries with a AAA credit rating from all three major ratings agencies; Standard & Poor s, Moody s Investors Service and Fitch Ratings. The Australian Government provides explicit financial support to all Australian states and territories in the form of: the payment of grants under the principle of the Horizontal Fiscal Equalisation scheme the Australian Government s Natural Disaster Relief and Recovery Arrangements, which provides partial reimbursement for eligible costs incurred as a result of natural disasters, and the offer of a time-limited, voluntary guarantee over Australian state and territory borrowings from July 2009 to December (See Appendix C) See Appendix D for more information on tax sharing arrangements. Queensland - 35

19 TAXATION Figure 23: Tax per capita by states and territories ( ) Queensland s taxation environment is favourable compared to other Australian states and territories. Data source: Various states and territories budgets. Population forecasts from Australian Government Budget. Queensland - 36

20 EXPENSES Health and education made up a significant proportion of the State s budgeted expenses. Figure 24: Queensland budgeted expenses AUD52.6 billion 1 May not add to 100 per cent, due to rounding. Data source: Queensland Government Budget Queensland - 37
21 Figure 25: Annual growth in general government sector expenses Queensland has and will continue to implement strong expense management. Data sources: Actual data from ABS, onwards are forecasts and projections from the Queensland Government Budget. Queensland - 38
22 BUDGET BALANCE Figure 26: General government sector net operating and fiscal balances Net operating surpluses are expected in each year of the forward estimates. Data sources: Actual data from ABS, onward are forecasts and projections from the Queensland Government Budget. Queensland - 39

23 GOVERNMENT CAPITAL EXPENDITURE Figure 27: Queensland s disaggregated state infrastructure spending Spending on improving Queensland s transport and communication and fuel and energy infrastructure comprises the bulk of the Government s budgeted capital works program in Mainly includes general government sector equipment investment expenditures on economic services and those not classified elsewhere. Data source: Queensland Government Budget Queensland - 40
24 Credit ratings RATINGS AGENCIES RATIONALE Standard & Poor s and Moody s Investors Service released announcements following the State Budget in July The Queensland credit ratings remained unchanged. Note: Information on Queensland s domestic and international peers credit ratings can be found in Appendices G & H. Data source: Ratings Direct: Supplementary Analysis: Queensland (State of), 9 November Data source: Moody s Investors Service: Credit Opinion: Queensland (State of) Australia, 15 October STANDARD & POOR S AA+/Stable/A-1+ Summary rating rationale Queensland s economy is very strong and supports its ratings. In our view, the State s prudent approach to debt management, as well as the development of medium-term and long-term fiscal and economic strategies and its prudent expenditure management, demonstrates its financial strength. The stable outlook reflects our expectation that the State's financial management will remain strong and its budgetary performance will continue to improve compared to recent years. MOODY S INVESTORS SERVICE Aa1/Negative/P-1 Queensland s credit quality reflects the state s strong budget flexibility which allows it to adjust revenues and expenditures as required to meet fiscal challenges. The rating is supported by secure and predictable Commonwealth government grants, ample levels of internal liquidity, and a diverse economic base with strong growth potential the State s abundant natural resource base and its well developed and diversified services sector provide ample support for its financial and debt operations. Queensland - 41
25 Figure 28: General government debt to revenue ratio One of the Government s fiscal principles is to target an ongoing reduction in Queensland s debt burden, as measured by the General Government debt to revenue ratio This ratio is expected to be materially lower than was expected from the Budget. This reflects the Government s Debt Action Plan announced in the Budget and followed up in the MYFER and Budget. Other key fiscal ratios can be found in Appendix J. Data source: Various Queensland Government Budgets Queensland - 42

26 One of the Government s fiscal principles is to target net operating surpluses that ensure any new General Government sector capital investment is primarily funded through recurrent revenues rather than borrowing. Figure 29: General Government Sector net operating cash flow as a proportion of capital expenditure Across the period to , the proportion of the capital program that is projected to be funded via net cash inflows from operating activities is 75 per cent. Data source: Queensland Government Budget, onward are forecasts and projections. Queensland - 43
27 Summary of key points The State of Queensland: has a diverse economy with services making up a significant proportion of total output is expected to see less of a drag from business investment on overall growth in Gross State Product as well as positive contributions from all other major categories has a long history of economic growth and over the past 25 years has generally outperformed both the Australian economy and advanced economies more broadly has a forecast economic growth rate that is expected to exceed that of all the other states across the forward estimates has a stable revenue stream in the form of grants it receives from the Australian Government has General Government debt levels that continue to fall when expressed as share of revenue has an ongoing General Government capital works program, which will be funded primarily through recurrent revenue as opposed to borrowing, and is rated AA+/Stable/A-1+ and Aa1/Negative/P1 by Standard & Poor s and Moody s Investors Service respectively. Queensland - 44
Land area 1.73 million km 2 Queensland population (as at December 2016) Brisbane population* (preliminary estimate as at 30 June 2016)
 Brisbane population* (preliminary estimate as at 30 June 2016)") Queensland - 11 Queensland OVERVIEW Queensland is nearly five times the size of Japan, seven times the size of Great Britain, and two and a half times the size of Texas. Queensland is Australia s second
Queensland - 11 Queensland OVERVIEW Queensland is nearly five times the size of Japan, seven times the size of Great Britain, and two and a half times the size of Texas. Queensland is Australia s second
Land area 1.73 million km 2 Queensland population (as at 31 December 2017) Brisbane population* (preliminary estimate as at 30 June 2017)
 Brisbane population* (preliminary estimate as at 30 June 2017)") Queensland - 11 Queensland OVERVIEW Queensland is nearly five times the size of Japan, seven times the size of Great Britain, and two and a half times the size of Texas. Queensland is Australia s second
Queensland - 11 Queensland OVERVIEW Queensland is nearly five times the size of Japan, seven times the size of Great Britain, and two and a half times the size of Texas. Queensland is Australia s second
Queensland State Economy and State Budget
 Queensland State Economy and State Budget 2018-19 Government measures for business and industry The Queensland Treasurer, Jackie Trad delivered the Palaszczuk Government s fourth Budget on 12th June 2018.
Queensland Economic Update
 Queensland Economic Update Chamber of Commerce & Industry January 218 cciq.com.au Queensland Economic Update: Summary Economy State Final Demand (SFD) expanded by.2% in the September 217 quarter Household
2013/14 Pre-Budget Submission Accommodation Association of Australia
 2013/14 Pre-Budget Submission Accommodation Association of Australia Accommodation Association of Australia Principal Contact Mr Richard Munro Chief Executive Officer Phone: +61 2 8666 9015 EXECUTIVE SUMMARY
Queensland Economic Update
 Queensland Economic Update Chamber of Commerce & Industry March 2018 cciq.com.au Queensland Economic Update: Summary National Accounts GDP expanded 2.3% during calendar year 2017. QLD state final demand
New South Wales: state economy and State Budget,
 New South Wales: state economy and State Budget, 2016-17 Government measures for business and industry The 2016-17 NSW Budget was handed down by the NSW Treasurer, Gladys Berejiklian on Tuesday 21 June
Australian Cities Accounts Estimates. December 2011
 Australian Cities Accounts 2010-11 Estimates December 2011 This report has been prepared by: SGS Economics and Planning Pty Ltd ACN 007 437 729 Level 5 171 Latrobe Street MELBOURNE VIC 3000 P: + 61 3 8616
State of the States October 2017 State & territory economic performance report. Executive Summary
 State of the States October 2017 State & territory economic performance report. Executive Summary NSW ON TOP; VICTORIA CLOSES IN How are Australia s states and territories performing? Each quarter CommSec
Economic Contribution of Tourism to NSW
 Economic Contribution of Tourism to NSW 2015-16 Tourism is a significant part of the NSW economy. In 2015-16, tourism contributed $38.1 billion (Tourism Consumption) to the NSW economy and employed 261,100
TRENDS AND PROSPECTS FOR THE CAIRNS / TROPICAL NORTH QUEENSLAND ECONOMY PRESENTATION TO PROFESSIONAL ACCOUNTANTS CAIRNS
 TRENDS AND PROSPECTS FOR THE CAIRNS / TROPICAL NORTH QUEENSLAND ECONOMY PRESENTATION TO PROFESSIONAL ACCOUNTANTS CAIRNS WS (Bill) Cummings Ref: J3015 26th August 2016 AUSTRALIAN DOLLAR (SEPT) Year USD
Economic Contribution of Tourism to NSW
 Economic Contribution of Tourism to NSW 2013-14 Tourism is a significant part of the NSW economy. In 2013-14, tourism contributed $34.9 billion (Tourism Consumption) to the NSW economy and employed 272,000
Australian Casino Association ECONOMIC REPORT. Prepared for. Australian Casino Association. June Finance and Economics
 Australian Casino Association ECONOMIC REPORT Prepared for Australian Casino Association June 2004 Finance and Economics Contents Executive Summary--------------------------------------------------------------------------------------------
South Australian Centre for Economic Studies June 2016 Economic Briefing Report 28 June, 2016
 Steve Whetton, Executive Director, SA Centre for Economic Studies South Australian Centre for Economic Studies June 216 Economic Briefing Report 28 June, 216 Per cent Global GDP Growth 1 8 Developing Countries
MINING IN TASMANIA: DINOSAUR OR DELIVERER?
 MINING IN TASMANIA: DINOSAUR OR DELIVERER? PRESENTATION TO A FORUM HOSTED BY THE ACADEMY OF TECHNOLOGICAL SCIENCES AND ENGINEERING (ATSE) FOR NATIONAL SCIENCE WEEK RACV APARTMENT HOTEL, HOBART 3 RD AUGUST
Australia & New Zealand
 Strategy Management Consultancy Australia & New Zealand Regional Analysis k n o w l e d g e c e n t e r 2017 linesight.com/knowledge Contents Australia Australia Market Review 3 Macro indicators 4 Australia
Investor Briefings First-Half FY2016 Financial Results
 Cedar Woods Properties Limited Investor Briefings First-Half FY2016 Financial Results 26 February 2016 Cedar Woods Presentation 2 Snapshot of Achievements in FY2016 Extensive portfolio of residential estates
Australia and New Zealand
 Strategy Management Consultancy Australia and New Zealand Regional Analysis knowledge center September update 2018 Contents Australia Australia Market Review 3 Macro indicators 4 Australia key statistics
Queensland Economic Update. Are there more pots of gold ahead?
 Queensland Economic Update Are there more pots of gold ahead? Katie Dean Economist ANZ Bank 4 November 24 Australian economic growth has been strong and Queensland has been a star performer Economic growth
The Outlook for the Residential Construction Industry Hunter and the Central Coast
 The Outlook for the Residential Construction Industry Hunter and the Central Coast Graham Wolfe HIA Chief Executive Industry Policy and Media HIA Industry Outlook Breakfast Newcastle February 2013 Backdrop:
Why Invest in Australia?
 Great Barrier Reef Northern Territory Queensland Western Australia South Australia Gold Coast New South Wales Victoria Australian Capital Territory Tasmania Australia is the biggest island in the world;
Queensland Treasury s primary role is to advance the performance of Queensland s economy and to manage the State s finances.
 Public Service Commission Queensland Treasury Department role Queensland Treasury s primary role is to advance the performance of Queensland s economy and to manage the State s finances. It does this by:
QLD Economic Outlook. Thursday, 21 December Key Points: State Report QLD. Summary
 Thursday, 21 December 217 QLD Economic Outlook Summary Queensland s economy has been subdued over the past couple of years, as declining commodity prices and a sharp slowdown in mining investment weighed
Benchmarking Travel & Tourism in Australia
 Benchmarking Travel & Tourism in Australia How does Travel & Tourism compare to other sectors? Sponsored by: Summary of Findings, November 2013 Outline Introduction... 3 Australia summary..... 8 Data sources
Queensland Economic Update
 Queensland Economic Update June 2017 www.cciq.com.au Chamber of Commerce & Industry Queensland The latest national accounts data indicates growth in the Queensland economy remains patchy and the post mining
QANTAS DELIVERS STRONG FIRST HALF RESULT DESPITE HIGHER FUEL BILL
 ASX and Media Release Sydney, 21 February 2019 QANTAS DELIVERS STRONG FIRST HALF RESULT DESPITE HIGHER FUEL BILL Underlying Profit Before Tax: $780 million (down $179 million) Statutory Profit Before Tax:
Annual Gross Domestic Product (Production Measure)
") June 2017 Executive Summary Page 2 Latest Quarter Economic Trends page 3 Economic Outlook page 4 Labour Force page 5 Retail Activity page 6 Building Activity page 7 Tourism Trends page 8 Local Authorities
June 2017 Executive Summary Page 2 Latest Quarter Economic Trends page 3 Economic Outlook page 4 Labour Force page 5 Retail Activity page 6 Building Activity page 7 Tourism Trends page 8 Local Authorities
Media Release. Qantas Group Full Year 2017 Financial Result 1. Sydney, 25 August 2017
 Media Release Qantas Group Full Year 2017 Financial Result 1 Sydney, 25 August 2017 Underlying Profit Before Tax: $1,401 million (second highest in Qantas history) Statutory Profit Before Tax: $1,181 million
Heathrow (SP) Limited
 Limited") Draft v2.0 10 Feb Heathrow (SP) Limited Results for year ended 31 December 2013 24 February 2014 Strong operational and financial performance in 2013 Passenger satisfaction at record high and over 72 million
Draft v2.0 10 Feb Heathrow (SP) Limited Results for year ended 31 December 2013 24 February 2014 Strong operational and financial performance in 2013 Passenger satisfaction at record high and over 72 million
Australia & New Zealand
 Strategy Management Consultancy Australia & New Zealand Regional Analysis 2016 k n o w l e d g e c e n t e r Linesight Knowledge Center linesight.com Contents Australia Market Review 3 Australia Key Statistics
STATE UPDATE: QUEENSLAND
 STATE UPDATE: QUEENSLAND JULY CONTENTS Key points In Focus: Strong economic growth but incomes to remain weak Labour market Demographics 7 Consumer and household sector Business sector 9 Residential property
2012 Americas School of Mines
 www.pwc.com 2012 Americas School of Mines Australia Wayne Huf 2 Section One Some Background on Australia 3 Top 10 Deadliest Animals in Australia 1. Box Jellyfish 2. Inland Taipan Snake 3. Saltwater Crocodile
New South Wales: State Economy and State Budget,
 New South Wales: State Economy and State Budget, 2018-19 Government measures for business and industry The 2018-19 NSW Budget was handed down by the NSW Treasurer, Dominic Perrottet on Tuesday 19 June
Economic Performance of Australia s Cities and Regions Embargoed until Tuesday 5 December 2017
 Economic Performance of Australia s Cities and Regions Embargoed until Tuesday 5 December 2017 Media Release Tuesday 5 December 2017: New research released today by SGS Economics & Planning (SGS) reveals
QANTAS HALF YEAR 2015 FINANCIAL RESULTS 1
 QANTAS HALF YEAR 2015 FINANCIAL RESULTS 1 Key points: Underlying Profit Before Tax: $367 million Statutory Profit After Tax: $206 million Transformation benefits: $374 million Comparable unit cost reduction:
New Tourism Strategic Plan Northern Territory
 New Tourism Strategic Plan Northern Territory Submission of Accommodation Association of Australia, 2012 EXECUTIVE SUMMARY Without it being overly detrimental to existing tourism accommodation businesses,
Benchmarking Travel & Tourism in United Arab Emirates
 Benchmarking Travel & Tourism in United Arab Emirates How does Travel & Tourism compare to other sectors? Summary of Findings, November 2013 Sponsored by: Outline Introduction... 3 UAE summary...... 8
The Residential Outlook for South Australia
 The Residential Outlook for South Australia Matthew King Economist HOUSING INDUSTRY ASSOCIATION February 2011 Overview Economic backdrop Other important matters Interest rates & bank lending Renovations
South Australian Budget June 2014
 South Australian Budget 2014 15 June 2014 On 19 June 2014 South Australian Treasurer the Hon Tom Koutsantonis MP delivered the 2014 15 Budget. The main theme of the Budget is investment in public transport
Uncertainty in the demand for Australian tourism
 Uncertainty in the demand for Australian tourism ABSTR This paper conducts a visual examination of the data for both international tourist arrivals and for domestic tourism demand. The outcome of the examination
Benchmarking Travel & Tourism in Russia
 Benchmarking Travel & Tourism in Russia How does Travel & Tourism compare to other sectors? Sponsored by: Summary of Findings, November 2013 Outline Introduction... 3 Russia summary..... 8 Data sources
State Budget Breakfast
 Welcome to Master Builders SA s State Budget Breakfast July 8, 2016 Ian Markos Chief Executive Officer, Master Builders SA Associate Professor Michael O Neil Executive Director, South Australian Centre
South Australian Tourism Industry Council SA Tourism Barometer March Quarter 2015
 South Australian Tourism Industry Council SA Tourism Barometer March Quarter 2015 Headline: Events Season Provides a Lift In the March quarter 2015 survey the business activity index increased by 6% -
This document provides a summary of the Deloitte Access Economics Tourism and hotel market outlook. To access the complete edition or to discuss how
 2014 Tourism and hotel market outlook Executive summary edition, July 2014 This document provides a summary of the Deloitte Access Economics Tourism and hotel market outlook. To access the complete edition
MEDIA RELEASE Friday, 15 June 2012
 SOUTH AUSTRALIAN C E N T R E F O R E C O N O M I C S T U D I E S ADELAIDE & FLINDERS UNIVERSITIES MEDIA RELEASE Friday, 15 June 2012 EMBARGOED until 12.01am, Monday, 18 th June 2012 South Australia is
Presentation on Results for the 2nd Quarter FY Idemitsu Kosan Co.,Ltd. November 14, 2018
 Presentation on Results for the 2nd Quarter FY 2018 Idemitsu Kosan Co.,Ltd. November 14, 2018 Table of Contents 1. FY 2018 2nd Quarter Financials (1) Overview (2) Segment Information 2. Reference Materials
Queensland Budget. August 2017
 Queensland 2017-18 Budget August 2017 Hall Chadwick - Queensland In Focus On 13 June 2017, Queensland Treasurer, the Hon Curtis Pitt MP, delivered the 2017-18 State Budget, which focuses on attracting
Economic Impact Analysis. Tourism on Tasmania s King Island
 Economic Impact Analysis Tourism on Tasmania s King Island i Economic Impact Analysis Tourism on Tasmania s King Island This project has been conducted by REMPLAN Project Team Matthew Nichol Principal
Third Quarter Results
 1 Third Quarter 2010-11 Results Highlights of the Third Quarter Passenger business affected by significant disruptions Dynamic cargo activity Strong improvement in results Decline in ex-fuel unit costs
TOWNSVILLE NORTH QUEENSLAND QUARTERLY ECONOMIC SNAPSHOT
 TOWNSVILLE NORTH QUEENSLAND QUARTERLY ECONOMIC SNAPSHOT SEPTEMBER 2017 TOWNSVILLE NORTH QUEENSLAND QUARTERLY ECONOMIC SNAPSHOT SEPTEMBER 2017 The Townsville North Queensland Economic Snapshot provides
Heathrow (SP) Limited
 Limited") 28 April 2014 Heathrow (SP) Limited Results for three months ended 31 March 2014 Strong operational and financial performance at the outset of the new regulatory period Highest ever passenger satisfaction
28 April 2014 Heathrow (SP) Limited Results for three months ended 31 March 2014 Strong operational and financial performance at the outset of the new regulatory period Highest ever passenger satisfaction
Presentation on Results for the 3rd Quarter FY Idemitsu Kosan Co.,Ltd. February 14, 2019
 Presentation on Results for the 3rd Quarter FY 2018 Idemitsu Kosan Co.,Ltd. February 14, 2019 Table of Contents 1. FY 2018 3rd Quarter Results (1) Overview (2) Segment Information 2. Forecast for FY 2018
2014/15 Pre-Budget Submission Accommodation Association of Australia
 2014/15 Pre-Budget Submission Accommodation Association of Australia Accommodation Association of Australia Principal Contact Mr Richard Munro Chief Executive Officer Phone: +61 2 8666 9015 EXECUTIVE SUMMARY
View Report Details. Global Cruise Market
 View Report Details Global Cruise Market ----------------------------------- 2013 View Report Details Executive Summary Cruising is one of the fastest-growing industries in the travel and tourism sector.
Benchmarking Travel & Tourism in Colombia
 Benchmarking Travel & Tourism in Colombia How does Travel & Tourism compare to other sectors? Summary of Findings, November 2013 Sponsored by: Outline Introduction... 3 Colombia summary..... 8 Data sources
QUARTERLY UPDATE 31 MARCH 2017
 AUSTRALIAN PROPERTY OPPORTUNITIES FUND QUARTERLY UPDATE 31 MARCH 2017 The Australian Property Opportunities Fund (APOF I or the Fund) is pleased to provide this update for the March quarter 2017 (Q1 2017)
Airlines across the world connected a record number of cities this year, with more than 20,000 city pair connections*
 1 Airlines across the world connected a record number of cities this year, with more than 20,000 city pair connections*. This is a 1,351 increase over 2016 and a doubling of service since 1996, when there
Mexico. How does Travel & Tourism compare to other sectors? GDP. Size. Share. Mexico GDP Impact by Industry. Mexico GDP Impact by Industry
 Mexico Chapultepec Castle in Mexico City Agriculture Automotive Manufacturing Banking Chemicals Manufacturing Communications Education Financial Services Mining Other Service Exports Retail (without wholesale)
United Kingdom. How does Travel & Tourism compare to other sectors? GDP. Size. Share. UK GDP Impact by Industry. UK GDP Impact by Industry
 United Kingdom Stonehenge in Wiltshire Agriculture Automotive Banking Chemicals Communications Education Financial Mining Other Service Manufacturing Manufacturing Services Exports Retail (without wholesale)
24.1 Economic modelling
 24 ECONOMIC ASSESSMENT 24.1 Economic modelling 24.1.1 Government revenue estimates Clarification was requested on the estimated revenues to be received by the South Australian Government as a result of
What will a broad-based economic recovery mean for the Brisbane office leasing market?
 2 21 22 23 24 25 26 27 28 29 21 211 212 213 214 215 216 What will a broad-based economic recovery mean for the Brisbane office leasing market? December 216 Summary Introduction Vacancy in the Brisbane
For personal use only
 ASX and Media Release QANTAS DELIVERS RECORD FIRST HALF PROFIT, INVESTS IN AIRCRAFT AND TRAINING Sydney, 22 February 2018 Underlying Profit Before Tax: $976 million (up 15%) Record results for Qantas Domestic,
DESTINATION GIPPSLAND RESEARCH PROGRAM. Health of Tourism Preliminary Results
 DESTINATION GIPPSLAND RESEARCH PROGRAM Health of Tourism Preliminary Results Mike Ruzzene Director, Urban Enterprise CITY OF GREATER GEELONG OVERVIEW OF THE RESEARCH HEALTH OF TOURISM STUDY BUSINESS SURVEY
Virgin Australia Holdings Limited (ASX: VAH) H1 FY18 Results 1
 H1 FY18 Results 1") Virgin Australia Holdings Limited (ASX: VAH) H1 FY18 Results 1 Summary of H1 FY18 Group Outcomes 2 Group Underlying Profit Before Tax of $102.5 million up 142.3% Group Statutory Profit After Tax of $4.4
Virgin Australia Holdings Limited (ASX: VAH) H1 FY18 Results 1 Summary of H1 FY18 Group Outcomes 2 Group Underlying Profit Before Tax of $102.5 million up 142.3% Group Statutory Profit After Tax of $4.4
Presentation on Results for the 1st Quarter FY Idemitsu Kosan Co.,Ltd. August 14, 2017
 Presentation on Results for the 1st Quarter FY 2017 Idemitsu Kosan Co.,Ltd. August 14, 2017 Table of Contents 1. FY 2017 1st Quarter Financials (1) Overview (2) Segment Information 2. Reference Materials
Thank you for participating in the financial results for fiscal 2014.
 Thank you for participating in the financial results for fiscal 2014. ANA HOLDINGS strongly believes that safety is the most important principle of our air transportation business. The expansion of slots
FIRST QUARTER OPERATING PROFIT IMPROVES TO $274 MILLION
 1 August 2006 Page 1 of 4 No. 03/06 1 August 2006 FIRST QUARTER OPERATING PROFIT IMPROVES TO $274 MILLION HIGHLIGHTS OF THE GROUP S PERFORMANCE 1st Quarter 2006-07 Year-on-Year % Change Operating revenue
Presentation on Results for the 2nd Quarter FY Idemitsu Kosan Co.,Ltd. November 1, 2016
 Presentation on Results for the 2nd Quarter FY 2016 Idemitsu Kosan Co.,Ltd. November 1, 2016 Table of Contents 1. 2nd Quarter FY 2016 Financials (1) Overview (2) Segment Information 2. Reference Materials
Global economy and aviation do we have room to grow?
 Global economy and aviation do we have room to grow? 18 January 2017 Brian Pearce Chief Economist, IATA Airline Industry Economics Advisory Workshop 2016 1 Room to grow? Looking through the cycle Potential
Latin America: Outlook and Challenges Alejandro Werner Director Western Hemisphere Department
 International Monetary Fund Washington, DC. May, 3 Latin America: Outlook and Challenges Alejandro Werner Director Western Hemisphere Department Developments and Outlook Policy Challenges and Priorities
Pre-Budget Submission
 sdrftsdfsdfsdfsdw Pre-Budget Submission For WA State Budget 2019 1 P age Budget Submission Highlights Tourism in Western Australia contributes $11.8 billion in Gross State Product and generates 103,900
1Q FY2014/15. Financial Results Presentation. 13 August 2014 S Y D N E Y M E L B O U R N E B R I S B A N E C A I R N S
 1Q FY2014/15 Financial Results Presentation 13 August 2014 S Y D N E Y M E L B O U R N E B R I S B A N E C A I R N S B E I J I N G T O K Y O O S A K A S I N G A P O R E Disclaimer This presentation on
IAG results presentation. Quarter One th May 2018
 IAG results presentation Quarter One 2018 4 th May 2018 Highlights Willie Walsh, Chief Executive Officer Highlights Another strong quarter performance with an operating profit of 280m (5.6% margin, +2.3pts)
Cebu Pacific Air (CEB) Briefing Routes Asia 2012 Chengdu, China
 Briefing Routes Asia 2012 Chengdu, China") Cebu Pacific Air (CEB) Briefing Routes Asia 2012 Chengdu, China April 2012 Outline Who is Cebu Pacific? Business Proposition Support Package Required Who is Cebu Pacific? CEB: The Philippines Largest Carrier
Cebu Pacific Air (CEB) Briefing Routes Asia 2012 Chengdu, China April 2012 Outline Who is Cebu Pacific? Business Proposition Support Package Required Who is Cebu Pacific? CEB: The Philippines Largest Carrier
Department of State Development, Infrastructure and Planning. SEQ Economic Development Forum
 Department of State Development, Infrastructure and Planning SEQ Economic Development Forum 17 September 2014 Kathy Schaefer Deputy Director-General Overview DSDIP s role in delivering economic prosperity
Produced by: Destination Research Sergi Jarques, Director
 Produced by: Destination Research Sergi Jarques, Director Economic Impact of Tourism Oxfordshire - 2015 Economic Impact of Tourism Headline Figures Oxfordshire - 2015 Total number of trips (day & staying)
Presentation on Results for the 3rd Quarter FY Idemitsu Kosan Co.,Ltd. February 14, 2018
 Presentation on Results for the 3rd Quarter FY 2017 Idemitsu Kosan Co.,Ltd. February 14, 2018 Table of Contents 1. FY 2017 3rd Quarter Results (1) Overview (2) Segment Information 2. Forecast for FY2017
First Half 2013 Results. 16 mai 2013
 First Half 2013 Results 16 mai 2013 26 July 2013 Results Increasing effects of Transform 2015 Highlights of the First Half A difficult global economic environment Transform 2015 plan roll-out on track
PARENT AIRLINE OPERATIONS LIFT GROUP PROFIT
 PARENT AIRLINE OPERATIONS LIFT GROUP PROFIT HIGHLIGHTS OF THE GROUP S PERFORMANCE Financial Year 2006-07 4th Quarter 2006-07 Apr 2006 Mar 2007 Year-on-Year % Change Jan-Mar 2007 Year-on-Year % Change Operating
TOURISM: SUPERCHARGING AUSTRALIA S FUTURE
 TOURISM: SUPERCHARGING AUSTRALIA S FUTURE In partnership with ABOUT TTF The Tourism & Transport Forum (TTF) is the peak industry group for the Australian tourism, transport, aviation and investment sectors.
$131 MILLION OPERATING PROFIT IN THIRD QUARTER AMID CHALLENGING ENVIRONMENT
 7 February 2013 Page 1 of 3 No. 01/13 07 February 2013 $131 MILLION OPERATING PROFIT IN THIRD QUARTER AMID CHALLENGING ENVIRONMENT GROUP FINANCIAL PERFORMANCE Third Quarter 2012-13 The SIA Group recorded
The Manager Company Announcements Australian Stock Exchange Limited Sydney NSW Dear Sir. Demerger of BHP Steel
 The Manager Company Announcements Australian Stock Exchange Limited Sydney NSW 2000 Dear Sir Demerger of BHP Steel At the time of the announcement of the creation of the DLC between BHP Limited and Billiton
Economic Impact of Tourism in South Dakota, December 2017
 Economic Impact of Tourism in South Dakota, 2017 December 2017 1) Key findings 1) Growth continues in 2017 but pales against the event driven years of 2015 and 2016 in South Dakota Key facts about South
FY2015 2nd Quarter Business Results
 FY2015 2nd Quarter Business Results Project AH A MAY products Yamaha Corporation and Yamaha Motor Co., Ltd. make products by exchanging the design divisions and their design fields, and present a joint
Gladstone Market Overview
 Gladstone Market Overview Gladstone is currently goging through a rapid phase of economic growth. There is $30 billion worth of engineering construction underway, with the resultant construction-related
Press Release. Bilfinger 2017: Stable foundation laid for the future
 Press Release February 14, 2018 Bilfinger 2017: Stable foundation laid for the future Organic growth in orders received after three years of decline Trend reversal: Output volume better than expected Growth
2003/04 Full Year Results Presentation to Investors
 2003/04 Full Year Results Presentation to Investors 19 August 2004 Geoff Dixon Chief Executive Officer Highlights 12 months to June 2004 12 months to June 2003 Increase/ (decrease) % Sales and operating
ANA Holdings Financial Results for the Third Quarter of FY2013
 ANA HOLDINGS NEWS ANA Holdings Financial Results for the Third Quarter of FY2013 TOKYO January 31, 2014 - ANA Holdings (hereafter ANA HD ) today reports its consolidated financial for the third quarter
QLD Economic Outlook. Wednesday, 25 February State Report QLD. Summary
 Wednesday, 2 February 21 QLD Economic Outlook Summary Queensland s economy had been one of the outperforming States in recent years, reflecting the boom in resources investment. However, activity decelerated
TRANSPORT AFFORDABILITY INDEX
 TRANSPORT AFFORDABILITY INDEX Report - March 2018 AAA 1 AAA 2 Table of contents Foreword 4 Section One Overview 6 Section Two Summary of Results 8 Section Three Detailed Results 14 Section Four State by
Quarterly Aviation Industry Performance
 Quarterly Aviation Industry Performance ALAFCO Aviation Lease and Finance Company K.S.C.P. Quarterly Aviation Industry Performance 3Q17 (Updated November 17) Prepared by: Strategic Planning department
The Economic Impact of Tourism in Walworth County, Wisconsin. July 2013
 The Economic Impact of Tourism in Walworth County, Wisconsin July 2013 Key themes for 2012 The Walworth County, Wisconsin visitor economy continued its brisk growth in 2012. Visitor spending rose 11% after
BAA (SP) Limited Results for six months ended 30 June July 2011
 Limited Results for six months ended 30 June July 2011") BAA (SP) Limited Results for six months ended 30 June 2011 July 2011 Record Q2 Heathrow traffic Good overall service standards Strong financial results Successful dollar and sterling financings H1 2011
BAA (SP) Limited Results for six months ended 30 June 2011 July 2011 Record Q2 Heathrow traffic Good overall service standards Strong financial results Successful dollar and sterling financings H1 2011
FIRST QUARTER 2017 RESULTS. 4 May 2017
 FIRST QUARTER 2017 RESULTS 4 May 2017 A resilient start of the year, traffic up 4.2% 20.9 million passengers carried, up 5.2%, traffic (RPK) up 4.2%, capacity (ASK) up 3.3% and load factor up 0.7pts Confirmation
Distinguished guests, parliamentary colleagues, ladies and gentlemen.
 Developing the Territory Keynote 16/06/14 Developing the Top End from the last frontier to the next frontier. Chief Minister Distinguished guests, parliamentary colleagues, ladies and gentlemen. The frontier
Produced by: Destination Research Sergi Jarques, Director
 Produced by: Destination Research Sergi Jarques, Director Economic Impact of Tourism North Norfolk District - 2016 Contents Page Summary Results 2 Contextual analysis 4 Volume of Tourism 7 Staying Visitors
Produced by: Destination Research Sergi Jarques, Director
 Produced by: Destination Research Sergi Jarques, Director Economic Impact of Tourism Norfolk - 2016 Contents Page Summary Results 2 Contextual analysis 4 Volume of Tourism 7 Staying Visitors - Accommodation
Airport forecasting is used in master planning to guide future development of the Airport.
 Airport Forecasts Airport forecasting is used in master planning to guide future development of the Airport. 4.1 INTRODUCTION Airport forecasting ensures development is appropriate for passengers, ground
Sizing Worldwide Tourism Spending (or GTP ) & TripAdvisor s Economic Impact. TripAdvisor Strategic Insights & Oxford Economics
 & TripAdvisor s Economic Impact. TripAdvisor Strategic Insights & Oxford Economics") Sizing Worldwide Tourism Spending (or GTP ) & TripAdvisor s Economic Impact TripAdvisor Strategic Insights & Oxford Economics The value of global tourism has reached $US 5.29 trillion, with international
Sizing Worldwide Tourism Spending (or GTP ) & TripAdvisor s Economic Impact TripAdvisor Strategic Insights & Oxford Economics The value of global tourism has reached $US 5.29 trillion, with international
State Tourism Satellite Accounts
 State Tourism Satellite Accounts 2012 13 Acknowledgments The State Tourism Satellite Accounts series has been produced as part of a modelling program established and funded in partnership with the Australian