Land area 1.73 million km 2 Queensland population (as at 31 December 2017) Brisbane population* (preliminary estimate as at 30 June 2017)
|
|
|
- Francis Cooper
- 5 years ago
- Views:
Transcription
1 Queensland - 11
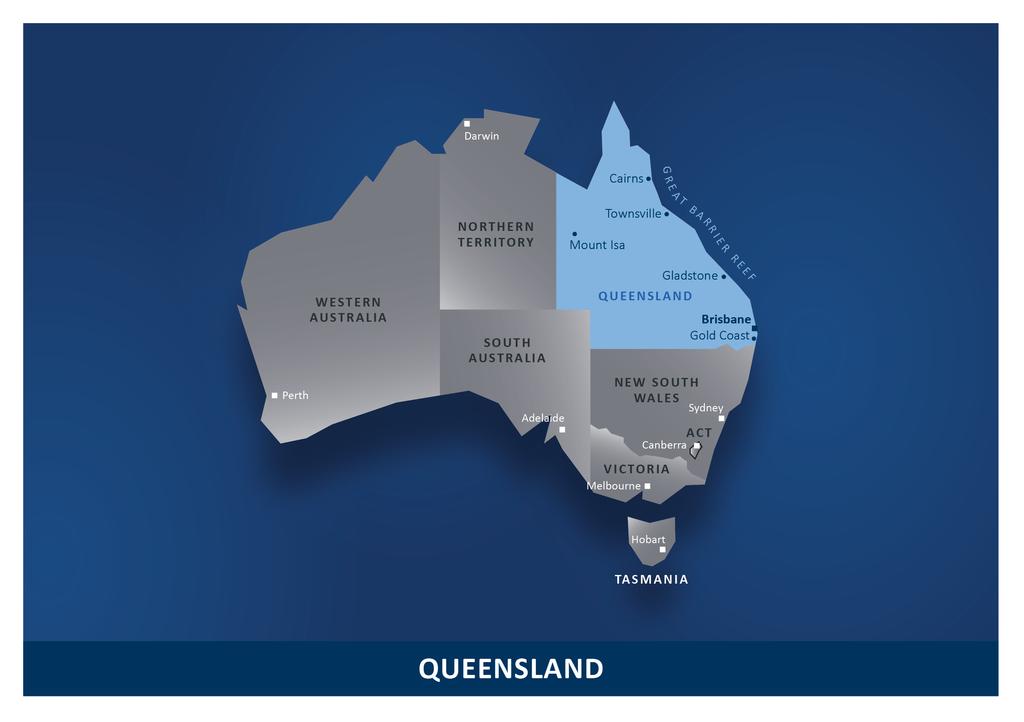
2 Queensland OVERVIEW Queensland is nearly five times the size of Japan, seven times the size of Great Britain, and two and a half times the size of Texas. Queensland is Australia s second largest state by land area, covering more than 22 per cent of the continent. The economy is the third largest in Australia, after New South Wales and Victoria. Queensland s natural wonder, the Great Barrier Reef, extends over some 2,000km, covering more than a quarter of the state s 7,400km of coastline. With a population of 4.97 million, 20 per cent of Australians live in Queensland. Around three million Queenslanders live in the state s south-east corner. Queensland Quick facts * Greater capital city statistical area ABS ** Total number of people employed. Data sources: Tourism Research Australia, ABS, RBA. Land area 1.73 million km 2 Queensland population (as at 31 December 2017) 4.97 million Brisbane population* (preliminary estimate as at 30 June 2017) 2.41 million Language English Currency Australian dollar (AUD) Gross State Product (2016/17) AUD332 billion (USD251 billion) Gross State Product, annual growth rate (long-run trend) 4.0% Flight time: Brisbane to Sydney 1.5 hours Workforce** (May 2018) 2.48 million Inflation rate (Year ending March 2018) 1.7% Overseas tourism visitor nights (Year ending December 2017) 35.3 million Queensland Treasury Corporation QUEENSLAND - 12
3 Queensland s economic standing GROWTH Queensland s rate of economic growth has consistently outperformed the average of other advanced economies since the early 90s, a trend that is forecast to continue. Queensland s economic growth compared to advanced economies 1 1 Advanced economy data are calendar year terms, while Queensland data are financial year terms. Advanced economy data are constant prices. QLD data are Chain volume measure (CVM), reference year. Data sources: IMF, ABS, Queensland Treasury. Queensland Treasury Corporation QUEENSLAND - 13
4 Queensland s economic growth compared to other states 1 Queensland s growth is forecast to be in line with Victoria and New South Wales over the next few years. 1 Growth is in real terms. Data sources: Various State Budgets and mid-year reviews, ABS. Queensland Treasury Corporation QUEENSLAND - 14

5 DIVERSE ECONOMY Australian states economic output by sector 1 Similar to Australia, Queensland has a diverse economy with no single sector making up more than 10 per cent of output , gross value added, current prices. * Public sector and utilities includes: public administration and safety; and electricity, gas, water, waste services. **Natural resources includes the extraction of naturally occurring mineral solids, such as coal and ores; liquid minerals, such as crude petroleum; and gases, such as natural gas. ***Other includes: dwellings; professional, scientific and technical services, accommodation and food services; other services; administrative and support services; arts and recreation. Data source: ABS. Queensland Treasury Corporation QUEENSLAND - 15
6 Contributions to growth in Queensland s Gross State Product 1 Following an unprecedented resources investment boom, the Queensland economy continues its transition to more broadbased growth. With LNG exports plateauing, an ongoing recovery in business investment, strengthening in household consumption and a solid contribution from public sector capital spending should all support stronger domestic activity over the period ahead. 1 Chain volume measure (CVM), reference year. Data source: Queensland Treasury, ABS. Note: onwards are forecasts / projections. Queensland Treasury Corporation QUEENSLAND - 16

7 Economic drivers EXPORTS Higher coal prices drove an increase in coal exports in LNG exports have increased significantly over the past few years as production has ramped up, however, are expected to plateau as production approaches capacity. Queensland s total exports 1 1 Nominal terms ($ billions). Data sources: ABS unpublished trade data, Queensland Treasury. Note: onwards are forecasts / projections. Queensland Treasury Corporation QUEENSLAND - 17
8 Queensland s goods exports by country 1 Asia remains Queensland s most important export market, accounting for more than three-quarters of Queensland s exports in Share of total value of goods exports, per cent. Data sources: ABS unpublished trade data, Queensland Treasury. Queensland Treasury Corporation QUEENSLAND - 18

9 Queensland s international tourist nights by country of origin Strong growth in overseas visitor nights since 2015 has been primarily driven by increases in visitor nights from China, Japan and Korea. This trend has been supported by rising levels of disposable income and a weaker Australian dollar, and should continue into the future as the Asian middle class continues to grow. Data source: Tourism Research Australia. Queensland Treasury Corporation QUEENSLAND - 19

10 EDUCATION Queensland s services exports (education): overseas student commencements Strong increases in overseas student commencements have driven education exports in Queensland in recent years. *Vocational education is tertiary education and training that provides accredited training in job ready and technical skills. Data source: Commonwealth Department of Education and Training. Queensland Treasury Corporation QUEENSLAND - 20
11 LABOUR MARKET Queensland s labour market Labour market conditions have improved further as the Queensland economy continues to transition to more broad based growth following the resources investment boom. Over 2017, the rate of employment growth trended above all states. Data sources: ABS, Queensland Treasury. Notes: Employment growth is seasonally adjusted over the year to June quarter and the unemployment rate is the seasonally adjusted rate for the June quarter in each year. Queensland Treasury Corporation QUEENSLAND - 21

12 DEMOGRAPHICS Queensland s population growth compared to Australia s 1 After slowing to 1.3 per cent in as the resources investment boom subsided, Queensland s population growth is forecast to average 1¾ per cent in Greater housing affordability in Brisbane is likely to lead to further strengthening in net interstate migration over the forward estimates. 1 Australia s population forecasts / projections are through-the-year growth rates at 31 December for each year, and are not directly comparable to Queensland s forecasts / projections which are in year-average terms. Data sources: ABS, Queensland Treasury, Australian Treasury. Note: onwards are forecasts / projections. Queensland Treasury Corporation QUEENSLAND - 22

13 Total grants* of around AUD28 billion are expected to account for approximately 50 per cent of Queensland s total government revenue in Queensland s fiscal position REVENUES Queensland budgeted revenues : AUD57 billion Queensland budgeted taxation revenues : AUD14 billion 1 May not add to 100 per cent due to rounding. *Grants from the Australian Government are almost evenly split between general and specific purpose payments. General purpose payments include GST revenue grants, are untied and used for both recurrent and capital purposes. Specific purpose payments are tied and used to fund specific projects or programs in order to support service delivery and facilitate reforms. ** This comprises the taxes and levies listed in the budgeted taxation revenues chart. Data source: Queensland Government Budget. Queensland Treasury Corporation QUEENSLAND - 23

14 Contribution of key items to revenue growth The key revenue sources of GST, royalties and taxes are expected to grow at rates more consistent with long-run average rates over the coming years, as opposed to the rapid pace of growth observed for most of the 2000s. Data source: Queensland Treasury. Queensland Treasury Corporation QUEENSLAND - 24
15 THE FEDERAL-STATE FISCAL RELATIONSHIP The states sources of revenue Australian states and territories (states) impose taxes, duties and charges in areas distinct from those where the Australian Government has authority. Examples of state taxes include payroll taxes, royalties as well as stamp duties and land taxes. The Australian Government provides explicit and predictable financial support to all states in the form of: General purpose payments untied grants which are funded by the Goods and Services Tax (GST) revenue and are used for both recurrent and capital purposes. Payments for specific purposes tied grants to fund specific projects or programs in order to support service delivery and facilitate reforms. The Australian Government s Natural Disaster Relief and Recovery Arrangements, which provide partial reimbursement for eligible costs incurred as a result of natural disasters, are also classified as a payment for specific purposes. The Australian government is currently reviewing GST distribution, with the aim of improving the resilience of the distribution methodology against economic shocks and reduce volatility of states and territories relativities. An agreement is expected by the end of See Appendices for more information on tax sharing arrangements and ratings. Queensland Treasury Corporation QUEENSLAND - 25

16 EXPENSES Queensland budgeted expenses : AUD57 billion Health and education make up more than half of the State s budgeted expenses. 1 May not add to 100 per cent, due to rounding. Data source: Queensland Government Budget. Queensland Treasury Corporation QUEENSLAND - 26

17 Annual growth in general government sector expenses Queensland has and will continue to implement strong expense management. Data sources: Actuals data from Queensland Treasury. Forecasts and projections from the Queensland Government Budget. Queensland Treasury Corporation QUEENSLAND - 27
18 BUDGET BALANCE General government sector net operating and fiscal balances Net operating surpluses are expected in each year of the forward estimates. Data sources: Actuals data from Queensland Treasury. Forecasts and projections from the Queensland Government Budget. Queensland Treasury Corporation QUEENSLAND - 28

19 GOVERNMENT CAPITAL EXPENDITURE Queensland s disaggregated state infrastructure spending Spending on improving Queensland s transport and communication and economic services infrastructure will continue to comprise the bulk of the Government s budgeted capital works program in *Mainly includes general government sector equipment investment expenditures on economic services and those not classified elsewhere. Data sources: Actuals data from Queensland Government Budget. Queensland Treasury Corporation QUEENSLAND - 29
20 Credit ratings RATINGS AGENCIES RATIONALE Data source: Standard & Poor s: Full Analysis: Queensland (State of), 23 October Data source: Moody s Investors Service: Credit Opinion: Queensland (State of) Australia, 20 April Note: Information on Queensland s domestic and international peers credit ratings can be found in the Appendices. STANDARD & POOR S AA+/Stable/A-1+ Summary rating rationale Queensland has exceptional liquidity, a very strong economy, strong financial management and budgetary performance, and low contingent liabilities. The State s strong financial management has improved its budgetary performance and achieved operating surpluses by controlling expenditure growth. The stable outlook reflects our expectation that the State's financial management will remain strong and its budgetary performance will continue to improve compared to recent years. MOODY S INVESTORS SERVICE Aa1/Stable/P-1 The rating reflects Queensland s financial performance which has shown improvements in recent years. The rating also reflects an easing in the state s debt burden from previously elevated levels. Moreover, the state s debt burden is projected to decline further. Queensland is unique among Australian states in that it has substantial financial holdings that are more than sufficient to fully fund its superannuation obligations. Credit is also supported by the state s growing and diverse economy. Queensland Treasury Corporation QUEENSLAND - 30
21 General government debt to revenue ratio One of the Government s fiscal principles is to target an ongoing reduction in Queensland s debt burden, as measured by the general government debt to revenue ratio. As a result of significant initiatives implemented through the Debt Action Plan, the General Government sector s debt to revenue ratio has fallen substantially from a peak of 91 per cent in to 53.8 per cent in , an improvement on the forecast at the Budget. Other key fiscal ratios can be found in the Appendices. Data source: Various Queensland Government Budgets and MYFER. Queensland Treasury Corporation QUEENSLAND - 31
22 General Government Sector net operating cash flow as a proportion of capital expenditure One of the Government s fiscal principles is to target net operating surpluses that ensure any new General Government sector capital investment is primarily funded through recurrent revenues rather than borrowing. Across the period to , the proportion of the capital program that is projected to be funded via net cash inflows from operating activities is 72 per cent. Data source: Queensland Government Budget. Queensland Treasury Corporation QUEENSLAND - 32
23 Summary of key points The State of Queensland has: a diverse economy with services making up a significant proportion of total output an economy which is expected to grow in line with the national average over the next few years a stable revenue stream in the form of grants it receives from the Australian Government State-owned infrastructure that generates dividend payments a unique position with financial holdings greater than its superannuation obligations General Government debt levels that have fallen over the past few years an ongoing General Government capital works program, which will be funded primarily through recurrent revenue as opposed to borrowing, and a rating of AA+/Stable/A-1+ and Aa1/Stable/P-1 by Standard & Poor s and Moody s Investors Service respectively. See Appendices for more information on tax sharing arrangements and ratings. Queensland Treasury Corporation QUEENSLAND - 33
Land area 1.73 million km 2 Queensland population (as at December 2016) Brisbane population* (preliminary estimate as at 30 June 2016)
 Brisbane population* (preliminary estimate as at 30 June 2016)") Queensland - 11 Queensland OVERVIEW Queensland is nearly five times the size of Japan, seven times the size of Great Britain, and two and a half times the size of Texas. Queensland is Australia s second
Queensland - 11 Queensland OVERVIEW Queensland is nearly five times the size of Japan, seven times the size of Great Britain, and two and a half times the size of Texas. Queensland is Australia s second
Land area 1.73 million km 2 Queensland population (December 2015) Brisbane population* (June 2015)
 Brisbane population* (June 2015)") Queensland - 18 Queensland OVERVIEW Queensland is nearly five times the size of Japan, seven times the size of Great Britain, and two and a half times the size of Texas. Queensland is Australia s second
Queensland - 18 Queensland OVERVIEW Queensland is nearly five times the size of Japan, seven times the size of Great Britain, and two and a half times the size of Texas. Queensland is Australia s second
Queensland State Economy and State Budget
 Queensland State Economy and State Budget 2018-19 Government measures for business and industry The Queensland Treasurer, Jackie Trad delivered the Palaszczuk Government s fourth Budget on 12th June 2018.
Queensland Economic Update
 Queensland Economic Update Chamber of Commerce & Industry March 2018 cciq.com.au Queensland Economic Update: Summary National Accounts GDP expanded 2.3% during calendar year 2017. QLD state final demand
Queensland Economic Update
 Queensland Economic Update Chamber of Commerce & Industry January 218 cciq.com.au Queensland Economic Update: Summary Economy State Final Demand (SFD) expanded by.2% in the September 217 quarter Household
2013/14 Pre-Budget Submission Accommodation Association of Australia
 2013/14 Pre-Budget Submission Accommodation Association of Australia Accommodation Association of Australia Principal Contact Mr Richard Munro Chief Executive Officer Phone: +61 2 8666 9015 EXECUTIVE SUMMARY
Australian Cities Accounts Estimates. December 2011
 Australian Cities Accounts 2010-11 Estimates December 2011 This report has been prepared by: SGS Economics and Planning Pty Ltd ACN 007 437 729 Level 5 171 Latrobe Street MELBOURNE VIC 3000 P: + 61 3 8616
South Australian Centre for Economic Studies June 2016 Economic Briefing Report 28 June, 2016
 Steve Whetton, Executive Director, SA Centre for Economic Studies South Australian Centre for Economic Studies June 216 Economic Briefing Report 28 June, 216 Per cent Global GDP Growth 1 8 Developing Countries
The Residential Outlook for South Australia
 The Residential Outlook for South Australia Matthew King Economist HOUSING INDUSTRY ASSOCIATION February 2011 Overview Economic backdrop Other important matters Interest rates & bank lending Renovations
State Budget Breakfast
 Welcome to Master Builders SA s State Budget Breakfast July 8, 2016 Ian Markos Chief Executive Officer, Master Builders SA Associate Professor Michael O Neil Executive Director, South Australian Centre
State of the States October 2017 State & territory economic performance report. Executive Summary
 State of the States October 2017 State & territory economic performance report. Executive Summary NSW ON TOP; VICTORIA CLOSES IN How are Australia s states and territories performing? Each quarter CommSec
New South Wales: state economy and State Budget,
 New South Wales: state economy and State Budget, 2016-17 Government measures for business and industry The 2016-17 NSW Budget was handed down by the NSW Treasurer, Gladys Berejiklian on Tuesday 21 June
Economic Contribution of Tourism to NSW
 Economic Contribution of Tourism to NSW 2015-16 Tourism is a significant part of the NSW economy. In 2015-16, tourism contributed $38.1 billion (Tourism Consumption) to the NSW economy and employed 261,100
QLD Economic Outlook. Thursday, 21 December Key Points: State Report QLD. Summary
 Thursday, 21 December 217 QLD Economic Outlook Summary Queensland s economy has been subdued over the past couple of years, as declining commodity prices and a sharp slowdown in mining investment weighed
TRENDS AND PROSPECTS FOR THE CAIRNS / TROPICAL NORTH QUEENSLAND ECONOMY PRESENTATION TO PROFESSIONAL ACCOUNTANTS CAIRNS
 TRENDS AND PROSPECTS FOR THE CAIRNS / TROPICAL NORTH QUEENSLAND ECONOMY PRESENTATION TO PROFESSIONAL ACCOUNTANTS CAIRNS WS (Bill) Cummings Ref: J3015 26th August 2016 AUSTRALIAN DOLLAR (SEPT) Year USD
STATE UPDATE: QUEENSLAND
 STATE UPDATE: QUEENSLAND JULY CONTENTS Key points In Focus: Strong economic growth but incomes to remain weak Labour market Demographics 7 Consumer and household sector Business sector 9 Residential property
Queensland Economic Update. Are there more pots of gold ahead?
 Queensland Economic Update Are there more pots of gold ahead? Katie Dean Economist ANZ Bank 4 November 24 Australian economic growth has been strong and Queensland has been a star performer Economic growth
New South Wales: State Economy and State Budget,
 New South Wales: State Economy and State Budget, 2018-19 Government measures for business and industry The 2018-19 NSW Budget was handed down by the NSW Treasurer, Dominic Perrottet on Tuesday 19 June
South Australian Budget June 2014
 South Australian Budget 2014 15 June 2014 On 19 June 2014 South Australian Treasurer the Hon Tom Koutsantonis MP delivered the 2014 15 Budget. The main theme of the Budget is investment in public transport
Australian Casino Association ECONOMIC REPORT. Prepared for. Australian Casino Association. June Finance and Economics
 Australian Casino Association ECONOMIC REPORT Prepared for Australian Casino Association June 2004 Finance and Economics Contents Executive Summary--------------------------------------------------------------------------------------------
Economic Contribution of Tourism to NSW
 Economic Contribution of Tourism to NSW 2013-14 Tourism is a significant part of the NSW economy. In 2013-14, tourism contributed $34.9 billion (Tourism Consumption) to the NSW economy and employed 272,000
Uncertainty in the demand for Australian tourism
 Uncertainty in the demand for Australian tourism ABSTR This paper conducts a visual examination of the data for both international tourist arrivals and for domestic tourism demand. The outcome of the examination
What will a broad-based economic recovery mean for the Brisbane office leasing market?
 2 21 22 23 24 25 26 27 28 29 21 211 212 213 214 215 216 What will a broad-based economic recovery mean for the Brisbane office leasing market? December 216 Summary Introduction Vacancy in the Brisbane
Investor Briefings First-Half FY2016 Financial Results
 Cedar Woods Properties Limited Investor Briefings First-Half FY2016 Financial Results 26 February 2016 Cedar Woods Presentation 2 Snapshot of Achievements in FY2016 Extensive portfolio of residential estates
The Outlook for the Residential Construction Industry Hunter and the Central Coast
 The Outlook for the Residential Construction Industry Hunter and the Central Coast Graham Wolfe HIA Chief Executive Industry Policy and Media HIA Industry Outlook Breakfast Newcastle February 2013 Backdrop:
MINING IN TASMANIA: DINOSAUR OR DELIVERER?
 MINING IN TASMANIA: DINOSAUR OR DELIVERER? PRESENTATION TO A FORUM HOSTED BY THE ACADEMY OF TECHNOLOGICAL SCIENCES AND ENGINEERING (ATSE) FOR NATIONAL SCIENCE WEEK RACV APARTMENT HOTEL, HOBART 3 RD AUGUST
Queensland Economic Update
 Queensland Economic Update June 2017 www.cciq.com.au Chamber of Commerce & Industry Queensland The latest national accounts data indicates growth in the Queensland economy remains patchy and the post mining
QANTAS DELIVERS STRONG FIRST HALF RESULT DESPITE HIGHER FUEL BILL
 ASX and Media Release Sydney, 21 February 2019 QANTAS DELIVERS STRONG FIRST HALF RESULT DESPITE HIGHER FUEL BILL Underlying Profit Before Tax: $780 million (down $179 million) Statutory Profit Before Tax:
Annual Gross Domestic Product (Production Measure)
") June 2017 Executive Summary Page 2 Latest Quarter Economic Trends page 3 Economic Outlook page 4 Labour Force page 5 Retail Activity page 6 Building Activity page 7 Tourism Trends page 8 Local Authorities
June 2017 Executive Summary Page 2 Latest Quarter Economic Trends page 3 Economic Outlook page 4 Labour Force page 5 Retail Activity page 6 Building Activity page 7 Tourism Trends page 8 Local Authorities
Economic Performance of Australia s Cities and Regions Embargoed until Tuesday 5 December 2017
 Economic Performance of Australia s Cities and Regions Embargoed until Tuesday 5 December 2017 Media Release Tuesday 5 December 2017: New research released today by SGS Economics & Planning (SGS) reveals
TOWNSVILLE NORTH QUEENSLAND QUARTERLY ECONOMIC SNAPSHOT
 TOWNSVILLE NORTH QUEENSLAND QUARTERLY ECONOMIC SNAPSHOT SEPTEMBER 2017 TOWNSVILLE NORTH QUEENSLAND QUARTERLY ECONOMIC SNAPSHOT SEPTEMBER 2017 The Townsville North Queensland Economic Snapshot provides
Australia and New Zealand
 Strategy Management Consultancy Australia and New Zealand Regional Analysis knowledge center September update 2018 Contents Australia Australia Market Review 3 Macro indicators 4 Australia key statistics
market-view Australian housing markets report Residential construction on the rise - higher and higher?
 Australian housing markets report Residential construction on the rise - higher and higher? Dr Andrew Wilson Chief Economist Domain Group October 2016 Copyright 2016 Dr Andrew Wilson all rights reserved
South Australian Tourism Industry Council SA Tourism Barometer March Quarter 2015
 South Australian Tourism Industry Council SA Tourism Barometer March Quarter 2015 Headline: Events Season Provides a Lift In the March quarter 2015 survey the business activity index increased by 6% -
MAINFREIGHT LIMITED FULL YEAR RESULT TO MARCH 2015
 MAINFREIGHT LIMITED FULL YEAR RESULT TO MARCH 2015 Result Summary NET SURPLUS Net surplus after tax and before abnormal items up 7.7% to $83.48 million REVENUE EBITDA Revenue up 6.8% to $2.05 billion Excluding
2012 Americas School of Mines
 www.pwc.com 2012 Americas School of Mines Australia Wayne Huf 2 Section One Some Background on Australia 3 Top 10 Deadliest Animals in Australia 1. Box Jellyfish 2. Inland Taipan Snake 3. Saltwater Crocodile
PEAK DOWNTURN UPSWING TROUGH RECOVERY
 MARKET OUTLOOK PROPERTY CYCLE UPSWING PEAK TROUGH DOWNTURN RECOVERY TEN CYCLES SINCE 1880 AVERAGE 8 YEARS 5 YEARS UPSWING @ 11% pa 3 YEARS DOWNTURN @ - 5% pa PAST CYCLES AVG 8.5% PA PROPERTY CYCLE? 1.
2014/15 Pre-Budget Submission Accommodation Association of Australia
 2014/15 Pre-Budget Submission Accommodation Association of Australia Accommodation Association of Australia Principal Contact Mr Richard Munro Chief Executive Officer Phone: +61 2 8666 9015 EXECUTIVE SUMMARY
NBAA 2015 MARKET UPDATE
 NBAA 2015 MARKET UPDATE November 2015 Forward-Looking Statements 2 This report contains forward-looking statements within the meaning of Section 21E of the Securities Exchange Act of 1934. All statements,
What will Mackay be like in 5 years time?
 What will Mackay be like in 5 years time? Information booklet Presentation to Mackay Region Chamber of Commerce by Dr Kim Houghton Director Strategic Economic Solutions 4 September 2013 Strategic Economic
Queensland Treasury s primary role is to advance the performance of Queensland s economy and to manage the State s finances.
 Public Service Commission Queensland Treasury Department role Queensland Treasury s primary role is to advance the performance of Queensland s economy and to manage the State s finances. It does this by:
Benchmarking Travel & Tourism in Australia
 Benchmarking Travel & Tourism in Australia How does Travel & Tourism compare to other sectors? Sponsored by: Summary of Findings, November 2013 Outline Introduction... 3 Australia summary..... 8 Data sources
1. Overview and Key Issues
 1. Overview and Key Issues 1.1 Role of State Government in Tourism The core tourism objective of state government is to maximise visitor expenditure in the state economy, by maximising the state s market
Why Invest in Australia?
 Great Barrier Reef Northern Territory Queensland Western Australia South Australia Gold Coast New South Wales Victoria Australian Capital Territory Tasmania Australia is the biggest island in the world;
Australia & New Zealand
 Strategy Management Consultancy Australia & New Zealand Regional Analysis k n o w l e d g e c e n t e r 2017 linesight.com/knowledge Contents Australia Australia Market Review 3 Macro indicators 4 Australia
New Tourism Strategic Plan Northern Territory
 New Tourism Strategic Plan Northern Territory Submission of Accommodation Association of Australia, 2012 EXECUTIVE SUMMARY Without it being overly detrimental to existing tourism accommodation businesses,
MEDIA RELEASE Friday, 15 June 2012
 SOUTH AUSTRALIAN C E N T R E F O R E C O N O M I C S T U D I E S ADELAIDE & FLINDERS UNIVERSITIES MEDIA RELEASE Friday, 15 June 2012 EMBARGOED until 12.01am, Monday, 18 th June 2012 South Australia is
Gladstone Market Overview
 Gladstone Market Overview Gladstone is currently goging through a rapid phase of economic growth. There is $30 billion worth of engineering construction underway, with the resultant construction-related
Benchmarking Travel & Tourism in Russia
 Benchmarking Travel & Tourism in Russia How does Travel & Tourism compare to other sectors? Sponsored by: Summary of Findings, November 2013 Outline Introduction... 3 Russia summary..... 8 Data sources
Media Release. Qantas Group Full Year 2017 Financial Result 1. Sydney, 25 August 2017
 Media Release Qantas Group Full Year 2017 Financial Result 1 Sydney, 25 August 2017 Underlying Profit Before Tax: $1,401 million (second highest in Qantas history) Statutory Profit Before Tax: $1,181 million
2017 Major Projects Pipeline Report Adrian Hart, Senior Manager Infrastructure & Mining
 2017 Major Projects Pipeline Report Adrian Hart, Senior Manager Infrastructure & Mining Major Projects Pipeline Report - 2017 Presentation Outline Overview and key findings of the 2017 Pipeline Report
QANTAS HALF YEAR 2015 FINANCIAL RESULTS 1
 QANTAS HALF YEAR 2015 FINANCIAL RESULTS 1 Key points: Underlying Profit Before Tax: $367 million Statutory Profit After Tax: $206 million Transformation benefits: $374 million Comparable unit cost reduction:
DESTINATION GIPPSLAND RESEARCH PROGRAM. Health of Tourism Preliminary Results
 DESTINATION GIPPSLAND RESEARCH PROGRAM Health of Tourism Preliminary Results Mike Ruzzene Director, Urban Enterprise CITY OF GREATER GEELONG OVERVIEW OF THE RESEARCH HEALTH OF TOURISM STUDY BUSINESS SURVEY
RESEARCH NOTE. Qantas Group Ltd Neutral
 1 RESEARCH NOTE Qantas Group Ltd Neutral Price: A$5.80 Price Target: A$6.17 ASX: QAN 18 September 2017 Myer Holdings (MYR) reported disappointing FY17 results and guided to a weak start to the FY18 year,
Heathrow (SP) Limited
 Limited") Draft v2.0 10 Feb Heathrow (SP) Limited Results for year ended 31 December 2013 24 February 2014 Strong operational and financial performance in 2013 Passenger satisfaction at record high and over 72 million
Draft v2.0 10 Feb Heathrow (SP) Limited Results for year ended 31 December 2013 24 February 2014 Strong operational and financial performance in 2013 Passenger satisfaction at record high and over 72 million
Expenditure Share of Visitors Visitor Expenditure expenditure nights per visitor
 Table 23 Modelled domestic overnight visitor expenditure (a) in the top 20 regions ranked by expenditure, including airfares and long distance transport costs Year ended 31 March 2010 (a) (b) Expenditure
Annual Earnings Report 30 June 2002
 BHP STEEL LIMITED A.B.N. 16 000 011 058 Level 11, 120 Collins Street Melbourne, Victoria 3001 Ph: +61 3 9666 4000 Fax: +61 3 9666 4111 Website: www.bhpsteel.com 7 th August 2002 PLEASE NOTE Annual Earnings
Aviation Performance in NSW
 Aviation Performance in NSW 2015-16 November 2016 This report by Tourism Futures International for Destination New South Wales reviews the operating environment and aviation performance of Sydney and NSW
Benchmarking Travel & Tourism in United Arab Emirates
 Benchmarking Travel & Tourism in United Arab Emirates How does Travel & Tourism compare to other sectors? Summary of Findings, November 2013 Sponsored by: Outline Introduction... 3 UAE summary...... 8
QLD ECONOMIC OUTLOOK 9 January 2012
 QLD ECONOMIC OUTLOOK 9 January Summary: Queensland is the third largest economy in Australia and comprises a 19.1 share of Australia s GDP. While the mining industry gains much attention, the construction
Domestic Tourism Snapshot Year ending March 2018
 Domestic overnight s within Australia Robust growth delivers records Domestic overnight expenditure in Australia Avg # Australians took a record 97.8m domestic overnight trips in 1 2 stay the year ending
GRANT THORNTON BANKERS BOOT CAMP
 GRANT THORNTON BANKERS BOOT CAMP Where are we in the cycle? Yield compression slowing, rents growing Yields bottoming but the bottom could last till 2020 The end of yield compression brings income return
Mexico. How does Travel & Tourism compare to other sectors? GDP. Size. Share. Mexico GDP Impact by Industry. Mexico GDP Impact by Industry
 Mexico Chapultepec Castle in Mexico City Agriculture Automotive Manufacturing Banking Chemicals Manufacturing Communications Education Financial Services Mining Other Service Exports Retail (without wholesale)
Heathrow (SP) Limited
 Limited") 28 April 2014 Heathrow (SP) Limited Results for three months ended 31 March 2014 Strong operational and financial performance at the outset of the new regulatory period Highest ever passenger satisfaction
28 April 2014 Heathrow (SP) Limited Results for three months ended 31 March 2014 Strong operational and financial performance at the outset of the new regulatory period Highest ever passenger satisfaction
International Tourism Snapshot
 Australia on a high International visitors to Australia Australia welcomed 7.8m international visitors in the year ending June International visitor expenditure in Australia 2017, more than any previous
AEROFLOT ANNOUNCES FY 2017 IFRS FINANCIAL RESULTS
 AEROFLOT ANNOUNCES FY 2017 IFRS FINANCIAL RESULTS Moscow, 1 March 2018 Aeroflot Group ( the Group, Moscow Exchange ticker: AFLT) today publishes its audited financial statements in accordance with International
Distinguished guests, parliamentary colleagues, ladies and gentlemen.
 Developing the Territory Keynote 16/06/14 Developing the Top End from the last frontier to the next frontier. Chief Minister Distinguished guests, parliamentary colleagues, ladies and gentlemen. The frontier
Destination Visitor Survey Strategic Regional Research Queensland: Understanding the Queensland Touring Group
 Destination Visitor Survey Strategic Regional Research : Understanding the Touring Group Introduction Tourism is a major industry for (Qld), directly contributing around 124,000 jobs annually. In the year
View Report Details. Global Cruise Market
 View Report Details Global Cruise Market ----------------------------------- 2013 View Report Details Executive Summary Cruising is one of the fastest-growing industries in the travel and tourism sector.
Economic Report. Tasmania December Savills Research. Tasmania - Key Economic Indicators. Highlights
 Savills Research Economic Report Tasmania December 2018 Highlights Tasmania s economic growth for the current annual period has been notably above trend, with the strongest growth rate, on GSP numbers,
Queensland Budget. August 2017
 Queensland 2017-18 Budget August 2017 Hall Chadwick - Queensland In Focus On 13 June 2017, Queensland Treasurer, the Hon Curtis Pitt MP, delivered the 2017-18 State Budget, which focuses on attracting
Quarterly Aviation Industry Performance
 Quarterly Aviation Industry Performance ALAFCO Aviation Lease and Finance Company K.S.C.P. Quarterly Aviation Industry Performance 3Q17 (Updated November 17) Prepared by: Strategic Planning department
Queensland Tourism Aviation Blueprint to 2016
 Queensland Tourism Aviation Blueprint to 2016 tq.com.au Blueprint outline The purpose of the Queensland Tourism Aviation Blueprint to 2016 is to develop the strategic framework that will guide aviation
Pre-Budget Submission
 sdrftsdfsdfsdfsdw Pre-Budget Submission For WA State Budget 2019 1 P age Budget Submission Highlights Tourism in Western Australia contributes $11.8 billion in Gross State Product and generates 103,900
State Budget Comment
 $ millions 2014-2015 State Budget Comment Introduction RACQ considers that the Queensland Government delivered motorists a good budget in 2014-15. Allocations for road and transport infrastructure remained
Benchmarking Travel & Tourism in Colombia
 Benchmarking Travel & Tourism in Colombia How does Travel & Tourism compare to other sectors? Summary of Findings, November 2013 Sponsored by: Outline Introduction... 3 Colombia summary..... 8 Data sources
Latin America: Outlook and Challenges Alejandro Werner Director Western Hemisphere Department
 International Monetary Fund Washington, DC. May, 3 Latin America: Outlook and Challenges Alejandro Werner Director Western Hemisphere Department Developments and Outlook Policy Challenges and Priorities
MENA HOTEL MARKET REVIEW MUSCAT OMAN 2018
 MENA HOTEL MARKET REVIEW MUSCAT OMAN 2018 www.trimideast.com 1 OMR (billion) MENA HOTEL MARKET REVIEW MUSCAT OMAN 2018 OMAN ECONOMIC OVERVIEW Oman s economy continues to be heavily reliant on hydrocarbons,
Regional Universities Network. Introduction. Regional Universities Network. Economic Impact of the Universities in the Regional Universities Network
 Regional Universities Network Economic Impact of the Universities in the Regional Universities Network Introduction The Regional Universities Network (RUN) is a network of six universities with headquarters
Presentation on Results for the 3rd Quarter FY Idemitsu Kosan Co.,Ltd. February 14, 2019
 Presentation on Results for the 3rd Quarter FY 2018 Idemitsu Kosan Co.,Ltd. February 14, 2019 Table of Contents 1. FY 2018 3rd Quarter Results (1) Overview (2) Segment Information 2. Forecast for FY 2018
For personal use only
 ASX and Media Release QANTAS DELIVERS RECORD FIRST HALF PROFIT, INVESTS IN AIRCRAFT AND TRAINING Sydney, 22 February 2018 Underlying Profit Before Tax: $976 million (up 15%) Record results for Qantas Domestic,
Airlines across the world connected a record number of cities this year, with more than 20,000 city pair connections*
 1 Airlines across the world connected a record number of cities this year, with more than 20,000 city pair connections*. This is a 1,351 increase over 2016 and a doubling of service since 1996, when there
Presentation on Results for the 2nd Quarter FY Idemitsu Kosan Co.,Ltd. November 14, 2018
 Presentation on Results for the 2nd Quarter FY 2018 Idemitsu Kosan Co.,Ltd. November 14, 2018 Table of Contents 1. FY 2018 2nd Quarter Financials (1) Overview (2) Segment Information 2. Reference Materials
Norfolk Island tourism industry
 Norfolk Island tourism industry Significance of tourism The tourism industry is Norfolk Island s main export and is a major driver of the Island s economy. Using expected distribution and value of tourist
COFFS HARBOUR MARKETSNAPSHOT
 MARKETSNAPSHOT NEW SOUTH WALES The Mid North Coast region is ranked fourth in Australia for business confidence with its regional economy growing at a healthy 4.1% p.a. and produces an annual Gross Regional
Authored by Cr Bob Manning Mayor
 Queensland Treasury Corporation Investor Conference Presentation Authored by Cr Bob Manning Mayor Cairns Regional Council 1 Two and half years ago, I stood before the Public Hearing for the Joint Select
United Kingdom. How does Travel & Tourism compare to other sectors? GDP. Size. Share. UK GDP Impact by Industry. UK GDP Impact by Industry
 United Kingdom Stonehenge in Wiltshire Agriculture Automotive Banking Chemicals Communications Education Financial Mining Other Service Manufacturing Manufacturing Services Exports Retail (without wholesale)
Quarterly Aviation Industry Performance
 Quarterly Aviation Industry Performance ALAFCO Aviation Lease and Finance Company K.S.C.P. Quarterly Aviation Industry Performance (March - June 17) Prepared by: Strategic Planning department 1 Quarterly
Australia s Building Industry current conditions and future prospects
 Australia s Building Industry current conditions and future prospects Dr Harley Dale HIA Chief Economist Alpine Nurseries Business Seminar Tuesday 26th August 2014, Sydney What is driving housing activity?
Australia as an Innovation Nation
 Australia as an Innovation Nation The Australian Economy and the Government s National Science and Innovation Agenda Damien Miller Australian Ambassador to Denmark, Norway and Iceland The Australian Economy
This document provides a summary of the Deloitte Access Economics Tourism and hotel market outlook. To access the complete edition or to discuss how
 2014 Tourism and hotel market outlook Executive summary edition, July 2014 This document provides a summary of the Deloitte Access Economics Tourism and hotel market outlook. To access the complete edition
FY2015 2nd Quarter Business Results
 FY2015 2nd Quarter Business Results Project AH A MAY products Yamaha Corporation and Yamaha Motor Co., Ltd. make products by exchanging the design divisions and their design fields, and present a joint
Top & Bottom Image: Tourism Australia Cover Image: Tourism Australia Melbourne Food & Wine Festival
 Restaurant & Catering Australia (R&CA) is the national industry association representing the interests of 52,500 restaurants, cafes, catering and takeaway businesses across Australia. R&CA delivers tangible
AIR CANADA REPORTS THIRD QUARTER RESULTS
 AIR CANADA REPORTS THIRD QUARTER RESULTS THIRD QUARTER OVERVIEW Operating income of $112 million compared to operating income of $351 million in the third quarter of 2007. Fuel expense increased 49 per
The Economic Impact of Tourism in North Carolina. Tourism Satellite Account Calendar Year 2013
 The Economic Impact of Tourism in North Carolina Tourism Satellite Account Calendar Year 2013 Key results 2 Total tourism demand tallied $26 billion in 2013, expanding 3.9%. This marks another new high
AIR CANADA REPORTS 2010 THIRD QUARTER RESULTS; Operating Income improved $259 million or 381 per cent from previous year s quarter
 AIR CANADA REPORTS 2010 THIRD QUARTER RESULTS; Operating Income improved $259 million or 381 per cent from previous year s quarter MONTRÉAL, November 4, 2010 Air Canada today reported operating income
Holiday visitation grew 8.6% to a record 41.7m visitors, who spent a record $29.6bn, up 8.4% year on year.
 Domestic overnight visitors within Australia Interstate 33,58,000 8.0% 4.7-0.1 Holiday 11,95,000 8.% 5.5 0.0 Business 10,73,000 1.3% 3.2-0.1 VFR 10,452,000 2.% 4.9-0.1 Domestic travel continues to break
AIR TRANSPORT MARKET ANALYSIS MAY 2011
 AIR TRANSPORT MARKET ANALYSIS MAY 2011 KEY POINTS May saw a renewed expansion in both air travel and freight, after a soft patch during the previous three months. Air travel volumes were 6.8% higher than
For personal use only ANNUAL GENERAL MEETING WEDNESDAY 4 NOVEMBER 2015
 ANNUAL GENERAL MEETING WEDNESDAY 4 NOVEMBER 2015 ECHO ENTERTAINMENT GROUP LIMITED ACN 149 629 023 2015 ANNUAL GENERAL MEETING WEDNESDAY 4 NOVEMBER 2015 JOHN O NEILL AO CHAIRMAN 2 OUR PROPERTIES Image for
The Manager Company Announcements Australian Stock Exchange Limited Sydney NSW Dear Sir. Demerger of BHP Steel
 The Manager Company Announcements Australian Stock Exchange Limited Sydney NSW 2000 Dear Sir Demerger of BHP Steel At the time of the announcement of the creation of the DLC between BHP Limited and Billiton