Central Highlands Regional Population Forum
|
|
|
- Kerry Stone
- 5 years ago
- Views:
Transcription
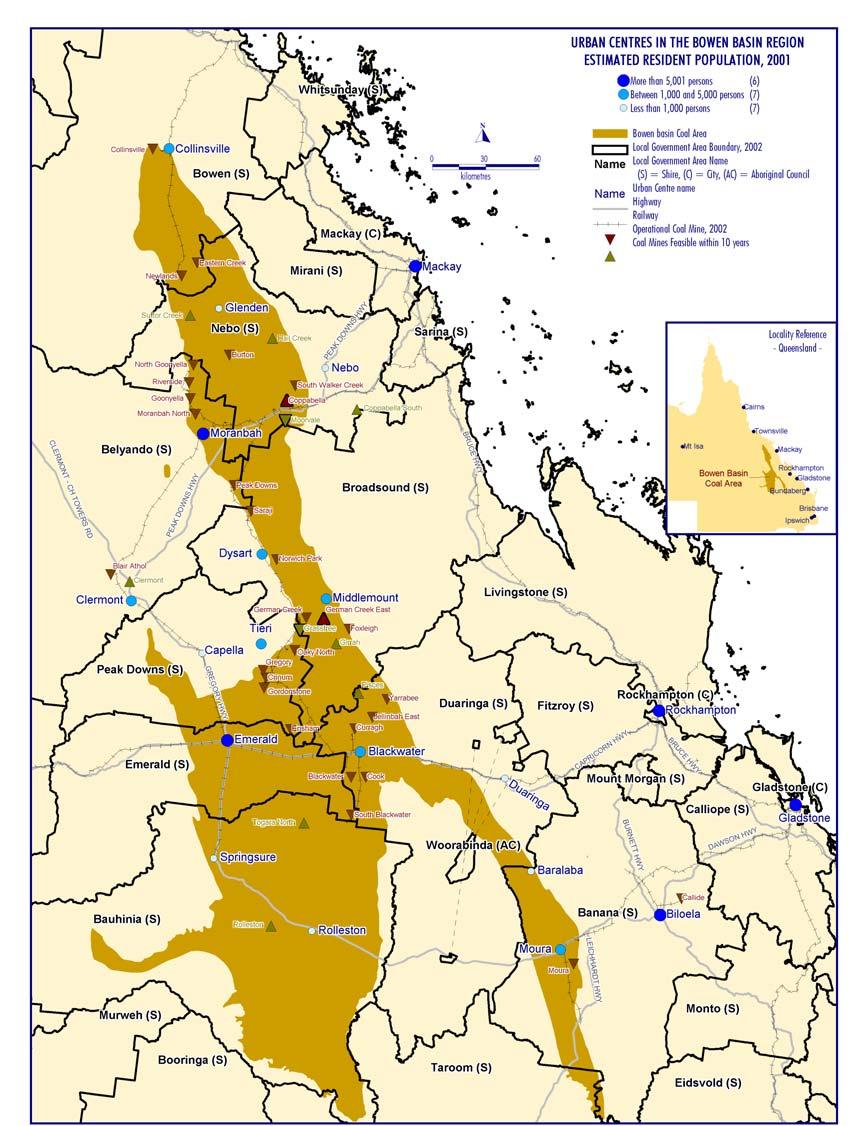
1 Central Highlands Regional Population Forum, Emerald, 18 February 25 Central Highlands Regional Population Forum Presenters: Alison Taylor and Ross Barker Planning Information and Forecasting Unit Department of Local Government and Planning
2 The Program 9.3 Welcome Cr Peter Maguire 9.4 Current population trends Alison Taylor» Introduction» Current & past patterns of growth 1.3 Morning tea 11. Population concepts workshop Ross Barker» Understanding population terms» Discussion 12. Lunch 1. Population projections» Current projections (Alison Taylor)» Belyando case study (Ross Barker) 2.3 Afternoon tea 3. Action planning in groups 4.3 Thanks Cr Tim Stevenson
3
4 Current patterns of growth Population trends last 2 years Local government areas Urban centres and localities Indicators of current growth School enrolments Mining industry workers estimates Socio-economic characteristics Age structure Broad characteristics Journey to work patterns
5 Bowen Basin population change 14, 12, 1, 8, 6, 4, 2, -2, -4, -6, -8, 12,629 1,742 3,259 2, Peak Downs (S) Nebo(S) Emerald (S) Duaringa(S) Broadsound (S) Bowen(S) Belyando (S) Banana(S) Bauhinia(S)
6 More recent population estimates Peak Downs (S) Nebo(S) Emerald (S) Duaringa(S) Broadsound (S) Bowen(S) Belyando (S) Bauhinia(S) Banana(S) (p) Source: ABS, Cat No 3218.
7 Average annual pop change Banana(S) Bauhinia(S) Belyando (S) Bowen(S) Broadsound (S) Duaringa(S) Emerald (S) Nebo(S) Peak Downs (S) Total Bowen Basin LGAs 2, Source: ABS, Cat No 3218.
8 Recent average annual pop change Banana(S) Bauhinia(S) Belyando (S) Bowen(S) Broadsound (S) Duaringa(S) Emerald (S) Nebo(S) Peak Downs (S) Woorabinda AC na 1 Total Bowen Basin LGAs Source: ABS, Cat No 3218.
9 Towns that grew from very little 3, 2,5 2, 1,5 1, Glenden Middlemount Nebo Tieri Source: ABS, Census of Population & Housing
10 Towns that declined , 7, 6, 5, 4, 3, 2, 1, Blackwater Collinsville Dysart Moura Springsure Theodore Source: ABS, Census of Population & Housing
11 Towns that grew , 1, 8, 6, 4, 2, Biloela Capella Clermont Emerald Moranbah Source: ABS, Census of Population & Housing
12 Population estimates for urban centres and localities UCL 1,996 2,1 2,3 change 1-3 Biloela 5,269 5,714 5, Blackwater 6,34 4,838 4, Capella (L) Clermont 2,376 1,994 2,99 15 Collinsville 2,76 2,45 2,87 42 Dysart 3,635 2,598 2, Emerald 9,282 9,793 1, Glenden (L) 1, Middlemount 2,223 2,115 2,2-95 Moranbah 6,757 6,281 6, Moura 1,999 1,933 1, Nebo (L) Springsure (L) Theodore (L) Tieri 1,615 1,66 1,61 4 Total 44,575 41,969 42,35 336
13 Locality population change Biloela Blackwater Capella (L) Clermont Collinsville Dysart Emerald Middlemount Moranbah Moura Nebo (L) Springsure (L)
14 Population change between , Bowen Basin Localities Population Change -8-1, -1,2 Age
15 Graph 2: Changing age structure 3 2 Males Females Bowen Basin Localities Graph 3: Changing age structure, Queensland 15 1 Males 5 Queensland Females
16 Primary school enrolments - one indicator of recent change 1,4 1,2 1, Banana(S) Bauhinia(S) Belyando (S) Bowen(S) Broadsound (S) Duaringa(S) Emerald (S) Nebo(S) Peak Downs (S) Source: QED
17 Secondary school enrolments - one indicator of recent change 1, , Banana(S) Bauhinia(S) Belyando (S) Bowen(S) Broadsound (S) Duaringa(S) Emerald (S) Nebo(S) Peak Downs (S) Source: QED
18 Mining industry workers by location on Census night Banana (S) 1,173 1,26 1,51 1,5 657 Bauhinia (S) Belyando (S) 1, Bow en (S) Broadsound (S) 1,16 1,722 1,724 1,652 1,17 Duaringa (S) 1,28 1,779 1,591 1,468 1,32 Emerald (S) , Nebo (S) Peak Dow ns (S) Bow en Basin LGAs 6,4 8,873 8,626 8,864 6,538 Source: ABS, Census of Population & Housing
19 Mining industry workers by location on Census night 1, 9, 8, 7, 6, 5, 4, 3, 2, 1, Peak Downs (S) Nebo (S) Emerald (S) Duaringa (S) Broadsound (S) Bowen (S) Belyando (S) Bauhinia (S) Banana (S) Source: ABS, Census of Population & Housing
20 Changing coal industry employment, Bowen Basin Northern & Central Districts 12, 1, 8, 6, 4, 2, As at January Northern Opencut Central Opencut Northern Underground Central Underground
21 Coal industry employment estimates Northern District 5, 4,5 4, 3,5 3, 2,5 2, 1,5 1, Northern Opencut Northern Underground
22 Coal industry employment estimates Central District 6, 5, 4, 3, 2, 1, Central Opencut Central Underground
23 Socio-economic characteristics of Bowen Basin communities Housing Lots of private rental Many in non-private dwellings Comparatively well-off More clerical, sales & service jobs, plus professionals & managers Growth in services & trade industries 4% of Queensland s mining jobs, but are they residents?
24 Tenure type 21 Fully owned 2% Being purchased 1% Housing Authority 1% Other rented 32% Other 13% Being purchased 16% Fully owned 36% Other 9% Other rented 87% Housing Authority 3% Bowen Basin Localities Middlemount
25 Persons in non-private dwellings 21 Accomm. for etired or aged 8% Bowen Basin Localities Other 18% Hotel/motel 32% Nursing home % Board school/college /hall of res 2% Accomm. for retired or aged Public/private/ % psych hospital % Middlemoun Other 4% Hotel/motel 4% ursing home 2% Public/private/ psych hospital 9% Board school/college /hall of res 6% Nurse/staff quarters 25% Nurse/staff quarters 9%
26 Distribution of weekly individual income, Bowen Basin Localities, % 14. % 12. % 1. % 8. % 6. % Negative/nil income $1-$39 $4-$79 $8-$119 $12-$159 $16-$199 $2-$299 $3-$399 $4-$499 $5-$599 $6-$699 $7-$799 $8-$999 $1-$1499 $15 or more 4. % 2. %. % Bowen Basin Queensland Source: ABS, Census of Population & Housing Per cent
27 Change in occupation , Bowen Basin Localities Labourers & related Elementary clerical, sales & service Intermediate production & transport Intermediate clerical, sales & service Advanced clerical & service Tradespersons & related Associate professionals Professionals Managers & administrators -2% -15% -1% -5% % 5% % Change 1996 to 21 Source: ABS, Census of Population & Housing
28 Change in industry , Bowen Basin Localities Personal and other services Cultural and recreational services Health and community services Education Government admininstration and defence Property and business services Finance and insurance Communication services Transport and storage Accommodation, cafes and restaurants Retail trade Wholesale trade Construction Electricity, gas and water supply Manufacturing Mining Agriculture, forestry and fishing -3% -2% -1% % 1% 2% 3% 4% % Change 1996 to 21
29 Journey to work analysis In an area there are: A number of jobs occupied by workers who are either residents or from outside the area A number of workers who either work In the area or Outside the area
30 Journey to work patterns, 21 Total jobs Employed Residents Work in another LGA No. % Banana (S) Bauhinia (S) Belyando (S) Bowen (S) Broadsound (S) 6,611 1,219 4,673 5,233 3,295 6,479 1,173 4,48 4,862 2, Duaringa (S) 3,862 3, Emerald (S) 6,71 6, Nebo (S) 1, Peak Downs (S) 1,59 1, Bowen Basin 34,836 31,538
31 Where residents worked, 21 7, 8% 8% 6, 5, 7% 11% 4, 18% 13% 3, 2, 17% 17% 19% 1, Number of employed people Banana (S) Bauhinia (S) Belyando (S) Bowen (S) Broadsound (S) Duaringa (S) Emerald (S) Nebo (S) Peak Downs (S) % reflects share of residents who work outside home LGA Work locally Work elsewhere
32 Jobs held by non-resident workers, 21 Total jobs Employed Residents Jobs held by non-residents No. % Banana (S) 6,611 6, Bauhinia (S) 1,219 1, Belyando (S) Bowen (S) 4,673 5,233 4,48 4, Broadsound (S) 3,295 2, Duaringa (S) 3,862 3,18 1, Emerald (S) 6,71 6,149 1, Nebo (S) 1, Peak Downs (S) 1,59 1, Bowen Basin 34,836 31,538
33 Where workers live, 21 8, 7, 12% 18% 6, 15% 18% 5, 31% 4, 28% 3, 55% 2, 22% 1, Number of jobs Banana (S) Bauhinia (S) Belyando (S) Bowen (S) Broadsound (S) Duaringa (S) Emerald (S) Nebo (S) Peak Downs (S) % reflects share of local jobs held by non residents Live in LGA Live outside NFA 31%
34 Jobs in the mining industry, LGAs in Queensland had more than 1 jobs in mining LGA Top 2 LGAs each had more than 2 jobs in mining Brisbane (C) 8 of top 2 LGAs in Mt Isa (C) Bowen Basin Belyando (S) Total of 17,368 jobs in mining in Queensland 4% of mining jobs in Duaringa (S) Bowen Basin Broadsound (S) Source: ABS, 21 Census, Customised matrix No. o jobs 2,2 2,14 1,56 1,21 1,
35 1,8 1,6 1,4 1,2 1, Jobs in the mining industry in Bowen Basin LGAs, 9% 21 7% 5.8% 4.5% 4.2% 3.8% 3.5% 2% Belyando (S) Broadsound (S) Duaringa (S) Emerald (S) Nebo (S) Banana (S) Peak Downs (S) Bowen (S) Bauhinia (S) % reflects share of total mining industry jobs in Queensland
36 Emerald (S) journey to work patterns, 21 6,71 jobs in Shire, 6,149 employed residents 8% of employed residents worked outside the Shire (53 people) NFA-128, Peak Downs-112, Bauhinia-93, Duaringa-88, ---Brisbane-22, Mackay-13 18% of jobs filled by non-residents (1,183 people) Duaringa-149, Thuringowa-141 (Townsville- 98), Peak Downs-133, Bauhinia-8 Cooloola-55, Rocky-5, Livingstone-49, Brisbane-22
37 Nebo & Emerald different functions 6, 5, 4, Local Jobs Nebo (S) imports workers from nearby Mackay (C) 3, Local Workers 2, 1, Nebo (S) Emerald (S) 6, 5, 4, Residents Non-residents 3, 2, Emerald (S) is a service and accommodation centre 1, Nebo (S) In LGA Outside Emerald (S)
38 Nebo (S) industry structure, 21 Manufacturing Elect, Gas & Water Supply Construction Wholesale Trade Retail Trade Accomm, Cafes & Rest Transport & Storage Communication Services Finance & Insurance Prop & Business Services Govt Admin & Defence Education Health & Comm Services Cultural & Rec Services Personal & Other Services Ag, Forestry & Fishing M ining Number of jobs
39 Emerald (S) industry structure, 21 Ag, Forestry & Fishing Mining Manufacturing Elect, Gas & Water Supply Construction Wholesale Trade Retail Trade Accomm, Cafes & Rest Transport & Storage Communication Services Finance & Insurance Prop & Business Services Govt Admin & Defence Education Health & Comm Services Cultural & Rec Services Personal & Other Services Number of jobs
Population growth highlights and trends. the Wide Bay - Burnett Region 2005
 Population growth highlights and trends the Wide Bay - Burnett Region 2005 Minister s Message Welcome to the 2005 edition of Population growth highlights and trends, Wide Bay Burnett Region. This report
What will Mackay be like in 5 years time?
 What will Mackay be like in 5 years time? Information booklet Presentation to Mackay Region Chamber of Commerce by Dr Kim Houghton Director Strategic Economic Solutions 4 September 2013 Strategic Economic
DUNOON PROFILE May 2014
 www.hie.co.uk DUNOON PROFILE May 2014 DUNOON PROFILE INTRODUCTION The Dunoon profile uses 2011 Census data and other available data sources to present an up-to-date analysis of its population and labour
Galleries and Visual Arts Venues
 Appendix 13: 2006 Statistics Attendances at Qld Public Galleries and Visual Arts Venues Venue Artspace Mackay 40,841 - - Australian Catholic University (Brisbane) Australian Stockmans Hall of Fame (Longreach)
The Yorke & Mid North (State Govt) Region. Workforce Wizard Region Report
 Region. Workforce Wizard Region Report") The Yorke & Mid North (State Govt) Region Workforce Wizard Region Report Table of Contents Executive Summary 3 Population and Social Characteristics 4 Current Population 4 Age Groups 4 Key Populations
The Yorke & Mid North (State Govt) Region Workforce Wizard Region Report Table of Contents Executive Summary 3 Population and Social Characteristics 4 Current Population 4 Age Groups 4 Key Populations
ABC TV, AM, FM Digital Radio Frequencies QLD Classic FM Digital TV Local Radio NewsRadio Radio National triple j Digital Radio 49* *
 Agnes Water - 49* 855 - - - - Airlie Beach 95.5 39/30* 630/89.9 93.9 93.1 - - Alpha - 7 540/105.7-107.3 - - Anakie (90.7) (11)/41* 1548 89.1 (93.9) - - Aramac - 8 540-107.9 - - Atherton 105.9 8/47 630/720/106.7
Queensland Economic Update
 Queensland Economic Update Chamber of Commerce & Industry March 2018 cciq.com.au Queensland Economic Update: Summary National Accounts GDP expanded 2.3% during calendar year 2017. QLD state final demand
ISRAEL- COUNTRY FACTS
 ISRAEL- COUNTRY FACTS ISRAEL-NEIGHBOURING COUNTRIES AND POLITICAL MAP Area: 22,072 sq. km Land area: 21,643 sq. km. Fast Facts Area of lakes: 429 sq. km. (Sea of Galilee 164 sq. km., the Dead Sea - 265
East Lothian. Skills Assessment January SDS-1154-Jan16
 East Lothian Skills Assessment January 2016 SDS-1154-Jan16 Acknowledgement The Regional Skills Assessment Steering Group (Skills Development Scotland, Scottish Enterprise, the Scottish Funding Council
Arrow Bowen Pipeline ECONOMIC ASSESSMENT. Rev 0 11 November 2011
 Arrow Bowen Pipeline ECONOMIC ASSESSMENT Rev 0 11 November 2011 Arrow Bowen Pipeline ECONOMIC ASSESSMENT Rev 0 11 November 2011 Sinclair Knight Merz ABN 37 001 024 095 Cnr of Cordelia and Russell Street
Monthly Fuel Price Report April 2016
 Cost in cents per litre Monthly Fuel Price Report April 16 5 May 16 The RACQ monthly fuel price report presents a summary of the fuel price trends in Queensland for April 16. Key points At 117.1 cpl, ULP
Contents Manningham at a Glance... 6 Location and Area... 6 Manningham Activity Centres... 6 Manningham Suburbs... 6 Population... 8 Forecast... 9 For
 Contents Manningham at a Glance... 6 Location and Area... 6 Manningham Activity Centres... 6 Manningham Suburbs... 6 Population... 8 Forecast... 9 Forecast 2011 2036... 9 Population Forecast... 9 Gross
North Lanarkshire. Skills Assessment January SDS-1163-Jan16
 North Lanarkshire Skills Assessment January 2016 SDS-1163-Jan16 Acknowledgement The Regional Skills Assessment Steering Group (Skills Development Scotland, Scottish Enterprise, the Scottish Funding Council
MINING IN TASMANIA: DINOSAUR OR DELIVERER?
 MINING IN TASMANIA: DINOSAUR OR DELIVERER? PRESENTATION TO A FORUM HOSTED BY THE ACADEMY OF TECHNOLOGICAL SCIENCES AND ENGINEERING (ATSE) FOR NATIONAL SCIENCE WEEK RACV APARTMENT HOTEL, HOBART 3 RD AUGUST
Economic Impact of Tourism in South Dakota, December 2018
 Economic Impact of Tourism in South Dakota, 2018 December 2018 1) Key Findings Growth rebounds in 2018 as a strong hunting season drives tourism growth Key facts about South Dakota s tourism sector Key
PORTREE PROFILE May 2014
 www.hie.co.uk PORTREE PROFILE May 2014 PORTREE PROFILE INTRODUCTION The Portree profile uses 2011 Census data and other available data sources to present an up-to-date analysis of its population and labour
Demographic Profile 2013 census
 Demographic Profile 2013 census This profile provides basic population and demographic information on the residents of the Hauraki District. Population and demographic information is important for targeting
TOWNSVILLE NORTH QUEENSLAND QUARTERLY ECONOMIC SNAPSHOT
 TOWNSVILLE NORTH QUEENSLAND QUARTERLY ECONOMIC SNAPSHOT MAY 2017 TOWNSVILLE NORTH QUEENSLAND QUARTERLY ECONOMIC SNAPSHOT MAY 2017 The Townsville North Queensland Economic Snapshot provides a regional economic
PROPERTY. Property Sales Number of Sales per Quarter. Property Prices Median Sale Price (Log Scale) 1,600 House Sales. Houses.
 1,600 House Sales. Houses.") Property Number of per Quarter Property Prices Median Sale Price (Log Scale) 1,6 House Unit Land Total (Trend) $45, Houses 1,2 $32, 8 $23, Units 4 $165, Vacant Land Mar-8 Mar-9 Mar-1 Mar-11 Mar-12 Mar-13
Property Number of per Quarter Property Prices Median Sale Price (Log Scale) 1,6 House Unit Land Total (Trend) $45, Houses 1,2 $32, 8 $23, Units 4 $165, Vacant Land Mar-8 Mar-9 Mar-1 Mar-11 Mar-12 Mar-13
SHETLAND AREA PROFILE
 www.hie.co.uk SHETLAND AREA PROFILE May 2014 SHETLAND AREA PROFILE INTRODUCTION The Shetland area profile uses 2011 Census data and other available data sources to present an up-to-date analysis of its
Figure 1.1 St. John s Location. 2.0 Overview/Structure
 St. John s Region 1.0 Introduction Newfoundland and Labrador s most dominant service centre, St. John s (population = 100,645) is also the province s capital and largest community (Government of Newfoundland
CAMPBELTOWN PROFILE May 2014
 www.hie.co.uk CAMPBELTOWN PROFILE May 2014 CAMPBELTOWN PROFILE INTRODUCTION The Campbeltown profile uses 2011 Census data and other available data sources to present an up-to-date analysis of its population
Monthly Fuel Price Report May 2016
 Cost in cents per litre Monthly Fuel Price Report May 16 3 June 16 The RACQ monthly fuel price report presents a summary of the fuel price trends in Queensland for May 16. Key points At 118.9 cpl, ULP
Monthly Fuel Price Report July 2016
 Cost in cents per litre Monthly Fuel Price Report July 16 3 August 16 The RACQ monthly fuel price report presents a summary of the fuel price trends in Queensland for July 16. Key points At 115.4 cpl,
Monthly Fuel Price Report April 2013
 Monthly Fuel Price Report April 2013 6 May 2013 The RACQ monthly fuel price report presents a summary of the fuel price trends in Queensland for April 2013. Key points Prices of ULP and diesel fell in
Monthly Fuel Price Report March 2016
 Cost in cents per litre Monthly Fuel Price Report March 16 5 April 16 The RACQ monthly fuel price report presents a summary of the fuel price trends in Queensland for March 16. Key points The average price
Number 1 Gross Regional Product per capita in Queensland
 Number 1 Gross Regional Product per capita in Queensland Whitsunday Region is the nation building region of Australia providing over $22 billion of economic value to the Australian economy. Our region
Inland Queensland. Roads Action Plan. Driving Productivity in Australia s Transport Network. Overview. 27 January 2016
 Inland Queensland Roads Action Plan Driving Productivity in Australia s Transport Network Overview 27 January 2016 A collaborative approach The Inland Queensland Roads Action Plan (IQ-RAP) has been developed
ASCOT SUBURB PROFILE
 ASCOT SUBURB PROFILE CONTENTS SUBURB HIGHLIGHTS 2 3 4 4 5 5 ASCOT & SURROUNDS LOCATION & LIFESTYLE DEMOGRAPHICS EMPLOYMENT FUTURE INFRASTRUCTURE WA MARKET TRENDS ACCESSIBILITY ENTERTAINMENT & RECREATION
Monthly Fuel Price Report September 2016
 Cost in cents per litre Monthly Fuel Price Report September 16 6 October 16 The RACQ monthly fuel price report presents a summary of the fuel price trends in Queensland for September 16. 1 Key points At
Monthly Fuel Price Report May June 2018
 Cost in cents per litre Monthly Fuel Price Report May 218 6 June 218 The RACQ monthly fuel price report presents a summary of the fuel price trends in Queensland for May 218. Key points The average price
Monthly Fuel Price Report June 2016
 Cost in cents per litre Monthly Fuel Price Report June 16 5 July 16 The RACQ monthly fuel price report presents a summary of the fuel price trends in Queensland for June 16. Key points At 126.6 cpl, ULP
Monthly Fuel Price Report March April 2018
 Cost in cents per litre Monthly Fuel Price Report March 18 5 April 18 The RACQ monthly fuel price report presents a summary of the fuel price trends in Queensland for March 18. Key points Cairns was the
The RV Travellers. Coming ready or not!
 The RV Travellers Coming ready or not! About the research Focused on travellers using free rest areas Also covers CMCA members Desktop research Standard market research accuracy Based on random sampling
The Economic Impact of Tourism in North Carolina. Tourism Satellite Account Calendar Year 2015
 The Economic Impact of Tourism in North Carolina Tourism Satellite Account Calendar Year 2015 Key results 2 Total tourism demand tallied $28.3 billion in 2015, expanding 3.6%. This marks another new high
Monthly Fuel Price Report August 2016
 Cost in cents per litre Monthly Fuel Price Report August 16 6 September 16 The RACQ monthly fuel price report presents a summary of the fuel price trends in Queensland for August 16. Key points At 18.2
Industry and occupation of population in Montenegro
 MONTENEGRO STATISTICAL OFFICE R E L A S E 197 No Podgorica, 20 July 2012 Name the source when using the data Industry and occupation of population in Montenegro Census of Population, Households, and Dwellings
the importance of mining to Cairns Address to the Cairns & mining conference By w s (bill) cummings 12 june 2013
 cummings 12 june 2013") 1 Cummings economics 38 grafton st (po box 2148) cairns q 4870 abn 99 734 489 175 Tel 07 4031 2888 fax 07 4031 1108 Email: cummings@cummings.net.au Website: www.cummings.net.au Ref: j2630 Ppt 1: the importance
1 Cummings economics 38 grafton st (po box 2148) cairns q 4870 abn 99 734 489 175 Tel 07 4031 2888 fax 07 4031 1108 Email: cummings@cummings.net.au Website: www.cummings.net.au Ref: j2630 Ppt 1: the importance
Southern Cross University Tim Sutton Don Fuller Simon J. Wilde Southern Cross University Stephen Mason Southern Cross University
 Southern Cross University epublications@scu Southern Cross Business School 2005 The value of the Coffs Harbour Education Campus to the Coffs Coast regional economy: a regional input-output analysis: report
The Economic Base of Colfax County, NM. PREPARED BY: The Office of Policy Analysis at Arrowhead Center, New Mexico State University.
 The Economic Base of Colfax County, NM PREPARED BY: The Office of Policy Analysis at Arrowhead Center, New Mexico State University DATE: July 2016 The Economic Base of Colfax County, New Mexico Introduction
The Economic Impact of Tourism in The Appalachian Region of Ohio. June 2014
 The Economic Impact of Tourism in The Appalachian Region of Ohio June 2014 Appalachia Region Tourism Summary Total Tourism Impact Appalachian Region Sales Wages Taxes Employment $4.9 billion $1.2 billion
Business Register and Employment Survey 2016 Update Final March 2016
 Business Register and Employment Survey 2016 Update Final March 2016 Jamie.watson@coast2capital.org.uk EXECUTIVE SUMMARY The Business Register and Employment Survey (BRES) update has shown that the Coast
The Economic Impact of Tourism in The Appalachian Region of Ohio. June 2016
 The Economic Impact of Tourism in The Appalachian Region of Ohio June 2016 Appalachian Region tourism summary Total Tourism Impact Appalachian Region, Ohio Sales Wages Taxes Employment $5.3 billion $1.3
STRATEGIC CORRIDORS/ SUPPLY CHAINS & CRITICAL CONNECTORS IDENTIFIED IN THE INLAND QUEENSLAND ROAD NETWORK STRATEGY
 STRATEGIC CORRIDORS/ SUPPLY CHAINS & CRITICAL CONNECTORS IDENTIFIED IN THE INLAND QUEENSLAND ROAD NETWORK STRATEGY The Inland Queensland s Action Project (IQ-RAP) Working Group 28 June, 2018 THE INLAND
Monthly Fuel Price Report August 2015
 Monthly Fuel Price Report August 2015 3 September 2015 The RACQ monthly fuel price report presents a summary of the fuel price trends in Queensland for August 2015. Key points ULP sold in Brisbane was
Monthly Fuel Price Report February March 2018
 Cost in cents per litre Monthly Fuel Price Report February 18 5 March 18 The RACQ monthly fuel price report presents a summary of the fuel price trends in Queensland for February 18. Key points The average
Monthly Fuel Price Report December January 2018
 Cost in cents per litre Monthly Fuel Price Report December 17 3 January 18 The RACQ monthly fuel price report presents a summary of the fuel price trends in Queensland for December 17. Key points The average
Monthly Fuel Price Report October November 2017
 Cost in cents per litre Monthly Fuel Price Report October 17 3 November 17 The RACQ monthly fuel price report presents a summary of the fuel price trends in Queensland for October 17. Key points The average
Moranbah Overview 4 Population Growth 6. What will drive population growth going forward? 7. Economic Development 8
 MORANBAH CONTENTS Moranbah Overview 4 Population Growth 6 What will drive population growth going forward? 7 Economic Development 8 Underpinned by 11 mines the most of any mining town 8 Major existing
The Economic Impact of Tourism in North Carolina. Tourism Satellite Account Calendar Year 2013
 The Economic Impact of Tourism in North Carolina Tourism Satellite Account Calendar Year 2013 Key results 2 Total tourism demand tallied $26 billion in 2013, expanding 3.9%. This marks another new high
OUTLOOK REDBANK PLAINS A CONTEXT ON BUSINESS, CULTURE, LIFESTYLE AND RESIDENTIAL
 OUTLOOK REDBANK PLAINS A CONTEXT ON BUSINESS, CULTURE, LIFESTYLE AND RESIDENTIAL Located within seven minutes of the Springfield CBD and 30 minutes of the Brisbane CBD, Redbank Plains proximity to major
Why Invest in Australia?
 Great Barrier Reef Northern Territory Queensland Western Australia South Australia Gold Coast New South Wales Victoria Australian Capital Territory Tasmania Australia is the biggest island in the world;
Queensland Economic Update. Are there more pots of gold ahead?
 Queensland Economic Update Are there more pots of gold ahead? Katie Dean Economist ANZ Bank 4 November 24 Australian economic growth has been strong and Queensland has been a star performer Economic growth
The Economic Impact of Tourism in Buncombe County, North Carolina
 The Economic Impact of Tourism in Buncombe County, North Carolina 2017 Analysis September 2018 Introduction and definitions This study measures the economic impact of tourism in Buncombe County, North
Tourism Satellite Account Calendar Year 2010
 The Economic Impact of Tourism in Georgia Tourism Satellite Account Calendar Year 2010 Highlights The Georgia visitor economy rebounded in 2010, recovering 98% of the losses experienced during the recession
Manawatu District Economic Profile
 Manawatu District Economic Profile Our community Population has grown by 1,000 residents since 2014 to reach 29,800. Population is 86.4% European, with Maori 14.3% of the population. This compares with
Monthly Fuel Price Report November 2016
 Cost in cents per litre Monthly Fuel Price Report November 216 5 December 216 The RACQ monthly fuel price report presents a summary of the fuel price trends in Queensland for November 216. Key points At
Monthly Fuel Price Report February 2015
 Monthly Fuel Price Report February 2015 4 March 2015 The RACQ monthly fuel price report presents a summary of the fuel price trends in Queensland for February 2015. Key points The average price of ULP
The Economic Impact of Tourism in Maryland. Tourism Satellite Account Calendar Year 2016
 The Economic Impact of Tourism in Maryland Tourism Satellite Account Calendar Year 2016 County Results Washington County, Visitors Washington County Visitors (thousands) Year Overnight Day Total Growth
QCOSS Regional Homelessness Profile Mackay Statistical Division
 QCOSS Regional Homelessness Profile Mackay Statistical Division March 2011 Council of Social Service Inc (QCOSS) March 2011 QCOSS would like to thank the Department of Communities for providing data from
Monthly Fuel Price Report June 2015
 Monthly Fuel Price Report June 15 2 July 15 The RACQ monthly fuel price report presents a summary of the fuel price trends in Queensland for June 15. Key points ULP sold in Brisbane was more expensive
URBAN DYNAMICS WESTERN CAPE 67
 URBAN DYNAMICS WESTERN CAPE 67 5. SOCIO-ECONOMIC CONTEXT 5.1 Demographic Profile 5.1.1 Introduction The demographic information contained in the synopsis is derived from the supposedly inaccurate 2001
Regional Roadmap Executive Summary. Mackay-Isaac-Whitsunday
 Regional Roadmap Executive Summary Mackay-Isaac-Whitsunday 2013-2016 The region generates over $22b worth of economic value (2011-12) to the Queensland and Australian economy. (Queensland Treasury and
Economic Impact Analysis. Tourism on Tasmania s King Island
 Economic Impact Analysis Tourism on Tasmania s King Island i Economic Impact Analysis Tourism on Tasmania s King Island This project has been conducted by REMPLAN Project Team Matthew Nichol Principal
Monthly Fuel Price Report November December 2017
 Cost in cents per litre Monthly Fuel Price Report November 217 5 December 217 The RACQ monthly fuel price report presents a summary of the fuel price trends in Queensland for November 217. Key points The
DINGWALL PROFILE May 2014
 www.hie.co.uk DINGWALL PROFILE May 2014 DINGWALL PROFILE INTRODUCTION The Dingwall profile uses 2011 Census data and other available data sources to present an up-to-date analysis of its population and
Capricorn Coast and Rockhampton Region Economic Snapshot March 2018
 The Capricorn Enterprise Quarterly Economic Snapshot for the Capricorn Coast and Rockhampton Region provides a regional economic outlook with key quarterly statistics including unemployment, property sales,
HEALTH SECTOR ECONOMIC INDICATORS REPORT
 HEALTH SECTOR ECONOMIC INDICATORS REPORT For: Mid North Coast Local Health District Report prepared by: April 2013 Table of Contents Introduction 3 Executive Summary 4 Output 5 Value-Added 7 Workforce
172,650 persons (2016 est. resident population)
") 1 Regional Overview Population: 172,650 persons (2016 est. resident population) Growth Rate: 3.74% (2011 2016) 0.51% average annual growth Key Industries: Retail, Health Care and Social Assistance, Construction,
1 Regional Overview Population: 172,650 persons (2016 est. resident population) Growth Rate: 3.74% (2011 2016) 0.51% average annual growth Key Industries: Retail, Health Care and Social Assistance, Construction,
TOWNSVILLE NORTH QUEENSLAND QUARTERLY ECONOMIC SNAPSHOT
 TOWNSVILLE NORTH QUEENSLAND QUARTERLY ECONOMIC SNAPSHOT SEPTEMBER 2017 TOWNSVILLE NORTH QUEENSLAND QUARTERLY ECONOMIC SNAPSHOT SEPTEMBER 2017 The Townsville North Queensland Economic Snapshot provides
North Carolina (Statewide) 2016 Prosperity Zone Data Books
 2016 Prosperity Zone Data Books") North Carolina (Statewide) 2016 Prosperity Zone Data Books 2 North Carolina Prosperity Zones Western North Carolina Prosperity Zones Northwest Region Piedmont-Triad Region Western Region Southwest Region
North Carolina (Statewide) 2016 Prosperity Zone Data Books 2 North Carolina Prosperity Zones Western North Carolina Prosperity Zones Northwest Region Piedmont-Triad Region Western Region Southwest Region
An Update on Coal for the Bowen Basin
 An Update on Coal for the Bowen Basin Presented by Celeste Cronin-Stacey Regional Geologist Department of Natural Resources and Mines 26 September 2013 Photo courtesy of AngloAmerican Coal Disclaimer Based
Benefits and costs of tourism for remote communities
 Benefits and costs of tourism for remote communities Case study for the Carpentaria Shire in north-west Queensland Chapter 2 1 THE CARPENTARIA SHIRE COMMUNITY AND TOURISM... 2 Plate 5: Matilda Highway
THE 2006 ECONOMIC IMPACT OF TRAVEL & TOURISM IN INDIANA
 THE 2006 ECONOMIC IMPACT OF TRAVEL & TOURISM IN INDIANA A Comprehensive Analysis Prepared by: In Partnership with: PREPARED FOR: Carrie Lambert Marketing Director Indiana Office of Tourism Development
Moderator: Greg Guatto, President & CEO, Aspen Properties
 Session C2 2:10pm ONE SIZE DOES NOT FIT ALL: UNDERSTANDING THE FACTS & FALLACIES BETWEEN EDMONTON & CALGARY AND HOW THEY ARE PERFORMING IN TODAY S ECONOMY Moderator: Greg Guatto, President & CEO, Aspen
Know your market and build your business. How understanding target markets and local demographic/economic information can help local business
 Know your market and build your business How understanding target markets and local demographic/economic information can help local business March 24, 2015 About informed decisions.id stands for informed
Monthly Fuel Price Report August September 2017
 Cost in cents per litre Monthly Fuel Price Report August 217 5 September 217 The RACQ monthly fuel price report presents a summary of the fuel price trends in Queensland for August 217. Key points At 125.6
STRATEGIC CORRIDORS & CONNECTORS IDENTIFIED IN THE INLAND QUEENSLAND ROAD NETWORK STRATEGY (IQRNS) August, 2018
 August, 2018") STRATEGIC CORRIDORS & CONNECTORS IDENTIFIED IN THE INLAND QUEENSLAND ROAD NETWORK STRATEGY () 15-16 August, 2018 THIS DOCUMENT HAS BEEN PREPARED BY THE IQ-RAP WORKING GROUP ON BEHALF OF ALL 28 LOCAL GOVERNMENTS,
STRATEGIC CORRIDORS & CONNECTORS IDENTIFIED IN THE INLAND QUEENSLAND ROAD NETWORK STRATEGY () 15-16 August, 2018 THIS DOCUMENT HAS BEEN PREPARED BY THE IQ-RAP WORKING GROUP ON BEHALF OF ALL 28 LOCAL GOVERNMENTS,
Economic Report. Tasmania December Savills Research. Tasmania - Key Economic Indicators. Highlights
 Savills Research Economic Report Tasmania December 2018 Highlights Tasmania s economic growth for the current annual period has been notably above trend, with the strongest growth rate, on GSP numbers,
Monthly Fuel Price Report July 2017
 Cost in cents per litre Monthly Fuel Price Report July 17 3 August 17 The RACQ monthly fuel price report presents a summary of the fuel price trends in Queensland for July 17. Key points At.8 cpl, the
OUTLOOK EAST LEPPINGTON
 OUTLOOK EAST LEPPINGTON A CONTEXT ON BUSINESS, CULTURE, LIFESTYLE AND RESIDENTIAL Located within the rapidly expanding South West Growth Centre of Sydney, the East Leppington Precinct is well positioned
The Outlook for the Residential Construction Industry Hunter and the Central Coast
 The Outlook for the Residential Construction Industry Hunter and the Central Coast Graham Wolfe HIA Chief Executive Industry Policy and Media HIA Industry Outlook Breakfast Newcastle February 2013 Backdrop:
The Economic Impact of Tourism on Galveston Island, Texas
 The Economic Impact of Tourism on Galveston Island, Texas 2017 Analysis Prepared for: Headline Results Headline results Tourism is an integral part of the Galveston Island economy and continues to be a
Regional planning in Queensland
 Regional planning in Queensland Overview Regional plans are long-term strategic plans that support local growth and development while also protecting a region s natural resources. Regional plans help the
Introduction on the Tourism Satellite Account
 Mr. Peter Laimer Directorate Spatial Statistics UNWTO/DG GROW TSA-Workshop Agenda Item 2 Introduction on the Tourism Satellite Account Framework, tables and benefits Brussels, 29/30 November 2017 www.statistik.at
The Economic Impact of Travel in Kansas. Tourism Satellite Account Calendar Year 2013
 The Economic Impact of Travel in Kansas Tourism Satellite Account Calendar Year 2013 Who we are Tourism Economics Union of industry expertise and economic disciplines Real world insights based on quantitative
The Economic Impact of Travel in Minnesota Analysis
 The Economic Impact of Travel in Minnesota 2013 Analysis Overview 2013 Highlights Traveler Spending Traveler spending of $10.3 billion generated $17.6 billion in total business sales in 2013 as travel
The Economic Impact of Tourism in Maryland. Tourism Satellite Account Calendar Year 2015
 The Economic Impact of Tourism in Maryland Tourism Satellite Account Calendar Year 2015 MD tourism economy reaches new peaks The Maryland visitor economy continued to grow in 2015; tourism industry sales
Western Regional Roads Forum
 Western Regional Roads Forum Driving our Region Forward Regional Development Australia Committees with a footprint across regional road networks outside South East Queensland and west of the Bruce Highway
NUNAVIK'S LABOUR MARKET AND EDUCATIONAL ATTAINMENT PARADOX
 NUNAVIK'S LABOUR MARKET AND EDUCATIONAL ATTAINMENT PARADOX Andrew Sharpe and Jasmin Thomas Presentation prepared for Mapping the Road Together to Sustainable Employment; Celebrating 25 Years. Katittavik
Homes for a Changing Region. Blue Island, IL February 25, 2009
 Homes for a Changing Region Blue Island, IL February 25, 2009 Presentation Overview What is Homes for a Changing Region? Regional trends and demographic shifts Sustainability and building prototypes Blue
Queensland Economic Update
 Queensland Economic Update Chamber of Commerce & Industry January 218 cciq.com.au Queensland Economic Update: Summary Economy State Final Demand (SFD) expanded by.2% in the September 217 quarter Household
Economic Impacts of Campgrounds in New York State
 Economic Impacts of Campgrounds in New York State June 2017 Report Submitted to: Executive Summary Executive Summary New York State is home to approximately 350 privately owned campgrounds with 30,000
The Economic Impact of Tourism in Jacksonville, FL. June 2016
 The Economic Impact of Tourism in Jacksonville, FL June 2016 Highlights Visitor spending surpassed $2.0 billion in 2015, growing 4.4%. As this money flowed through Duval County, the $2.0 billion in visitor
Chermside, North Brisbane
 Location Report Chermside, North Brisbane Retire with Property 1300 U Retire (873 847) www.superannuationproperty.com Chermside, North Brisbane Location Population & Demographics Chermside is an inner
Economic Impact of Tourism in South Dakota, December 2017
 Economic Impact of Tourism in South Dakota, 2017 December 2017 1) Key findings 1) Growth continues in 2017 but pales against the event driven years of 2015 and 2016 in South Dakota Key facts about South
Regional Universities Network. Introduction. Regional Universities Network. Economic Impact of the Universities in the Regional Universities Network
 Regional Universities Network Economic Impact of the Universities in the Regional Universities Network Introduction The Regional Universities Network (RUN) is a network of six universities with headquarters
Monthly Fuel Price Report October 2014
 Monthly Fuel Price Report October 2014 6 November 2014 The RACQ monthly fuel price report presents a summary of the fuel price trends in Queensland for October 2014. Key points The average October price
Monthly Fuel Price Report January 2015
 Monthly Fuel Price Report January 2015 4 February 2015 The RACQ monthly fuel price report presents a summary of the fuel price trends in Queensland for January 2015. Key points Metropolitan petrol prices
The Economic Impact of Tourism on Galveston Island, Texas Analysis
 The Economic Impact of Tourism on Galveston Island, Texas 2012 Analysis Headline Results Headline results Tourism is a significant contributor to business sales, employment, and taxes on Galveston Island.