Puerto Ricans in Georgia, the United States, and Puerto Rico, 2014
|
|
|
- Fay Watts
- 6 years ago
- Views:
Transcription


1 Issued September 2016 Centro DS2014GA-14 Puerto Ricans in Georgia, the United States, and Puerto Rico, 2014 In 2014, an estimated 89,462 Puerto Ricans lived in Georgia and accounted for 1.7 percent of all Puerto Ricans living in the United States. Georgia had the 13th largest Puerto Rican population in the United States. The number of Puerto Ricans in Georgia more than doubled from 35,532 in the year 2000 to 89,462 in Findings from an examination of recently released Census data for 2014 reveal that: The unemployment rate among Puerto Ricans in Georgia s labor force was 9.8 percent, lower than among all stateside Puerto Ricans (11.6%) and just over half of the unemployment rate of those in Puerto Rico (18.9%). The labor force participation rate of Puerto Ricans in Georgia was 63.4 percent, two-percentage points higher than among stateside Puerto Ricans (61.6%) and twenty percentage points higher than those in Puerto Rico (43.7%). Notably, the rate of Puerto Ricans actively serving in the Armed Forces, not measured in the civilian labor force, was more than four times higher in Georgia (3.7%) than the overall stateside Puerto Rican rate (0.8%). The median household income for Puerto Ricans in Georgia was $52,661, more than $10,000 above the stateside Puerto Rican median household income ($39,322) and more than double the Puerto Rican median household income in Puerto Rico ($18,710). From an economic perspective, Puerto Ricans in Georgia accounted for $1.8 billion in purchasing power, representing roughly two percent of the $97.2 billion in purchasing power generated by stateside Puerto Ricans in Almost a third (32.3%) of Puerto Ricans in Georgia age 25 years and older had earned a bachelor s degree, a rate nearly double that among all Puerto Ricans in the U.S. (17.6%), and higher than that of Puerto Ricans in Puerto Rico (24.1%). A third (33.6%) of Puerto Ricans in Georgia worked in the higher wage management, business, sciences, and arts occupational sector. This rate was higher than among all Puerto Ricans in the U.S. (28.1%) and in Puerto Rico (31.3%). The median age of Puerto Ricans in Georgia was 27 years, below that of all Puerto Ricans in the U.S. (28.9 years) and those in Puerto Rico (38.9 years). About half (51.9%) Puerto Ricans in Georgia reported speaking only English in their household, a rate higher than among all stateside Puerto Ricans (38.8%). Only 10.3 percent of Puerto Ricans in Georgia reported speaking English less than very well, a rate below that of all Puerto Ricans in the U.S. (17.3%). Puerto Rican families in Georgia had below average poverty rates with only 12.2 percent reporting at or below the poverty rate, compared to 22.7 percent among all Puerto Rican families in the U.S. and 42.8 percent among those in Puerto Rico. The rate of Puerto Rican households in Georgia receiving public assistance income (2.7%) was less than half that of all Puerto Rican households in the United States (6.9%) and those in Puerto Rico (8.1%). The rate of Puerto Rican households receiving food stamp/ SNAP benefits was 17.3 percent lower than 31.5 percent among all Puerto Rican households in the U.S. and 39.7 percent among those in Puerto Rico. Overall, the Hispanic population proportion in Georgia has grown from 5.3 percent of the total population in 2000 to 9.1 percent in Similarly, Georgia s Puerto Rican population more than doubled in the past 14 years from 35,532
2 in 2000 to 89,462 in The Puerto Rican population account at least 9.7 percent of the total Hispanic population in 2014 compared to 8.2 percent in The median age of Puerto Ricans in Georgia was 27 years old, below the national median for Puerto Ricans of 28.9 years of age, and more than ten years lower than the median age among Puerto Ricans in Puerto Rico (38.9 years). The proportion of Puerto Ricans aged 62 years and older in Georgia was 6.4 percent, lower than for Puerto Ricans across the United States (9.9%) and less than a third of those in Puerto Rico (21%). English fluency indicators for Puerto Ricans in Georgia were higher than for stateside Puerto Ricans overall. About half of Puerto Ricans in Georgia (51.9%) reported speaking only English in the home, a rate more than ten percentage points higher than among all Puerto Ricans in the U.S. (38.8%). Only 10.3 percent of Puerto Ricans in Georgia reported speaking English less than very well, less than half the rate among all Puerto Ricans in the U.S. (17.3%). Puerto Ricans in Georgia were generally more educated than Puerto Ricans throughout the U.S. or in Puerto Rico. About a third (32.3%) of Puerto Ricans aged 25 or older Graph 1.A: Puerto Rican and Latino Population in Georgia, 2014 South American Other 3% 7% Central American 15% Mexican Dominican Republic 2% Cuban 3% Puerto Rican 10% 60% Table 1. Puerto Rican and Latino Population in Georgia Total 8,186, % 9,687, % 10,097, % Not Hispanic or Latino 7,751, % 8,833, % 9,175, % Hispanic or Latino 435, % 853, % 922, % Mexican 275, % 519, % 557, % Puerto Rican 35, % 71, % 89, % Cuban 12, % 25, % 28, % Dominican Republic 3, % 14, % 19, % Central American 31, % 106, % 134, % South American 19, % 57, % 68, % Other 57, % 57, % 24, % Sources: U.S. Census Bureau, Census 2000 Summary File 1, 2010 Census. Summary File 1, and 2014 American Community Survey 1-Year Estimates. 2
 had earned a bachelor s degree or higher, than men (29.5%) in Georgia.")
3 had earned a bachelor s degree or higher, compared 17.6 percent of all stateside Puerto Ricans and 24.1 percent of those in Puerto Rico. A breakdown of the education demographics by sex indicates that a higher proportion of women (35.2%) had earned a bachelor s degree or higher, than men (29.5%) in Georgia. This pattern was also observed among stateside Puerto Ricans as a whole and those in Puerto Rico. Puerto Rican participation in Georgia s civilian labor force (63.4%) was slightly higher than among the entire U.S. (61.6%), and both rates were almost 20 percentage points higher than the labor force participation in Puerto Rico (43.7%). The unemployment rate among Puerto Ricans in Georgia was 9.8 percent, lower than the stateside Puerto Rican unemployment rate (11.6%) and less than a third than in Puerto Rico (18.9%). Graph 2.A: Puerto Rican Education Attainment, 25 years and over, 2014 Bachelor s degree or higher Some college or associate s degree High school graduate (includes equivalency) Less than high school diploma 10.2% 32.3% 33.5% 23.7% 10.5% GEORGIA 17.6% 30.0% 29.7% 22.6% UNITED STATES 24.1% 21.6% 28.2% 26.0% PUERTO RICO Table 2. Age, Education, and Language 2014 Puerto Ricans Georgia United States Puerto Rico* TOTAL POPULATION 89,462 5,266,738 3,404,122 Median age (years) years and over 6.4% 9.9% 21.0% EDUCATIONAL ATTAINMENT Population 25 years and over Less than high school diploma 10.5% 22.6% 26.0% High school graduate (includes equivalency) 23.7% 29.7% 28.2% Some college or associate s degree 33.5% 30.0% 21.6% Bachelor s degree or higher 32.3% 17.6% 24.1% Male, bachelor s degree or higher 29.5% 15.6% 19.6% Female, bachelor s degree or higher 35.2% 19.5% 28.1% LANGUAGE SPOKEN AT HOME AND ABILITY TO SPEAK ENGLISH Population 5 years and over English only 51.9% 38.8% 5.3% Language other than English 48.1% 61.2% 94.7% Speak English less than very well 10.3% 17.3% 78.8% Source: U.S. Census Bureau, 2014 American Community Survey 1-Year Estimates. * Puerto Ricans only. 3
4 Proportionately, more Puerto Ricans in Georgia worked in the higher wage management, business, science, and arts sector than among all Puerto Ricans in the U.S. and those in Puerto Rico. A third (33.6%) of Puerto Ricans in Georgia worked in the higher wage management, business, science, and arts sector compared to 28.1 percent of Puerto Ricans in the U.S. and 31.3 percent in Puerto Rico. Proportionately, Puerto Rican women were more present than men in in the management, business, science, and arts sector. In Georgia, 35.6 percent of Puerto Rican women worked in this sector, compared to 31.9 percent of Puerto Rican men. In the United States these proportions were 33.1 percent and 23.4 percent respectively, and in Puerto Rico were 39.7 percent and 23.9 percent respectively. The second most common occupational sector was the sales and office occupations sector accounting for 30.7 percent of Puerto Rican employment in Georgia. Puerto Ricans actively serving in the Armed Forces accounted for 3.7 percent of Puerto Ricans in Georgia s labor force. Similarly, over one in ten (11.6%) Puerto Ricans in Georgia was a veteran, almost double the national rate (6%) and more than three times the rate in Puerto Rico (3.3%). Puerto Ricans in Georgia also work in the government sector at a higher rate (17.3%) than Puerto Ricans across the country as a whole, though lower than in Puerto Rico (22.5%) The average earnings of full-time, year-round Puerto Rican men and women in Georgia, $56,304 and $40,374, demonstrated a higher disparity (nearly $16,000) than at Table 3. Employment and Occupations Puerto Ricans Georgia United States Puerto Rico* EMPLOYMENT STATUS Population 16 years and over In labor force 67.2% 62.4% 43.7% Civilian labor force 63.4% 61.6% 43.7% Employed 57.2% 54.4% 35.4% Unemployed 9.8% 11.6% 18.9% Not in labor force 32.8% 37.6% 56.3% Armed Forces 3.7% 0.8% 0% OCCUPATION Civilian employed population 16 years and over Male 19,456 1,058, ,762 Management, business, science, and arts 31.9% 23.4% 23.9% Service occupations 16% 22.5% 23% Sales and office occupations 23.6% 19.6% 21.3% Construction and maintenance 12.7% 13.8% 18% Production, transportation, and moving 15.8% 20.7% 13.7% Female 16, , ,356 Management, business, science, and arts 35.6% 33.1% 39.7% Service occupations 17.7% 24.4% 16.6% Sales and office occupations 39.1% 35.7% 38.3% Construction and maintenance 0.9% 0.6% 0.6% Production, transportation, and moving 6.7% 6.2% 4.8% CLASS OF WORKER Civilian employed population 16 years and over Private wage and salary workers 79.8% 82.0% 69% Government workers 17.3% 14.8% 22.5% Self-employed workers in own not incorporated business 2.9% 3.1% 8.3% VETERAN STATUS Civilian population 18 years and over Civilian veteran 11.6% 6.0% 3.3% Source: U.S. Census Bureau, 2014 American Community Survey 1-Year Estimates. * Puerto Ricans only.
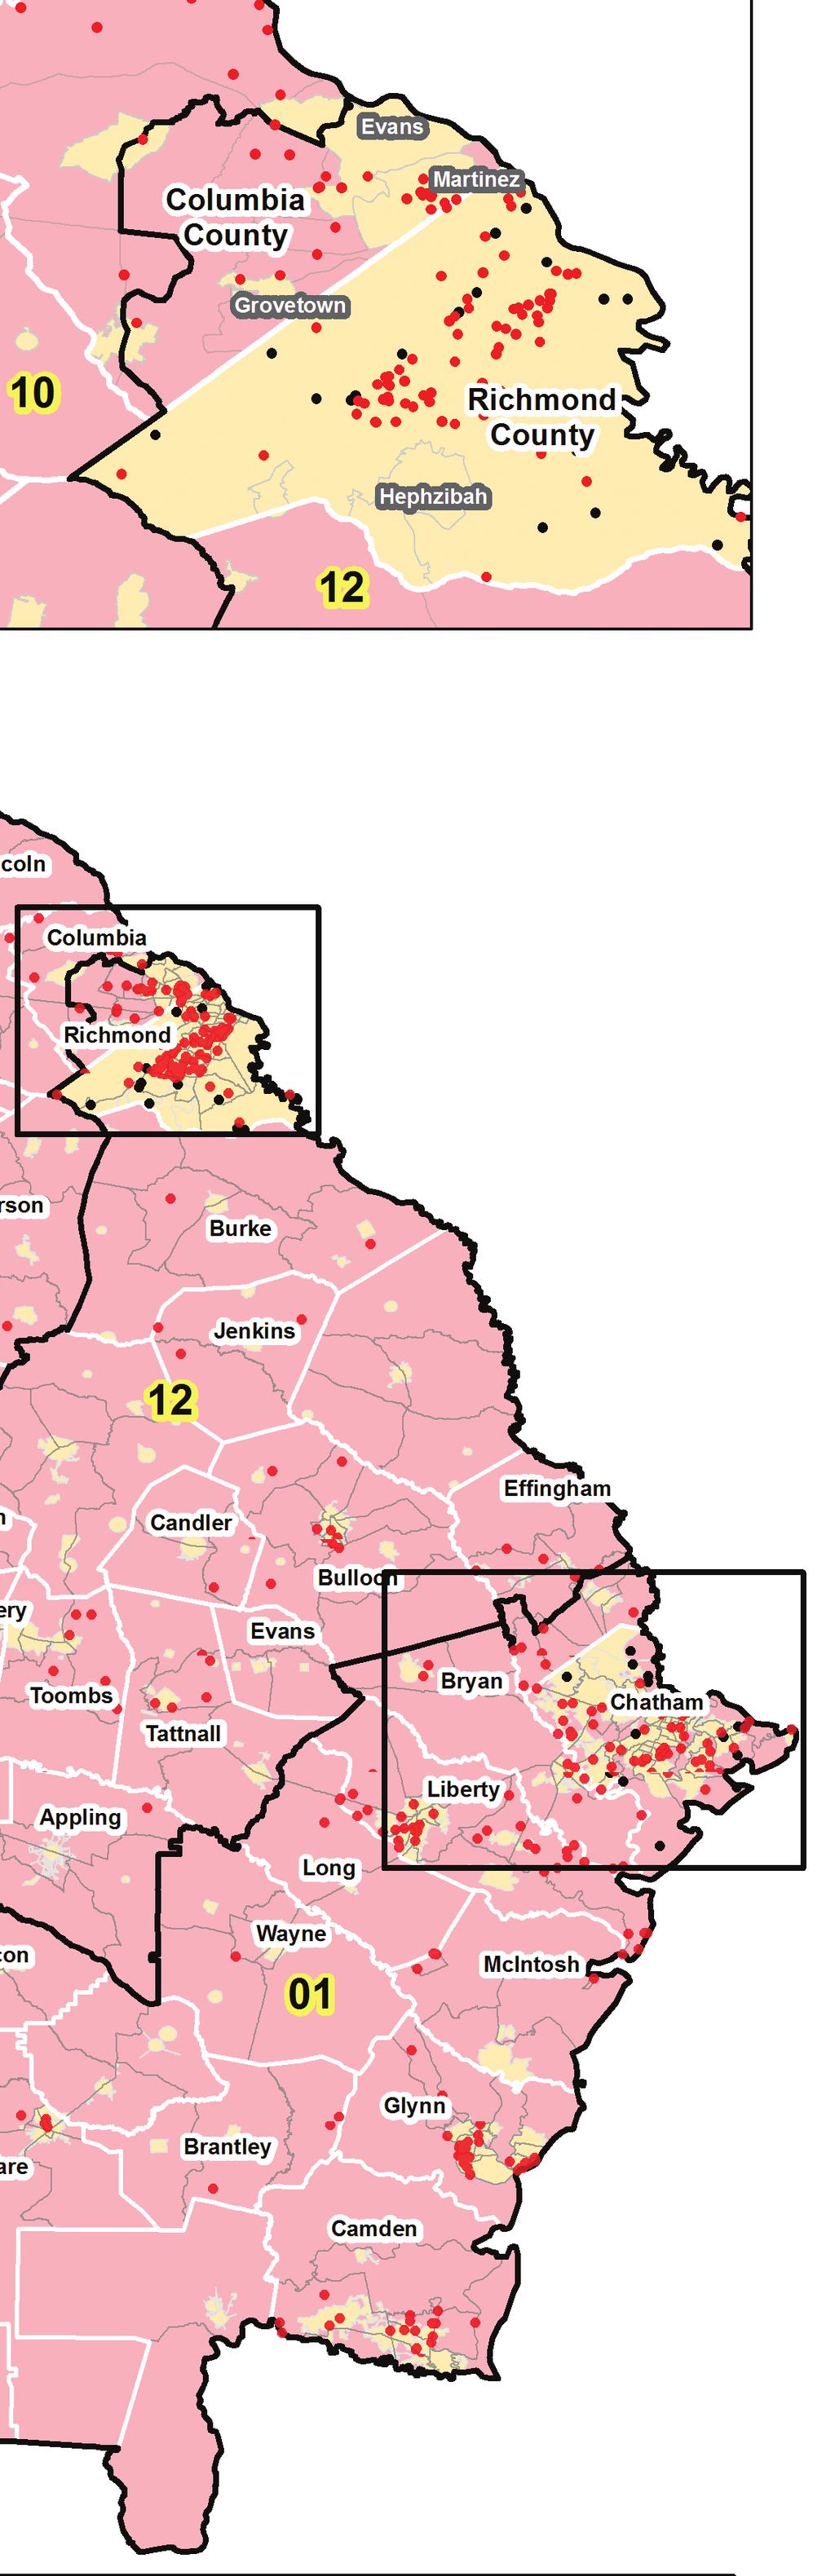
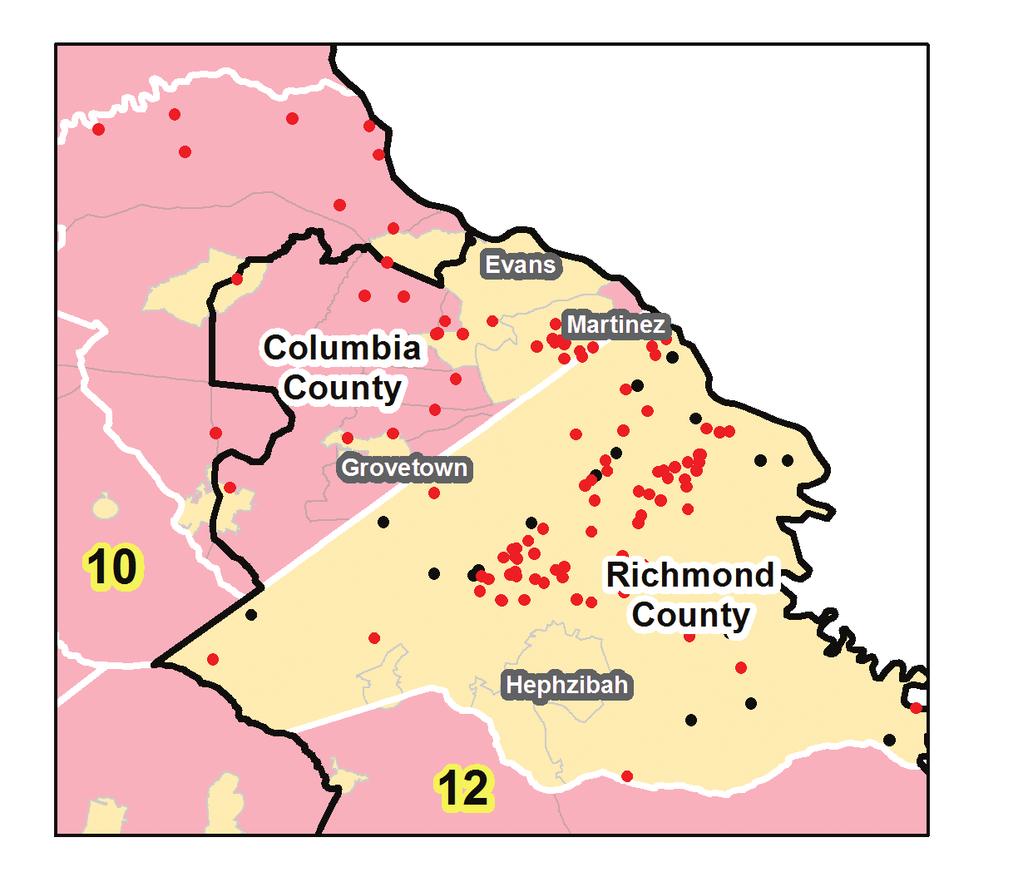
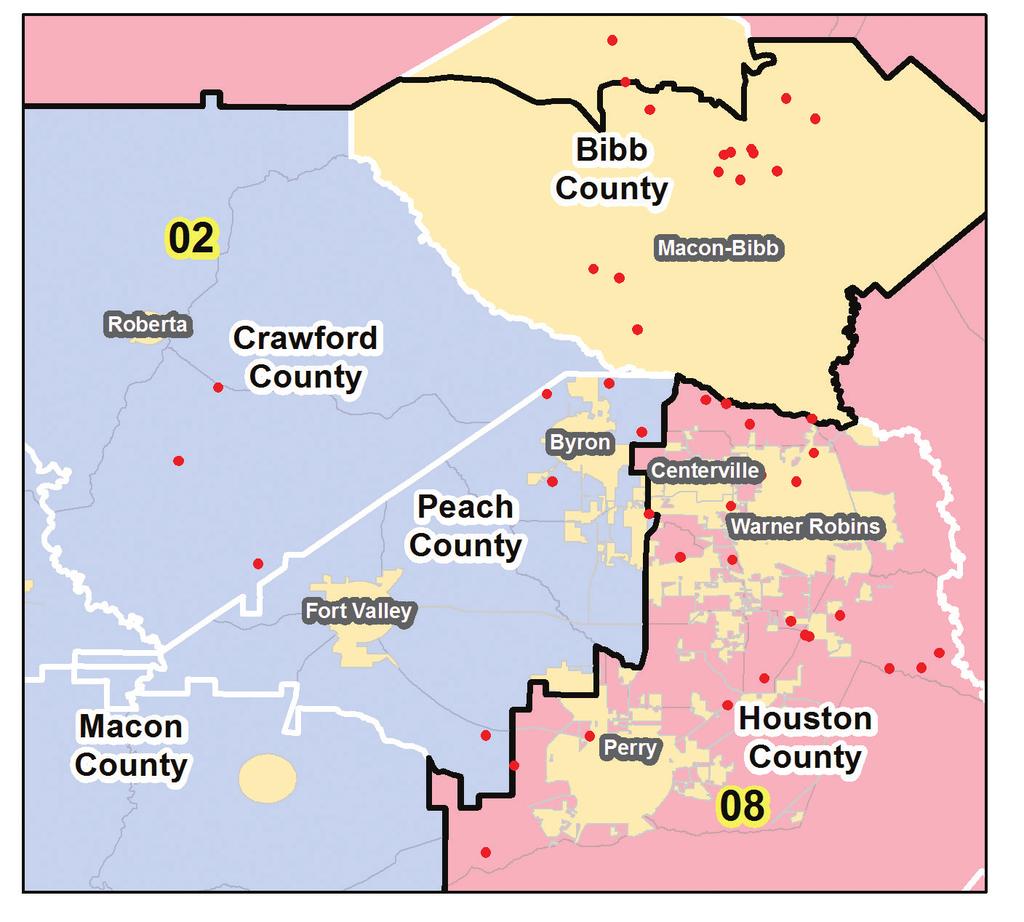
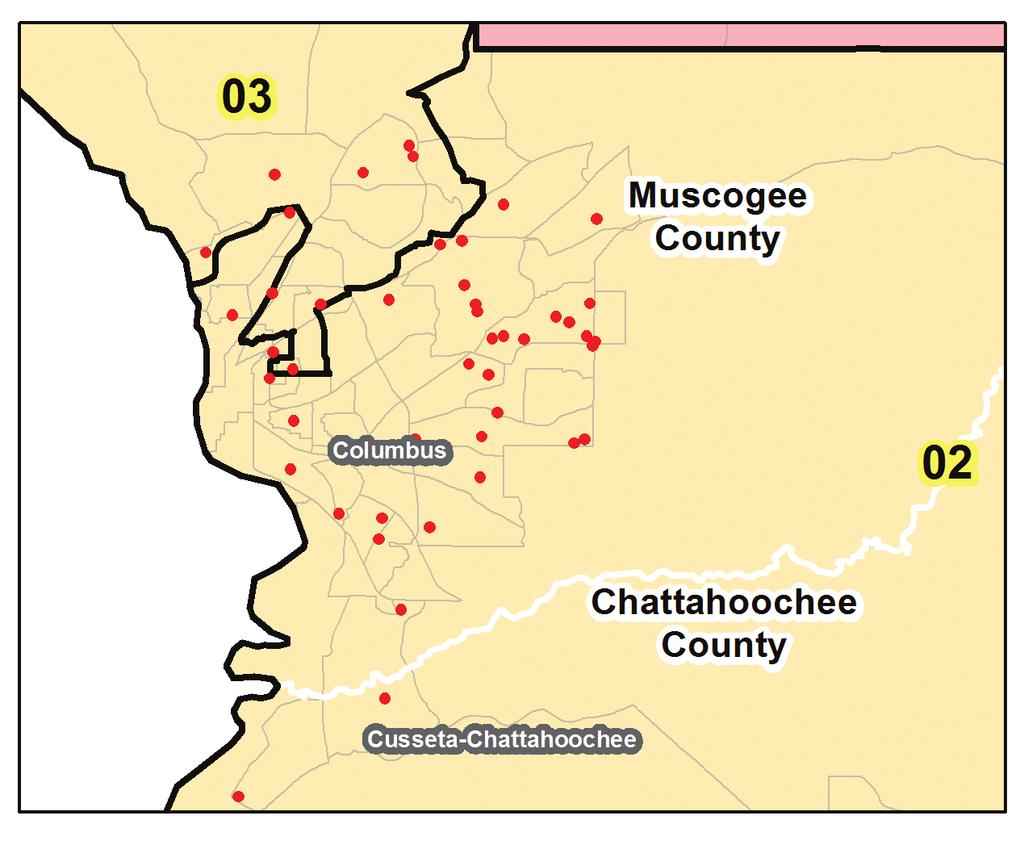
5 Puerto Rican Population by Counties in Georgia, 2014 Most Puerto Ricans in Georgia (45.8%) were settled in the northwestern region of the state, particularly in the Atlanta-Sandy Springs-Roswell metropolitan area. The remaining 54.2 percent of the Puerto Rican population were dispersed throughout the state, yet there were small areas of concentration in the northeast (Whitfield County), parts of the east (Richmond, Liberty, Chatham Counties), and southwest (Muscogee County) regions of the state. The largest area of Puerto Rican settlement was found in the nine counties of Atlanta-Sandy Springs-Roswell metropolitan area: Gwinnett (15.6%), Cobb (8.5%), Fulton (7.3%), DeKalb (4.8%), Henry (3%), Clayton (2.6%), Coweta (1.6%), Douglas (1.2%), and Fayette (1%). The second largest Puerto Rican concentration outside of Atlanta metropolitan area was in Richmond County (Augusta City) and in Columbia County, and both areas accounted for 7.4 percent of the state s Puerto Rican population. Muscogee County (Columbus City) located in the southwest region and Chatham County (Savannah city) located in the southeast region of the state both accounted 7.8 percent of the Puerto Rican population. At least 30 miles west of Chatham County is another Puerto Rican community located in Liberty County, containing 3.4 percent of the population. Latinos as a whole showed a similarly settlement pattern in Georgia as Puerto Ricans, with nearly one-fifth (19.1%) of Latinos settled in Gwinnet County and the remainder distributed in lower concentration throughout the state. Puerto Rican presence was overrepresented in counties outside of the Atlanta-Sandy Springs-Roswell metropolitan area compared to the Latino population in Georgia. In all, Puerto Rican communities tend to reflect the location of U.S. military bases located throughout the state. COUNTY Puerto Rican Population Percent Latino Population Percent Total Population Percent Gwinnett County 13, % 171, % 842, % Cobb County 7, % 88, % 708, % Fulton County 6, % 74, % 967, % DeKalb County 4, % 65, % 707, % Richmond County 3, % 8, % 201, % Chatham County 3, % 15, % 275, % Muscogee County 3, % 14, % 198, % Liberty County 2, % 7, % 64, % Columbia County 2, % 7, % 132, % Henry County 2, % 12, % 209, % Cherokee County 2, % 21, % 221, % Clayton County 2, % 35, % 264, % Houston County 1, % 9, % 145, % Paulding County 1, % 7, % 145, % Whitfield County 1, % 33, % 103, % Forsyth County 1, % 18, % 189, % Coweta County 1, % 8, % 131, % Lowndes County 1, % 5, % 112, % Camden County 1, % 2, % 51, % Douglas County 1, % 11, % 135, % Other Counties 20, % 274, % 4,101, % Total 84, % 896, % 9,907, % Sources: U.S. Census Bureau 2014 American Community Survey 5-Year Estimates Notes: Total counts for populations may differ depending on whether the estimates are derived from the five-year estimates or the one-year estimates of the American Community Survey. Counties with less than 1% of the total Puerto Rican population were omitted. 5


6 PUERTO RICAN POPULATION BY COUNTIES IN GEORGIA, 2014 PUERTO RICAN POPULATION 1 dot = PUERTO RICAN ARRIVALS 1 dot = 50 BOUNDARIES County City/Towns Census Tracts CONGRESSIONAL DISTRICT Republican Democrat 6

7 7


8 PUERTO RICAN POPULATION BY COUNTIES IN GEORGIA, 2014 PUERTO RICAN POPULATION 1 dot = PUERTO RICAN ARRIVALS 1 dot = 50 BOUNDARIES County City/Towns Census Tracts CONGRESSIONAL DISTRICT Republican Democrat 8
9 the national level of $50,756 and $42,623 (about $8,000) for Puerto Rican men and women, respectively. Although Puerto Rican men in Georgia earned almost six thousand dollars more than at the national level, Puerto Rican women in Georgia earned about two thousand dollars less than at the national level. Compared to Puerto Rico where average full-time, year-round Puerto Rican earnings were $32,512 and $29,166 for men and women, respectively, Puerto Ricans in Georgia and the U.S. as a whole earned more on average. Household and family incomes are important indicators of economic well-being. These indicators were higher for Puerto Ricans in Georgia than for stateside Puerto Ricans and those in Puerto Rico. The median income was $52,661 for Puerto Rican households in Georgia, more than ten thousand dollars higher than among all stateside Puerto Ricans ($39,322) and more than double the median income of Puerto Rican households in Puerto Rico ($18,710). Per capita incomes among Puerto Ricans in Georgia were higher ($20,552) than among all stateside Puerto Ricans ($18,457) and those in Puerto Rico ($10,960). Puerto Ricans in Georgia had $1.8 billion purchasing power. From an economic perspective, stateside Puerto Ricans represented 72.3 percent of the $134.5 billion total purchasing power of the entire Puerto Rican community in the year Purchasing power is defined simply as per capita income multiplied by the Puerto Rican population. Stateside Puerto Ricans had more than double the total purchasing power of Puerto Ricans in Puerto Rico of $37.3 billion. Table 4. Income and Earnings 2014 Puerto Ricans Georgia United States Puerto Rico* INCOME IN THE PAST 12 MONTHS (IN 2013 INFLATION-ADJUSTED DOLLARS) Households 27,272 1,635,808 1,175,297 Median household income (dollars) $52,661 $39,322 $18,710 With earnings 90.2% 76.9% 54.7% Mean earnings (dollars) $63,939 $61,065 $36,407 With Social Security income 16.7% 24.1% 43.2% Mean Social Security income (dollars) $15,926 $13,727 $12,159 With Supplemental Security Income 4.6% 12.6% 0.4% Mean Supplemental Security Income (dollars) $9,666 $8,780 $10,025 With cash public assistance income 2.7% 6.9% 8.1% Mean cash public assistance income (dollars) $2,798 $3,441 $2,316 With retirement income 10.8% 10.1% 15.6% Mean retirement income (dollars) $21,806 $20,452 $15,387 With Food Stamp/SNAP benefits 17.3% 31.5% 39.7% Families 18,792 1,114, ,807 Median family income (dollars) $61,150 $44,499 $22,220 Married-couple family 72.2% 53.9% 56.1% Median income (dollars) $75,072 $67,129 $29,417 Male householder, no spouse present 12.1% 10.2% 9.5% Median income (dollars) $37,169 $37,513 $17,797 Female householder, no husband present 15.7% 35.9% 34.4% Median income (dollars) $28,834 $23,957 $13,554 Individuals 89,462 5,266,738 3,404,122 Per capita income (dollars) $20,552 $18,457 $10,960 Mean earnings (dollars) for full-time, year-round workers: Male $56,304 $50,756 $32,512 Female $40,374 $42,263 $29,166 Source: U.S. Census Bureau, 2014 American Community Survey 1-Year Estimates. * Puerto Ricans only. 9


10 The poverty rate for all Puerto Rican families in Georgia (12%) was ten-percentage points lower than among all Puerto Rican families in the U.S. (22.7%) and those in Puerto Rico (42.8%). As seen in other states and in Puerto Rico, Puerto Rican households with a female householder, no husband, and children under 18 had the highest rates of poverty. In Georgia, 46.3 percent of these households reported living in poverty, compared to 49.7 percent across the U.S. and 69.7 percent in Puerto Rico. Regardless of context, these poverty rates are alarmingly high. Although Georgia had overall less Puerto Rican households in poverty, the proportional frequency of poverty in specific types of households mirrored that of other states. Public assistance income participation rates for Puerto Rican families in Georgia (2.7%) were less than half the national level (6.9%) and in Puerto Rico (8.1%). Although food stamp/snap (Supplementary Nutrition Assistance Program) participation among Puerto Rican families in Georgia was 17.3%, it was considerably below the national level (31.5%) and in Puerto Rico (39.7%). Housing is a primary determinant of the cost of living. The median value of owner-occupied housing for Puerto Ricans in Georgia was $155,000, lower than the median value of owner-occupied housing for all stateside Puerto Ricans ($175,900), but higher than in Puerto Rico ($119,500). This Graph 4.A: Mean Earnings for Full-Time Year-Round Puerto Rican Workers, 2014 Male Female $60,000 $56,304 $50,756 $50,000 $42,263 $40,374 $40,000 $32,512 $29,166 $30,000 $20,000 $10,000 0 GEORGIA UNITED STATES PUERTO RICO Graph 4.B: Puerto Rican Purchasing Power, in Billions, 2014 GEORGIA $1.8 PUERTO RICO $37.3 $95.4 UNITED STATES 10
11 Graph 5.A: Poverty Rates, 2014 Georgia United States Puerto Rico 42.8% 53.9% 37.8% 42.4% 59.6% 46.3% 49.7% 69.7% 29.5% 22.7% 18.2% 12.2% All families All families with related children under 18 years Female householder no husband present Female householder with related children under 18 years Table 5. Poverty 2014 Puerto Ricans Georgia United States Puerto Rico* POVERTY RATES All families 12.2% 22.7% 42.8% With related children under 18 years 18.2% 29.5% 53.9% With related children under 5 years only N 24.6% 57.1% Married-couple family 5.5% 9.7% 30.9% With related children under 18 years N 11.3% 35.5% With related children under 5 years only N 5.9% 33.9% Female householder, no husband present, family 37.8% 42.4% 59.6% With related children under 18 years 46.3% 49.7% 69.7% With related children under 5 years only N 49.4% 75.7% All people 18.3% 26.2% 46.6% Under 18 years 23.6% 33.4% 58.7% Related children under 18 years 23.6% 33.1% 58.6% Related children under 5 years 27.3% 34.7% 62.8% Related children 5 to 17 years 21.7% 32.4% 57.3% 18 years and over 15.4% 22.8% 43.2% 18 to 64 years 16.6% 22.8% 43.8% 65 years and over 3.0% 22.4% 41% People in families 15.6% 23.6% 44.6% Unrelated individuals 15 years and over 32.3% 38.5% 58.6% Source: U.S. Census Bureau, 2014 American Community Survey 1-Year Estimates. * Puerto Ricans only. N = No Observations. 11
12 discrepancy in home values may be affected largely by the lower costs of living in Georgia. Puerto Ricans in the state are generally making more money and more likely to be employed in higher wage sectors than at the national level, and could presumably afford more expensive homes. The median monthly owner cost associated with a mortgage was $1,317 for Puerto Ricans in Georgia, $1,545 for those in the U.S., and $873 for those in Puerto Rico. Less than a quarter (23%) of Puerto Ricans in Georgia who owned a home paid more than 30 percent of their income in monthly owner costs. This rate was higher at the national (37.2%) level and in Puerto Rico (47.4%). Georgia had considerably higher rates of home ownership (48.6%) among Puerto Rican households when compared to the national level (36%). However, these rates was lower than in Puerto Rico (68.7%). Table 6. Housing and Health Insurance 2014 Puerto Ricans HOUSING Georgia United States Puerto Rico* Owner-occupied housing units 48.6% 36.0% 68.7% Monthly owner costs as a percentage of household income in the past 12 months Less than 30 percent 77.0% 62.8% 52.6% 30 percent or more 23.0% 37.2% 47.4% Owner-occupied housing units Median value (dollars) $155,000 $175,900 $119,500 Median selected monthly owner costs with a mortgage (dollars) HEALTH INSURANCE COVERAGE Civilian noninstitutionalized population $1,317 $1,545 $873 With private health insurance 65.7% 51.6% 38.0% With public coverage 26.3% 43.5% 62.9% No health insurance coverage 13.2% 11.5% 5.5% Source: U.S. Census Bureau, 2014 American Community Survey 1-Year Estimates. * Puerto Ricans only. The Center for Puerto Rican Studies (Centro) is the nation s leading university-based institution devoted to the interdisciplinary study of the Puerto Rican experience in the United States. Centro is dedicated to understanding, preserving and sharing the Puerto Rican experience in the United States. Centro invites Centro Voices contributors to make use of the extensive archival, bibliographic and research material preserved in its Library and Archives. The Centro Library and Archives is devoted to collecting, preserving and providing access to resources documenting the history and culture of Puerto Ricans. The Centro Library and Archives was established in 1973 as a component of the Center for Puerto Rican Studies. The collections include books, current and historic newspapers and periodicals, audio, film & video, manuscripts, photographs, art prints, and recorded music. The Library and Archives provides services and programs to the scholarly community as well as the general public. Constituents are diverse and come from the United States and abroad. The Library and Archives facilitates access to information on its holdings through the City University s online public catalog or CUNY+. It also provides research and information assistance via phone and . Centro Library and Archives Silberman Building, 2180 Third Avenue at 119th Street, Room 121, New York, N.Y Library: Archives: centropr.hunter.cuny Follow Hunter College, The City University of New York 695 Park Avenue, E1429 New York, N.Y Voic Fax: Center for Puerto Rican Studies Hunter College, CUNY 695 Park Avenue New York, NY , centropr.hunter.cuny.edu
Puerto Ricans in Rhode Island, the United States, and Puerto Rico, 2013
 Issued September 2016 Centro DS2015US-07 Puerto Ricans in Rhode Island, the United States, and Puerto Rico, 2013 In 2013 an estimated 36,217 Puerto Ricans lived in Rhode Island and accounted for at least
Puerto Ricans in Ohio, the United States, and Puerto Rico, 2014
 Issued April 2016 Centro DS2015US-12 Puerto Ricans in Ohio, the United States, and Puerto Rico, 2014 In 2014, Ohio had the tenth largest number of Puerto Ricans in the United States with 108,174 residents,
Puerto Ricans in Connecticut, the United States, and Puerto Rico, 2014
 Issued April 2016 Centro DS2016US-8 Puerto Ricans in Connecticut, the United States, and Puerto Rico, 2014 In 2014, Connecticut was the 6th state with most Puerto Ricans (301,182) in the United States.
Puerto Ricans in Massachusetts, the United States, and Puerto Rico, 2014
 Issued April 2016 Centro DS2016US-07 Puerto Ricans in Massachusetts, the United States, and Puerto Rico, 2014 In 2014, Massachusetts was the fifth state with most Puerto Ricans in the United States. In
Puerto Rican Entrepreneurship in the U.S.
 Puerto Rican Entrepreneurship in the U.S. Research Brief issued April 2017 By: Jennifer Hinojosa Centro RB2016-14 Puerto Rican entrepreneurs were the fastest growing business firms in the U.S. According
PROFILE OF THE PUERTO RICAN POPULATION IN UNITED STATES AND PUERTO RICO: 2008
 PROFILE OF THE PUERTO RICAN POPULATION IN UNITED STATES AND PUERTO RICO: 2008 Sonia G. Collazo, Camille L. Ryan, Kurt J. Bauman U.S. Census Bureau Housing and Household Economic Statistics Division This
part one: comparing puerto ricans
 part one: comparing puerto ricans snapshot: puerto ricans across major us metro areas This section uses data from the 2010 American Community Survey one-year estimates to examine the socioeconomic characteristics
Post-Hurricane Maria Exodus from Puerto Rico and School Enrollment in Florida
 Post-Hurricane Maria Exodus from Puerto Rico and School Enrollment in Florida Research Brief Issued December 2017 By: Edwin Meléndez, Jennifer Hinojosa, and Nashia Roman centro RB2017-02 Hurricane Maria
A COMPARISON OF THE MILWAUKEE METROPOLITAN AREA TO ITS PEERS
 KRY/WJS/EDL #222377 (PDF: #223479) 1/30/15 PRELIMINARY DRAFT Memorandum Report A COMPARISON OF THE MILWAUKEE METROPOLITAN AREA TO ITS PEERS EXECUTIVE SUMMARY This memorandum report provides a statistical
T H E VILLAGE OF P h i l m o n t, N Y
 T H E VILLAGE OF P h i l m o n t, N Y Summit Reservoir Area Plan November 17, 2014 Executive Steering Committee Meeting 2 Agenda 1:00 1. Welcome 2. Housekeeping & updates i. Committee contact list review
Demographic Profile 2013 census
 Demographic Profile 2013 census This profile provides basic population and demographic information on the residents of the Hauraki District. Population and demographic information is important for targeting
Devonport-Takapuna Local Board Profile
 Devonport-Takapuna Local Board Profile - Initial results from the Census February 2014 Social and Economic Research Team Research, Investigations and Monitoring Unit Auckland Council Map of Devonport-Takapuna
SYNOPSIS OF INFORMATION FROM CENSUS BLOCKS AND COMMUNITY QUESTIONNAIRE FOR TONOPAH, NEVADA
 TECHNICAL REPORT UCED 93-04 SYNOPSIS OF INFORMATION FROM CENSUS BLOCKS AND COMMUNITY QUESTIONNAIRE FOR TONOPAH, NEVADA UNIVERSITY OF NEVADA, RENO i Synopsis of Information from Census Blocks and Community
A COMPARISON OF THE MILWAUKEE METROPOLITAN AREA TO ITS PEERS
 KRY/WJS/EDL #222377 v4 (PDF: #223479v2) 4/1/15 APPENDIX D REVISED DRAFT Memorandum Report A COMPARISON OF THE MILWAUKEE METROPOLITAN AREA TO ITS PEERS EXECUTIVE SUMMARY This report provides a statistical
Philmont, New York Contents
 Philmont, New York Contents Philmont, New York... 1 Overview... 2 Surrounding Area... 3 Development of Philmont... 3 Transportation Access... 5 Topography... 5 Water Resources... 5 Demographics... 7 Population...
October Dear Readers,
 aklitho JEDC.org 612 W. Willoughby Ave., Suite A Juneau, AK 99801 Phone 907 523 2300 October 2012 Dear Readers, The Juneau Economic Development Council (JEDC) is pleased to make our 2012 edition of local
Regional Universities Network. Introduction. Regional Universities Network. Economic Impact of the Universities in the Regional Universities Network
 Regional Universities Network Economic Impact of the Universities in the Regional Universities Network Introduction The Regional Universities Network (RUN) is a network of six universities with headquarters
State of the Shared Vacation Ownership Industry. ARDA International Foundation (AIF)
") State of the Shared Vacation Ownership Industry ARDA International Foundation (AIF) This paper includes a high-level overview of the timeshare industry with a core focus on financial growth, owner demographics
State of the Shared Vacation Ownership Industry ARDA International Foundation (AIF) This paper includes a high-level overview of the timeshare industry with a core focus on financial growth, owner demographics
AVSP 7 Summer Section 7: Visitor Profile - Demographics and Spending
 AVSP 7 Summer 2016 Section 7: Visitor Profile - Demographics and Spending Demographics Origin Visitors were asked what state, country, or province they were visiting from. The chart below shows results
2013 IRVING HOTEL GUEST SURVEY Final Project Report
 2013 IRVING HOTEL GUEST SURVEY Final Project Report Research prepared for the Irving Convention & Visitors Bureau by Destination Analysts, Inc. Table of Contents SECTION 1 Introduction 2 SECTION 2 Executive
CITY OF COTATI: LOCAL ECONOMIC REPORT
 EDB Sonoma County Economic Development Board Cotati Chamber of Commerce economy 2010-11 CITY OF COTATI: LOCAL ECONOMIC REPORT E c o n o m i c D e v e l o p m e n t B o a r d 4 0 1 C o l l e g e Av e n
2015 IRVING HOTEL GUEST SURVEY Final Project Report
 2015 IRVING HOTEL GUEST SURVEY Final Project Report Research prepared for the Irving Convention & Visitors Bureau by Destination Analysts, Inc. Table of Contents S E C T I O N 1 Introduction 2 S E C T
North Carolina (Statewide) 2016 Prosperity Zone Data Books
 2016 Prosperity Zone Data Books") North Carolina (Statewide) 2016 Prosperity Zone Data Books 2 North Carolina Prosperity Zones Western North Carolina Prosperity Zones Northwest Region Piedmont-Triad Region Western Region Southwest Region
North Carolina (Statewide) 2016 Prosperity Zone Data Books 2 North Carolina Prosperity Zones Western North Carolina Prosperity Zones Northwest Region Piedmont-Triad Region Western Region Southwest Region
This section of the Plan provides a general overview of the Smoky Mountain Region. It consists of the following four subsections:
 SECTION 3 COMMUNITY PROFILE This section of the Plan provides a general overview of the Smoky Mountain Region. It consists of the following four subsections: 3.1 Geography and the Environment 3.2 Population
Barbadians. imagine all the people. Barbadians in Boston
 Barbadians imagine all the people Barbadians in Boston imagine all the people is a series of publications produced by the Boston Redevelopment Authority for the Mayor s Office of Immigrant Advancement.
AVIATION. January Aviation INDUSTRY PROFILE. for Arapahoe & Douglas Counties Colorado WIOA Central Planning Region
 January 2017 Aviation INDUSTRY PROFILE for Arapahoe & Douglas Counties Colorado WIOA Central Planning Region Background The Metro Denver region ranks 14th among the nation s 0 largest metro areas for aviation
Institute for Public Policy and Economic Analysis
 Institute for Public Policy and Economic Analysis Die Cut Die Cut Die Cut Die Cut The Institute for Public Policy and Economic Analysis at Eastern Washington University will convey university expertise
CHAPTER 3: COMMUNITY PROFILE
 CHAPTER 3: COMMUNITY PROFILE Chapter 3 includes the following information: 1. Community Context 2. The Land 3. The People Who Live Here 4. The Housing Landscape 5. The Economy 6. Past and Future Growth
Chapter 1: The Population of NHS Greater Glasgow and Clyde
 Population Estimate (thousands) Chapter 1: The Population of NHS Greater Glasgow and Clyde Population Trends and Projections National Records of Scotland estimated (NRS SAPE) 1 the 2013 NHS Greater Glasgow
San Antonio Market Overview. 1 st 2 nd Quarter 2015
 San Antonio Market Overview 1 st 2 nd Quarter 2015 San Antonio, Texas Attributes of San Antonio Why San Antonio? The seventh most populated city in the United States of America and the second most populated
Community Health Status Assessment
 Community Health Status Assessment Boone County, Missouri Prepared August 2013 by: Sarah Rainey, Epidemiology, Planning and Evaluation Supervisor Columbia/Boone County Department of Public Health and Human
NAPA VALLEY VISITOR INDUSTRY 2016 Economic Impact Report
 NAPA VALLEY VISITOR INDUSTRY 2016 Economic Impact Report Research prepared for Visit Napa Valley by Destination Analysts, Inc. Table of Contents S E C T I O N 1 Introduction 2 S E C T I O N 2 Executive
EXECUTIVE SUMMARY. hospitality compensation as a share of total compensation at. Page 1
 EXECUTIVE SUMMARY Applied Analysis was retained by the Las Vegas Convention and Visitors Authority (the LVCVA ) to review and analyze the economic impacts associated with its various operations and southern
MEDIA LIFESTYLE MAGAZINE COMMUNITY ORIENTED
 MEDIA LIFESTYLE MAGAZINE COMMUNITY ORIENTED ABOUT US Live it up Doral is a printed and digital magazine that invites readers to enjoy the city of Doral. Its editorial line combines life style with community
NAPA VALLEY VISITOR INDUSTRY 2014 Economic Impact Report
 NAPA VALLEY VISITOR INDUSTRY 2014 Economic Impact Report Research prepared for Visit Napa Valley by Destination Analysts, Inc. Table of Contents SECTION 1 Introduction 2 SECTION 2 Executive Summary 5 SECTION
Contents Manningham at a Glance... 6 Location and Area... 6 Manningham Activity Centres... 6 Manningham Suburbs... 6 Population... 8 Forecast... 9 For
 Contents Manningham at a Glance... 6 Location and Area... 6 Manningham Activity Centres... 6 Manningham Suburbs... 6 Population... 8 Forecast... 9 Forecast 2011 2036... 9 Population Forecast... 9 Gross
ECONOMIC PROFILE PARK CITY & SUMMIT COUNTY, UTAH
 ECONOMIC PROFILE PARK CITY & SUMMIT COUNTY, UTAH Prepared by the Park City Chamber of Commerce & Visitors Bureau PO Box 1630, Park City, UT 84060 1.800.453.1360 Economic Profile Packet Sections 1. Introduction
NAPA VALLEY VISITOR INDUSTRY 2012 Economic Impact Report
 Join Visit Napa Valley NAPA VALLEY VISITOR INDUSTRY 2012 Economic Impact Report Research prepared for Visit Napa Valley by Destination Analysts, Inc. Table of Contents SECTION 1 Introduction 2 SECTION
The Economic Impact of Tourism in Hillsborough County. July 2017
 The Economic Impact of Tourism in Hillsborough County July 2017 Table of contents 1) Key Findings for 2016 3 2) Local Tourism Trends 7 3) Trends in Visits and Spending 12 4) The Domestic Market 19 5) The
JATA Market Research Study Passenger Survey Results
 JATA Market Research Study Passenger Survey Results Prepared for the Jackson Area Transportation Authority (JATA) April, 2015 3131 South Dixie Hwy. Suite 545 Dayton, OH 45439 937.299.5007 www.rlsandassoc.com
East Lothian. Skills Assessment January SDS-1154-Jan16
 East Lothian Skills Assessment January 2016 SDS-1154-Jan16 Acknowledgement The Regional Skills Assessment Steering Group (Skills Development Scotland, Scottish Enterprise, the Scottish Funding Council
The Economic Impact of Tourism Brighton & Hove Prepared by: Tourism South East Research Unit 40 Chamberlayne Road Eastleigh Hampshire SO50 5JH
 The Economic Impact of Tourism Brighton & Hove 2013 Prepared by: Tourism South East Research Unit 40 Chamberlayne Road Eastleigh Hampshire SO50 5JH CONTENTS 1. Summary of Results 1 1.1 Introduction 1 1.2
2nd Quarter. AEDC is pleased to present the Anchorage Quarterly Economic Indicators Report for the second quarter of 2010.
 2010 AEDC is pleased to present the Anchorage Quarterly Economic Indicators Report for the second quarter of 2010. This report summarizes recently updated data from the Anchorage Economic Indicators Database,
TABLE OF CONTENTS PREFACE & CONTACTS DEMOGRAPHICS TRAVEL BEHAVIOR CHARACTERISTICS MODAL STATISTICS TOURISM TRANSPORTATION FINANCING
 TABLE OF CONTENTS PREFACE & CONTACTS DEMOGRAPHICS TRAVEL BEHAVIOR CHARACTERISTICS MODAL STATISTICS TOURISM TRANSPORTATION FINANCING TRANSPORTATION EDUCATION & RESEARCH DIRECTORY MISCELLANEOUS INDEX on
The Australian Defence Organisation and Tropical Australia: Its Socio-Economic Impact in Cairns, Darwin and Townsville
 The Australian Defence Organisation and Tropical Australia: Its Socio-Economic Impact in Cairns, Darwin and Townsville Dr Riccardo Welters School of Business, James Cook University Published by The Cairns
Statistical Picture of Aboriginal and Torres Strait Islander School Students in Australia
 Chapter 2 Statistical Picture of Aboriginal and Torres Strait Islander School Students in Australia Statistical Picture The Australian Bureau of Statistics (ABS) reported that the estimated resident Aboriginal
The Economic Impact of Tourism on Oxfordshire Estimates for 2013
 The Economic Impact of Tourism on Oxfordshire Estimates for 2013 County and District Results September 2014 Prepared by: Tourism South East Research Unit 40 Chamberlayne Road Eastleigh Hampshire SO50 5JH
Colorado Travel Impacts
 Colorado Travel Impacts 1996-2013 Image Credit: Matt Inden/Miles July 2014 Prepared for the Colorado Tourism Office Denver, Colorado THE ECONOMIC IMPACT OF TRAVEL ON COLORADO 1996-2013 July 2014 prepared
Reference Number. Station
 Table A.7 Population and Number of Households within 800m Radius of Proposed s ALTERNATIVE 1 ALTERNATIVE 2 ALTERNATIVE 3 Reference Number Population Households Reference Number Population Households Population
Follow this and additional works at:
 Florida International University FIU Digital Commons Palm Beach County MPO Community Background Reports 1-1-2011 Town of Lake Park Follow this and additional works at: http://digitalcommons.fiu.edu/mpo_palmbeach
North Lanarkshire. Skills Assessment January SDS-1163-Jan16
 North Lanarkshire Skills Assessment January 2016 SDS-1163-Jan16 Acknowledgement The Regional Skills Assessment Steering Group (Skills Development Scotland, Scottish Enterprise, the Scottish Funding Council
East Dunbartonshire Area Profile
 East Dunbartonshire Area Profile May 2014 Contents Executive Summary.. page 3 Introduction.. page 6 Population page 7 Age Structure. page 9 Population Projections page 11 Life Expectancy page 12 Ethnicity.
LITERACY IN NOVA SCOTIA Implications of Findings from IALSS 2003
 LITERACY IN NOVA SCOTIA Implications of Findings from IALSS 03 Presented by Satya Brink, Ph.D. Director, National Learning Policy Research Learning Policy Directorate, HRSDC January 06 1 Key Questions
Airport Profile. St. Pete Clearwater International BY THE NUMBERS 818, ,754 $ Enplanements. Passengers. Average Fare. U.S.
 Airport Profile St. Pete Clearwater International St. Pete-Clearwater International Airport (PIE) is located in Pinellas County, Florida about nine miles north of downwn St. Petersburg, seven miles southeast
Peer Performance Measurement February 2019 Prepared by the Division of Planning & Market Development
 2017 Regional Peer Review Peer Performance Measurement February 2019 Prepared by the Division of Planning & Market Development CONTENTS EXECUTIVE SUMMARY... 3 SNAPSHOT... 5 PEER SELECTION... 6 NOTES/METHODOLOGY...
Airport Profile Pensacola International
 Airport Profile Pensacola International 2015 BY THE NUMBERS Enplanements 808,170 Airport Pensacola International Airport (PNS) is located approximately three nautical miles northeast of the central business
Newbury Population ,071 1,941 3,719 4,038 5,337 5,611 5,805
 CHAPTER 3 DEMOGRAPHICS Demographic Profile Population Demographic information can provide essential insights into the composition of a community. As a result, it is a basic element of land use planning
The Economic Impact of Tourism on the District of Thanet 2011
 The Economic Impact of Tourism on the District of Thanet 2011 Prepared by: Tourism South East Research Unit 40 Chamberlayne Road Eastleigh Hampshire SO50 5JH CONTENTS 1. Summary of Results 1 2. Table of
The Economic Impact of Tourism New Forest Prepared by: Tourism South East Research Unit 40 Chamberlayne Road Eastleigh Hampshire SO50 5JH
 The Economic Impact of Tourism New Forest 2008 Prepared by: Tourism South East Research Unit 40 Chamberlayne Road Eastleigh Hampshire SO50 5JH CONTENTS Glossary of terms 1 1. Summary of Results 4 2. Table
Economic Impacts of Campgrounds in New York State
 Economic Impacts of Campgrounds in New York State June 2017 Report Submitted to: Executive Summary Executive Summary New York State is home to approximately 350 privately owned campgrounds with 30,000
Inverness, Culloden and Suburbs Settlement Economic Overview
 Strategic planning and research Economic information December 2007 Inverness, Culloden and Suburbs Settlement Economic Overview Summary Between 2001 and 2006, the population of Inverness, Culloden and
CONTACT INFORMATION - APPENDIX A
 CONTACT INFORMATION - APPENDIX A LOCAL ISSUING AUTHORITY For a complete list of the Local Issuing Authorities throughout Georgia go to www.gaswcc.org and click on E & S Information and then Local Issuing
2009 North Carolina Visitor Profile
 2009 Visitor Profile A publication of the Division of Tourism, Film & Sports Development August 2010 Division of Tourism, Film and Sports Development 2009 Visitor Profile 2009 Visitor Profile The Division
METROPOLITAN STATISTICAL AREA
 Miami-Fort Lauderdale-West Palm Beach METROPOLITAN STATISTICAL AREA Broward County is part of the 8th largest metropolitan statistical area (MSA)() in the country with a population just over 6M in 2016.
The Economic Impact of Tourism on Calderdale Prepared by: Tourism South East Research Unit 40 Chamberlayne Road Eastleigh Hampshire SO50 5JH
 The Economic Impact of Tourism on Calderdale 2015 Prepared by: Tourism South East Research Unit 40 Chamberlayne Road Eastleigh Hampshire SO50 5JH CONTENTS 1. Summary of Results 1 2. Table of Results Table
Youth Retention: July Value of post secondary education in regional settings. Prepared for Luminosity Youth Summit.
 Youth Retention: Value of post secondary education in regional settings Prepared for Luminosity Youth Summit July 2013 Prepared by MID NORTH COAST NSW Table of contents Table of contents... 2 Introduction...
Demographic Rankings
 demographics 82 Demographic Rankings Second highest level of educational attainment of major Canadian cities Calgary ranked #3 in Top 10 Places to Raise Kids Calgary ranked #19 in Overall Ranking MoneySense
Intercity Bus and Passenger Rail Study
 Intercity Bus and Passenger Rail Study Prepared for the Michigan Department of Transportation University of Michigan, College of Architecture and Urban Planning Intercity Bus and Passenger Rail Study Prepared
Figure 1.1 St. John s Location. 2.0 Overview/Structure
 St. John s Region 1.0 Introduction Newfoundland and Labrador s most dominant service centre, St. John s (population = 100,645) is also the province s capital and largest community (Government of Newfoundland
The Economic Contributions of Agritourism in New Jersey
 The Economic Contributions of Agritourism in New Jersey Bulletin E333 Cooperative Extension Brian J. Schilling, Extension Specialist in Agricultural Policy Kevin P. Sullivan, Institutional Research Analyst
The Economic Impact of Tourism on Scarborough District 2014
 The Economic Impact of Tourism on Scarborough District 2014 Prepared by: Tourism South East Research Unit 40 Chamberlayne Road Eastleigh Hampshire SO50 5JH CONTENTS 1. Summary of Results 1 2. Table of
Living on the edge: The impact of travel costs on low paid workers living in outer London executive summary. living on the edge 1
 Living on the edge: The impact travel costs on low paid workers living in outer London executive summary living on the edge 1 introduction key findings London has a world-class public transport system
Economic Impact Analysis. Tourism on Tasmania s King Island
 Economic Impact Analysis Tourism on Tasmania s King Island i Economic Impact Analysis Tourism on Tasmania s King Island This project has been conducted by REMPLAN Project Team Matthew Nichol Principal
The Economic Impact of Tourism in The Appalachian Region of Ohio. June 2014
 The Economic Impact of Tourism in The Appalachian Region of Ohio June 2014 Appalachia Region Tourism Summary Total Tourism Impact Appalachian Region Sales Wages Taxes Employment $4.9 billion $1.2 billion
Richard V. Butler, Ph.D. and Mary E. Stefl, Ph.D., Trinity University HIGHLIGHTS
 This study was prepared by Richard V. Butler, Ph.D. and Mary E. Stefl, Ph.D., Trinity University HIGHLIGHTS In 2017, the economic impact of San Antonio s Hospitality Industry was $15.2 billion. The San
The Economic Base of Colfax County, NM. PREPARED BY: The Office of Policy Analysis at Arrowhead Center, New Mexico State University.
 The Economic Base of Colfax County, NM PREPARED BY: The Office of Policy Analysis at Arrowhead Center, New Mexico State University DATE: July 2016 The Economic Base of Colfax County, New Mexico Introduction
The Economic Impact of Tourism Brighton & Hove Prepared by: Tourism South East Research Unit 40 Chamberlayne Road Eastleigh Hampshire SO50 5JH
 The Economic Impact of Tourism Brighton & Hove 2014 Prepared by: Tourism South East Research Unit 40 Chamberlayne Road Eastleigh Hampshire SO50 5JH CONTENTS 1. Summary of Results 1 1.1 Introduction 1 1.2
The Economic Impact of Tourism in The Appalachian Region of Ohio. June 2016
 The Economic Impact of Tourism in The Appalachian Region of Ohio June 2016 Appalachian Region tourism summary Total Tourism Impact Appalachian Region, Ohio Sales Wages Taxes Employment $5.3 billion $1.3
The Recruiting Landscape of Fabulous Las Vegas. The most dynamic city in the World >> 0 >> 1 >> 2 >> 3 >> 4 >> QUICK FACT:
 The Recruiting Landscape of Fabulous Las Vegas The most dynamic city in the World QUICK FACT: Only 3.6% of residents are true Native Nevadans 1 The DNA of Las Vegas Las Vegas People Population Ethnicity
Coordinated Population Forecast for Clackamas County, its Urban Growth Boundaries (UGB), and Area Outside UGBs
, and Area Outside UGBs") Coordinated Population Forecast for Clackamas County, its Urban Growth Boundaries (UGB), and Area Outside UGBs 2017-2067 Prepared by Population Research Center College of Urban and Public Affairs Portland
Coordinated Population Forecast for Clackamas County, its Urban Growth Boundaries (UGB), and Area Outside UGBs 2017-2067 Prepared by Population Research Center College of Urban and Public Affairs Portland
Impacts of Visitor Spending on the Local Economy: George Washington Birthplace National Monument, 2004
 Impacts of Visitor Spending on the Local Economy: George Washington Birthplace National Monument, 2004 Daniel J. Stynes Department of Community, Agriculture, Recreation and Resource Studies Michigan State
The 2001 Economic Impact of Connecticut s Travel and Tourism Industry
 The 2001 Economic Impact of Connecticut s Travel and Tourism Industry EXECUTIVE SUMMARY Fred V. Carstensen, Director Stan McMillen, Manager, Research Projects Murat Arik, Research Associate Hulya Varol,
Message from the Governor
 Message from the Governor Frank Keating Governor of the State of Oklahoma Oklahoma s aviation and aerospace industry has a proud heritage and plays a major role in the socioeconomic development of our
HEALTH SECTOR ECONOMIC INDICATORS REPORT
 HEALTH SECTOR ECONOMIC INDICATORS REPORT For: Mid North Coast Local Health District Report prepared by: April 2013 Table of Contents Introduction 3 Executive Summary 4 Output 5 Value-Added 7 Workforce
Government of Canada Survey of Heritage Institutions: 2015
 Government of Canada Survey of Heritage Institutions: 2015 1 This publication is available online at https://www.canada.ca/en/government/publications/dept.html Également disponible en français. Her Majesty
The Economic and Fiscal Impacts of the Renovation, Expansion, and Annual Operation of the Balsams Grand Resort and Wilderness Ski Area
 The Economic and Fiscal Impacts of the Renovation, Expansion, and Annual Operation of the Balsams Grand Resort and Wilderness Ski Area Prepared by: February 2015 bgottlob@poleconresearch.com Table of Contents
O.C.G.A GEORGIA CODE Copyright 2014 by The State of Georgia All rights reserved. *** Current Through the 2014 Regular Session ***
 O.C.G.A. 15-6-3 GEORGIA CODE Copyright 2014 by The State of Georgia All rights reserved. *** Current Through the 2014 Regular Session *** TITLE 15. COURTS CHAPTER 6. SUPERIOR COURTS ARTICLE 1. GENERAL
The Economic Impact of Tourism Eastbourne Prepared by: Tourism South East Research Unit 40 Chamberlayne Road Eastleigh Hampshire SO50 5JH
 The Economic Impact of Tourism Eastbourne 2016 Prepared by: Tourism South East Research Unit 40 Chamberlayne Road Eastleigh Hampshire SO50 5JH CONTENTS Page 1. Summary of Results 1 1.1 Introduction 1 1.2
Mäori Economy in the Waikato Region Summary
 Mäori Economy in the Waikato Region Summary 1 KEY OBSERVATIONS OF THE WAIKATO MÄORI ECONOMY Mäori make a significant contribution to the economy in the Waikato region. This executive summary highlights
VALUE OF TOURISM. Trends from
 VALUE OF TOURISM Trends from 2005-2015 March 2017 TABLE OF CONTENTS 1. Overview... 2 Key highlights in 2015... 2 2. Contributions to the economy... 4 TOURISM REVENUE... 5 Total revenue... 5 Tourism revenue
Houston Airport System Economic Impact Study
 GRA, Incorporated Economic Counsel to the Transportation Industry Houston Airport System Economic Impact Study Final Report June 30, 2011 Prepared by: GRA, Incorporated 115 West Avenue, Suite 201 Jenkintown,
IT S YOUR AREA. what s important? TYWYN AREA. WELL-BEING ASSESSMENT GWYNEDD AND MÔN Gwynedd and Môn Public Services Board
 IT S YOUR AREA. what s important? TYWYN AREA WELL-BEING ASSESSMENT GWYNEDD AND MÔN Gwynedd and Môn Public Services Board 2016 well-being assessment Gwynedd WANT to HAVE YOUR SAY? and Môn The new act has
MARASCO PLAZA NORTH VERSAILLES
 MARASCO PLAZA NORTH VERSAILLES 600 EAST PITTSBURGH MCKEESPORT BLVD NORTH VERSAILLES, PA 15137 Andreas Kamouyerou Associate Advisor 412.535.8062 Andreas.Kamouyerou@svn.com Bryan J. McCann Advisor 412.535.8061
Tourism Satellite Account Calendar Year 2016
 Tourism Satellite Account Calendar Year 2016 Key Definitions 1. Tourism/Tourist: Refers to the leisure travel/traveler segment. 2. Travel/Traveler: Includes both leisure and business travel/travelers.
Airport Profile Orlando-Sanford International Airport
 Airport Profile Orlando-Sanford International Airport 2015 BY THE NUMBERS 1,227,803 Enplanements 1,093,195 Passengers Orlando-Sanford International Airport (SFB) is an airport located in Sanford, Florida
Population, Territory and Sustainable Development The Case of the Caribbean Sub Region
 Population, Territory and Sustainable Development The Case of the Caribbean Sub Region Author: Godfrey St. Bernard Sir Arthur Lewis Institute of Social and Economic Studies The University of the West Indies
Frequently Asked Questions (FAQs) and Answers for HISD Teachers
 and Answers for HISD Teachers") 5177 Richmond Ave. Suite 800 Houston, TX 77056 713.625.9200 office 713.625.9292 fax www.fosterquan.com Frequently Asked Questions (FAQs) and Answers for HISD Teachers Permanent Residence 1. I would like
5177 Richmond Ave. Suite 800 Houston, TX 77056 713.625.9200 office 713.625.9292 fax www.fosterquan.com Frequently Asked Questions (FAQs) and Answers for HISD Teachers Permanent Residence 1. I would like
MONTEREY COUNTY TRAVEL IMPACTS P
 MONTEREY COUNTY TRAVEL IMPACTS 1992-2015P April 2016 Prepared for the Monterey County Convention and Visitors Bureau MONTEREY COUNTY TRAVEL IMPACTS, 1992-2015P Prepared for the Monterey County Convention
California: Housing Bellwether or Not?
 California: Housing Bellwether or Not? GSU Economic Forecasting Conference November 19, 2014 Robert A. Kleinhenz, Ph.D. Chief Economist,, LAEDC Outline Economic Comparisons: California Georgia Los Angeles
APPENDIX 8. Leeds Socio-Economic Baseline Report. Report. July Metro and Leeds City Council
 APPENDIX 8 Leeds Socio-Economic Baseline Report Report July 2009 Prepared for: Prepared by: Metro and Leeds City Council Steer Davies Gleave West Riding House 67 Albion Street Leeds LS1 5AA +44 (0)113