State of the Nation: tourism trends overview VIBE October Richard Nicholls, VisitBritain Laura Van Eeckhout, Foresight Factory
|
|
|
- Stella Simmons
- 6 years ago
- Views:
Transcription

1 State of the Nation: tourism trends overview VIBE October 2017 Richard Nicholls, VisitBritain Laura Van Eeckhout, Foresight Factory 1
2 Insights agenda 1. Inbound tourism update: recent trends and prospects 2. Future social / consumer trends for tourism from Foresight Factory 3. Highlights from recent VisitBritain inbound research 2


3 1. Inbound tourism update: recent trends and prospects Thursday, October 3 12, 2017
4 Jan-16 Feb-16 Mar-16 Apr-16 May-16 Jun-16 Jul-16 Aug-16 Sep-16 Oct-16 Nov-16 Dec-16 Jan-17 Feb-17 Mar-17 Apr-17 May-17 Jun-17 Jul-17 UK inbound: overall picture 20% 20% 19% 15% 13% 13% 14% 10% 7% 10% 9% 7% 6% 5% 0% -5% -1% 0% 1% 2% 1% 1% -3% 2% -2% July: first month to ever see 4 million inbound visits 2017 year to date: visits up 8%, spending up 9% August data out next Friday Source: International Passenger Survey provisional data 4
5 Where is growth coming from? By journey purpose % change vs 2016 LAST 3 MONTHS (MAY - JUL) Source: International Passenger Survey provisional data YEAR TO DATE (JAN - JUL 2017) Holiday 11% 19% Visit friends/relatives -2% 5% Business 0% -3% Miscellaneous -3% 7% Holidays! Up 19% on last year, setting new records But business visits 3% down Misc visits started the year well but slower recently By global region % change vs 2016 LAST 3 MONTHS (MAY - JUL) YEAR TO DATE (JAN - JUL 2017) EU15-5% 4% Other EU 12% 4% Rest of Europe 3% 14% North America 24% 21% Rest of World 12% 18% Long haul! North America up 21% Rest of World up 18% EU15 up 4% year to date although a decline in last 3 months 5
6 Holidays were slow for 2 years but picking up in 2017 Visits to the UK by journey purpose (000s) 16,000 14,000 12,000 10,000 8,000 6,000 4,000 2,000 0 Holiday (37%) VFR (31%) Business (24%) Misc. (8%) Source: International Passenger Survey 6
7 The spending challenge (before 2017) Year-on-year change in UK inbound visits and spending 16% 12% 8% 4% 0% -4% Visits Spend -8% Source: International Passenger Survey 7
8 Top inbound markets UK total: 2016 Rank Country Visits (000s) Source: International Passenger Survey Country Spending ( m) France 4,064 USA 3,354 USA 3,455 Germany 1,490 Germany 3,341 France 1,372 Ireland 2,897 Australia 1,060 Spain 2,397 Ireland 1,059 Netherlands 2,062 Spain 992 Italy 1,990 Italy 980 Poland 1,921 Switzerland 792 Belgium 1,048 Netherlands 714 Australia 982 Canada 633 Latest rolling year (Q Q1 2017): Q2 market level data out this Thursday Country Growth France 1% USA 7% Germany -3% Irish Republic 15% Spain 10% Netherlands 8% Italy 8% Poland 2% Belgium -4% Australia -6% Switzerland 9% Canada 23% Sweden -5% Denmark -3% Norway -13% India 2% UAE -2% China 0% Japan 36% Turkey 11% Malaysia 18% South Africa -14% Brazil -34% Russia -7% Saudi Arabia 2% 8
9 Regions and nations Visits to London and Rest of England both up by 4% in latest rolling year data Scotland up 3% and Wales up 14% Only North East down (vs. a strong 2015) Regions/nations and markets Q2 data out this Thursday! Latest rolling year (Q Q1 2017): Region Visits (000s) Growth Spending ( m) Total UK 38,356 4% 23,002 Scotland 2,750 3% 1,872 Wales 1,115 14% 451 London 19,665 4% 12,269 Rest Of England 16,065 4% 7,967 North East 554-5% 430 North West 2,877 7% 1,251 Yorkshire 1,369 5% 539 West Midlands 2,214 0% 871 East Midlands 1,284 10% 490 East Of England 2,447 11% 855 South West 2,508 3% 1,324 South East 5,227 1% 2,208 Source: International Passenger Survey, Q1 revised data 9

10 Competitors Total global overnight tourism up 6% N. Am +3% Europe +8% M. East +9% APAC +6% First half of 2017: UK +9% W. Europe +6% S. Europe +12% N. Europe +8% CE Europe +4% In 2016 international tourism to Europe grew only 2% (vs 4% to UK) Source: UNWTO 10

 Oct-Dec Eastern Europe +4% Northern Europe -1% Southern Europe +4% Western Europe +1% Middle East -3% North America +7% North East Asia")
11 Flight bookings suggest good prospects, but Past arrivals (% change YoY) Future bookings (% change YoY) Source: Forward Keys. Excludes flights booked direct with airlines. % change vs 2016 August % September % October % November % December % Oct-Dec % Jan-Mar % (% change YoY) Oct-Dec Eastern Europe +4% Northern Europe -1% Southern Europe +4% Western Europe +1% Middle East -3% North America +7% North East Asia +8% Oceania +26% South America +22% South Asia -3% South East Asia +18% Sub-Saharan Africa +2% U.S.A. +10% China +8% GLOBAL TOTAL +7% 11

12 2017 inbound full year forecast Visits: Up 6% to 39.7m Spending: Up 14% to 25.7bn Source: VisitBritain 12
13 Economic prospects Year on year growth in consumer spending: key inbound markets USA 2.7% 2.4% 2.0% Germany 1.6% 1.7% 1.4% France 1.3% 1.7% 1.5% Australia 2.5% 2.1% 2.4% Ireland 3.6% 2.6% 2.5% Spain 2.5% 2.3% 1.9% Italy 1.3% 0.9% 0.7% Netherlands 1.9% 1.5% 1.4% China 7.5% 7.1% 6.7% India 7.0% 8.8% 6.5% UK outlook: weak consumer spending projected for next 2 years GDP growth 1.7% 1.5% 1.6% Consumer spending 1.7% 0.7% 1.1% Inflation 2.7% 2.1% 1.7% Wage growth 2.0% 3.0% 3.0% Unemployment 4.7% 4.8% 4.8% Source: Oxford Economics 13
14 Jan-15 Feb-15 Mar-15 Apr-15 May-15 Jun-15 Jul-15 Aug-15 Sep-15 Oct-15 Nov-15 Dec-15 Jan-16 Feb-16 Mar-16 Apr-16 May-16 Jun-16 Jul-16 Aug-16 Sep-16 Oct-16 Nov-16 Dec-16 Jan-17 Feb-17 Mar-17 Apr-17 May-17 Jun-17 Jul-17 Aug-17 Sep-17 Oct-17 Sterling strengthens in September Value of US dollar and Euro against pound. Data til 6 th October Euro US dollar Source: Bank of England 14

15 2. The Future Travel Journey: the consumer trends that will shape tourism products in the next 5-10 years Laura Van Eeckhout Account Director, Foresight Factory 15

16 The Zeitgeist: The End of Uncertainty There is nothing permanent except change Heraclitus c.500bc 16
17 Australia Canada USA South Korea Denmark Sweden Germany GB Spain France Ireland Italy China India Indonesia Turkey South Africa Mexico Brazil Russia The Zeitgeist: The End of Uncertainty % agree: I am confident that the state will financially support me when I reach retirement age 100% 80% 60% 40% 20% 0% Source: FFonline Research 17
18 The Zeitgeist: The End of Uncertainty % of young adults (25-34s) living with their parents in the UK: 1 in 10 in 1995, 1 in 6 by % 20% 15% 10% 5% 0% Male Female In the US, living with parents has become the most likely living arrangement for young adults aged (for the first time in 130 years!) Source: Labour Force Survey, ONS, Pew US/FFonline UK 18
19 India GB France China USA Australia Germany Brazil S Africa The Zeitgeist: The End of Uncertainty I think my current job could be done by computer programs / robots / artificial Intelligence in 10 years time or less % of 16-25s who agree strongly or agree 100% 80% 60% 40% 20% 0% Source: FFonline Research 19
20 The Zeitgeist: The End of Uncertainty Consumers in flux: Global device preference shows a growing preference for mobile devices Preference for mobile devices Communicating via social network Checking a social network Updating a social network Comparing prices Preference for desktop devices Online banking Watching TV on demand Watching live TV Buying online Source: FFonline Research 20
21 Discover England Fund Trends report Purpose: identify the key social, consumer, technological etc. trends which will have a direct impact on the needs, motivations and behaviours of international tourists to England in the years to come How do these trends vary by market and by demographics? What is the size/importance/growth potential of each? What are the implications of those trends for the development of new product such as itineraries, attractions, destination groupings, accommodation, services etc.? Identify examples of best practice product development (tourism or related areas e.g. the wider leisure field) form around the world exemplifying the trends identified Insights drew on Foresight Factory s proprietary quantitative research as well as qualitative research (expert interviews and trendspotters) commissioned for the project. 21


22 Output: report and toolkit 22


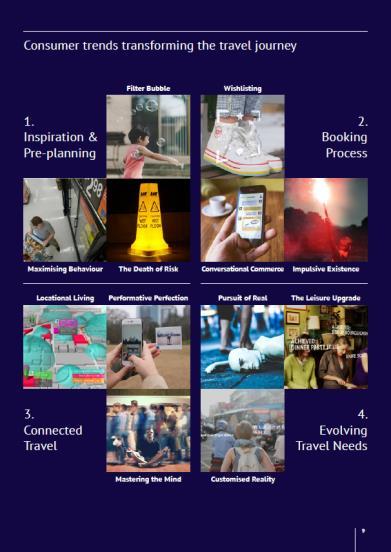
23 Trends transforming the customer journey 1. Inspiration & Pre-Planning 4. Evolving Travel Needs 2. Booking Process 3. Connected Travel 23

24 1. Inspiration & Pre-Planning Filter Bubble Maximising Behaviour The Death of Risk 24

25 Canada USA South Korea Australia Japan Spain France Finland Denmark Italy Ireland Sweden Poland Netherlands Germany GB Czech Rep Malaysia Russia Mexico Thailand Brazil Turkey South Africa China India Indonesia Trend: Filter Bubble Despite the endless resource offered by the internet, future travellers will live in a filter bubble created by personalisation algorithms and homogenous social networks. Tourism products will have to work hard to stay on the traveller s radar. 100% 80% 60% 40% 20% 0% Source: FF Online Research How interested would you be in a service that suggested a holiday and itinerary of activities based on your interests and budget? % who are interested VisitDenmark draws attention to attractions by using the on-trend #hygge hashtag 25
26 South Korea Australia Canada USA Ireland Spain Italy Hungary Czech Rep Poland France Germany GB Finland Denmark Sweden Netherlands Russia China South Africa Turkey Mexico Brazil Indonesia India Trend: The Death of Risk With limited budget and holiday time available, future travellers want to find out as much as possible about their destination before getting there. They expect travel providers to empower them by providing enough upfront information about tourism products. It s getting easier and easier to see what places look like, to hear about other people s experiences prior to your travel. I think that s why places that used to be fairly non-ubiquitous are becoming more and more popular tourism destinations. When I plan a trip abroad, I find out as much as I can about the destination before I go % who agree or agree strongly 100% 80% 60% 40% 20% 0% NICK LARSON, HEAD OF PLATFORM AT TIMELOOPER Source: FF Online Research 26

27 Helping tourists avoid FOMO The Margaret River Region has curated a number of tours and itineraries to make sure guests don t miss out on local gastronomy spots A lot of people will do a fair bit of research to make sure they don t waste any time. I didn t that once and spent the entire weekend feeling as though I was missing out on something, but couldn t quite put my finger on what. Since then I ve done fairly thorough research for every trip I ve gone on. FEMALE, 27, SWEDEN 27

28 2. The Booking Process Wishlisting Conversational Commerce Impulsive Existence 28

29 South Korea USA Australia Canada Italy Spain Netherlands GB Ireland Poland Czech Rep Sweden Hungary France Finland Germany Denmark Indonesia China India Turkey Mexico Brazil South Africa Russia Trend: Wishlisting Future travellers will expect to be able to more easily take the step from inspiration to purchase, by shopping directly from wishlists and a range of new interfaces such as smart TVs. 100% 80% % of consumers who attach high value to sharing or collecting images online of things I like/things that represent my lifestyle 60% 40% Starwood Hotels have enabled booking through its Instagram feed on posts created by influencers invited to the Paris hotels. 20% 0% Source: FF Online Research 29

30 Trend: Conversational Commerce Making enquires about or booking tourism products will be easier than ever for future travellers, as they won t even have to leave their own messaging apps to do so. There will be less need for tourism products to develop their own expensive apps or websites. Interrail is using Facebook Messenger and WhatsApp to communicate with travellers planning or currently on an Interrailing trip We communicate with our travel agent via WhatsApp and send everyone the info of the trip also via WhatsApp. I won t sign into any website but would go through this conversational process with a trusted partner, then later on go to the agency just to swipe the credit card. MALE, 64, GERMANY 30

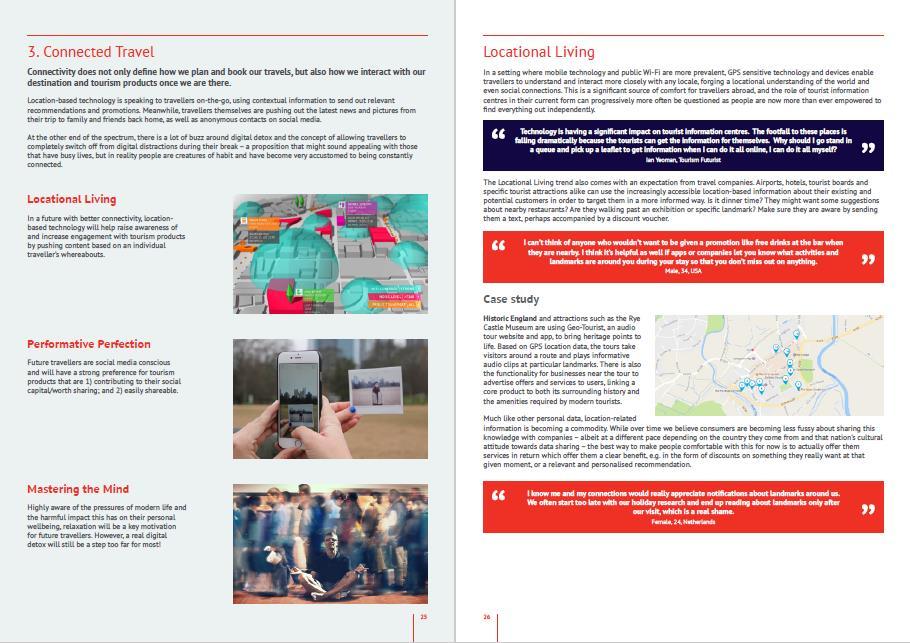
31 3. Connected Travel Locational Living Performative Perfection Mastering the Mind 31

32 Australia South Korea USA Canada Czech Rep Sweden Italy Denmark France GB Finland Ireland Spain Netherlands Hungary Germany Poland Mexico South Africa Indonesia Brazil India Turkey Russia China Trend: Locational Living Location-based technology will help raise awareness of and increase engagement with tourism products by pushing content based on an individual traveller s whereabouts. Geo-Tourist is an audio tour site and app that uses GPS data to play informative audio clips around touristic routes and advertise nearby offers and services to users % who are interested or very interested in a service/ device that detected your location and suggested interesting things to spontaneously see and do in the nearby area 100% 80% 60% 40% 20% 0% Source: FF Online Research 32

33 Japan USA Australia Canada South Korea Poland Sweden GB France Italy Spain Finland Germany Ireland Denmark Czech Rep Netherlands China Russia Indonesia Turkey India Thailand Malaysia Brazil Mexico South Africa Trend: Performative Perfection Travellers are looking for tourist products that can boost their social capital when sharing images or stories about them on social media platforms. I wish I could be more like the person I describe myself as on social media % who agree or strongly agree 100% 80% 60% 40% Checking in and sharing this on Facebook is seen as a status symbol and people usually only check in at glamorous, non-trivial places and when doing something special. FEMALE, 27, FRANCE 20% 0% FF Online Research Base: All social networkers among online respondents per country aged (Indonesia & S. Africa 16-54), 2016 February 33

34 4. Evolving Travel Needs Pursuit of Real The Leisure Upgrade Customised Reality 34

35 Australia South Korea Canada USA France Poland Spain Denmark Ireland Italy Finland Czech Rep Sweden Netherlands Germany Hungary GB China Turkey India Mexico Indonesia Brazil South Africa Russia Trend: Pursuit of Real Genuine, authentic tourism products are preferred by future travellers as they seek to get rid of their tourist stamp and experience their destination like a local instead. I believe people always mix and match both touristy and authentic local things depending on how much time they have at a destination. If I go to Paris I love finding a good local restaurant loved by the locals but still go and take a selfie at the Eiffel tower. When I go on holiday, the most important thing for me is to experience the authentic culture of a place % who agree strongly or agree 100% 80% 60% 40% 20% 0% MALE, 28, GERMANY Source: FF Online Research 35

36 Trend: Customised Reality New technologies (e.g. AR, VR, hearables) can be used to bring to life and personalise experiences for more demanding future travellers. By bringing VR to the actual historical locations, TimeLooper aims to create a level of immersion and empathy that could not be achieved through VR experiences for domestic use Which of the following kinds of apps do you use at least once a month? Augmented reality apps (e.g. Pokémon Go) 100% 80% 60% 40% 20% 0% China Spain USA France Sweden GB Source: FF Online Research 36

37 Which trends do you think are most important? Pick your top 3! 37
38 3. Highlights from recent VisitBritain inbound research Thursday, October 38 12, 2017
39 Recent analysis 39
40 Recent analysis 40

41 VisitBritain/DEFRA food research programme Builds on VB food research published last year Aim : understand current awareness and perceptions of Britain s food and drink offer. Create benchmarks from which we can track performance. Quantitative research in Australia, China, France, Germany, Gulf, India, Japan, USA Understand best practice examples of food tourism product development from around the world Case studies research Quantitative highlights and full case studies report available on 41

42 Food and tourism Although food features in most people s holidays abroad, it is only a decisive factor in planning for a minority. People who factor food into their travel decisions tend to be younger, more adventurous and have better views of British food. Age group Likes to try local food abroad Previous visits to Britain Britain offers good food options Source: VisitBritain/DEFRA 42

43 Perceptions of food and drink offer % selecting UK 57% 35% 35% 35% 31% 18% 29% 12% 12% Source: VisitBritain/DEFRA 43

44 Perceptions of British food Net: Agree by market British food products are good quality Britain is a good place to try local specialities 59% Total 56% 43% 37% 76% 29% 68% 90% 58% 71% 45% 36% 68% 29% 57% 85% 53% 72% Source: VisitBritain/DEFRA 44


45 Awareness of British products Top product per market: Whisky Baked goods Whisky Baked goods Whisky Baked goods Whisky Baked goods Source: VisitBritain/DEFRA. Which, if any, of the following food and drink items would you associate with the UK? 45

46 Recent analysis 46
47 Business visits: context 10,000 8,000 6,000 4,000 2,000 0 UK Business Visits and Spend Visits (000) Spend ( m) In 2016, 9.2 million business visits to the UK With these visitors spending 5.5 billion Both setting records Although 2017 Jan-Jul shows business visits down 3% But who are these visitors? Source: International Passenger Survey 47
48 Top markets Market Visits (2016) % Share Poland 872,000 9% Germany 860,000 9% France 841,000 9% USA 688,000 7% Netherlands 658,000 7% Irish Republic 649,000 7% Romania 519,000 6% Spain 476,000 5% Italy 365,000 4% Belgium 288,000 3% Nine of the top ten in terms of visits are European near neighbours But spending shows a different picture: visitors from the USA spent just over 1bn, 19% of all spending by business visitors Australia, India and Switzerland also make the spending top ten This doesn t include the value of the wider economic benefits to hosting business events Source: International Passenger Survey 48
49 Business visitors in more detail All visitors in the UK in 2016 for business were asked a follow up question to capture the main business event on their business trip. The following categories were asked: Meeting 1-5 people Meeting 21+ people Exhibition/ Trade Show Training/ Development Meeting 6-20 people Conference/ Convention Incentive/ Team Building Other 49
50 Business event type Meeting 1-5 people Meeting 6-20 people Meeting 21+ people Conference/Convention Training/Development Exhibition/Trade Show Incentive/Team Building 40% 1% 2% 4% 6% 21% 6% 20% Business visit type Length of stay Spend per visit Meeting 1-5 people Meeting 6-20 people Meeting 21+ people 3.9 1,035 Conference/Convention Training/Development 7.7 1,032 Exhibition/Trade Show Incentive/Team Building 4.7 1,015 Other Other visits, by mode of transport: 8% 7% Other Lorry Source: International Passenger Survey/VisitBritain 85% Private Vehicle 50
51 Spotlight on Conferences and Exhibitions 62% of the visits to conferences/conventions and exhibitions in 2016 were to London Excluding London, England hosted 30% of visitors from conferences/conventions in 2016, Scotland 6% and Wales 1% Scotland 32,600 6% North East 2,600 1% Top market: USA (88,000 visitors, spending 132m (18% of total) Jan-Mar Apr-Jun Jul-Sep Oct-Dec 23% 27% 20% 30% North West 31,700 6% West Midlands 51,100 6% Wales 6,400 1% South West 13,500 3% Yorkshire 4,800 1% East Midlands 13,900 2% East of England 27,000 5% London 407,600 62% South East 43,300 7% Source: International Passenger Survey/VisitBritain 51
52 Recent analysis 52
53 Multi country trips TOTAL UK (overnight visitors only) Only visited the UK on this trip Stayed in another country before arriving in UK Stayed in another country after leaving the UK Stayed in another country before and after UK Visits (000) 35,814 28,332 1,298 1,348 1,554 Spend ( m) 22,384 17, % of inbound visits to the UK in 2016 included an overnight visit to another country before or after their time in the UK 4% stayed at least 1 night in another country before arriving in the UK 4% were going onto another country after the UK before finally returning home 5% of visits included another country before and after the UK leg of their trip Those who were planning a visit to at least another country after the UK (and before returning home) had the highest average spend Source: International Passenger Survey/VisitBritain 53
54 Multi country trips by journey purpose 6% 5% 32% 33% 18% 14% 27% 26% 23% 24% 12% 17% 5% 15% 41% 38% 36% 41% 42% 37% Total overnight visitors Neither before nor after Yes, before only Yes, after only Yes, before and after Misc. Study VFR Business Holiday Holiday visitors are more likely than the average to be on a multi country trip. The reverse is true for VFR visitors. A high proportion of those staying somewhere both before and after their UK stay were for business. Further analysis shows many of these were European based lorry drivers delivering and picking up goods in the UK. Source: International Passenger Survey/VisitBritain 54
55 Multi country trips by market (holidays only) Market Neither before nor after Yes, before only Source: International Passenger Survey/VisitBritain Yes, after only Yes, before and after Germany 96% 2% 1% 1% France 98% 1% 1% 0% Netherlands 97% 1% 1% 1% Italy 96% 2% 1% 1% Irish Republic 96% 3% 1% 0% Spain 97% 1% 1% 1% Sweden 93% 2% 3% 2% Switzerland 93% 3% 2% 2% Norway 97% 1% 1% 0% Belgium 96% 2% 2% 0% Denmark 97% 1% 0% 2% Poland 92% 1% 1% 6% Austria 95% 1% 1% 2% Portugal 96% 3% 1% 0% Market Neither before nor after Yes, before only Yes, after only Yes, before and after USA 68% 10% 13% 9% Canada 68% 13% 12% 6% Brazil 53% 11% 9% 26% Market Neither before nor after Yes, before only Yes, after only Yes, before and after Australia 46% 15% 16% 24% India 68% 8% 12% 13% UAE 82% 5% 10% 3% China 73% 9% 9% 9% Hong Kong 70% 10% 11% 9% Japan 76% 6% 9% 9% Saudi Arabia 82% 4% 7% 8% Singapore 60% 19% 11% 11% 55
56 Recent analysis 56
57 Using social media on holiday 44% Keep in touch with home 25% To let people know where I am 30% Look for eating / drinking recomme ndations 20% Ask for advice on where to go / what to do 39% Post / upload photos 23% To plan / decide where to go 29% Share where you are / what you are doing 19% Share advice or recommen dation 29% Have not used social media on holiday Keeping in touch with friends and family back home is the key reason that most people say they use social media when on holiday. Sharing is also important; over a third are likely to post photos whilst on holiday, 29% sharing what they are doing, 19% sharing recommendations. Social media is also used as a way of getting information on holiday, as 30% have used it to get recommendations on places to eat or drink, 23% to help them plan where to go, and 20% to ask for advice on what to do or where to go. A smaller proportion (19%) would share their own advice or recommendations whilst on holiday. Source: VisitBritain. Have you used social media in any of the following ways whilst on your last holiday to Britain / your last holiday to a foreign destination? 57
58 Using a smartphone to access reviews Have done on holiday Not done, but interested % have used, or interested in using a smartphone to access reviews about attractions / places to see on holiday 18% 25% 23% 21% 22% 25% 25% 26% 26% 25% 28% 22% 30% 30% 22% 23% 35% 22% 55% 77% 52% 71% 24% 31% 41% 50% 71% 65% 35% 29% 46% 55% 50% 63% 60% 63% 64% 51% 52% 66% AUS BRA CAN CHI DEN FRA GER IND ITA JAP NET NZ NOR RUS SAU KOR SPA SWE UAE USA % have used, or interested in using, a smartphone to access reviews about places to eat or drink on holiday 18% 29% 26% 18% 25% 25% 50% 75% 27% 24% 26% 25% 26% 27% 31% 26% 21% 23% 40% 51% 66% 21% 29% 37% 50% 69% 68% 24% 32% 28% 34% 53% 53% 59% 63% 60% 62% 52% 48% 68% AUS BRA CAN CHI DEN FRA GER IND ITA JAP NET NZ NOR RUS SAU KOR SPA SWE UAE USA Source: VisitBritain. Which of the following have you done on holiday? 58

59 Recent analysis 59
60 Visitor Experience Report Four topics, based on face to face surveys of visitors to the UK: Welcome: How welcome did visitors feel in Britain? Recommendation: Would visitors recommend a trip to Britain? Satisfaction: with various elements of a trip to Britain Expectations: How did various aspects of visitors trips to the UK meet expectations? 60
61 Overall Visitor Satisfaction Satisfaction with the following aspects during trip to UK: Very satisfied Quite satisfied Neither Quite dissatisfied Very Dissatisfied Top 2 box (% Very/Quite satisfied) 63% 58% 29% 29% 7% 9% 39% 39% 17% 4% 14% 26% 34% 20% Attractions/Activities Transport Food & Drink Value for Money 6% 92% 88% 78% 41% Britain's attractions and activities drove the strongest satisfaction scores with over 9 in 10 visitors satisfied and 63% very satisfied. Britain s public transport also delivered high overall satisfaction. Satisfaction with British food & drink was generally positive though behind attractions and public transport. Value for money was rated lowest, although this research was conducted before the fall in the value of the pound mid Source: International Passenger Survey/VisitBritain, Q: How satisfied were you with your visit to the UK for Food & Drink, Public Transport, Attractions/activities, Value for Money?. On a scale of 1-5. Base: Visitors staying 1+ night in Britain, excludes UK nationals (expats) n=35,593 61
62 Visitor satisfaction by region Amongst holiday visitors to each region Attractions / Activities Public Transport Food & Drink Value for money UK Average 65% 62% 39% 14% LONDON 68% 64% 39% 13% NORTH EAST 52% 58% 34% 20% NORTH WEST 63% 54% 41% 22% YORKSHIRE 62% 47% 35% 22% WEST MIDLANDS 62% 50% 40% 13% EAST MIDLANDS 62% 62% 33% 18% EAST OF ENGLAND 56% 52% 36% 12% SOUTH WEST 50% 43% 36% 11% SOUTH EAST 53% 51% 31% 10% SCOTLAND 66% 61% 48% 23% WALES 54% 48% 35% 23% There is a clear North-South divide on value for money perceptions with the North East, North West and Yorkshire, as well as Scotland and Wales, above average Scotland leads on food&drink London scores highest for attractions and public transport, but value for money is below average. Source: International Passenger Survey/VisitBritain. As some visitors stayed in multiple regions, the data is based on the region each visitor first stayed in. 62
63 AUS BELG BRAZ CAN CHI DEN FRA GER HK INDIA IRE ITA JAP NETH NZ NOR POL POR RUS SAU SING SAF S.K. SPA SWE SWI TUR UAE USA TOT Visitor satisfaction by market Level of Satisfaction (% very satisfied) Attractions 67% 51% 78% 70% 64% 67% 52% 60% 49% 65% 66% 68% 59% 51% 61% 67% 68% 75% 80% 73% 55% 70% 71% 61% 61% 57% 65% 67% 74% 63% Transport 62% 50% 79% 68% 51% 57% 47% 51% 33% 70% 64% 71% 38% 47% 69% 55% 63% 64% 65% 74% 48% 72% 63% 52% 54% 46% 67% 67% 69% 58% Food & Drink Value for Money 43% 29% 55% 52% 34% 44% 29% 34% 30% 50% 50% 26% 34% 33% 49% 47% 40% 31% 56% 60% 38% 55% 33% 25% 36% 41% 41% 60% 53% 39% 15% 10% 15% 15% 22% 25% 11% 7% 12% 20% 18% 9% 12% 11% 16% 26% 18% 10% 25% 28% 11% 14% 24% 8% 15% 17% 14% 25% 20% 14% Source: International Passenger Survey/VisitBritain. How satisfied were you with your visit to the UK for Food & Drink, Public Transport, Attractions/activities, Value for Money?. On a scale of 1-5. Base: Visitors staying 1+ night in Britain, excludes UK nationals (expats) n=35,593 63
64 State of the Nation: tourism trends overview VIBE October 2017 Richard Nicholls, VisitBritain Laura Van Eeckhout, Foresight Factory 64
The Visitor Experience in Britain
 The Visitor Experience in Britain Welcome, Expectations, Satisfaction & Recommendation Foresight issue 154 VisitBritain Research 1 Contents 1. Introduction 2. Summary 3. Britain s Welcome (CAA Passenger
Tourism Performance and Trends. Sharon Orrell November 2017
 Tourism Performance and Trends Sharon Orrell November 2017 1 The last decade in domestic overnight tourism Trips (m) 55 50 45 40 35 30 25 20 15 10 5 Domestic Overnight Tourism in England Rolling 12 Month
Understanding Business Visits
 Understanding Business Visits Foresight issue 153 VisitBritain Research 1 Contents Introduction Summary and Highlights Business Visits in Context UK Business visits and spend Averages Duration of stay
State of the Nation. Richard Nicholls and Keri Portas, VisitBritain October 2016
 State of the Nation Richard Nicholls and Keri Portas, VisitBritain October 2016 1 State of the Nation 1. Inbound picture latest update 2. Medium/long term view 3. Inbound prospects for Q4 2016 and beyond
Booking a holiday. Foresight issue 151. VisitBritain Research
 Booking a holiday Foresight issue 151 VisitBritain Research 1 Contents 1. Introduction 2. Summary 3. How are travel and accommodation booked? 1. Booked separately or together 2. Booked direct with provider
Latest Tourism Trends. Humphrey Walwyn Head of VisitEngland Research
 Latest Tourism Trends Humphrey Walwyn Head of VisitEngland Research 1 Inbound Tourism 2 2003 2004 2005 2006 2007 2008 2009 2010 2011 2012 2013 2014 2015 2016 2017 UK inbound long term trend Spend per visit
% change vs. Dec ALL VISITS (000) 2,410 12% 7,550 5% 31,148 1% Spend ( million) 1,490 15% 4,370-1% 18,710 4%
 2,410 12% 7,550 5% 31,148 1% Spend ( million) 1,490 15% 4,370-1% 18,710 4%") HEADLINES FULL YEAR 2012 (PROVISIONAL) 1 Overall visits 31.148 million visits making 2012 the best year for inbound tourism since 2008 but not a record. 1% increase in visits on 2011 (30.798 visits) slightly
HEADLINES FULL YEAR 2012 (PROVISIONAL) 1 Overall visits 31.148 million visits making 2012 the best year for inbound tourism since 2008 but not a record. 1% increase in visits on 2011 (30.798 visits) slightly
VisitBritain Decisions and Influences. December 2016
 VisitBritain Decisions and Influences December 2016 RESEARCH BACKGROUND Contents 1. Research Background 2. Britain & Competitors 3. Holiday Research and Planning 4. Holiday Booking 5. Appendix 2 Research
Domestic tourism in 2017
 Domestic tourism in 2017 1 2017 was a good year for domestic holidays in England Holiday trip volume equalled the record previously set in 2009 Holiday trip expenditure equalled the record previously set
Who we spoke to. Long haul travellers across 15 of Australia s key tourism markets
 Who we spoke to Long haul travellers across 15 of Australia s key tourism markets Importance factors for destination choice Read as: 16% of respondents rate exciting events, local festivals and celebrations
Latest market insights and marketing plans from VisitBritain/VisitEngland. Anke Monestel, VisitEngland 8 th February 2018
 Latest market insights and marketing plans from VisitBritain/VisitEngland Anke Monestel, VisitEngland 8 th February 2018 1 Inbound tourism trends 2 Friday, February 9, 2018 2003 2004 2005 2006 2007 2008
Regional Spread of Inbound Tourism. VisitBritain Research, August 2018
 Regional Spread of Inbound Tourism VisitBritain Research, August 218 1 Contents Introduction Summary Key metrics by UK area Analysis by UK area Summary of growth by UK area Scotland Wales North East North
An overview of Tallinn tourism trends
 An overview of Tallinn tourism trends August 2015 The data is collected from Statistics Estonia, Tallinn Airport and Port of Tallinn. In August 2015, 179,338 stayed overnight in Tallinn s accommodation
TripAdvisor Workshop Christchurch 7 June 2016
 TripAdvisor Workshop Christchurch 7 June 2016 TripAdvisor: The World s Largest Travel Site 1 M I L L I O N Reviews & Opinions 3402005 MILLION 2000 Unique visitors a month M I L L I O N 350 r e vie w s
THE GROWTH OF THE HOSPITALITY INDUSTRY IN DUBAI
 THE GROWTH OF THE HOSPITALITY INDUSTRY IN DUBAI THE DEFINITION OF TOURISM Tourism is travel for recreational, leisure or business purposes. The World Tourism Organization defines tourists as people "traveling
INTERNATIONAL TRAVEL AND TOURISM
 INTERNATIONAL TRAVEL AND TOURISM YEAR 2014 1. INTRODUCTION This issue of the Economic and Social Indicators presents data on International Travel and Tourism for the year 2014. A brief on the compilation
Outlook for International Inbound Travel to North America - The International Marketplace: What's Happening?
 University of Massachusetts Amherst ScholarWorks@UMass Amherst Tourism Travel and Research Association: Advancing Tourism Research Globally 2014 Marketing Outlook Forum - Outlook for 2015 Outlook for International
Intra-African Air Services Liberalization
 Intra-African Air Services Liberalization James Wiltshire Senior Economist, www.iata.org/economics To represent, lead and serve the airline industry Aviation connects African businesses to world markets
IMD World Talent Report Factor 1 : Investment and Development
 THAILAND 2012 2013 2014 2015 2016 Overall Investment & Development Appeal Rank 2016 37 42 24 Readiness 49 of 61 Factor 1 : Investment and Development Total Public Expenditure on Education Percentage of
United Kingdom: Tourism Market Insights 2017
 United Kingdom: Tourism Market Insights 2017 Overview This tourism report provides an outlook on key market insights on a global, national and provincial scale for the United Kingdom (UK). In addition,
Global robot installations: high double digit growth rates
 ' of units Global robot installations: high double digit growth rates 5 45 4 35 3 25 2 15 1 5 113 6 Estimated annual worldwide supply of industrial robots 28-216 and 217-22* +15% on average per year 121
Tourism Snapshot A focus on the markets in which the CTC and its partners are active
 Tourism Snapshot A focus on the markets in which the CTC and its partners are active www.canada.travel/corporate January 214 Volume 1, Issue 1 Key highlights Total arrivals from CTC s international markets
Latest Hotels.com research reveals Chinese travellers want more of everything more time travelling, more locations and more exotic experiences
 Life in the FIRST lane Chinese travellers swap old habits for new first time experiences July 25, 2017 Latest Hotels.com research reveals Chinese travellers want more of everything more time travelling,
Steve Smith Director Cargo Supply Chain Management
 IATA e-freight project status Steve Smith Director Cargo Supply Chain Management Contents 1. Introduction: Vision and Board Mandate 2. Current Performance 3. 2010 progress to increasing e-freight capability:
Activities in Britain s nations and regions
 Activities in Britain s nations and regions Foresight issue 165 VisitBritain Research January 2019 1 Contents Please note: underlined text can be used to navigate through this document Introduction UK
Prospects for international tourism
 Prospects for international tourism Project LINK UN DESA Expert Group Meeting on the World Economy, NYC, USA 24-26 October 211 John G.C. Kester Programme Manager, Tourism Trends and Marketing Strategies
The Nordic Countries in an International Comparison. Helga Kristjánsdóttir 20. apríl 2012
 The Nordic Countries in an International Comparison Helga Kristjánsdóttir 20. apríl 2012 15 Figure 1. World Bank, GDP growth (annual %) 10 5 0 1961 1963 1965 1967 1969 1971 1973 1975 1977 1979 1981 1983
Life in the FIRST lane Chinese travellers swap old habits for new first time experiences
 Life in the FIRST lane Chinese travellers swap old habits for new first time experiences July 25, 2017 Life in the FIRST lane Chinese travellers swap old habits for new first time experiences Latest Hotels.com
Sprint Real Solutions VPN SDS International Rates from the U.S. Mainland, Hawaii, Puerto Rico, and the U.S. Virgin Islands 1*
 1* The international rates below apply to calls from the U.S. Mainland, Hawaii, Puerto Rico, and the U.S. Virgin Islands where available. The rates, which are shown below in full minute increments, are
Global Travel Trends 2005
 Preliminary World Travel Monitor Results from IPK international for the ITB Berlin Message, 03/10/06 Global Travel Trends 2005 Based on the new data from the 2005 World Travel Monitor, and as it does every
SOUTHERN AFRICA TRAVEL AND TOURISM BAROMETER REPORT 2015
 SOUTHERN AFRICA TRAVEL AND TOURISM BAROMETER REPORT 2015 1 Contents 1. TOURISM TRENDS: GLOBAL AND SOUTHERN AFRICA S MARKET SHARE IN AFRICA... 4 1.1. TOURIST ARRIVALS... 4 1.1.1. Global Tourist Arrivals
BUSINESS BAROMETER December 2018
 Credit: Chris Orange BUSINESS BAROMETER December Credit: Nigel Moore 1 Contents Summary of findings 3 Annual monthly performance: visitor attractions..4 Visit Herts Team update 5 National context.8 Visitor
Source: Statistics New Zealand International Visitor Arrivals. Aug Visitors aged year old.
 1 2 Source: Statistics New Zealand International Visitor Arrivals. Aug 2015. Visitors aged 18-29 year old. 3 4 Desktop Research (IVA) Who are our current Youth visitors? Arrivals (k) Stay Days (m) Expenditure
MARKET REPORT. Auckland Hotel Market Outlook
 MARKET REPORT Auckland Hotel Market Outlook SEPTEMBER 2018 Auckland Hotel Market Outlook Market Report - September 2018 Auckland Hotel Market Outlook With the high (summer) season approaching, it won t
FINLAND. Table 1. FDI flows in the host economy, by geographical origin. (Millions of US dollars)
") Table 1. FDI flows in the host economy, by geographical origin World 3 732 8 046 3 319 2 823 4 750 7 652 12 451-1 144 718 7 359 2 550 4 158 Developed economies 3 638 8 003 2 382 2 863 4 934 7 258 12 450-855
Table 1. FDI flows in the host economy, by geographical origin World 3 732 8 046 3 319 2 823 4 750 7 652 12 451-1 144 718 7 359 2 550 4 158 Developed economies 3 638 8 003 2 382 2 863 4 934 7 258 12 450-855
78 MILLION 150, domains in 28 languages LARGEST TRAVEL SIT E IN THE WORLD MIL LION.
 1 # LARGEST TRAVEL SIT E IN THE WORLD 225 MIL LION reviews & opinions 340 unique visitors a month businesses listed * MILLION 4.9 MILLION 78 MILLION members 150,000+ destinations 139 user contributions
Premier Vision. October 2017
 Premier Vision October 2017 Contents Tax Free Trends Summary 03 Tax Free Sales Trends 05 Tax Free Sales by Destination and Source 07 Top 5 Visitor Nations per Destination Country 09 Currency Trends 11
FACTS & FIGURES ISE 2016
 FACTS & FIGURES ISE 2016 The first four-day Integrated Systems Europe exhibition was an unqualified success. In drawing over 65,000 registered attendees to interact with over 1,100 exhibitors it officially
Outlook for air travel markets
 Outlook for air travel markets June 2016 Brian Pearce Chief Economist International Air Transport Association Extended period of strong air travel market growth 30% 25% 20% 15% 10% 5% 0% -5% -10% -15%
State of the Aviation Industry
 State of the Aviation Industry Presentation to the ACI Airport Economics & Finance 10 th 11 th February London, United Kingdom Laurie N. Price Director of Aviation Strategy Mott MacDonald Aviation Current
Tourism Towards 2030 Preview of findings
 Tourism Towards 23 Preview of findings 54th meeting of the UNWTO Commission for the Americas 11 September 212 Quito, Ecuador Carlos Vogeler Regional Director for the Americas World Tourism Organization
MARKET NEWSLETTER No 57 January 2012
 OVERVIEW OF INTRA-EUROPEAN UNION TRADING BETWEEN 2007/08 AND 2010/11 The data on intra-eu trade reported in this month s newsletter have been taken from the EUROSTAT database. However, it is important
Pistachio Industry Inventory Shipment Report Pounds Crop Year
 Pistachio Industry Inventory Shipment Report Pounds March 2017 Year to Date Summary - Pounds 2016-2017 Crop Year Open Inshell AO Closed Shell Shelling Stock Total 8/31/16 Carryover 46,956,408 41,224,713
1.0 Introduction Zambia s Major Trading Partners Zambia s Major Export Markets... 4
 Bank of Zambia CONTENTS 1.0 Introduction... 3 2.0 Zambia s Major Trading Partners... 3 3.0 Zambia s Major Export Markets... 4 4.0 Major Source Countries Of Zambia s Imports... 5 5.0 Direction Of Trade
Asian stopovers in Nordic countries Optimistic perspectives. March 2018
 Asian stopovers in Nordic countries Optimistic perspectives March 2018 OUR COMMITMENT IS TO HAVE THE MOST PRECISE, UP-TO-DATE MARKETDATA ON TRAVELLERS JOURNEYS 30.238.647 Travellers monitored each day
Regional Spread of Inbound Tourism
 Regional Spread of Inbound Tourism Foresight issue 164 VisitBritain Research, January 2019 1 Contents Introduction Summary Key metrics by UK area Analysis by UK area Summary of growth by UK area Scotland
Tourism Snapshot A focus on the markets that the CTC and its partners are active in
 Tourism Snapshot A focus on the markets that the CTC and its partners are active in www.canada.travel/corporate February 2011 Volume 7, Issue 2 Key highlights In the first two months of 2011 overnight
2012 Coach & Charter Seminar. 21 February 2012 Presented by Amanda Coghlan Strategic Insights Analyst
 2012 Coach & Charter Seminar 21 February 2012 Presented by Amanda Coghlan Strategic Insights Analyst Destination NSW Lead Government agency for the NSW tourism and events sectors Established as a statutory
INTERNATIONAL TRAVEL AND TOURISM
 INTERNATIONAL TRAVEL AND TOURISM YEAR 2017 1. INTRODUCTION This issue of the Economic and Social Indicators presents data on International Travel and Tourism for the year 2017. A brief on the compilation
SLOVAKIA. Table 1. FDI flows in the host economy, by geographical origin. (Millions of US dollars)
") Table 1. FDI flows in the host economy, by geographical origin World 1 271 4 095 1 060 1 058 714 4 693 3 267 4 692-6 1 769 3 491 2 825 Developed economies 1 204 4 050 1 036 1 113 485 4 265 1 001 5 084-881
Table 1. FDI flows in the host economy, by geographical origin World 1 271 4 095 1 060 1 058 714 4 693 3 267 4 692-6 1 769 3 491 2 825 Developed economies 1 204 4 050 1 036 1 113 485 4 265 1 001 5 084-881
Western Cape Destination Performance Report: April-June 2016
 Number of arrivals (millions) Western Cape Destination Performance Report: April-June 2016 Global Tourism Performance According to the United Nations World Tourism Organisation, international tourist arrivals
India Market Report. Visit Finland India. Kalsi Gurpreet November
 India Market Report Visit Finland India Kalsi Gurpreet November 2017 14.11.2017 Semiannual Report - INDIA Summer season 2017 and outlook for winter 2017-2018 CONTENTS What factors have affected the results
Insight Department: Scotland The key facts on tourism in 2016
 Insight Department: Scotland The key facts on tourism in 2016 September 2017 Executive Summary & Background Information In 2016 just under 14.5 million overnight tourism trips were undertaken in Scotland.
Tourism Snapshot. June 2015 Volume 11, Issue 6. A focus on the markets in which Destination Canada (DC) and its partners are active.
 and its partners are active.") Tourism Snapshot Tourism PEI / Paul Baglole A focus on the markets in which Destination Canada (DC) and its partners are active. www.destinationcanada.com June Volume 11, Issue 6 Key highlights Over the
Tourism Snapshot Tourism PEI / Paul Baglole A focus on the markets in which Destination Canada (DC) and its partners are active. www.destinationcanada.com June Volume 11, Issue 6 Key highlights Over the
AUCKLAND DESTINATION OVERVIEW
 AUCKLAND DESTINATION OVERVIEW JUNE 218 An in-depth overview of Auckland s visitor economy from the latest arrival, accommodation, spend and cruise data through to past five-year commentary. Prepared July
Kent Visitor Economy Barometer 2016
 Kent Visitor Economy Barometer 2016 In 2016 Kent s Tourism Businesses saw 2 Summary 2016 saw a strong performance for attractions, although fluctuations did occur from month to month. Accommodation providers
Post Show Report. The 19th China International Pet Show (CIPS 2015) National Exhibition and Convention Center (Shanghai)
 National Exhibition and Convention Center (Shanghai)") 2015.11.4-7 National Exhibition and Convention Center (Shanghai) The 19th China International Pet Show (CIPS 2015) China Great Wall International Exhibition Co. Ltd. November 2015 Content OVERVIEW... 1
2015.11.4-7 National Exhibition and Convention Center (Shanghai) The 19th China International Pet Show (CIPS 2015) China Great Wall International Exhibition Co. Ltd. November 2015 Content OVERVIEW... 1
Tourism Trends, Outlook and Issues. John G.C. Kester. 6th UNWTO/PATA Forum on Tourism Trends and Outlook. Guilin, China October 2012 day 1
 Tourism Trends, Outlook and Issues 6th UNWTO/PATA Forum on Tourism Trends and Outlook Guilin, China 11-13 October 212 day 1 John G.C. Kester Programme Manager, Tourism Trends and Marketing Strategies World
Digest of International Travel and Tourism Statistics 2017
 Vol. 44 Republic of Mauritius Digest of International Travel and Tourism Statistics 2017 Ministry of Finance and Economic Development Statistics Mauritius October 2018 (Price: Rs 75.00) DIGEST OF INTERNATIONAL
International Communications Market Report 2014 Post. 11 December 2014
 International Communications Market Report 14 Post 11 December 14 Figure 7.1 Industry metrics and summary UK FRA GER ITA USA JPN AUS ESP NED SWE POL SGP KOR BRA RUS IND CHI Domestic addressed mail revenues
Tourist arrivals and overnight stays in collective accommodation 1 July 2017 (p)
") Jul-16 Aug-16 Sep-16 Oct-16 Nov-16 Dec-16 Jan-17 Feb-17 Mar-17 Apr-17 May-17 Jun-17 Jul-17 MONTENEGRO STATISTICAL OFFICE R E L E A S E No: 158 Podgorica, 31 August 2017 When using the data please name
Jul-16 Aug-16 Sep-16 Oct-16 Nov-16 Dec-16 Jan-17 Feb-17 Mar-17 Apr-17 May-17 Jun-17 Jul-17 MONTENEGRO STATISTICAL OFFICE R E L E A S E No: 158 Podgorica, 31 August 2017 When using the data please name
Summer Work Travel Season Program Dates by Country
 The program dates are windows of opportunity for program participation. Within this timeframe, students are still subject to their university's official academic break schedule. Even though the window
MONTHLY NATURAL GAS SURVEY. November 2009
 MONTHLY NATURAL GAS SURVEY November 2009 INTERNATIONAL ENERGY AGENCY INTERNATIONAL ENERGY AGENCY Next Release: 12 March 2010 MONTHLY NATURAL GAS SURVEY - 1 CONTENTS TABLE 1 Natural Gas Balances in OECD
China International Gold, Jewellery & Gem Fair Shanghai Exhibitor Survey Report
 China International Gold, Jewellery & Gem Fair Shanghai Exhibitor Survey Report Survey Summary Total number of exhibitors 354 Total number of collected onsite survey 214 Onsite survey response rate 6 [214/354]
GERMANY & VISITBRITAIN CAMPAIGNS. Holger Lenz, Manager Central Europe 2 nd November 2016
 GERMANY & VISITBRITAIN CAMPAIGNS Holger Lenz, Manager Central Europe 2 nd November 2016 1 Key UK inbound market facts Visits' 3,249,000' To'UK:'%,'rank' 9.0%' 3 rd '' Spending' To'UK:'%,'rank' 1,378,000'
AUCKLAND DESTINATION OVERVIEW
 AUCKLAND DESTINATION OVERVIEW JULY 218 An in-depth overview of Auckland s visitor economy from the latest arrival, accommodation, spend and cruise data through to past five-year commentary. Prepared August
Summer Work Travel Season Program Dates by Country
 Albania 1-Jul 30-Sep 3 Months Argentina 1-Dec 1-Apr 4 Months Armenia 1-Jun 31-Aug 3 Months Australia 15-Nov 8-Mar 3.5 Months Visa Waiver Country Austria 1-Jul 30-Sep 3 Months Visa Waiver Country Azerbaijan
AFTA Travel Trends. July 2017
 AFTA Travel Trends July 2017 AFTA Travel Trends Report 2017 Inbound and Outbound overview Introduction This snapshot provides an overview of the balance of trade between Inbound and Outbound Travel for
KINGDOM OF CAMBODIA NATION RELIGION KING 3
 KINGDOM OF CAMBODIA NATION RELIGION KING 3 TOURISM STATISTICS REPORT March 2014 MINISTRY OF TOURISM Statistics and Tourism Information Department No. A3, Street 169, Sangkat Veal Vong, Khan 7 Makara, Phnom
Sprint Real Solutions Option A SDS International Outbound Rates from the U.S. Mainland, Hawaii, Puerto Rico, and the U.S.
 1* The international rates below apply to calls from the U.S. Mainland, Hawaii, Puerto Rico, and the U.S. Virgin Islands. For additional termination poinst for some countries, see International Termination
Tourism Snapshot. A focus on the markets in which the CTC and its partners are active. February 2015 Volume 11, Issue 2.
 Tourism Snapshot Tourism Whistler/Mike Crane A focus on the markets in which the CTC and its partners are active www.canada.travel/corporate February Volume 11, Issue 2 Key highlights The strong beginning
Tourism Rotorua Travel Office (51)
") Tourism Rotorua Travel Office (51) PART A: OPERATING REPORT 1 JANUARY TO 31 MARCH 212 1. PURPOSE This activity is undertaken to meet community expectations and to provide information and booking requirements
Tourism Rotorua Travel Office (51) PART A: OPERATING REPORT 1 JANUARY TO 31 MARCH 212 1. PURPOSE This activity is undertaken to meet community expectations and to provide information and booking requirements
KINGDOM OF CAMBODIA NATION RELIGION KING 3
 KINGDOM OF CAMBODIA NATION RELIGION KING 3 TOURISM STATISTICS REPORT June 2014 MINISTRY OF TOURISM Statistics and Tourism Information Department No. A3, Street 169, Sangkat Veal Vong, Khan 7 Makara, Phnom
Insight Department: Canadian Visitors to Scotland
 Insight Department: Canadian Visitors to Scotland October 2017 Welcome The Canadian Visitors to Scotland factsheet provides the latest data and trends on the volume and value of visitors from the International
The most innovative knowledge platform for hoteliers
 The most innovative knowledge platform for hoteliers WHAT IS / Hotelier Academy Hotelier Academy is the new web platform created to spread knowledge and inspiration to global hoteliers. The platform provides
England Tourism Factsheet 2017
 England Tourism Factsheet 2017 Economic Impact Tourism in England contributes 106bn to the British economy (GDP) when direct and indirect impacts are taken into account, supporting 2.6 million jobs. When
KINGDOM OF CAMBODIA NATION RELIGION KING 3
 KINGDOM OF CAMBODIA NATION RELIGION KING 3 TOURISM STATISTICS REPORT September 2014 MINISTRY OF TOURISM Statistics and Tourism Information Department No. A3, Street 169, Sangkat Veal Vong, Khan 7 Makara,
INTERNATIONAL TRAVEL AND TOURISM
 INTERNATIONAL TRAVEL AND TOURISM JANUARY TO SEPTEMBER 2017 1. INTRODUCTION This issue of the Economic and Social Indicators presents data on International Travel and Tourism for the first nine months of
AUCKLAND DESTINATION OVERVIEW
 AUCKLAND DESTINATION OVERVIEW October 218 An in-depth overview of Auckland s visitor economy from the latest arrival, accommodation, spend, cruise and event data through to past five- commentary. Prepared
Survey on arrivals and overnight stays of tourists, total 2017
 MONTENEGRO STATISTICAL OFFICE R E L E A S E No: 34/2 Podgorica, 1 June 2018 When using the data please name the source Survey on arrivals and overnight stays of tourists, total In Montenegro, in, tourist
Tourism in perspective July NBTC Holland Marketing Research Department
 Tourism in perspective July 2017 NBTC Holland Marketing Research Department Table of contents Introduction 1. Developments international tourism 2. Developments inbound tourism the Netherlands 3. Analysis
Insight Department: Scotland The key facts on tourism in 2016
 Insight Department: Scotland The key facts on tourism in 2016 September 2017 Executive Summary & Background Information In 2016 just under 14.5 million overnight tourism trips were undertaken in Scotland.
The Dark Hedges, Co Antrim, which features in the Game of Thrones series and has been named as a top global attraction by Trip Advisor.
 The Dark Hedges, Co Antrim, which features in the Game of Thrones series and has been named as a top global attraction by Trip Advisor. SOAR (Situation & Outlook Analysis Report) December 2014 Summary
VISIT MALAYSIA YEAR. Successful Promotion: UNWTO CONFERENCE MAINSTREAMING TOURISM IN THE MEDIA. Datuk Dr. Victor Wee Chairman, Tourism Malaysia
 UNWTO CONFERENCE MAINSTREAMING TOURISM IN THE MEDIA Successful Promotion: VISIT MALAYSIA YEAR 2007 Datuk Dr. Victor Wee Chairman, Tourism Malaysia 24 March 2011, Colombo, Sri Lanka WHY VISIT MALAYSIA YEAR
India Market Statistics
 India Market Statistics August 2017 Welcome India: Market Statistics factsheet provides the latest data and trends on the volume and value of visitors from India to Scotland from the International Passenger
Economic and Tourism Industry Outlook February 2018
 Economic and Tourism Industry Outlook 2018 7 February 2018 1 Key Issues in Thai Economy Growth Projections for Thai Economy in 2017 and 2018 %YoY 3.9 4.0 4.0 3.2 3.0 2.0 1.0 0.0 2016 2017F 2018F Source:
TOURISM FACTS Total Foreign Exchange Earnings ,065 4,057 3,989 3,935 3,637 3,115 2, ,000 2,000 3,000 4,000 5,000 6,000
 TOURISM FACTS 2008 Tourism Performance in 2008 Expenditure by visitors to Ireland (including receipts paid to Irish carriers by foreign visitors) was estimated to be worth 4.8 billion in 2008. Total Foreign
Who s Staying in Our Parks?
 1 Who s Staying in Our Parks? VicParks Annual Conference 22/08/2017 Presented by Peter Clay GM for Research & Advocacy 2 WORKING COLLABORATIVELY WITH STATE ASSOCIATIONS Our research is undertaken in partnership
WHAT ARE THE TRENDS TO LOOK OUT FOR?
 WHAT ARE THE TO LOOK OUT FOR? Prepared by IPK International on behalf of ITB Berlin, The World s Leading Travel Trade Show INTRODUCTION The global tourism industry continues its success story with another
Sprint Real Solutions Switched Data Service International Rates from the U.S. Mainland, Hawaii, Puerto Rico, and the U.S.
 1* The international rates below apply to calls from the U.S. Mainland, Hawaii, Puerto Rico, and the U.S. Virgin Islands. The usage rates below reflex the discount found in Section 6.4 of Schedule No.
BRAZIL INTERNATIONAL INBOUND TRAVEL MARKET PROFILE (2011) Copyright 2012 by the U.S. Travel Association. All Rights Reserved.
 Copyright 2012 by the U.S. Travel Association. All Rights Reserved.") BRAZIL INTERNATIONAL INBOUND TRAVEL MARKET PROFILE (211) Copyright 212 by the U.S. Travel Association. All Rights Reserved. EXECUTIVE SUMMARY With a population of nearly 2 million and a GDP exceeding $2
BRAZIL INTERNATIONAL INBOUND TRAVEL MARKET PROFILE (211) Copyright 212 by the U.S. Travel Association. All Rights Reserved. EXECUTIVE SUMMARY With a population of nearly 2 million and a GDP exceeding $2
Sprint Real Solutions Switched Data Service International Rates from the U.S. Mainland, Hawaii, Puerto Rico, and the U.S.
 1* The international rates below apply to calls from the U.S. Mainland, Hawaii, Puerto Rico, and the U.S. Virgin Islands. The usage rates below reflex the discount found in Section 6.4 of Schedule No.
LONDON TOURISM REPORT
 LONDON TOURISM REPORT 2015-2016 1 CONTENTS Welcome 02 01 02 03 London & Partners activity 03 2015 tourism trends for London 04 2015 international visits 12 2015 domestic visits 20 04 05 06 2015 business
AFRICA. Cape Town, April Experience the World
 AFRICA Cape Town, 10 12 April 2019 Experience the World at WTM Africa 2019 Why WTM Africa? In the Host City of Cape Town Takes place in April every year - the optimal time in the Travel Industry s buying
OVERVIEW. Currently South Australia contributes $6.3 billion to the Australian tourism economy.
 OVERVIEW Currently contributes $6.3 billion to the Australian tourism economy. has achieved 79 per cent of its $8.0 billion maximum potential by 2020. $6.3b $6.5b $8b 2016 2017 2020 Annual Visitor Summary
PATA Strategic Intelligence Centre. Tsunami Recovery Update. Wednesday June 22, 2005
 PATA Strategic Intelligence Centre Tsunami Recovery Update Wednesday June 22, 2005 Page 1 of 6 Y-T-D Inbound (Source: Relevant NTOs, Airport Authorities) Year Destination Period 2004 2005 Change The Americas
Global travel patterns: an overview
 Journal of Travel Medicine, 2017, 1 5 doi: 10.1093/jtm/tax007 Perspective Perspective Global travel patterns: an overview Dirk Glaesser*, John Kester, Hanna Paulose, Abbas Alizadeh, and Birka Valentin
Performance Derby: MSCI Regions/Countries Earnings & Revenues Growth 2018E / 2017E / 2016A
 Performance Derby: MSCI Regions/Countries Earnings & Revenues Growth 2018E / 2017E / 2016A December 6, 2017 Dr. Ed Yardeni 516-972-7683 eyardeni@yardeni.com Joe Abbott 732-497-5306 jabbott@yardeni.com
Sprint Real Solutions Switched Data Service International Rates from the U.S. Mainland, Hawaii, Puerto Rico, and the U.S.
 1* The international rates below apply to calls from the U.S. Mainland, Hawaii, Puerto Rico, and the U.S. Virgin Islands. The usage rates below reflex the discount found in Section 6.4 of Schedule No.
Insight Department: Australian Visitors to Scotland
 Insight Department: Australian Visitors to Scotland October 2017 Welcome The Australian Visitors to Scotland factsheet provides the latest data and trends on the volume and value of visitors from the International