DMEAN. Dynamic Management of the European Airspace Network. European Medium-Term ATM Network Capacity Plan Assessment
|
|
|
- Allen Sparks
- 6 years ago
- Views:
Transcription

1 DMEAN Dynamic Management of the European Airspace Network European Medium-Term ATM Network Capacity Plan Assessment Edition May 2008
2 INTENTIONALLY BLANK
3 CONTENTS 1. INTRODUCTION REVIEW OF PAST ATM NETWORK CAPACITY PERFORMANCE MEDIUM-TERM TRAFFIC FORECAST MEDIUM-TERM CAPACITY REQUIREMENTS OVERALL NETWORK CAPACITY REQUIREMENTS IMPACT OF TRAFFIC DISTRIBUTION ON MEDIUM-TERM CAPACITY PLANNING DEVELOPMENT OF LOCAL CAPACITY PLANS ENROUTE & TERMINAL AIRSPACE CAPACITY ENHANCEMENT ACTIONS AT NETWORK AND LOCAL LEVEL MEDIUM-TERM CAPACITY PLANNING PROCESSES AND TOOLS TRAFFIC FORECASTING THE AIRSPACE ACTION PLAN: A STRUCTURED APPROACH TO ENHANCE EUROPEAN ATM NETWORK CAPACITY AND EFFICIENCY ACC CAPACITY ENHANCEMENT MEASURES AIRPORTS AOE ACTIVITIES IN SUPPORT OF THE DMEAN FRAMEWORK PROGRAMME ANALYSIS AND DELAY REDUCTION ACTIVITIES AIRSIDE CAPACITY ENHANCEMENT (ACE) ACTIVITIES A-CDM GAP ANALYSIS AND IMPLEMENTATION CONTRIBUTION TO NETWORK OPERATIONS PLAN (NOP) ACTION PLANS IN SUPPORT OF DMEAN ACTIVITIES IATA / EUROCONTROL JOINT ACTION PLAN AENA / EUROCONTROL JOINT ACTION PLAN EXPECTED MEDIUM-TERM PERFORMANCE OF THE ATM NETWORK MEDIUM-TERM DELAY FORECAST EXPECTED ENROUTE CAPACITY PERFORMANCE ( ) POTENTIAL BOTTLENECK AREAS AND EXPECTED SOLUTIONS EXPECTED PERFORMANCE AT REGIONAL LEVEL CONCLUSIONS i
4 ANNEX 1 : ACC TRAFFIC & CAPACITY ALBANIA TIRANA ACC ARMENIA YEREVAN ACC AUSTRIA TIRANA ACC AZERBAIJAN BAKU ACC BELGIUM BRUSSELS ACC BULGARIA SOFIA ACC CROATIA ZAGREB ACC CYPRUS NICOSIA ACC CZECH REPUBLIC PRAGUE ACC DENMARK COPENHAGEN ACC ESTONIA TALLINN ACC EUROCONTROL MAASTRICHT UAC FINLAND ROVANIEMI ACC FINLAND TAMPERE ACC FRANCE BORDEAUX ACC FRANCE BREST ACC FRANCE MARSEILLE ACC FRANCE PARIS ACC FRANCE REIMS ACC FYROM SKOPJE ACC GERMANY BREMEN ACC GERMANY LANGEN ACC GERMANY KARLSRUHE UAC GERMANY MUNICH ACC GREECE ATHENS ACC GREECE MAKEDONIA ACC HUNGARY BUDAPEST ACC IRELAND DUBLIN ACC IRELAND SHANNON ACC ITALY BRINDISI ACC ITALY MILAN ACC ITALY PADOVA ACC ITALY ROME ACC LATVIA RIGA ACC LITHUANIA VILNIUS ACC MALTA MALTA ACC MOLDOVA CHISINAU ACC ii
5 THE NETHERLANDS AMSTERDAM ACC NORWAY BODO ACC NORWAY OSLO ACC NORWAY STAVANGER ACC POLAND WARSAW ACC PORTUGAL LISBON ACC ROMANIA BUCHAREST ACC SERBIA BELGRADE ACC SLOVAK REPUBLIC BRATISLAVA ACC SLOVENIA LJUBLJANA ACC SPAIN BARCELONA ACC SPAIN CANARIAS ACC SPAIN MADRID ACC SPAIN PALMA ACC SPAIN SEVILLA ACC SWEDEN MALMO ACC SWEDEN STOCKHOLM ACC SWITZERLAND UAC WEST SWITZERLAND UAC EAST SWITZERLAND GENEVA TCG SWITZERLAND ZURICH TCZ TURKEY ANKARA ACC TURKEY ISTANBUL ACC TURKEY IZMIR ACC UKRAINE KHARKIV ACC UKRAINE KYIV ACC UKRAINE L VIV ACC UKRAINE ODESA ACC UKRAINE SIMFEROPOL ACC UNITED KINGDOM LONDON ACC UNITED KINGDOM LONDON TC UNITED KINGDOM PRESTWICK ACC ANNEX 2 : AIRPORTS AIRPORT: AMSTERDAM SCHIPHOL, NETHERLANDS AIRPORT: BARCELONA, SPAIN AIRPORT: BRUSSELS, BELGIUM AIRPORT: BUDAPEST, HUNGARY AIRPORT: COPENHAGEN, DENMARK iii
6 AIRPORT: DUBLIN, IRELAND AIRPORT: FLORENCE, ITALY AIRPORT: FRANKFURT/MAIN, GERMANY AIRPORT: HERAKLION, GREECE AIRPORT: ISTANBUL, TURKEY AIRPORT: LONDON HEATHROW, UK AIRPORT: MADRID, SPAIN AIRPORT: MILAN/MALPENSA, ITALY AIRPORT: MILAN LINATE, ITALY AIRPORT: MUNICH (MUC), GERMANY AIRPORT: PALMA, SPAIN AIRPORT: PARIS /CDG, FRANCE AIRPORT: PRAGUE, CZECH REPUBLIC AIRPORT: ROME FIUMICINO, ITALY AIRPORT: THESSALONIKI, GREECE AIRPORT: VALENCIA, SPAIN AIRPORT: VENEZIA, ITALY AIRPORT: VIENNA/SCHWECHAT, AUSTRIA AIRPORT: WARSAW, POLAND AIRPORT: ZURICH, SWITZERLAND ANNEX 3: IATA/EUROCONTROL COMMON AIRPORT ACTION PLAN iv
7 ACRONYMS AAS Advanced Airspace Scheme ACC Area Control Centre A-CDM Airports Collaborative Decision Making ACE Airside Capacity Enhancement ACI Airports Association Council AEA Association of European Airlines AENA Spanish Airport and Air Navigation administration ANSP Air Navigation Service Provider ANT EUROCONTROL Airspace & Navigation Team AOE EUROCONTROL Airport Operations & Environment APN EUROCONTROL Airspace Network Planning & Navigation ARN (V6) ATS Route Network (Version 6) ASM Airspace Management ASMGCS Advanced Surface Movement Guidance System ATC Air Traffic Control ATFCM Air Traffic Flow and Capacity Management ATFM Air Traffic Flow Management ATM Air Traffic Management ATS Air Traffic Service CBA Cost Benefit Analysis CDA Continuous Descent Approach CDR Conditional Route CDM Collaborative Decision Making CEF Capacity Enhancement Function CFMU EUROCONTROL Central Flow Management Unit ECODA EUROCONTROL Enhanced Central Office for Delay Analysis CRAM Conditional Route Availability Message DFL Division Flight Level DMAN Departure Manager DMEAN Dynamic Management of the European Airspace Network DOPs Directors Operations ECAC European Civil Aviation Conference ECIP European Convergence & Implementation Plan FDPS Flight Data Processing System FMP Flow Management Position FUA Flexible Use of Airspace HIRO High Intensity Runway Operations IATA International Air Transport Association v
8 ICAO IFPS LCIP LVP MTF NEVAC NM NOP PC PRC PRU PIATA R/W RAD RNDSG SAAM STATFOR STF TMA UAC International Civil Aviation Organisation Initial Flight Plan Processing System Local Convergence & Implementation Plan Low Visibility Procedures Medium Term traffic Forecast Network Estimation & Visualisation of ACC Capacity Nautical Miles Network Operations Plan Provisional Council Performance Review Commission Performance Review Unit Performance Indicators Analysis Tool For Airports Runway Route Availability Document Route Network Development Sub-group (of the ANT) System for traffic Assignment & Analysis at Macroscopic level EUROCONTROL Statistics & Forecasting Short Term traffic Forecast Terminal Manoeuvring Area (~Terminal Control Area) Upper Area control Centre vi
9 EXECUTIVE SUMMARY The European Medium Term ATM Network Capacity Plan Assessment consolidates all local capacity plans into one single document and provides an outlook of the expected network performance for the period with increased focus on This document has been developed in the context of the Dynamic Management of the European Airspace (DMEAN) Framework Programme. The intent is to provide a mediumterm outlook of capacity requirements at network level and of capacity enhancement measures planned for each ACC. The Plan identifies potential bottlenecks and gives early indications to States and ANSPs on the need to plan for additional resources, on network interactions and on the need to implement improvements at network level. In recent years, States, ANSPs and aircraft operators have cooperated fully with the Agency to address the required ATM capacity enhancement requirements and supported the interactive approach of the Agency for the development of well-based local capacity plans in the context of the LCIP development. As part of the continuing drive towards the full integration of airports into the network capacity planning process, a description of the airport capacity assessment and enhancement work in progress is included, as well as specific information on the 25 most constraining airports. The document identifies the airspace design activities which balance the deployment of additional capacity against increased flight efficiency over the European ATM network. The 2009 Summer Network Operations Plan will be developed on the basis of this document, and will include updates resulting from the development of the capacity plans in the Autumn of This will lead to a jointly agreed course of action with respect to resources, ATM tools and the potential for airspace/route network developments, and will fulfil some of the requirements expressed by various ATM partners in the context of DMEAN. At European network level, the delay forecast for the period shows that network delay will continue to be higher than the Provisional Council target of 1 minute per flight enroute. Delays in Summer 2009 are likely to be higher than initially expected due to the postponement of some major projects at local level; no improvement can be expected before Whereas there are plans to increase structural capacity, the shortage of qualified controllers remains a major obstacle to the enhancement of performance at local level. Despite the significant efforts made to ensure a more effective and flexible resource utilisation, problems are expected at ACCs in various parts of Europe, resulting in less-than-optimum sector configurations and opening schemes. Commitment to the timely implementation of existing plans remains a critical aspect. The outlook indicates that the focus on the integration of capacity planning, civil-military cooperation, airspace design and management, airport operations and flow and capacity management into a network approach should be further strengthened. vii
10 INTENTIONALLY LEFT BLANK viii
11 1. INTRODUCTION The European Medium-Term ATM Network Capacity Plan Assessment for the period has been prepared by the EUROCONTROL Airspace Network Planning & Navigation (APN) business division and the Airport Operations & Environment business division (AOE), in the context of the cooperative process between the Air Navigation Service Providers (ANSPs), airports and the Agency for the development of local capacity plans. It is part of the consolidated planning process implemented through the Dynamic Management of European Airspace Network (DMEAN) Framework Programme. The document provides a medium-term outlook of the capacity situation at network and local level, identifies possible bottlenecks and gives early indication of the need for additional measures, details of network interactions and improvements required at network level. It will allow an early assessment of the ability of the network to provide the required capacity and enable a jointly agreed course of action with respect to local actions and network developments. Included is a brief review of past capacity performance, an assessment of the expected performance of the European ATM network in 2009 and 2010 and a summary of capacity enhancement measures planned for each Area Control Centre (ACC) for the period , as agreed with individual ANSPs during the development of capacity plans included in the Local Convergence and Implementation Plans (LCIP) As part of the continuing drive towards the full integration of airports into the network capacity planning process, a description of the airport capacity assessment and enhancement work in progress is included, as well as specific information on the 25 most constraining airports. 2. REVIEW OF PAST ATM NETWORK CAPACITY PERFORMANCE The trend that began in 2000 with an increase in the European ATM network capacity across the European ATM network continued into The number of flights in Europe reached an all time high (over 10 million flights), but ATM delays increased for the third year running, and did not reach the 1 minute per flight enroute delay target set by the Provisional Council for Summer 2006 and reconfirmed as the target for the medium term. In 2007 the average ATFM delay per flight was 2.1 minutes of which 1.2 minutes was attributed to en-route delay. For the Summer season the average ATFM delay per flight was 2.6 minutes of which 1.6 minutes was attributed to en-route delay. For the Summer period, the traffic increased by 5.3% over the previous Summer and for the whole year 2007, slightly higher than the high growth scenarios of the medium-term STATFOR forecast. The average enroute delay per flight of 1.6 minutes for Summer 2007 was above the PC target of 1 minute and higher than the average enroute delay for Summer 2006 (1.4 minutes). The delay performance was in line with the forecast made at the beginning of the season. The measures taken to enhance and better manage capacity led to an effective increase of the European network ATM capacity that is estimated to be 3.4% for the Summer period and 4.0% for the whole year As in 2006, the capacity increase was lower than the traffic growth. More details concerning the capacity performance of the European ATM network could be found in the Network Operations Report for the Year 2007 issued by the EUROCONTROL Agency in February
12 3. MEDIUM-TERM TRAFFIC FORECAST The latest EUROCONTROL STATFOR Medium-Term Forecast was published in February 2008 and covers the period It indicates that, over this period, the average annual traffic growth in Europe is expected to be between 2.4% and 4.7% with a most likely value of 3.7% per year. The forecast is higher than the February 2007 forecast. See paragraph 5.3 for more information. The traffic forecast per ACC assumes that most of the existing route network will continue to exist. In practice it will continue to develop and change. The maps below show the traffic increase in 2009, 2010 and 2012 at ACC level, for the baseline growth scenario with current routeings. This traffic increase was derived for a representative period of the Summer season, on the basis of the origindestination zones (ODZ) growth provided by STATFOR as part of the Medium-Term Forecast released in February

13 3
14 4. MEDIUM-TERM CAPACITY REQUIREMENTS 4.1. Overall network capacity requirements In 2001, the EUROCONTROL Provisional Council (PC/10) endorsed an overall ATM network target to reduce progressively to a cost-optimum average ATFM delay of one minute per flight en-route by the Summer 2006, as a basis for the co-operative planning and provision of capacity. This target was reconfirmed by PC/27 for the medium term (at least until 2013). Actual delay for Summer 2007 was 1.6 minutes per flight enroute, higher than the target, and, for the third year running, an increase over the previous Summer. To meet the forecast demand and achieve and maintain the 1 minute enroute delay target, the effective capacity of the European ATM network needs to increase by 30% between Summer 2007 and Summer Current local capacity plans indicate that this will not be the case and that delays will increase further. The following diagram illustrates the past and expected evolution of delay targets, enroute ATFM delay, traffic and effective capacity. Traffic, Delay & Capacity Evolution - Summer Flights per day ,0 10,0 8,0 6,0 4,0 2,0 Delay minutes per flight Traffic Capacity Forecast traffic Forecast capacity PC delay target Av ER delay Av ER delay forecast 0 0, The medium-term capacity requirement profiles, proposed to be used as the basis for co-operative planning and provision of capacity for the period were derived during Spring 2008, in an interactive manner and in close co-operation with ANSPs. These capacity requirement profiles are based on the following planning assumptions: Achieving (by Summer 2009) and maintaining the PC average enroute delay target of 1 minute per flight; Traffic growth according to the STATFOR medium-term forecast (Mar 2008), low, baseline and high traffic growth scenarios; Forecast traffic distributed over the current and the shortest routes available on the future ATS Route Network (Version ARN V.6 Version 6), with generally unconstrained vertical profiles. Capacity requirement scenarios are established for each ACC and for each year of the planning period, to allow more flexible and interactive planning of ATM capacity and a better reflection of local needs and realities. They are based on high, medium or low traffic growth and distribution over the current route network and on the shortest routes available on the future ATS Route Network. The capacity requirement profiles that result from this cohesive planning methodology were approved at SCG/8 and will be published in the ECIP
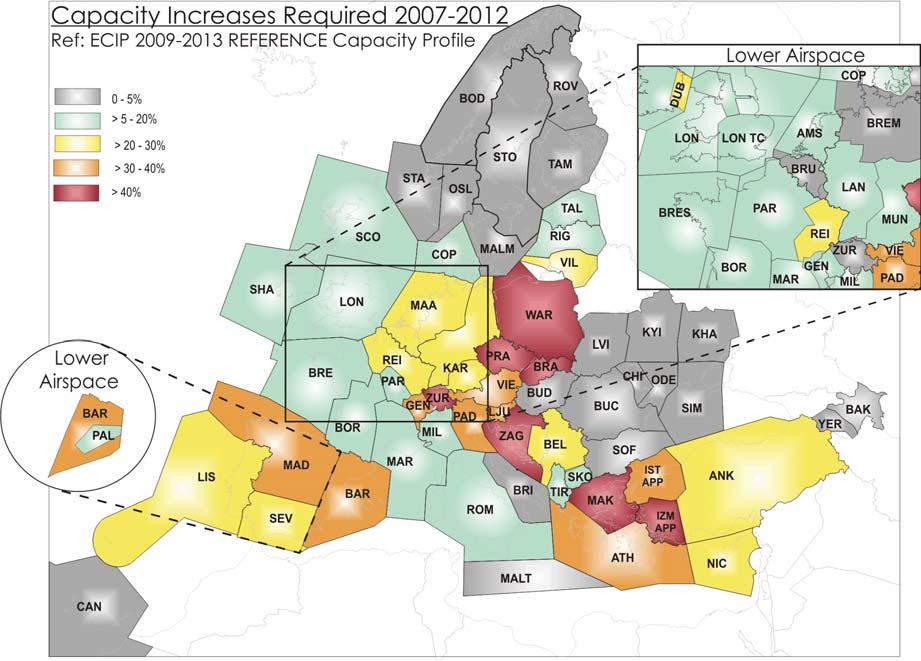
15 For the medium-term capacity planning of the European ATM network, capacity profiles are set for existing and future ACC configurations (i.e. those planned to be operational between 2009 and 2013) in the ECAC area, by considering the whole ATM network and giving due consideration to airport capacity constraints. The ACC capacity profiles are linked to the ACC capacity baselines assessed and agreed during Summer 2007, and are used as a reference for medium term capacity planning capacity baselines were also assessed for ACC configurations planned for implementation between 2009 and 2013, thus allowing the derivation of capacity profiles in the medium term. The planning cycle takes into account the following changes to areas of responsibility for ACCs requested by various ANSPs: Bulgaria Sofia ACC all en-route airspace Varna becomes an APP unit no profiles required Germany Karlsruhe UAC with the upper airspace of Munich ACC from 2012 Munich ACC without the upper airspace from 2012 Turkey Ankara ACC all Turkish airspace above FL245 from 2011 Istanbul and Izmir ACCs current areas of responsibility below FL245 from 2011 UK Merge of Manchester and Scottish ACC into new Prestwick Centre from 2010 As required by ANSPs and in line with the DMEAN requirements, capacity profiles are also provided for a number of sector groups, on a bilateral basis. At network level, air traffic is expected to grow between 2007 and 2012 by 21% for the baseline scenario and by 28% for the high growth scenario. To meet this traffic growth and to achieve and maintain the enroute delay target over the same period, the European ATM Summer season network capacity needs to grow by 30% for the baseline traffic growth scenario and 37% for the high traffic growth scenario. The difference between the traffic growth and the required capacity increase comes from the fact that the enroute delay target has not yet been met and a capacity increase higher than the traffic growth is required to close the capacity gap and meet future demand. The maps on the following page illustrate the capacity increases per ACC required by 2012 for the baseline and high traffic growth scenarios. 5
16 6

17 4.2. Impact of traffic distribution on medium-term capacity planning For medium term capacity planning, it is important to have a realistic traffic sample, taking into account future possible shifts in traffic distribution between the different ACCs. The transition of the future traffic demand towards shortest routes and unconstrained vertical profiles, as well as the successive improvements to route network efficiency in terms of route network design and utilisation, could have a significant impact on traffic distribution and on future capacity requirements. In addition, the differences between the en-route charges applied in different States could have a high impact on traffic distribution in certain parts of Europe. These effects are assessed through the capacity planning process Effect of traffic distribution via shortest available routes: the following map shows the average daily differences in traffic demand between the shortest available routes on ARN VST network and the routes that were flight planned during Summer 2007 If flights were to fly on the shortest route available, changes to traffic distribution would be observed in Central, South-Eastern and Eastern Europe. There is significant potential for demand increase in Chisinau, Ljubljana, Skopje and Zagreb ACCs, as well as Belgrade, Izmir, Odessa and Simferopol ACCs. A corresponding decrease would be observed in Sofia and Budapest ACCs, as well as Bucharest, Ankara and Istanbul ACCs. 7
18 Effect of traffic distribution via the cheapest available routes: the observed traffic distribution shows that even if the shortest route is fully available, it may not always be the chosen option of the aircraft operators, as the cost of the flight also depends on route charges. There is a trade-off between flying a longer distance and paying lower route charges. This effect could have a big impact on the future European traffic pattern. The effect has been assessed within the capacity planning process by providing the traffic distribution on the cheapest route, minimising the cost of each flight. The map below shows the average daily differences in traffic demand between the cheapest and the shortest available routes, both on ARN VST network with released vertical constraints. The main effects are seen in Central, South-Eastern and Eastern Europe. Estonia, Latvia, Lithuania, Poland, western Ukraine, Moldova, Serbia, and Bulgaria would get more traffic. On the other hand, Romania, southern Finland, Hungary, eastern Ukraine, eastern Italy, Albania, FYROM and part of Turkey would have less traffic Overall effect of traffic distribution over shortest and cheapest available routes: The European traffic pattern is highly dependent on the route selection made by the aircraft operators, especially on the flows between North-Western and South-Eastern Europe. The transition of demand towards more natural (shorter and/or cheaper) routes and unconstrained profiles has a significant impact in several ACCs. Increased interaction with airspace users would allow an improved assessment of the expected traffic distribution on the network. 8
19 4.3. Development of local capacity plans To ensure the required delivery of capacity in the medium-term, detailed capacity plans are developed by the ANSPs for each ACC. The information included in this document is taken from the medium-term capacity plans included in Local Convergence and Implementation Plans (LCIP) More details of ACC capacity enhancement initiatives can be found in the individual ACC pages. The map below indicates the capacity increases planned for Summer 2012 with respect to the agreed 2007 ACC capacity baseline. Note that these capacity plans were based on the capacity requirement profiles , which in turn were based on the STATFOR February 2007 Medium Term traffic Forecast (MTF). The ACC capacity requirements shown on the maps in para. 4.1 reflect the new profiles, updated in March 2008, based on the new, higher, STATFOR MTF. By comparing the existing plans with the new capacity profiles, we have an early indication of where capacity plans need to be upgraded. New capacity plans will be developed in Autumn 2008 in response to the ECIP profiles. 9
20 5. ENROUTE & TERMINAL AIRSPACE CAPACITY ENHANCEMENT 5.1. Actions at network and local level Network and local capacity enhancement initiatives are based on improved airspace organisation and management, the timely availability of controllers, Air Traffic Flow and Capacity Management (ATFCM) and new or upgraded ATM systems. The capacity benefit enabled by new technologies (P-RNAV, Mode S, data-link, etc.) is increasing, but the exploitation of their full potential is dependent on the number of compliant aircraft. DMEAN Capacity enhancement initiatives at network level are integrated into and enabled by the gradual deployment of the Dynamic Management of the European Airspace Network (DMEAN) Framework Programme, which brings together a number of initiatives in airspace design, collaborative decision-making (CDM), Flexible Use of Airspace (FUA) and ATFCM. When the DMEAN operational concept is fully implemented in regard to airspace utilisation, the overall capacity gains at network level will be around 18-20% over a period of 5 years. Airspace Structure Development Route network and sectorisation improvements are designed to enable more efficient use of the European airspace network. Local initiatives are discussed and coordinated at network level by the EUROCONTROL Route Network Development Sub Group (RNDSG) of the Airspace & Navigation Team (ANT). Members of this group include ANSPs from the majority of ECAC States, airline user groups and military representatives. Flexible Use of Airspace The full exploitation of FUA will improve civil-military cooperation and integration at network level. The dynamic provision of relevant ATM information will allow better utilisation of resources, through flexible and dynamic sector configuration management and the flexible rostering of controllers. ATFCM The CFMU continues to develop Air Traffic Flow & Capacity Management (ATFCM), working with ANSPs and aircraft operators to achieve a better utilisation of ATM capacity and a better integration of ATFCM and ASM processes. Major airspace changes, the implementation of new ATM systems and other special events are coordinated at European level through extensive preplanning and coordination process carried out between the key players, under CFMU coordination. Infrastructure & Systems The Agency continues to work in close co-operation with States, ANSPs and aircraft operators to ensure the necessary infrastructure improvements. This work covers both ATM and CNS infrastructure and will enable the transition towards more advanced network-wide infrastructure and operating concepts. Various initiatives, activities and programmes cover this area: Link 2000, Mode S, CASCADE, FASTI, 8.33 khz, P-RNAV, eaip, CHAIN, EAD, TMA2010, etc. 10
21 The DMEAN Framework Programme and the ATFCM Strategy and Evolution Plan have the potential to address the key issues of planning, designing and managing the European ATM network in an integrated approach and to deliver immediate benefits. However, these benefits will be significantly reduced unless sufficient controllers are available to open optimum sector configurations Medium-term capacity planning processes and tools The Agency works closely with States, ANSPs and aircraft operators for the enhancement of European ATM network capacity, through improved capacity planning processes and tools. This is an ongoing process, requiring full commitment from all stakeholders and the implementation of truly collaborative decision-making processes in the DMEAN spirit. The Agency produces capacity requirement profiles for each ACC and provides support to ANSPs to work them into the local capacity plans (LCIP). These are consolidated annually into this Medium-Term European Capacity Plan Assessment in a dynamic, interactive and entirely collaborative process. The Capacity Planning Task Force, comprising capacity managers, planners and user groups, discusses key improvements to the medium-term capacity planning process and tools and agrees the work programme for the coming year. The development plan for the set of capacity planning tools is discussed, prioritised and agreed with ANSPs and airline associations and follows their expressed requirements. NEVAC One of the key tools is NEVAC (Network Estimation & Visualisation of ACC Capacity), version 2.0 of which is now available. NEVAC includes: o Geographical and statistical analysis of delay distribution in time and space; o Demand volatility and fluctuation for ACCs, sectors and traffic volumes; o Analysis of network effects in terms of protection and penalisation; o Visualisation of future traffic with the possibility to change STATFOR scenarios or specific growth parameters; o Detailed analysis of local traffic increases and prediction of future hotspots; o Improved Configuration Optimiser (ICO). SAAM Airspace design is continually being improved through the development and utilisation of the powerful SAAM (System for Traffic Assignment and Analysis at Macroscopic Level) tool, which enables a quick and reliable assessment of various airspace structure proposals and the development of optimised solutions, with respect to both capacity and flight efficiency. The Agency widely distributes the common network capacity planning and airspace design tools and data and provides support and training to ANSPs. Through these actions a collaborative and interactive capacity and airspace planning process has evolved, based on common data and tools. The capacity requirements for the period were derived within this cooperative and transparent process. The Agency provides detailed information concerning future traffic demand, traffic distribution on the current and future route network, route choices of aircraft operators, expected demand at sector group and ACC level, optimum sector configurations, cost data, optimum delay information, airport demand, etc. 11
22 ANSPs are provided with planning tools and databases (traffic samples, traffic forecasts, current and planned airspace structure) to enable a more detailed local analysis of the future capacity expectations and of the possible solutions to further increase ACC capacity. Full training and support is provided and ANSPs are expected to make full use of these tools to evaluate the potential for future capacity and flight efficiency improvements, the need for more fundamental capacity enhancement solutions, and finally, for the development of well-based local capacity plans. Through the Demand Data Repository, being developed in the context of DMEAN, the Agency will ensure a more dynamic and systematic provision of data for the capacity planning and airspace design tools. To fully realise the benefits of an integrated approach between airspace design, ASM/FUA and ATFCM, a more flexible approach to flight planning from the users is needed. EUROCONTROL has initiated work to enable more flexibility in flight planning, but more responsiveness is required from all airspace users. Process and system improvements are required in the areas of flight planning and airspace status notification. CAPAN ANSPs in Croatia, Estonia, Germany, Maastricht UAC, Poland and Switzerland have requested the Agency to assess their sector capacities with a CAPAN (Capacity Analyser) analysis. This uses the EUROCONTROL Airspace Model as the simulation engine to determine the workload of simulated controller positions for a given traffic sample. The capacity of the sector is deemed to be reached when the workload on any of the simulated working positions (generally the radar controller or the planning controller position) reaches a predetermined threshold. As a result, some ACCs will increase their sector capacities Traffic forecasting The EUROCONTROL Statistics and Forecasting (STATFOR) unit provides short, medium and long term traffic forecasts at State level. The STATFOR service of statistics and forecasts is discussed and reviewed by the STATFOR User Group, a body of European forecasting and statistics experts that meets regularly. The Short Term Forecast looks 2 years ahead. It is produced 4 times a year and is statistically derived from recent data. The Medium Term Forecast looks 7 years ahead. It is produced once a year in February and combines flight statistics with economic growth and models of important drivers in the industry such as costs, airport capacity, passengers, load factors, aircraft size etc. High, baseline and low growth scenarios are presented. Long-term forecasts are published every two years and look at a range of distinct scenarios of how the air traffic industry might look in 20 years time. This allows a range of what if? questions to be explored, for factors inside the industry (e.g. the growth of very light jets, or of point-to-point traffic) or outside (e.g. the price of oil, environmental constraints). More information on STATFOR can be found by following the link below: The EUROCONTROL Capacity Enhancement function uses the STATFOR medium term traffic forecast to derive a range of forecasts at ACC level, on which the medium term capacity requirement profiles determined each year are based. 12
23 Improvements in traffic forecasts foreseen in the context of DMEAN include: A short-term traffic forecast for States, ACCs, Sector Groups and airports, covering the period from 1 to 24 months and providing Origin/Destination Zone (ODZ) information; A medium-term traffic forecast for States, ACCs, Sector Groups and airports, covering the period current year +2 to current year +6 ; A monthly, weekly and daily operational demand forecast for States, ACCs, Sector Groups and airports; A 4D map view of the expected demand over various periods at States, ACCs and Sector Groups level; A fully accessible database of flights for various periods for any selected area; Distribution of traffic on the shortest routes over the future route network; Distribution of traffic demand on cheapest routes, based on service provision costs forecast; Performance criteria for various forecasts. Much work is performed by the Agency to provide a range of demand forecasts to ANSPs. Nevertheless, there is limited input from aircraft operators and from other sources of information. Through DMEAN, tools and support processes are being defined to improve the quality of data and to ensure regular updates The Airspace Action Plan: a Structured Approach to Enhance European ATM Network Capacity and Efficiency At its 28th meeting, the EUROCONTROL Provisional Council approved the Airspace Action Plan, which covers the need for an efficient pan-european ATM Network approach and proposes a number of concrete actions to improve network efficiency and capacity through the creation of an efficient ATS Route Network (ARN), combined with flight efficiency scenarios to safely and efficiently accommodate the expected traffic growth. The plan responds to the high level objectives of the Single European Sky and will help to eliminate fragmentation. ACTION 1: Develop, maintain and gradually implement the AAS Route Network between 2009 and 2015 The feasibility of creating an efficient and optimum pan-european ATS Route Network, aligned with major traffic flows and independent of national boundaries, has been demonstrated through the development of the Advanced Airspace Scheme (AAS) route network. The AAS is based on an advanced concept for airspace design and is an evolving roadmap for the European ATS Route Network from which successive ARN versions and annual improvements will be derived, in close cooperation with States civil and military authorities, ANSPs and airspace users. The AAS Route Network integrates into one single operational concept airspace design, advanced ASM/FUA and ATFCM, allowing for the development of a more efficient route network and sectorisation that offers greater flexibility and responsiveness to airspace users. The AAS Route Network takes a long-term view of the ECAC airspace structure, includes updates coming from Functional Airspace Block developments or from other local or sub-regional initiatives, and incorporates elements designed for implementation between 2008 and 2015, providing the foundation for future airspace concept developments within the context of SESAR. It will be implemented when specific operational, technical or political requirements are in place at local and/or network level. 13

24 ACTION 2: Develop and implement the ARN V6 The first phase of the deployment of the AAS route network is the ARN Version 6 that will combine medium term and long-term route network elements, where these are considered mature enough. The ARN V6 will focus on the extensive application of the AAS concept and prepare the way for full DMEAN operations such as: application of predetermined scenarios; predefined direct routeings; development of CDRs based on enhanced FUA; cross border sector adaptation; modular sector configuration in relation with route network variation interconnectivity with TMAs. The following diagram describes the development and the deployment process agreed for the ARN V6. The development of the future route network is based on a coordinated and integrated approach towards European airspace design where the entire European airspace is treated as a continuum. The development of ARN V6 provides for a balanced and cooperative approach between national, regional and European-wide requirements and gives a high priority to expressed user requirements. All proposals are consolidated in a coherent plan that integrates a series of regional and national improvement projects at varying stages of maturity. ARN V6 responds to the DMEAN operational concept as it integrates predetermined scenarios and their associated modus operandi and provides predefined direct routeings. ARN V6 includes a significant number of proposals to improve both the capacity and flight efficiency of the European airspace structure. Clearly, these proposals need to be implemented without major alteration if full benefits are to be realised. Significant environmental benefits could be achieved through the full implementation of the ARN V6, which has the potential to reduce CO 2 emissions by approximately 120KTons per year. Further reductions of between 1.5% and 2% of the flying 14
25 distance will be possible through the deployment of the AAS and of the other measures listed. ACTION 3: FLIGHT EFFICIENCY ENHANCEMENT a) Examine reasons and identify solutions for the city pairs with the highest total route extension; b) Implement gradually the existing 19 flight efficiency scenarios and identify any potential additional scenarios; c) Reduce the number of RAD restrictions; d) Identify and implement improved airspace solutions for 10 critical TMAs. The significant investment and collaborative actions to increase enroute capacity over the last 15 years (route network development, RVSM, FUA, ATFM) have also improved the efficiency of the enroute network, with the associated fuel savings being directly translatable into environmental benefits. Nevertheless, ATM faces increasing pressure from two areas: airspace users continue to press for more direct routes, and the climate change challenge generates public and political pressure for flight efficiency measures. To respond to these challenges and to ensure a continued performance driven planning process, the PC/27 approved a flight efficiency target that requires a reduction in the European average route extension per flight of two kilometres per annum until The route choice made by the airspace users varies according to individual flight priorities, meteorological conditions, the overall ATM capacity situation, enroute charges etc. In general, airspace users have a good choice of routes today and demonstrate a clear preference for the shortest or the cheapest route. In 2007, 67% of the city pairs in Europe had a route extension of less than 5%, 27.5% had a route extension of 5%-12% and only 5.5% had a route extension greater than 12%. The route extension is calculated as the difference between the flight planned route and the great circle route from TMA to TMA (30 NM around airports). The 50 city pairs with the highest total route extension (number of flights x additional route length) are being examined to identify the reasons behind the statistics. Solutions are explored with ANSPs to eliminate or reduce them to the maximum extent possible, without impacting safety or capacity. Agreed solutions are included in the ARN V6 and deployed through the annual set of improvements. As a further initiative, the RNDSG will develop flight efficiency scenarios that will activate shorter routes together with specific rules for their use. The successful implementation of scenarios requires an integrated ASM/FUA/ATFCM approach and flexible flight-planning. As part of the V6 development, a comparison of a traffic sample with CDR2 routes open and CDR2 routes closed produced a total mileage saving of 0.3% at ECAC level. Local benefits in areas with a high number of CDR2 routes is of course greater. The enhanced ASM/FUA processes foreseen in DMEAN will improve all phases of the process, from the initial coordination between the AMC and FMP to the re-filing of flight plans via available CDRs. The CFMU plays a major role in facilitating the ASM/ATFCM integrated activities. The majority of CDRs not used offer savings of less than 20nm, probably because airspace users do not consider this a significant enough saving for an individual flight to justify re-filing the flight plan. However, if all CDRs were used, the overall saving of fuel and CO2 would be considerable; rerouteing should be encouraged and could be ensured by the automatic re-filing of flight plans via available CDRs. 15
26 Additional flight efficiency improvements could be achieved through further removal of the restrictions in the Route Availability Document (RAD), and through the elimination of flight level constraints ( level capping ) for selected traffic flows. Additionally, the requirement for the RAD to be applicable on a 24 hour basis should be reviewed. There is also potential to enhance flight efficiency through better terminal airspace design, through: Review of existing TMA limits; Improved connections with the enroute network; Flexible and dynamic sector configurations; Cross-border sectorisation; Extensive application of P-RNAV and Continuous Descent Approach (CDA) procedures; Enhanced controller tools to reduce controller workload. EUROCONTROL has developed comprehensive guidelines for terminal airspace design and has launched the TMA Programme to tackle these issues. This requires extensive work at local level with ANSPs and airspace users as TMA design requires a more localised approach. Individual projects are run with a number of ANSPs to develop and optimise the use of terminal airspace. The full implementation of existing proposals for an improved ATS route network, supported by an adapted sectorisation, has the potential to gradually bring the following significant flight efficiency savings: ATS Route Network ARN V6: +/ NM per day 250 M per year Full AAS deployment: +/ NM per day 150 M per year Flight efficiency scenarios: +/ NM per day M per year (depending on agreed scenarios) ACTION 4: Support airspace developments in the context of the FAB initiatives, ensure network connectivity and a continuous cross-fertilisation with the AAS Route Network and successive ARN Versions EUROCONTROL offers operational and technical assistance for airspace development in the context of the FAB initiatives. By using the SAAM tool and common traffic and airspace data, network inter-connectivity and the delivery of an optimum European ATS route network and adapted sectorisation is ensured. The solutions emerging from the FAB initiatives will be included in the development of the AAS Route Network, and the agreed outcome will appear in successive ARN Versions as soon as the political, technical and operational conditions for implementation are met. More information about local airspace structure development can be found on the individual ACC pages, and comprehensive information on planned route network and sectorisation improvements is available in the Summer Short-Term improvements list and in the ARN V6 catalogue of routes (to be published in October 2008). 16
27 5.5. ACC Capacity Enhancement Measures Increased sector throughput and the use of optimum configurations The Italian ACCs, Lisbon ACC and Warsaw ACC will tactically revise their sector loads. Tirana ACC, Vilnius ACC and Zagreb ACC plan to increase their declared sector capacities or monitoring values. Several ACCs plan to increase the opening times of optimum sector configurations during peak hours: Belgrade ACC, Brussels ACC, Copenhagen ACC, Lisbon ACC, Maastricht UAC, Nicosia ACC, the Norwegian ACCs, Prague ACC, Rome ACC, Skopje ACC, Spanish ACCs, Tallinn ACC, Warsaw ACC, and Zagreb ACC. Effective resource utilisation Several ACCs will continue to operate with staffing constraints. Nevertheless, the achievement of a better performance is planned through more effective resource utilisation. Dynamic and flexible sectorisation and configuration management, adaptation of sector opening times and improved flexibility in staff rostering remain key measures for better adaptation of the available capacity to the demand, leading to effective and sustainable reduction of ATFM delays. Improved availability of controllers, either through recruitment or flexible rostering, is planned at Belgrade ACC, Bratislava ACC, Budapest ACC/APP, Copenhagen ACC, French ACCs, Greek ACCs, Irish ACCs, Lisbon ACC, Ljubljana ACC, Maastricht UAC, Nicosia ACC/APP, the Norwegian ACCs, Prague ACC, Rome ACC, Skopje ACC, Spanish ACCs, Swedish ACCs, Swiss ACCs, Tallinn ACC, Tirana ACC, Turkish ACCs, UK ACCs, Vienna ACC/APP, Warsaw ACC and Zagreb ACC. New ATM systems and ATM system upgrades Several States plan new ATM systems, system upgrades and/or implementation of additional functionalities that will generate increased capacity during the planning period: Albania: Tirana ACC new ATM system and facilities Austria: Vienna ACC new ATM system, multi-sector planning, MTCD Azerbaijan: new ATM system Belgium: Brussels ACC - implementation of CANAC 2 Bulgaria: new ATM system Croatia: Zagreb ACC additional system functionalities Cyprus: Nicosia ACC new ATM system EUROCONTROL: Maastricht UAC full exploitation and further development of new FDPS, Traffic Management System & introduction of gates/fences (MANTAS) French ACCs: regular system upgrades and implementation of ARTAS German ACCs: implementation of new ATM system (P1/VAFORIT) system at Karlsruhe UAC and system upgrade at other German ACCs Greek ACCs: MTCD Irish ACCs: ATM system upgrade Hungary: Budapest ACC introduction of multi-sector planning Italian ACCs: new ATM system functionalities, VDL Mode2, Mode S infrastructure Latvia: Riga ACC additional system functionalities Poland: new ATM system Serbia: new ATM system Slovak Republic: new ATM system Slovenia: Ljubljana FDPS upgrade Spanish ACCs: ATM system upgrade Swedish ACCs: ATM system upgrade 17
28 Swiss ACCs: new ATM system at Zurich ACC, additional functionalities at Geneva ACC Turkey: new ATM system combined with complete reorganisation of airspace Ukraine: Dnipropetrovs k and Simferopol ACCs new ATM system UK: Implementation of new ATM system ifacts at London ACC; merge of Scottish and Manchester ACCs into new Prestwick ACC The EUROCONTROL Agency provides support to ANSPs involved in the implementation of new ATM systems in terms of technical expertise, airspace planning, capacity planning, simulation and capacity management during the transition period. Implementation of Mode S and data link Implementation of Mode S stations is currently planned as follows: Austria implementation of Mode S France gradual upgrade of existing stations to Mode S for elementary and eventually enhanced surveillance Germany gradual upgrade of existing stations to Mode S Italy gradual improvement of Mode S infrastructure for elementary and eventually enhanced surveillance Netherlands full implementation for elementary surveillance Switzerland Mode S elementary surveillance UK gradual deployment of Mode S stations for elementary and eventually enhanced surveillance Implementation of air/ground data link is currently planned as follows: Austria gradual deployment for TWR, APP and ACC All French ACCs gradual implementation for TWR and en-route Germany gradual implementation for TWR and en-route Ireland gradual implementation for TWR and en-route Italy gradual implementation for TWR and en-route Portugal implementation of data link for non time-critical messages Spain gradual implementation for TWR and en-route Switzerland gradual implementation for TWR and en-route UK implementation opportunities being explored Maastricht UAC progressive use of air-ground data link (since 2003), capacity benefits dependent on the aircraft equipage rates Other Local Capacity Enhancement Measures Additional capacity benefits will result from improvements to Letters of Agreement (LoA) between ATC units, more effective civil/military co-operation processes, capacity management processes, etc. Pan-European Capacity Enhancement Programmes The EUROCONTROL Agency continues work at European network level, in close cooperation with States, ANSPs and airspace users to progressively enhance and optimise the use of the available European ATM capacity in a cost-effective manner. 18
29 6. AIRPORTS The full integration of airports into the European capacity planning process is essential for planning the development of the European air traffic system. Improved availability and accuracy of information on airport capacity as well as local airport plans ensures the timely development of airspace capacity enhancement measures, providing maximum benefit to the European ATM network as a whole. In order to sustain growth an airport must engage in airside capacity planning to meet future demand. Through the activities of the Airspace, Network Planning and Navigation (APN) Business Division and the Airport Operations & Environment (AOE) Business Division of EUROCONTROL, airports are being integrated into the European capacity planning process, with the primary objective being to provide a method to identify and target the constraints that limit current and/or future ATM network capacity. Key stakeholders from all areas of an airport must be involved, including airlines, ATS providers, airport operations, etc. This chapter aims at providing information on European airports that is relevant to the Medium Term ATM Capacity Planning Process by reporting all available and public information on: Current and forecast traffic demand Information on capacity constraints Information on all areas associated with the development of an airport This information supports the early identification of issues that affect capacity (either positive or negative), and the need for improvements. This chapter also includes an information page for each of the 25 airports identified as having a potential effect upon the network in terms of ATFCM delay. The Medium Term ATM Capacity Plan Assessment for the period of is an important part of the consolidated planning process implemented through the Dynamic Management of the European Airspace Network (DMEAN) Framework Programme. The initiatives currently being explored by the EUROCONTROL Airport Operations and Environment Business Division (AOE) aim to improve airport and network capacity and to increase the operational efficiency of airports. All are fully in line with the DMEAN Framework Programme objectives and are undertaken in full coordination with the DMEAN Programme. A description of each activity is described in the section below AOE Activities in support of the DMEAN Framework Programme A prime objective of the DMEAN programme is to reduce delays at network level. A reduction of airport delay should not be considered in isolation nor disassociated from airside capacity and efficiency issues in general, and in particular from the runway capacity declaration process which is a critical element. Identifying and utilising sufficient airside capacity as well as having efficient airport operations are key determinants in the airport delay reduction process. However, before the full benefits of enhancing capacity or operational efficiency can be realised, there needs to be a full analysis of the real reasons for airport ATM related delays. 19
30 The following sections provide details on the AOE activities in support of DMEAN. Four major activities are currently underway: Analysis and Delay Reduction activities Airside Capacity Enhancement (ACE) activities Airport Collaborative Decision Making (A-CDM) activities Contribution to Network Operations Plan (NOP) Work during 2007 focussed on the 25 airports identified as potentially having a effect upon the network in terms of ATFCM delay. Country Airport Delay Analysis ACE A-CDM Austria Vienna (complete) (complete) (ongoing) Belgium Brussels (ongoing) (ongoing) Czech Rep. Prague (complete) (complete) (ongoing) Hungary Budapest (complete) (complete) (ongoing) Denmark Copenhagen (planned) (planned) France Paris CDG (ongoing) Germany Frankfurt (ongoing) (planned) Munich (ongoing) (completed) Greece Heraklion (ongoing) (ongoing) (ongoing) Thessaloniki (planned) (planned) (planned) Ireland Dublin (ongoing) Italy Florence Milan Linate Milan Malpensa (complete) (ongoing) (ongoing) Rome Fiumicino (ongoing) (ongoing) (ongoing) Venezia Netherlands Amsterdam (to be Schiphol planned) (ongoing) Poland Warsaw (planned) (ongoing) (ongoing) Valencia Spain Barcelona Madrid Barajas AENA / EUROCONTROL Action Plan Palma (Mallorca) Switzerland Zurich (planned) (planned) (ongoing) Turkey Istanbul (complete) (ongoing) (ongoing) UK London Heathrow (planned) (ongoing) Table 1: 25 Airports For more details on planned and/or on-going AOE activities at the above airports, refer to Annex 2. A DMEAN Airport Implementation Coordination Group has been created to coordinate all these activities. The group consists of representatives from: Concerned EUROCONTROL units, including the CFMU, ecoda, Airspace, Network Planning & Navigation (APN), Capacity Enhancement Function (CEF) and the Airport Operations and Environment Business Division (AOE) The Performance Review Unit (PRU) IATA ACI EUROPE 20
31 EUACA (European Union Airports Co-ordination Association) In addition, in order to accelerate the implementation of required actions, two Action Plans have been agreed between EUROCONTROL and some key international bodies: IATA / EUROCONTROL Joint Action Plan (refer to Section 6.2.1) AENA / EUROCONTROL Joint Action Plan (refer to Section 6.2.2) Analysis and Delay Reduction Activities The AOE Business Division is currently tasked to perform actions to reduce delays at 25 European airports where capacity constraints have an effect upon the network. All delay reduction actions are fully supported by the EUROCONTROL Provisional Council (PC) Study on the Real Reasons for Airport ATM related Delays The Provisional Council (PC) tasked EUROCONTROL to undertake a study aiming at analysing and identifying the real reasons for delays. The outcome of this study will support any actions that may contribute to the reduction of airport ATM related delays and may influence the way delay issues are addressed, including mitigation actions at airports. The final results will become available at Q This study is supported by the completion of a number of delay analyses performed at individual airports during 2007 and A generic report will be produced, using de-identified information, highlighting the real reasons for delay. Generic guidelines for identifying real reasons for airport ATM related delays will be produced, as well as recommendations on their reduction. This study attempts to drill one level down from the official stated delay reasons (e.g. reports from CFMU, AEA, and e-coda) by getting a better understanding of the complex interactions. For individual airports taking part of this analysis process, local delay analysis reports and more importantly, delay reduction action plans, will be produced in conjunction with stakeholders. The following areas are included in this study: the impact of weather on delays, current versus predicted capacity and the oversupply of aircraft with respect to the slot coordination process. The results will also serve to enhance AOE delay reduction guidelines and best practices that will be recommended to the airports concerned Delay Monitoring Process To ensure proper support to stakeholders, EUROCONTROL is establishing a dynamic demand/capacity versus delay monitoring process, to track operational performance of individual airports and to identify issues at an early stage, analysing airport delays from a short- and medium-term perspective; notably: 21
32 Short term activities Causes of non-optimum airport throughput are identified by means of specially prepared Central Flow Management Unit (CFMU) airport delay reports, which are reviewed on a monthly basis in order to identify short term issues that result in high ATFCM delays. AOE collaborates with the Air Traffic Statistics and Forecast Service (STATFOR) to routinely supply forecasts on targeted airports. By reviewing the short term forecasts, any developing trends at the concerned airports are identified at an early stage to enable remedial actions. Medium term activities The ACE project team systematically examines and follows up capacity issues at individual airports via local visits and taking into account the information available at different sources such as ACI, electronic Central Office for Delay Analysis (ecoda), CFMU and PRU. To facilitate this activity a standard template has been developed jointly by the ACE Project team and the Performance Review Unit (PRU) containing information on individual airports. The objective is to combine airport information from different sources and to provide an annual synopsis of individual airports. These data sheets incorporate data from available sources including the CFMU, electronic Central Office for Delay Analysis (ecoda) and specific local information from the airport s key stakeholders; thus providing baseline capacity declarations, operational, physical and environmental aspects, the implementation status of commonly agreed best practices and a broad overview of elements which could constrain or improve the airport s capacity. These data sheets combined with routinely focussed medium term forecasts of targeted airports (STATFOR), serve as the initial information basis for site-specific delay analysis and the development of local action plans to mitigate delays Analysis and Delay Reduction at individual airports Airports identified as having a potential effect upon the network are approached on an individual basis by AOE. Airports can also ask for EUROCONTROL assistance according to their specific needs. This activity is conducted in close collaboration with local stakeholders. This activity considers the available data coming from the recurrent delay monitoring process (refer to section ), but a more in-depth analysis of local circumstances is performed. The following is considered: Historical evaluation of delays Actual real reason(s) for delays What is meant by ATC/Aerodrome delays Who is involved in the capacity declaration process and is there a buy-in from all the stakeholders (the capacity declaration should reflect ATC/Aerodrome limits) What are the reasons for additional traffic over and above the capacity declaration How is extra traffic such as General Aviation accommodated How many off-slot operations are experienced and how these are dealt with Is there an (efficient) slot monitoring committee 22
33 AOE supports individual airports in analysing their local reasons for delays by applying the following steps: Analysis of available data coming from the recurrent delay monitoring process (refer to section ) to track operational performance Analysis and identification of local reasons for delays Assistance in developing a local action plan for delay reduction Facilitate and monitor implementation of the local Action Plan and best practices Follow-up results and provide feedback Current status: The DMEAN Framework Programme has initially focused its activities on the 25 airports identified as having a potential effect upon the network in terms of ATFCM delay. The delay analysis process for a number of these airports has been initiated and a high-level timetable for further actions has been proposed. Refer to Annex 2 for further details on the status at each airport. Way forward In the context of the Challenges to Growth 2008 report, it is anticipated that more network constraining airports will be identified. In total, there were 9,352,583 minutes of delay attributable to airport regulations in 2007, generated by 201 individual airports. 40 airports contributed to 91% of the delay, and just 9 airports contributed to 50% of the delay (nearly 5 million minutes). There may also be a requirement to include seasonal airports in the group of constraining airports. In this context AOE will provide an enhanced list of network constraining airports (as a part of the study on real reasons for Airport ATM related delays - refer to section ). As a consequence, it is anticipated that the DMEAN activities will soon be extended to additional airports (anticipated 40 airports) Capacity Declaration Process Analysis Airport delays should not be considered in isolation. Capacity at a number of airports is limited and action is required to ensure that capacity is not superseded by demand at a particular moment on the day of operations. The experience gained at numerous airports indicates that regulations and delays are a daily reality, even in normal weather conditions. If we accept a commonly supported capacity declaration process, based upon accurate capacity assessment along with an efficient slot monitoring process, slot regulations should rarely be needed. Maximum airside capacity is not solely reliant on runway capacity. Aprons and taxiways must be capable of maintaining sufficient traffic throughput to match the runway capacity. Terminal area capacity, both arrivals and departures, terminal building, ATC staff levels and equipment should not be neglected during the capacity declaration process. This activity aims to promote the capacity declaration process amongst airport stakeholders, based on an accurate capacity assessment and an efficient slot monitoring process. Current status Generic guidelines are under development and will become available by Q as part of the Generic guidelines for identifying real reasons for delays and 23
34 recommendations for delay reduction refer to section Demand / Capacity Analysis This activity consists in identifying the airports that are expected to potentially affect the network on the next 5 years. The analysis is performed on a rolling 5 year basis, in line with the SESAR timeframes. The ratio of demand and capacity provides insight into the potential for delays at an airport. As well as the demand/capacity ratio for current traffic levels, medium term annual demand forecast data using airport specific high, base and low forecasts from STATFOR for each of the selected airports are considered in this activity. Although most of the 25 most constraining airports are coordinated airports (and therefore declare their capacity on a seasonal basis), annual airside capacity is sometimes difficult to obtain. Some airports publish detailed analysis on demand and capacity, taking into account hourly and seasonal variations, while others only publish an overall declared hourly capacity. There is a need to identify and define available best practices to determine annual declared capacity. The demand/capacity ratio will be computed on a yearly basis for the 3 different traffic growth scenarios and presented graphically in order to visualise the trend and anticipate any lack of capacity in the medium term. Current status: Under development and will be completed in Airside Capacity Enhancement (ACE) Activities The improvement of an airport s capacity baseline through efficiency enhancing activities, together with longer term local capacity planning is essential to maximise the benefit to the European network. In general terms this is done by: Unlocking latent capacity Maximising runway(s) potential Mitigating local constraints The ACE project s primary focus is to provide airport stakeholders with proven solutions in order to release latent airside capacity in the short term. ACE supports airports by: Identifying the operational practices to be assessed Holding forums (ATCO/Pilot, joint) to extract operational practices from field experts Providing proven operational / technical solutions based upon those in use at European airports with successful records of sustained high intensity runway operations Supplying guidance on methods for continuous improvement of local operations based upon best practices in areas such as ATC procedures, infrastructure changes, general efficiency enablers and low visibility conditions Launching awareness campaigns Facilitating airports in establishing a capacity enhancement plan (including short and medium term requirements) The implementation of the ACE best practices provides airport stakeholders with proven methodologies to release latent airside capacity in the short term, and thereby 24
35 reduce the level of delays and meet forecast demand. Further information on ACE can be found at the ACE website A-CDM Gap Analysis and Implementation The DMEAN Framework Programme enables a collaborative network approach. It supports all partners in delivering operational improvements to unlock Europe s potential capacity. As part of DMEAN, Airport CDM is identified as the driver and mechanism to dynamically integrate airports and the Network. As shown in Table 1, prime attention has been given to the 25 airports identified as having a potential effect upon the network. All 25 airports have been selected for an Airport CDM gap analysis study, to be conducted by the AOE Airport CDM project, followed by full Airport CDM implementation. With the forecast traffic demand and the limited infrastructure developments, the challenge of maximising operations at airports is increasing. There is an urgent need for full collaboration between the airport partners, to share operational data in a coherent and transparent manner in the context of arrivals, ground operations and departures. Action is needed now to avoid a negative impact on the network, resulting in more delays and increased operating costs Airport CDM Gap Analysis The Airport CDM gap analysis activity conducted by the EUROCONTROL Airport CDM project predominately looks at the data availability and exchange between the airport partners. Good operational procedures and cultural change are the essence of Collaborative Decision Making. As a result of an Airport CDM gap analysis, a report is produced highlighting the airport s compliance to EUROCONTROL Airport CDM implementation guidelines. The report seeks acceptance of the recommendations by all airport stakeholders such that A-CDM benefits are maximised, resulting in a phased approach to the implementation of the required Airport CDM concept elements. The objectives of the Airport CDM project are: To enable a permanent dialogue between the various airport partners through improved information management To exchange continuously updated information on relevant events in real-time To increase efficiency of airport operations To enable partners involved in ATM to achieve more efficient decision making, including the EUROCONTROL Central Flow Management Unit (CFMU), to optimise the ATFCM slot allocation process and achieve more efficient use of the ATM network capacity by dynamically sharing accurate departure information between airports and the European network
36 Airport CDM Implementation Based on the recommendations resulting from the Airport CDM gap analysis, airport partners agree an Airport CDM implementation plan. The implementation plan is often built upon a phased approach by incrementally implementing the Airport CDM concept elements, considering local constraints and priorities. Detailed Information on each of the steps for implementation of Airport CDM can be found at the A-CDM website Dynamically Integrating Airports into the ATM Network Enhancing data Exchange between Airports and the CFMU The exchange of Flight Update Messages (FUM) and Departure Planning Information (DPI) messages between a CDM Airport and the CFMU aims to further improve the flexibility of airport operations enabling an optimal use of the European network. The FUM generated by the CFMU provides airports with very accurate estimated landing times based on radar data. The DPI messages sent by airports to the CFMU provide the CFMU with enhanced take off estimates during the arrival, turnaround and departure phases based on the progress of the flight. An improved awareness of off-block times with variable taxi out times leads to a reduction in lost ATFCM slots and improved ATFCM slot adherence. Benefits to date Airport CDM is seen as the mechanism to integrate airports in the network. The EUROCONTROL Airport CDM Project, in conjunction with the CFMU, has been testing and validating the Departure Planning Information (DPI) messages with a number of European airports and first results have proven very positive. On 7 th June 2007, Munich Airport became the first European Airport to fully implement Airport CDM. One of the significant outputs was exchange of DPI messages with CFMU Enhanced Tactical Flow Management System (ETFMS). These messages are now fully processed by the operational system for all flights departing from Munich Airport. DPI messages provide the CFMU with accurate predictions of off-block times and take-off times, based on collaborative procedures. With this real-time data the CFMU updates its operational flight profile calculations and shares the information with downstream arrival units. Refer to paragraph below for more details about expected network benefits. The local benefits of implementing Airport CDM at Munich Airport are significant. These include enhanced operational efficiency, reduction in delay, use of available infrastructure and resources, predictability and a 10% average reduction in taxi times for departures. The fuel saving at Munich alone is 2.65 million per annum. More details on the Airport CDM Munich implementation can be found at Expect Network Benefits The benefits of Airport CDM are not limited to the airport concerned. It is increasingly recognised that with more airports implementing collaborative decision making, the local benefits expand into the ATM network as a whole, further increasing the positive impact of this way of working
37 During 2006 AOE conducted a Generic Cost Benefit Analysis to provide a comprehensive economic analysis from the development, deployment and operation of Airport CDM. This CBA reports the results on the European industry level, drawing on results from the site-specific CBAs of Barcelona, Brussels, Munich and Zurich airports. Special attention was given to the identification of network benefits. The predicted main benefit is an increase in en-route capacity of 0.5%. This estimation was provided by CFMU, based on expert judgment and results obtained out of the on-going trials. It is important to note that in the network capacity, only en-route capacity was considered in the network benefits quantification process and not airport capacity. In terms of flow and capacity management, the benefits would not come solely from the reduction of delays. Airspace users would possibly benefit to an even greater degree from an increased freedom of choice, where they are able to consider tradeoffs to suit their particular business needs in respect of the flights concerned (e.g. less delay but longer route, etc.). Network benefits will grow as the number of airports implementing Airport CDM increases. Enhanced data for quantification will become available by the time additional airports have entered into the message exchange process with the CFMU at the end of Taking advantage of this, an initial CBA focussing specifically on the network benefits of A-CDM is currently being conducted and first results are expected by Q This CBA is expected to produce more reliable estimation on potential increase in enroute capacity. Current status The CFMU continues to further refine the DPI message exchange with Munich Airport and minimal upgrades are required to further enhance the processing of these messages. Additional improvements are planned for the next ETFMS system upgrade scheduled for November In the meantime operational evaluation continues between the CFMU, Brussels and Zurich Airports. Way forward Due to diverse local airport issues it is difficult to predict when an airport will be mature enough to start exchanging DPI messages with the CFMU. To facilitate this process CFMU and the Airport CDM team are currently defining the minimum Airport CDM requirements for airports to commence data exchange with the CFMU. Joint Action Plan between AOE and the CFMU With the rapid increase in airports currently implementing Airport CDM, it s essential to put in place the necessary means to connect airports to the network (DPI messages exchange with the CFMU) as soon as they reach the required implementation maturity level. In this way the overall benefits are achieved in the shortest period of time. To support this need a joint action plan between the EUROCONTROL Airport CDM Project team and the CFMU is currently under development will be fully established by Q The main objective of this joint action plan is to extend the number of airports exchanging messages with CFMU leading to quicker achievement of overall network benefits. 27
38 The action plan will include: a list of airports, definition of minimum A-CDM requirements, implementation timescales for both airports and CFMU developments and full planning for DPI processing, including a list of actions to be taken by partners and requested resources. This action plan aims to secure the implementation of the exchange of DPI messages with the CFMU for 4 to 5 additional airports per year during the 2008 to 2013 period Contribution to Network Operations Plan (NOP) This activity currently aims to incorporate relevant capacity data for the 25 most constraining airports into the Summer and Winter editions of the Network Operations Plan (NOP). The AOE airport data sheets are an essential enabler for this process. Current status Currently, emphasis is placed on building communication channels with concerned airports. The last data collection campaign managed to obtain Summer 2008 NOP data from 20 airports of the 25 addressed. This represents an improvement compared with the contribution to previous data collections. Way forward The AOE process of producing airport data sheets requires the collaboration of each airport key stakeholder to incorporate appropriate local information. Obtaining the relevant airport data remains a difficult issue in this process and increased collaboration from involved airports is expected in the short term Action Plans in support of DMEAN activities IATA / EUROCONTROL Joint Action Plan In October 2007 IATA and EUROCONTROL proposed a joint action plan to enhance capacity and efficiency at 18 airports where capacity constraints have an effect upon the European network. It was emphasised that the participating airports (refer to Annex 3) are essential to the operational network; i.e. the delay generated at one of them generally provokes reactionary delays, of a different magnitude, at other airports in the network. The objective of the Action Plan was to agree with concerned airports realistic implementation dates for a number of capacity enablers, such as: Delay reduction Runway capacity enhancement A-CDM implementation High Intensity Runway Operations (HIRO) A-SMGCS level 1 Low Visibility Procedures according ICAO DOC 013 Optimising runway change configuration (e.g. criteria -20 kts crosswind) 28
39 ACI EUROPE supports this Action Plan with the condition that implementation target dates are agreed with the involved airports. The following provides an overview of progress achieved so far. Current status: 11 airports, i.e. Madrid, Barcelona, Frankfurt, Munich, Zurich, Geneva, Heathrow, Amsterdam, Warsaw, Brussels and Budapest responded to the letter. They supported the common Action Plan and provided updates, which are reflected in the table at Annex 3. 7 airports, i.e. Milano Malpensa, Rome Fiumicino, Vienna, Paris CDG, Istanbul, Prague and Helsinki, had not responded at the time of publication. Next Steps for 2008 Continue to seek support from airports that have not yet responded to the common Action Plan Monitor the implementation of the airport capacity and efficiency enablers in full cooperation with local airport operator, ANSPs and airlines Propose the action list to other airports that risk becoming network constraining following increasing demand AENA / EUROCONTROL Joint Action Plan In January 2008 it was agreed between EUROCONTROL and AENA that EUROCONTROL support the implementation of the following AOE products at a number of AENA Spanish airports: Delay analysis Airport Capacity Enhancement (ACE) Airport CDM A-SMGCS (Levels 1 and 2) CDA (Continuous Descent Approach) The objective of this joint Action Plan is to baseline the SESAR Programme by accelerating the implementation of the best practices mentioned above. Implementation Targets: Airport Capacity Enhancement (ACE): 1 airport per year Delay analysis: 3 airports per year A-CDM: Palma by end 2009 and Madrid by end 2010 A-SMGCS: Palma in 2008, Madrid and Barcelona in 2009 CDA: Madrid in 2008 during low traffic hours initially Ideally, this kind of joint Action Plan should be replicated with most, if not all EUROCONTROL Member States and their respective airport authorities. This would ensure more ECAC Airports and States buy-in leading to extended benefits. 29

40 7. EXPECTED MEDIUM-TERM PERFORMANCE OF THE ATM NETWORK The continuing strong traffic growth predicted in the medium-term for the European ATM network will put it under high pressure, requiring upgrade of capacity plans and full implementation of capacity enhancement measures. The following paragraphs give an outlook of the expected performance of the European ATM network in the short- to medium term (2009 to 2011). This prognosis is based on current capacity plans and expected traffic demand and is the result of simulations performed with the tools used in the capacity planning process, combined with operational analysis made by the EUROCONTROL Capacity Enhancement Function. Included is a network delay forecast and an identification of potential bottlenecks areas for the years 2009/ Medium-term delay forecast The medium-term delay forecast illustrated below was made with respect to the baseline growth of the latest EUROCONTROL STATFOR Medium-Term traffic forecast ( ), and according to the local capacity plans documented in the LCIP The aim is to provide an early identification of critical areas and ensure that early action is taken to upgrade local capacity plans and enhance capacity at local and network level. The following graph gives an indication of the enroute average delay forecast for the Summer period (May-October) for the years En-Route ATFM Delay Evolution - Summer Season All causes included 6 Average delay (min/ flight) Actual en-route delay PC target En-route delay forecast En-Route ATFM Delay 5,5 3,6 3,1 1,8 1,2 1,2 1,3 1,4 1,6 PC Target 2,8 2,8 2,8 2,4 2,1 1,7 1, En-route ATFM delay forecast 1, ,5 The maps on the following pages give an indication of the delay forecast at ACC level for 2009 for the baseline and high traffic growth scenarios, and for 2010 and 2011 for the baseline forecast, deemed to be the most likely scenario. 30
41 31
42 Based on current information, it is expected that the PC delay target will not be reached in 2009 or 2010, even for the baseline traffic growth scenario. Some improvement should be evident in 2011, following the completion of some major projects. 32
43 8. EXPECTED ENROUTE CAPACITY PERFORMANCE ( ) 8.1. Potential bottleneck areas and expected solutions The evaluation of the potential bottleneck areas for 2009 and 2010 was made with the NEVAC tool. It is based on realistic maximum sector configurations, opening schemes and the latest elementary sector and/or traffic volume capacities declared to the CFMU. Sector configurations, opening schemes and sector capacities will certainly improve in line with the local capacity plan detailed in the individual ACC annexes; nevertheless, it is hoped that the identification of these areas will help to focus capacity enhancement efforts in the short term. Austria Vienna ACC Potential bottleneck sectors: SSH, ESH, collapsed sectors Improvements foreseen: Additional controllers Improved sectorisation including additional sectors Croatia- Zagreb ACC Potential bottleneck sectors: ULWX Improvements foreseen: Increased sector capacities following full CAPAN analysis Winter 2008/2009 Improved sector configurations with possible DFL changes Cyprus Nicosia ACC Potential bottleneck sectors: WN or WUNU in 4 sector configuration Improvements foreseen: Implementation of a new ops room and ATM system (LEFCO) Reassessment of sector capacities and traffic counts Additional controllers Czech Republic Potential bottleneck sectors: NEH, NEHT, SWHT Improvements foreseen: Additional controllers France Brest ACC Potential bottleneck sectors: ZI, XIU, G, NU Improvements foreseen: La Manche project ATFCM measures ACC sizing France Paris ACC Potential bottleneck sectors: UJ Improvements foreseen: Introduction of new AP sector at interface with MUAC Autumn 2009 Paris / Reims interface project Autumn 2008 ATFCM measures ACC sizing Implementation of additional sectors 33
44 France Reims ACC Potential bottleneck sectors: UN/XN, XEKE, XHKH Improvements foreseen: Paris / Reims interface project Autumn 2008 Implementation of missing route segments ATFCM measures ACC sizing Italy Padova ACC Potential bottleneck sectors: NTT Improvements foreseen: Revised sector loads Reorganisation of Italian airspace Germany Karlsruhe UAC Potential bottleneck sectors: FFMT, FFMM Improvements foreseen: New ATM system Reorganisation of Munich/Karlsruhe airspace Poland Warsaw ACC Potential bottleneck sectors: C, D and G Improvements foreseen: Sector reorganisation and route network changes Additional staff Further improvements required: Implementation of an optimum sectorisation including vertical sector split is not possible before the implementation of the new ATM system in Winter 2009/10 Portugal Lisbon ACC Potential bottleneck sectors: CENL, UPNC Improvements foreseen: Optimisation of airspace structure Improved sector opening times Additional controllers Spain Barcelona ACC Potential bottleneck sectors: LG, MN Improvements foreseen: Complete reorganisation of sectorisation and route network structure at the Barcelona/ Madrid/ Bordeaux interface Winter 2009/10 ATFCM measures Improved sector configurations and opening schemes Spain Madrid ACC Potential bottleneck sectors: PAU, TLL, TLU Improvements foreseen: Complete reorganisation of sectorisation and route network structure at the Barcelona/ Madrid/ Bordeaux interface Winter 2009/10 ATFCM measures Improved sector configurations and opening schemes Spain Seville ACC Potential bottleneck sectors: PIM Improvements foreseen: ATFCM measures Improved sector configurations and opening schemes 34
45 Switzerland Geneva ACC Potential bottleneck sectors: KL1W, KL2W, all collapsed sectors Improvements foreseen: Revised sectorisation Additional staff Switzerland Zurich ACC Potential bottleneck sectors: M4, all collapsed sectors. Some system problems. Improvements foreseen: 2 additional sectors FL245+ Spring 2010 Revised sectorisation Additional staff UK London ACC Potential bottleneck sectors: 25GLMW, 13CLW, GLAK, DTN, HRW, LND Improvements foreseen: Improved ATFCM and ATM techniques Several resectorisation and route network improvement actions La Manche project New ATM system UK London TC Potential bottleneck sectors: CPT, LAM, SWD, WIL Improvements foreseen: Improved ATFCM and ATM techniques Spring 2009 Reorganisation of sectorisation Spring 2010 Dynamic sector configuration Flexible use of staff UK Manchester ACC Potential bottleneck sectors: NL, IOM Improvements foreseen: Improved ATFCM and ATM techniques Several airspace and sector development actions Flexible use of staff Merge with Scottish ACC EUROCONTROL Maastricht UAC Potential bottleneck sectors: BEH2, LXL1, ZEEHI1, MNHI Improvements foreseen: Implementation and consolidation of operations of the new FDPS Possible reorganisation of individual sector groups Additional sector in the Brussels sector group Summer 2010 Improved ATFCM / ASM procedures Autumn 2008 Incremental benefits from MANTAS (gates/fences) Flexible rostering For full details of capacity plans see the individual ACC annexes Expected Performance at Regional level As a result of the postponement of major projects in western Europe, delays will be higher than expected in 2009 and 2010, with improvement only from A major issue identified for the medium-term is the shortage of controllers, likely to prevent the opening of optimum sector configurations and one of the major obstacles to enhancing performance at local level. The following paragraphs address, at a high level, the expected performance of various areas in Europe. 35
46 South-Western Europe (Spain - Portugal) The current capacity plans for ACCs in Spain and Portugal need to be upgraded to meet the higher baseline traffic growth predicted in the new medium term forecast. In the case of high traffic growth, delays could increase significantly. North-Western Europe (France UK Ireland Belgium Netherlands Germany Switzerland - Maastricht UAC) At this stage no significant problems are expected for the French ACCs provided that planned capacity enhancement measures are fully implemented. London ACC and London TC will generate significant delay, with an improvement likely in At Maastricht UAC, performance is likely to remain at optimum level, provided that the planned measures are implemented, including full exploitation of the new FDPS, and that sufficient controllers are available to open optimum sector configurations. Delays at Karlsruhe UAC are expected to increase pending the introduction of the new VAFORIT system and the subsequent reorganisation of airspace between Karlsruhe UAC and Munich ACC. The performance of Geneva ACC and Zurich ACC should improve following the expected upgrade of capacity plans in line with the new higher traffic forecast. Performance will continue to be good in Ireland, Belgium and the Netherlands. Northern Europe (Norway - Denmark - Sweden - Finland - Estonia - Latvia - Lithuania) No problems are foreseen for ACCs in Northern Europe, where sufficient capacity will be available to meet the expected traffic increase. Southern Europe (Italy - Malta) Padova ACC could see a deterioration in performance in 2008, unless plans are upgraded in line with the higher traffic forecast. No problems are foreseen for Brindisi ACC, Milan ACC, Malta ACC or Rome ACC. Central Europe (Poland - Czech Republic - Slovak Republic Austria Hungary- Slovenia - Croatia) No specific problems are expected in Croatia, Hungary, the Slovak Republic or Slovenia. Delays could increase significantly at Vienna ACC unless staffing constraints can be overcome and capacity plans upgraded. The capacity plan needs to be upgraded at Prague ACC to meet the expected high traffic demand. Warsaw ACC will continue to generate high levels of delay until implementation and consolidation of operations of the new ATM system allows additional sectors to be created. South-Eastern Europe (Romania - Bulgaria - Serbia and Montenegro - FYROM - Albania - Greece - Turkey - Cyprus) Delays will increase at Nicosia ACC as staff shortages continue and while the new ATM system is not fully operational. The delay forecast shows some enroute delays at Izmir ACC, especially for high traffic growth. No problems are foreseen in other ACCs in South-Eastern Europe, where sufficient capacity will be available to meet the expected traffic increase. 36
47 9. CONCLUSIONS Current plans show that the PC en-route delay target is unlikely to be met over the period , even for a baseline traffic growth. Further upgrade of capacity plans is essential, particularly in areas of high traffic growth. In spite of considerable efforts made to ensure a more effective and flexible resource utilisation, problems are expected at many ACCs. The availability of optimum sector configurations will be a problem, unless staffing issues and constraints are addressed. Commitment to the timely implementation of existing plans also remains a critical aspect. There is extremely high sensitivity to the traffic growth in the busy ACCs (NW, SW and Central Europe); in the case of high traffic growth, delays could rise significantly. Even if all capacity plans are fully implemented, delays are expected to remain high in Poland, Austria and Czech Republic. The busy ACCs in south-western and northwestern Europe could see a significant increase in enroute delay if their capacity enhancement plans are not fully realised. The main concerns are the timely availability of controllers and the postponement of major ATM system improvements, which could further reduce capacity over long periods, taking into account prior controller training and consolidation of operations post implementation. The focus on the full integration of capacity planning, civil-military cooperation, airspace design and management, airport operations and ATFCM into a network approach must be further strengthened. This is fully in line with DMEAN and will ensure that the European ATM network is able to evolve and to respond to future requirements. As a result of the above, there is a clear need to ensure: Upgrade and/or full implementation of existing local and network plans and initiatives; Timely availability of controllers; The reinforcement of European ATM network programmes; The reinforcement of capacity planning and management actions at network level. 37
48 INTENTIONALLY LEFT BLANK 38
49 ANNEX 1 : ACC TRAFFIC & CAPACITY The following pages provide a summary of the traffic forecast and capacity enhancement plans over the period for individual ACCs in each ECAC State. The capacity plans are based on the information included in the Local Convergence and Implementation Plan for the period (LCIP ), and include information available from various sources (e.g. CEF, CFMU, FMP, RNDSG, STATFOR). Note that the capacity plans in this document were formulated in response to the capacity requirement profiles , which were based on the February 2007 STATFOR MTF. The new traffic forecast is higher than the previous one, with the result that the capacity requirement profiles are higher than the profiles. By comparing existing plans with the new traffic forecast, we have an early indication of whether current plans will meet future traffic growth. From the delay forecast, it is clear that some local capacity plans need to be upgraded in Autumn 2008 to meet the new, higher, capacity requirements. Each annex includes: Traffic forecast The traffic forecast per ACC is derived from the EUROCONTROL STATFOR Medium-Term traffic Forecast (MTF), released in March 2008 using NEVAC. The impact of realignment along the shortest available routes with generally unconstrained vertical profiles is determined using SAAM. Planned capacity enhancement measures Sector evolution The table summarises the planned capacity enhancement measures identified in the LCIP and gives the resulting annual capacity increases. Some capacity enhancement actions are shown over several years as their potential is not limited to one year - the starting year shown is the year the measure is expected to be implemented. Sector evolution is the expected evolution of the number of operational sectors in the maximum configuration i.e. the maximum number of operational sectors that can be opened simultaneously. En-route Summer delay forecast for the years 2009 and 2010 The delay forecast is derived for each ACC with the support of the tools used in the capacity planning process. The delay forecast is based on the current capacity plans as described in the LCIP and on the latest baseline EUROCONTROL STATFOR ODZ traffic forecast data (MTF released in March 2008). Expected Summer performance A brief description of the expected performance of the ACC, including foreseen problems and possible mitigating measures. 39
50 ALBANIA TIRANA ACC Traffic forecast ACC Growth H 14% 19% 24% 31% Tirana B 8% 14% 18% 22% L 4% 7% 10% 14% Shortest Routes: No significant Impact % growth per ACC v. 2007, based on STATFOR MT Forecast Planned capacity enhancement measures Sector evolution Capacity Plan Year ATS route network improvements Move to new Capacity benefits from new ATM Measures Additional sector ATS facilities system planned Increased sector 9 additional capacities controllers Max sectors Capacity increase p.a. 4% 4% 2% 4% En-route Summer delay forecast ( ) Based on the current capacity plan, the en-route 2009 and 2010 Summer delay forecast for Tirana ACC are 0.3 and 0.4 minutes per flight, for the baseline traffic growth. Expected Summer performance ( ) Analysis shows that the LOW sector at Tirana ACC could be a bottleneck in 2009/10. However, the plan to increase sector capacities should improve the situation. 40
51 ARMENIA YEREVAN ACC Traffic forecast ACC Growth H 28% 40% 53% 70% Yerevan B 24% 34% 45% 57% L 19% 29% 37% 49% Shortest Routes: No significant Impact % growth per ACC v. 2007, based on STATFOR MT Forecast Planned capacity enhancement measures - Sector evolution Capacity Plan Year Measures planned Max sectors Capacity Sufficient Capacity to meet expected demand increase p.a. En-route Summer delay forecast ( ) Based on the current capacity plan, no en-route Summer delays are expected at Yerevan ACC. Expected Summer performance ( ) No problems are expected at Yerevan ACC in 2009/10. 41
52 AUSTRIA TIRANA ACC Traffic forecast ACC Growth H 16% 23% 29% 37% Vienna B 12% 17% 22% 27% L 7% 11% 14% 18% Shortest Routes: No significant Impact % growth per ACC v. 2007, based on STATFOR MT Forecast Planned capacity enhancement measures - Sector evolution Capacity Plan Year Additional controllers envisaged Improved sectorisation and additional sectors ATS route network improvements Measures Improved operational procedures planned Sector configuration management ATM system upgrade (stripless, multi-sector planning and initial Data link MTCD) EASY Anticipated Training Significant activities for the Events new ATM System A12 Max sectors Capacity increase p.a. 6 % 6 % 6 % 6 % Additional Information Autumn 2009 : Training for EASY Spring 2010 : Implementation of EASY Enroute Summer Delay Forecast ( ) Based on the current capacity plan, the en-route Summer delay forecast for Vienna ACC is 3.2 minutes per flight in 2009, and 2.7 minutes per flight in 2010, for the baseline traffic growth. Expected Summer Performance ( ) Due to staffing situation, Vienna ACC is not expected to close the capacity gap in In 2010, an improvement of the situation is depending on staff availability. Potential bottleneck sectors: SSH, ESH, all collapsed sectors 42
53 AZERBAIJAN BAKU ACC Traffic forecast ACC Growth H 32% 48% 64% 81% Baku B 27% 40% 53% 68% L 23% 35% 46% 58% Shortest Routes: No significant Impact % growth per ACC v. 2007, based on STATFOR MT Forecast Planned capacity enhancement measures - Sector evolution Capacity Plan Year ATS route network optimisation Measures An on-going process in co-operation with neighboring States. Installation of new automated ATC systems in Baku, Ganja and planned Nakhchivan. Preparation phase is launched. Max sectors 4 + 1APP 4 + 1APP 4 + 1APP 4 + 1APP Capacity increase p.a. Sufficient capacity to meet demand En-route Summer delay forecast ( ) Based on the current capacity plan, no en-route Summer delays are expected at Baku ACC. Expected Summer performance ( ) No problems are expected at Baku ACC. 43
54 BELGIUM BRUSSELS ACC Traffic forecast ACC Growth H 7% 11% 15% 20% Brussels B 3% 6% 9% 13% L 0% 2% 4% 6% Shortest Routes: No significant Impact % growth per ACC v. 2007, based on STATFOR MT Forecast Planned capacity enhancement measures - Sector evolution Capacity Plan Year Measures CANAC 2 planned Optimum use of sector configurations Max sectors Capacity increase p.a. 0% 2% 3% 0% En-route Summer delay forecast ( ) Based on the current capacity plan, no en-route Summer delays are expected at Brussels ACC, for the baseline traffic growth. Expected Summer performance ( ) No problems are expected at Brussels ACC. 44
55 BULGARIA SOFIA ACC Traffic forecast ACC Growth H 21% 30% 38% 47% Sofia B 16% 22% 29% 37% L 10% 15% 21% 26% Shortest Routes: -19% % growth per ACC v. 2007, based on STATFOR MT Forecast Planned capacity enhancement measures - Sector evolution Capacity Plan Year SATCAS v2 implementation Measures planned Implementation of single ACC Radar sharing and OLDI links with adjacent ACCs ATS route network development Max sectors Up to 10* Up to 10* Up to 10* Up to 11* Capacity increase p.a. Sufficient capacity to meet demand *According to traffic demand, up to 10 sectors can be opened from 2009 to 2011, 11 sectors in 2012 En-route Summer delay forecast ( ) Negligible en-route Summer delays are expected at Sofia ACC. Expected Summer performance ( ) No problems are expected at Sofia ACC. 45
56 CROATIA ZAGREB ACC Traffic forecast ACC Growth H 16% 23% 30% 39% Zagreb B 11% 17% 22% 28% L 6% 10% 13% 18% Shortest Routes: +29% % growth per ACC v. 2007, based on STATFOR MT Forecast Planned capacity enhancement measures - Sector evolution Capacity Plan Year Consolidation of operations and additional functionalities of CroATMS Additional controllers (net increase of Controllers 5/year) Additional sectors and optimised sectorisation* Further increase of sector capacities Measures planned SYSCO with Padova ACC Improved sector opening times Application of sector occupancy techniques Optimisation of ATS route network Automated links with APP/TWR and links between CroATMS & local Croat airport CWPs Max sectors 8-9 9* 9* 9* Capacity increase p.a. 10% 10% 10% 10% *a higher number of sectors is possible, but it depends on traffic growth and regional developments En-route Summer delay forecast ( ) If all planned measures are implemented, the Summer en-route delay is expected to be around 0.4 minutes per flight in 2009 and 0.2 minutes per flight in 2010, according to the baseline traffic growth. Expected Summer performance ( ) The situation in Zagreb ACC could be improved if higher configurations are made available, and sector capacities are increased. However, the traffic could increase significantly due to realignment on the shortest available routes. Potential bottleneck sectors: ULWX 46
57 CYPRUS NICOSIA ACC Traffic forecast ACC Growth H 16% 24% 32% 42% Nicosia B 11% 16% 24% 30% L 7% 12% 17% 23% Shortest Routes: No significant Impact % growth per ACC v. 2007, based on STATFOR MT Forecast Planned capacity enhancement measures - Sector evolution Capacity Plan Year Implementation of the new ATM system LEFCO and new ACC Consolidation of operations of new system and ACC Measures planned New LCLK TMA implementation OLDI with Athens and possibly with Egypt Capacity benefits from new TMA LCPH TMA implementation 4 th enroute sector 5 th enroute sector ATS route network and sectorisation optimisation Additional staff (radar and APP) Max sectors Capacity increase p.a. Additional Information 6% 10% 10% 5% Operations of the new Larnaca TMA in 2009 will increase the capacity of the West enroute sector. En-route Summer delay forecast ( ) Based on the current capacity plan, the en-route Summer delay forecast for Nicosia ACC is expected to be around 0.9 minutes per flight in 2009 and 0.5 minute per flight in 2010, for the baseline traffic growth scenario. Expected Summer performance ( ) The main bottleneck is expected to be sector WN or WUNU in the 4 sector configuration that only marginally improves the situation. Resectorisation and reassessment of sector capacities should be undertaken with due urgency. 47
58 CZECH REPUBLIC PRAGUE ACC Traffic forecast ACC Growth H 18% 27% 36% 45% Prague B 13% 20% 27% 34% L 9% 13% 17% 22% Shortest Routes: No significant Impact % growth per ACC v. 2007, based on STATFOR MT Forecast Planned capacity enhancement measures - Sector evolution Capacity Plan Year Improved flow and capacity management techniques Adaptation of sector opening times depending on available staff Improved ATS route network & sectorisation Measures Additional controllers planned Redesign of lower airspace Additional sector including TMA Significant Events Improvements of system functionalities Parallel runway ops at Prague airport Max sectors Capacity increase p.a. 7% 5% 5% 5% Additional Information The implementation of additional sectors is fully dependant on availability of new controllers. En-route Summer delay forecast ( ) Based on the current capacity plan, en-route Summer delays are expected to be around minutes per flight in 2009 and 2010, for the baseline traffic growth. Expected Summer performance ( ) The reduction of the capacity gap will be fully dependant on staff availability. Potential bottleneck sectors are NEH, NEHT, SWHT 48
59 DENMARK COPENHAGEN ACC Traffic forecast ACC Growth H 11% 16% 21% 27% Copenhagen B 7% 11% 14% 19% L 3% 6% 9% 12% Shortest Routes: No significant Impact % growth per ACC v. 2007, based on STATFOR MT Forecast Planned capacity enhancement measures - Sector evolution Capacity Plan Year Consolidation of operations and further capacity benefits from new ATM Measures planned system Gradual increase of controller numbers Sector configurations adapted to traffic demand Constant upgrade of ATM system Significant Events Climate UN summit Max sectors 4 (E) + 3 (W) 4/5 (E) + 3 (W) 4/5 (E) + 3 (W) 4/5 (E) + 3 (W) Capacity increase p.a. 5% 5% 5% 5% En-route Summer delay forecast ( ) Based on the current capacity plan, en-route Summer delays are expected to be around 0.1 minutes per flight in 2009 and 2010, for the baseline traffic growth. Expected Summer performance ( ) No problems are expected at Copenhagen ACC in 2009/2010, provided that full benefit is taken from the implementation and consolidation of the new ATM system at ACC/APP/TWR, and sufficient controllers are available. 49
60 ESTONIA TALLINN ACC Traffic forecast ACC Growth H 22% 32% 42% 55% Tallinn B 16% 24% 32% 43% L 10% 16% 23% 29% Shortest Routes: No significant Impact % growth per ACC v. 2007, based on STATFOR MT Forecast Planned capacity enhancement measures - Sector evolution Capacity Plan Year Additional staff and controller rating Adaptation of sector opening times Availability of additional sectors Measures planned Max sectors Capacity increase p.a. Sufficient capacity to meet demand En-route Summer delay forecast ( ) No en-route Summer delays are expected at Tallinn ACC. Expected Summer performance ( ) No problems are expected at Tallinn ACC. 50
61 EUROCONTROL MAASTRICHT UAC Traffic forecast ACC Growth Maastricht H 12% 17% 22% 28% B 8% 11% 15% 20% L 4% 6% 9% 12% Shortest Routes: No significant Impact % growth per ACC v. 2007, based on STATFOR MT Forecast Planned capacity enhancement measures - Sector evolution Capacity Plan Year Measures planned Phased exploitation and further development of N-FDPS Improved efficiency and flexibility of rosters enabled by new roster and break planner tools MPP improved by increased availability of controllers Improved efficiency and flexibility through controller validation across sector groups Consolidated sector configuration optimisation programme 3 rd layer in critical upper sectors Implementation of balcony sectors and stepped DFL BRU High West Split Re-organisation of HAN/COASTAL sectors Redesign of sectorisation not bound by current sector groups Mixed routing (gates/fences/mantas) Variable DFL MTCD Tactical Capacity Management (TCM), Pre-tactical Cell and Central Supervisory Suite (CSS) Traffic Management System (TMS), integrating traffic prediction, sector configuration management, performance monitoring and cost-efficiency analysis tools to support tactical decision making. Benefits from DMEAN implementation programme Increased benefit from AGDL applications through progressively higher equipage rate and new applications Max sectors Capacity 4% 4% 4% 4% increase p.a. En-route Summer delay forecast ( ) Based on current plans, the en-route Summer delays are expected to be around minutes per flight in 2009 and 2010, for the baseline traffic growth. Expected Summer performance ( ) Given the current high levels of throughput, the traditional methods of increasing ATC capacity are considered to be almost exhausted. The main focus will be on manpower planning, ATFCM processes and supporting tools. A certain capacity gap will remain, pending more fundamental network solutions beyond MUAC airspace. 51
62 FINLAND ROVANIEMI ACC Traffic forecast ACC Growth H 8% 11% 14% 16% Rovaniemi B 5% 8% 9% 14% L 0% 1% 3% 6% Shortest Routes: No significant Impact % growth per ACC v. 2007, based on STATFOR MT Forecast Planned capacity enhancement measures - Sector evolution Capacity Plan Year Measures planned Max sectors Capacity increase p.a. Sufficient Capacity to meet expected demand En-route Summer delay forecast ( ) Based on the current capacity plan, no en-route Summer delays are expected at Rovaniemi ACC. Expected Summer performance ( ) No problems are expected at Rovaniemi ACC. 52
63 FINLAND TAMPERE ACC Traffic forecast ACC Growth H 10% 11% 13% 20% Tampere B 5% 8% 11% 15% L 2% 3% 4% 8% Shortest Routes: No significant Impact % growth per ACC v. 2007, based on STATFOR MT Forecast Planned capacity enhancement measures - Sector evolution Capacity Plan Year Measures planned Max sectors Capacity increase p.a. Sufficient Capacity to meet expected demand En-route Summer delay forecast ( ) Based on the current capacity plan, no en-route Summer delays are expected at Tampere ACC. Expected Summer performance ( ) No problems are expected at Tampere ACC. 53
64 FRANCE BORDEAUX ACC Traffic forecast ACC Growth H 10% 15% 20% 24% Bordeaux B 7% 10% 14% 18% L 4% 5% 8% 11% Shortest Routes: +5% % growth per ACC v. 2007, based on STATFOR MT Forecast Planned capacity enhancement measures - Sector evolution Capacity Plan Year Improved Airspace Management and ATFCM Procedures Measures Staff deployment / Flexible rostering planned ESSO Project (Spring 2009) Max sectors 21UCESO 21 UCESO 21 UCESO 21 UCESO Capacity increase p.a. 5% 5% 5% 5% En-route Summer delay forecast ( ) Based on the current capacity plan, the en-route Summer delays are expected to be around 0.1 minutes per flight, for the baseline traffic growth. Expected Summer performance ( ) No particular problems are expected at Bordeaux ACC, provided that sector configurations are optimised to meet demand. 54
65 FRANCE BREST ACC Traffic forecast ACC Growth H 11% 16% 20% 25% Brest B 7% 11% 14% 18% L 4% 6% 9% 11% Shortest Routes: No significant Impact % growth per ACC v. 2007, based on STATFOR MT Forecast Planned capacity enhancement measures - Sector evolution Capacity Plan Year Improved airspace management and ATFM procedures Staff redeployment / flexible rostering Sector Manche Measures planned project Re-organisation of lower airspace and delegation of ATS to APP units below FL145 (for relevant airspace) New Ops Room Max sectors 18 UCESO 18 UCESO 21 UCESO 21 UCESO Capacity increase p.a. 5% 5% 5% 5% En-route Summer delay forecast ( ) Based on the current capacity plan, the en-route Summer delays are expected to be around 0.1 minutes per flight in 2009 and 2010, for the baseline traffic growth. Expected Summer performance ( ) No particular problems are expected at Brest ACC, provided that sector configurations are optimised to meet demand. However, potential bottleneck sectors are ZI, XIU, G, NU. 55
66 FRANCE MARSEILLE ACC Traffic forecast ACC Growth H 12% 17% 22% 28% Marseille B 9% 13% 17% 22% L 5% 7% 10% 14% Shortest Routes: -4% % growth per ACC v. 2007, based on STATFOR MT Forecast Planned capacity enhancement measures - Sector evolution Capacity Plan Year Improved airspace management and ATFM procedures Staff redeployment / flexible rostering Provence project (MTL for October 2008 and full project for Summer 2010) Reorganisation of interface with LIRR (ALG) Cbw-wg Measures Reorganisation Reorganisation of interface with planned of Nice TMA LECB (Muren- Morss) SBAM Project Sector D Reorganisation of lower airspace Reorganisation of interface with LECB (lumas) and delegation of ATS to APP Perpignan/Mont pelier below FL145 Max sectors 28 UCESO 29 UCESO 30 UCESO 30 UCESO Capacity increase p.a. 5% 5% 5% 5% En-route Summer delay forecast ( ) Based on the current capacity plan, the en-route Summer delays will be negligible. Expected Summer performance ( ) No particular problems are expected at Marseille ACC. 56
67 FRANCE PARIS ACC Traffic forecast ACC Growth H 10% 14% 18% 20% Paris B 6% 10% 13% 16% L 3% 5% 7% 10% Shortest Routes: No significant Impact % growth per ACC v. 2007, based on STATFOR MT Forecast Planned capacity enhancement measures - Sector evolution Capacity Plan Year Improved airspace management and ATFM procedures Staff redeployment / flexible rostering Measures planned Reorganisation of NE UIR (UJ / SU) TE/RAPOR Max sectors 24 UCESO 24 UCESO 24 UCESO 24 UCESO Capacity increase p.a. 3% 3% 3% 3% En-route Summer delay forecast ( ) Based on the current capacity plan, the en-route Summer delays are expected to be around 0.3 minutes per flight in 2009 and 2010, for the baseline traffic growth. Expected Summer performance ( ) UJ is likely to be the main bottleneck sector for Paris ACC. 57
68 FRANCE REIMS ACC Traffic forecast ACC Growth H 11% 15% 20% 24% Reims B 7% 11% 14% 18% L 3% 5% 8% 11% Shortest Routes: +5% % growth per ACC v. 2007, based on STATFOR MT Forecast Planned capacity enhancement measures - Sector evolution Capacity Plan Year Improved airspace management and ATFM procedures Staff redeployment / flexible rostering RFUE project Harmonie Project (Reims/Paris Measures ACC interface for arr/dep planned LFPG) Re-organisation of lower airspace and delegation of ATS to APP LFSB/LFST TE/RAPOR Max sectors 15 UCESO 16 UCESO 16 UCESO 16 UCESO Capacity 5*% 5*% 5*% 5*% increase p.a. Additional *Capacity increases related to availability of new frequencies. Information En-route Summer delay forecast ( ) Based on the current capacity plan, the en-route Summer delays are expected to be around 0.4 minutes per flight in 2009 and 0.2 minutes per flight in 2010, for the baseline traffic growth. Expected Summer performance ( ) Potential bottleneck sectors are UN/XN, XEKE, XHKH, which may be mitigated by the planned measures, particularly the airspace structure development projects. 58
69 FYROM SKOPJE ACC Traffic forecast ACC Growth H 14% 21% 28% 35% Skopje B 9% 15% 20% 26% L 4% 8% 12% 16% Shortest Routes: +47% % growth per ACC v. 2007, based on STATFOR MT Forecast Planned capacity enhancement measures - Sector evolution Capacity Plan Year Controller ratings Measures planned Airspace structure development ATM system upgrade Optimisation of sectorisation Max sectors 3 3 (4) 3 (4) 3 (4) Capacity increase p.a. 6% 0% 0% 0% En-route Summer delay forecast ( ) Based on the current capacity plan, no en-route Summer delays are expected at Skopje ACC. Expected Summer performance ( ) No problems are expected at Skopje ACC. 59
70 GERMANY BREMEN ACC Traffic forecast ACC Growth H 9% 13% 17% 20% Bremen B 5% 8% 11% 13% L 2% 4% 5% 7% Shortest Routes: No significant Impact % growth per ACC v. 2007, based on STATFOR MT Forecast Planned capacity enhancement measures - Sector evolution Capacity Plan Year Upgrade of Measures planned Significant Events Max sectors Capacity increase p.a. P1/ATCAS system (PSS) 12 En Route + 6 APP ILA Berlin Schönefeld airport, 12 En Route + 6 APP Re-structure of airspace Bremen ACC Expansion of Schönefeld airport to become Berlin Brandenburg Intl. 12 En Route + 6 APP ILA Berlin, Closure of Berlin Tegel airport 12 En Route + 6 APP 1% 0% 0% 0% En-route Summer delay forecast ( ) In 2009 and 2010, no en-route Summer delays are expected in Bremen ACC. Expected Summer performance ( ) No problems are expected at Bremen ACC. 60
71 GERMANY LANGEN ACC Traffic forecast ACC Growth H 10% 13% 15% 25% Langen B 6% 9% 11% 18% L 3% 5% 7% 9% Shortest Routes: No significant Impact % growth per ACC v. 2007, based on STATFOR MT Forecast Planned capacity enhancement measures - Sector evolution Capacity Plan Year Measures planned Significant Events Restructure of Northern airspace of Langen ACC Restructure of Central airspace of Langen ACC Restructure of Frankfurt APP and implementation of AMAN Restructure of South/Eastern airspace of Langen ACC Upgrade of P1/ATCAS system (PSS) 4. RWY Frankfurt airport Max sectors Capacity increase p.a. 4% 4% 2% 0% En-route Summer delay forecast ( ) In 2009 and 2010, no en-route Summer delays are expected in Langen ACC. Expected Summer performance ( ) No problems are expected at Langen ACC. 61
72 GERMANY KARLSRUHE UAC Traffic forecast ACC Growth Karlsruhe H 13% 18% 23% 31% (+15%) B 9% 13% 17% 23% (+15%) L 5% 7% 10% 14% (+15%) Shortest Routes: No significant Impact % growth per ACC v. 2007, based on STATFOR MT Forecast Relocation of Munich upper airspace to Karlsruhe in 2012 adds an extra 15% traffic. Planned capacity enhancement measures - Sector evolution Capacity Plan Year Measures planned Significant Events Capacity bottlenecks by ATCO Training for new ATM system (P1/VAFORIT) Split of Megatop FFM/WUR Effects of the new ATM system (P1/VAFORIT) 4. RWY Frankfurt airport, Expansion of Schönefeld airport to become Berlin Brandenburg Intl. Relocation of Munich Upper airspace to Karlsruhe 3. RWY Munich airport Max sectors Capacity increase p.a. -3% 5% 4% 2% (+15%) En-route Summer delay forecast ( ) Based on the current capacity plan, the en-route Summer delays are expected to be around 1.2 minutes per flight in 2009 and 0.8 minutes per flight in 2010, for the baseline traffic growth. Expected Summer performance ( ) The performance of Karlsruhe will be highly dependant on the training and transition to the new ATM system (VAFORIT). High delays are expected during the training and implementation periods. Potential bottleneck sectors are FFMT, FFMM. 62
73 GERMANY MUNICH ACC Traffic forecast ACC Growth H 13% 18% 23% 30% (-32%) Munchen B 9% 13% 17% 22% (-32%) L 5% 7% 10% 13% (-32%) Shortest Routes: No significant Impact (-6%) % growth per ACC v. 2007, based on STATFOR MT Forecast Relocation of Munich upper airspace to Karlsruhe in 2012 reduces traffic by 32%. Planned capacity enhancement measures - Sector evolution Capacity Plan Year Measures planned Significant Events Restructure of sector families North/South Restructure of sector family East Upgrade of P1/ATCAS system (PSS) Training for Upgrade of P1/ATCAS system Training for Relocation of Munich upper airspace to Karlsruhe Relocation of Munich upper airspace to Karlsruhe Munich APP 2. Feeder 3. RWY Munich airport Max sectors Capacity increase p.a. 5% 2% 0% 1% (-30%) En-route Summer delay forecast ( ) In 2009 and 2010, the en-route Summer delays are expected to be around 0.1 min/flight. Expected Summer performance ( ) No problems are expected at Munich ACC in 2009/
74 GREECE ATHENS ACC Traffic forecast ACC Growth H 13% 20% 27% 35% Athens B 8% 14% 20% 26% L 4% 8% 12% 16% Shortest Routes: No significant Impact % growth per ACC v. 2007, based on STATFOR MT Forecast Planned capacity enhancement measures - Sector evolution Capacity Plan Year Improved ATS route network and airspace management Measures planned Improved civil/military coordination Recruitment training & availability of additional controllers Implementation of MTCD Max sectors Capacity increase p.a. 4% 4% 4% 4% En-route Summer delay forecast ( ) Athens ACC is expected to generate Summer enroute delay between 0.1 and 0.2 minutes per flight in 2009 and 2010, for the baseline traffic growth. Expected Summer performance ( ) No particular problems are expected at Athens ACC. 64
75 GREECE MAKEDONIA ACC Traffic forecast ACC Growth H 14% 22% 28% 36% Makedonia B 9% 15% 20% 26% L 5% 8% 13% 17% Shortest Routes: +10% % growth per ACC v. 2007, based on STATFOR MT Forecast Planned capacity enhancement measures - Sector evolution Capacity Plan Year Improved ATS route network and airspace management Measures planned Improved civil/military coordination Recruitment training & availability of additional controllers Implementation of MTCD Max sectors Capacity increase p.a. 4% 4% 4% 4% En-route Summer delay forecast ( ) Makedonia ACC is expected to generate Summer enroute delay between 0.1 and 0.2 minutes per flight in 2009 and 2010, for the baseline traffic growth. Expected Summer performance ( ) No particular problems are expected at Makedonia ACC. 65
76 HUNGARY BUDAPEST ACC Traffic forecast ACC Growth H 20% 29% 37% 47% Budapest B 15% 21% 28% 35% L 9% 14% 19% 24% Shortest Routes: -17% % growth per ACC v. 2007, based on STATFOR MT Forecast Planned capacity enhancement measures - Sector evolution Capacity Plan Year Optimisation of airspace structure Recruitment and training of controllers Measures 10 sectors Multi sector planned available if planning required Max sectors Capacity increase p.a. 4% 4% 4% 4% En-route Summer delay forecast ( ) In 2009 and 2010, the en-route Summer delays are expected to be around 0.2 minutes per flight. Expected Summer performance ( ) No problems are expected at Budapest ACC. 66
77 IRELAND DUBLIN ACC Traffic forecast ACC Growth H 20% 31% 40% 54% Dublin B 15% 22% 30% 37% L 10% 15% 20% 25% Shortest Routes: No significant Impact % growth per ACC v. 2007, based on STATFOR MT Forecast Planned capacity enhancement measures - Sector evolution Capacity Plan Year Improvement of route network at Manchester interface Measures planned PRNAV SIDs and STARs Unidirectional airway interface with Scottish Unidirectional airway interface with Shannon Additional ATM staff Introduction of Point Merge ATM System Upgrade New Control Tower Parallel Runway FAB with UK/NATS Max sectors Capacity increase p.a. Additional Information 7% 8% 5% 30% Point merge is an initiative to use PRNAV procedures inside the hold to assist with traffic sequencing for final approach. En-route Summer delay forecast ( ) Based on the current capacity plan, the enroute Summer delays are expected to be between 0.1 and 0.2 minutes per flight at Dublin ACC, for the baseline traffic growth. Expected Summer performance ( ) At this stage, no problems are expected at Dublin ACC. 67
78 IRELAND SHANNON ACC Traffic forecast ACC Growth H 15% 22% 29% 36% Shannon B 10% 15% 20% 26% L 6% 8% 12% 15% Shortest Routes: No significant Impact % growth per ACC v. 2007, based on STATFOR MT Forecast Planned capacity enhancement measures - Sector evolution Capacity Plan Year Extra sectors as required Extra ATM ATM Upgrade Measures planned staffing New Sectorisation Improvements in London interface FAB with UK/NATS Max sectors Capacity increase p.a. 8% 5% 5% 3% En-route Summer delay forecast ( ) Based on the current capacity plan, the enroute Summer delays are expected to be around 0.1 minutes per flight at Shannon ACC, for the baseline traffic growth. Expected Summer performance ( ) No problems are expected at Shannon ACC. 68
79 ITALY BRINDISI ACC Traffic forecast ACC Growth H 14% 20% 25% 32% Brindisi B 7% 15% 20% 25% L 3% 6% 10% 13% Shortest Routes: -6% % growth per ACC v. 2007, based on STATFOR MT Forecast Planned capacity enhancement measures - Sector evolution Capacity Plan Year Revised sector loads and sector optimisation Route network improvements VDL Mode 2 Measures Improved Mode S infrastructure DMEAN planned Master plan Italian airspace reorganisation (initial steps) Max sectors 6* 6* 6* 6* Capacity 3% 3% 4% 4% increase p.a. Additional Information * a maximum of 8 sectors could be opened depending on traffic demand and staff availability. En-route Summer delay forecast ( ) In 2009 and 2010, no en-route Summer delays are expected in Brindisi ACC. Expected Summer performance ( ) No problems are expected at Brindisi ACC. 69
80 ITALY MILAN ACC Traffic forecast ACC Growth H 15% 20% 24% 30% Milano B 9% 16% 20% 25% L 4% 7% 10% 13% Shortest Routes: -3% % growth per ACC v. 2007, based on STATFOR MT Forecast Planned capacity enhancement measures - Sector evolution Capacity Plan Year Revised sector loads and sector optimisation DMEAN actions Improvement of Mode S infrastructure Measures planned AMAN at Milan Malpensa VDL Mode 2 Milano ACC resectorisation (availability of one additional sector) PRNAV STARS at Milan Malpensa Reorganisation of airspace over Aosta area (cross border cooperation with Skyguide) DMAN at Milan Malpensa Master plan Italian airspace reorganisation (initial steps) Reorganisation of Milano TMA Max sectors Capacity increase p.a. 4% 3% 3% 3% En-route Summer delay forecast ( ) The en-route Summer delays are expected to be around 0.2 minutes per flight in 2009 and 0.4 minutes per flight in 2010, based on the baseline traffic growth. Expected Summer performance ( ) No significant problem are expected in Milano ACC. 70
81 ITALY PADOVA ACC Traffic forecast ACC Growth H 14% 20% 25% 32% Padova B 8% 15% 19% 24% L 5% 7% 9% 13% Shortest Routes: +5% % growth per ACC v. 2007, based on STATFOR MT Forecast Planned capacity enhancement measures - Sector evolution Capacity Plan Year Revised sector loads and sector optimisation Improved Mode S infrastructure DMEAN actions Measures planned Implementation of APP service for airports located within Padova area Master plan Italian airspace reorganisation (initial steps) Implementation of 13th sector Max sectors Capacity increase p.a. 5% 5% 4% 4% En-route Summer delay forecast ( ) The en-route Summer delays are expected to be around 0.6 minutes per flight in 2009 and 1 minute per flight in 2010, based on the baseline traffic growth. Expected Summer performance ( ) The baseline traffic growth for Padova ACC according to the latest STATFOR forecast is higher than that of last year, indicating a capacity gap Revision of current plans may be necessary if delays are to be kept within the optimum. Potential bottleneck sector is NTT. 71
82 ITALY ROME ACC Traffic forecast ACC Growth H 14% 19% 24% 30% Roma B 7% 14% 19% 24% L 3% 6% 9% 13% Shortest Routes: No significant Impact % growth per ACC v. 2007, based on STATFOR MT Forecast Planned capacity enhancement measures - Sector evolution Capacity Plan Year Revised sector loads and sector optimisation Optimum max configurations Improved Mode S infrastructure DMEAN actions Measures planned VDL Mode 2 ATM system improvements Additional staff (approx. 20/year) Reorganisation AJO/ALG area Implementation of PRNAV in Roma TMA Master plan Italian airspace reorganisation (initial steps) Max sectors 19* 20* 21* 21* Capacity increase p.a. 3% 3% 4% 4% Additional Information * Maximum 23 sectors could be opened depending on traffic demand and staff availability En-route Summer delay forecast ( ) The en-route Summer delays are expected to be around 0.1 minutes per flight, for the baseline traffic growth. Expected Summer performance ( ) No significant problems are expected at Roma ACC. 72
83 LATVIA RIGA ACC Traffic forecast ACC Growth H 21% 31% 42% 56% Riga B 16% 24% 32% 43% L 10% 16% 23% 31% Shortest Routes: No significant Impact % growth per ACC v. 2007, based on STATFOR MT Forecast Planned capacity enhancement measures - Sector evolution Capacity Plan Year Measures planned Various ATM system improvements Max sectors 3 + 1APP 3 + 1APP 3 + 1APP 3 + 1APP Capacity Sufficient Capacity to meet expected demand increase p.a. En-route Summer delay forecast ( ) In the current capacity plan, no en-route Summer delays are expected for Riga ACC. Expected Summer performance ( ) No problems are expected at Riga ACC. 73
84 LITHUANIA VILNIUS ACC Traffic forecast ACC Growth H 22% 29% 40% 51% Vilnius B 16% 23% 31% 40% L 10% 17% 23% 28% Shortest Routes: No significant Impact % growth per ACC v. 2007, based on STATFOR MT Forecast Planned capacity enhancement measures - Sector evolution Capacity Plan Year Introduction of Measures 3 rd sector planned Consolidation of operations of the new ATM system Max sectors Capacity Sufficient Capacity to meet expected demand increase p.a. En-route Summer delay forecast ( ) Based on the current capacity plan, no en-route Summer delays are expected for Vilnius ACC. Expected Summer performance ( ) No problems are expected at Vilnius ACC. 74
85 MALTA MALTA ACC Traffic forecast ACC Growth H 11% 19% 26% 37% Malta B 8% 14% 19% 26% L 5% 10% 13% 18% Shortest Routes: No significant Impact % growth per ACC v. 2007, based on STATFOR MT Forecast Planned capacity enhancement measures - Sector evolution Capacity Plan Year Measures planned Max sectors Capacity Sufficient Capacity to meet expected demand increase p.a. En-route Summer delay forecast ( ) Based on the current capacity plan, no en-route Summer delays are expected for Malta ACC. Expected Summer performance ( ) No problems are expected at Malta ACC. 75
86 MOLDOVA CHISINAU ACC Traffic forecast ACC Growth H 25% 38% 51% 62% Kishinau B 18% 28% 39% 51% L 15% 21% 28% 39% Shortest Routes: +39% % growth per ACC v. 2007, based on STATFOR MT Forecast Planned capacity enhancement measures - Sector evolution Capacity Plan Year Measures planned Max sectors Capacity increase p.a. Sufficient Capacity to meet expected demand En-route Summer delay forecast ( ) Based on the current capacity plan, no en-route Summer delays are expected for Chisinau ACC. Expected Summer performance ( ) No problems are expected at Chisinau ACC. 76
87 THE NETHERLANDS AMSTERDAM ACC Traffic forecast ACC Growth H 11% 15% 20% 25% Amsterdam B 6% 10% 13% 17% L 3% 5% 7% 10% Shortest Routes: No significant Impact % growth per ACC v. 2007, based on STATFOR MT Forecast Planned capacity enhancement measures - Sector evolution Capacity Plan Year Measures Optimisation of ATS route network & procedures planned Max sectors Capacity increase p.a. 2% 2% 2% 2% En-route Summer delay forecast ( ) The en-route Summer delays are expected to be around 0.4 minutes per flight for the baseline traffic growth. Expected Summer performance ( ) No significant problems are expected at Amsterdam ACC in 2009/10. 77
88 NORWAY BODO ACC Traffic forecast ACC Growth H 8% 12% 16% 19% Bodo B 6% 7% 9% 12% L 3% 4% 5% 7% Shortest Routes: No significant Impact % growth per ACC v. 2007, based on STATFOR MT Forecast Planned capacity enhancement measures - Sector evolution Capacity Plan Year Flexible rostering of ATC staff Measures planned Recruitment and training of air traffic controllers Revision of FUA operations OLDI at Bodo Max sectors oceanic oceanic oceanic oceanic Capacity increase p.a. Sufficient Capacity to meet expected demand En-route Summer delay forecast ( ) Based on the current capacity plan, no en-route Summer delay are expected for Bodo ACC. Expected Summer performance ( ) No problems are expected at Bodo ACC in 2009/2010, provided that there are no staffing restrictions. 78
89 NORWAY OSLO ACC Traffic forecast ACC Growth H 11% 16% 21% 27% Oslo B 8% 10% 14% 18% L 5% 7% 9% 11% Shortest Routes: No significant Impact % growth per ACC v. 2007, based on STATFOR MT Forecast Planned capacity enhancement measures - Sector evolution Capacity Plan Year Flexible rostering of ATC staff Recruitment and training of air traffic controllers Measures Revision of FUA operations Implementation planned of Oslo ASAP (including AMAN) Max sectors Capacity increase p.a. Sufficient Capacity to meet expected demand En-route Summer delay forecast ( ) Based on the current capacity plan, no en-route Summer delays are expected for Oslo ACC. Expected Summer performance ( ) No problems are expected at Oslo ACC in 2009/2010, provided that there are no staffing restrictions. 79
90 NORWAY STAVANGER ACC Traffic forecast ACC Growth H 9% 14% 18% 23% Stavangar B 5% 8% 11% 14% L 2% 4% 6% 8% Shortest Routes: No significant Impact % growth per ACC v. 2007, based on STATFOR MT Forecast Planned capacity enhancement measures - Sector evolution Capacity Plan Year Measures Flexible rostering of ATC staff Recruitment and training of air traffic controllers planned Revision of FUA operations Max sectors helicopter helicopter helicopter helicopter Capacity increase p.a. Sufficient Capacity to meet expected demand En-route Summer delay forecast ( ) Based on the current capacity plan, no en-route Summer delays are expected for Stavanger ACC. Expected Summer performance ( ) No problems are expected at Stavanger ACC in 2009/2010, provided that there are no staffing restrictions. 80
91 POLAND WARSAW ACC Traffic forecast ACC Growth H 20% 30% 41% 53% Warsaw B 14% 22% 30% 41% L 10% 14% 19% 26% Shortest Routes: +5% % growth per ACC v. 2007, based on STATFOR MT Forecast Planned capacity enhancement measures - Sector evolution Capacity Plan Year Operational Increased sector availability of the Consolidation of operations of the throughput on a new ATM new ATM system tactical basis system Slight improvement to Measures Improved sectorisation and ATS route network sector opening planned Significant Events times ATS route network improvements Technical implementation of new ATM system Additional sectors possibly up to 9 sectors Additional sectors possibly up to 10 sectors Additional sectors possibly up to 11 sectors Additional controllers Improved sector configurations and sector capacities EURO 2012 EXPO 2012 Max sectors Capacity increase p.a. 0% 10% 15% 15% Additional Some reduction in staff availability due to training for new system in 2009 Information En-route Summer delay forecast ( ) The en-route Summer delays are expected to be above 3 minutes per flight in 2009 and 2010, for the baseline traffic growth. Expected Summer performance ( ) C, D and G sectors are likely to have significant overloads. No major improvement is possible before the implementation of the new ATM system. 81
92 PORTUGAL LISBON ACC Traffic forecast ACC Growth H 15% 21% 25% 31% Lisbon B 10% 14% 19% 23% L 7% 9% 12% 16% Shortest Routes: No significant Impact % growth per ACC v. 2007, based on STATFOR MT Forecast Planned capacity enhancement measures - Sector evolution Capacity Plan Year Optimisation of airspace structure and ATC procedures Measures planned Improved rostering and sector opening schemes Improved airspace management and ATFM procedures Additional controllers Max sectors Capacity increase p.a ENR+3 TMA Revised sector loads and sector optimisation ENR+3 TMA 8 ENR+3 TMA ENR+3 TMA 3% 3% 3% 3% En-route Summer delay forecast ( ) In the case of baseline traffic growth, the enroute delay for Lisbon ACC is expected to be around 0.9 minutes per flight. Expected Summer performance ( ) The baseline traffic growth for Lisbon ACC according to the latest STATFOR forecast is higher than that of last year, indicating a capacity gap Revision of current plans may be necessary if delays are to be kept within the optimum. Potential bottleneck sectors are CENL, UPNC. 82
93 ROMANIA BUCHAREST ACC Traffic forecast ACC Growth H 26% 37% 47% 58% Romania B 20% 28% 37% 46% L 13% 19% 25% 32% Shortest Routes: -7% % growth per ACC v. 2007, based on STATFOR MT Forecast Planned capacity enhancement measures - Sector evolution Capacity Plan Year Measures planned ATS route network and sectorisation improvements Max sectors Capacity increase p.a. Sufficient Capacity to meet expected demand En-route Summer delay forecast ( ) Based on the current capacity plan, no en-route Summer delays are expected for Bucharest ACC. Expected Summer performance ( ) No problems are expected at Bucharest ACC. 83
94 SERBIA BELGRADE ACC Traffic forecast ACC Growth H 17% 24% 30% 39% Belgrade B 11% 17% 23% 28% L 7% 11% 15% 19% Shortest Routes: +11% % growth per ACC v. 2007, based on STATFOR MT Forecast Planned capacity enhancement measures - Sector evolution Capacity Plan Year Route network development Improved airspace management Flexible use of staff Civil/military coordination improvement Additional controllers Measures planned Enhanced ATM ops concept Consolidated operation of RDR planner concept Consolidation of ACC/APP into single ops room Classification of lower airspace, provision of FIS Consolidated operation of the enhanced ATM system Reorganisation of lower airspace establishment of FIC CCAMS benefits New ops room and system modernisation FAMUS CPR implementation, improved traffic load prediction Consolidated operation of the FAMUS Max sectors Capacity increase p.a. 5% 3% 8% 10% En-route Summer delay forecast ( ) Based on the current capacity plan, no en-route Summer delays are expected for Belgrade ACC. Expected Summer performance ( ) No problems are expected at Belgrade ACC in 2009/
95 SLOVAK REPUBLIC BRATISLAVA ACC Traffic forecast ACC Growth H 20% 30% 39% 48% Bratislava B 15% 22% 29% 37% L 9% 14% 19% 25% Shortest Routes: +5% % growth per ACC v. 2007, based on STATFOR MT Forecast Planned capacity enhancement measures - Sector evolution Capacity Plan Year Adaptation of sector opening times Improved flow and capacity management techniques Improved staff deployment Measures Additional controllers planned New ATC system Improved route network, sectorisation and configurations Max sectors Capacity increase p.a. 5% 10% 5% 5% En-route Summer delay forecast ( ) Based on the current capacity plan, en-route Summer delays for 2009/2010 are expected to be between 0.1 and 0.2 minutes per flight for the baseline traffic growth. Expected Summer performance ( ) No problems are expected at Bratislava ACC in 2009/
96 SLOVENIA LJUBLJANA ACC Traffic forecast ACC Growth H 16% 23% 30% 39% Ljubljana B 11% 16% 22% 28% L 6% 9% 13% 17% Shortest Routes: +30% % growth per ACC v. 2007, based on STATFOR MT Forecast Planned capacity enhancement measures - Sector evolution Capacity Plan Year FDPS upgrade Implementation of new ops room Availability of 8 additional Controllers (net availability Additional Controllers will be recruited as necessary Measures planned of 4 extra Controllers) Sectors capacity increase ATS route network and traffic organisation changes Improved ATFCM One additional sector (if required) Flexible sector configurations (max 5 sectors) Max sectors Capacity increase p.a. 5% 0% 5% 5% En-route Summer delay forecast ( ) Based on the current capacity plan, en-route Summer delays are expected to be negligible. Expected Summer performance ( ) No problems are expected at Ljubljana ACC in 2009/
97 SPAIN BARCELONA ACC Traffic forecast ACC Growth H 16% 23% 29% 35% Barcelona B 11% 16% 21% 27% L 6% 9% 13% 17% Shortest Routes: No significant Impact % growth per ACC v. 2007, based on STATFOR MT Forecast Planned capacity enhancement measures - Sector evolution Capacity Plan Year ATC system upgrades Optimised sector configurations Additional controllers Staff rostering improvement Measures planned Max sectors Capacity increase p.a. Reorganisation of upper sectors New sectorisation for Barcelona APP (increase from 5 to 7 sectors) Route structure improvements Madrid - Baleares LECB/LEPA interface sector reorganisation New building Valencia TACC 13 ACC 13 ACC 7 APP LEBL 7 APP LEBL 5 APP LECL 5 APP LECL 13 ACC 7 APP LEBL 5 APP LECL 13 ACC 7 APP LEBL 5 APP LECL 6% 4% 4% 4% En-route Summer delay forecast ( ) Based on the current capacity plan, the en-route Summer delays are expected to be around minutes per flight in 2009 and 2010 for the baseline traffic growth. Expected Summer performance ( ) No sector will cause a significant problem at Barcelona ACC, provided that sufficient staff are available to operate 12/13 sectors throughout the day. Potential bottleneck sectors are LG, MN. 87
98 SPAIN CANARIAS ACC Traffic forecast ACC Growth H 12% 18% 23% 29% Canaries B 8% 12% 16% 21% L 4% 7% 9% 13% Shortest Routes: No significant Impact % growth per ACC v. 2007, based on STATFOR MT Forecast Planned capacity enhancement measures - Sector evolution Capacity Plan Year Optimised sector configurations ATM system upgrade Additional controllers Reorganisation of enroute sectors at Canarias Measures peninsula Expansion of planned SIV LFST New airspace structure for Canarias TMA Route split on the EUR-SAM corridor Max sectors Capacity increase p.a. 8 4APP/3+1ENR 8 4APP/3+1ENR 8 4APP/3+1ENR 8 4APP/3+1ENR 3% 3% 3% 0% En-route Summer delay forecast ( ) Based on the current capacity plan, the en-route Summer delays are expected to be 0.1 minutes per flight. Expected Summer performance ( ) No problems are expected at Canarias ACC. 88
99 SPAIN MADRID ACC Traffic forecast ACC Growth H 14% 20% 25% 31% Madrid B 8% 12% 17% 22% L 4% 6% 9% 13% Shortest Routes: No significant Impact % growth per ACC v. 2007, based on STATFOR MT Forecast Planned capacity enhancement measures - Sector evolution Capacity Plan Year Optimised sector configurations ATM system upgrade Additional controllers Staff rostering improvement Measures planned Max sectors Capacity increase p.a. Improved parallel runway ops at LEMD (increase up to 50 arr/hr) Reorganisation of en-route sectors Reorganisation of peripheral sectors 18/19 ACC 10 APP Independent parallel runway ops at LEMD Reorganisation of northern TMAs 20 ACC 10 APP 23 ACC 10 APP 23 ACC 10 APP 6% 6% 6% 6% En-route Summer delay forecast ( ) Based on the current capacity plan, the en-route Summer delays are expected to be around 0.7 minutes per flight in 2009 and 0.3 minutes per flight in 2010, for the baseline traffic growth. Expected Summer performance ( ) Potential bottleneck sectors are PAU, TLL, TLU, with most elementary sectors showing some overload. The planned reorganisation of enroute and interface sectors will improve the situation. 89
100 SPAIN PALMA ACC Traffic forecast ACC Growth H 16% 23% 29% 36% Palma B 11% 16% 21% 27% L 7% 10% 13% 17% Shortest Routes: No significant Impact % growth per ACC v. 2007, based on STATFOR MT Forecast Planned capacity enhancement measures - Sector evolution Capacity Plan Year Optimised sector configurations ATM system upgrade Additional controllers Measures planned Reorganisation of enroute sectors at the Barcelona interface New airspace structure based on PRNAV Max sectors 3 (+4 APP) 3 (+4 APP) 3 (+4 APP) 3 (+4 APP) Capacity increase p.a. 2% 2% 2% 2% En-route Summer delay forecast ( ) Based on the current capacity plan, the en-route Summer delays are expected to be 0.2 minutes per flight in 2009 and 0.4 minutes per flight in 2010, for the baseline traffic growth. Expected Summer performance ( ) No significant problems are expected in Palma ACC in
101 SPAIN SEVILLA ACC Traffic forecast ACC Growth H 13% 19% 26% 33% Sevilla B 9% 13% 18% 24% L 4% 7% 11% 15% Shortest Routes: No significant Impact % growth per ACC v. 2007, based on STATFOR MT Forecast Planned capacity enhancement measures - Sector evolution Capacity Plan Year Optimised sector configurations ATM system upgrade Additional controllers Staff rostering improvement Measures New airspace structure for Malaga TMA based on PRNAV planned New radar station at Grenada Reorganisation of enroute sectors at Madrid interface Max sectors 6 ACC + 2 APP 6 ACC + 2 APP 6 ACC + 2 APP 6 ACC + 2 APP Capacity increase p.a. 5% 5% 5% 5% En-route Summer delay forecast ( ) Based on the current capacity plan, the en-route Summer delays are expected to be around 0.6 minutes per flight in 2009, and around 1.0 minute per flight in 2010, for the baseline traffic growth. Expected Summer performance ( ) Potential bottleneck sector is PIM, however no significant problems are foreseen for Seville ACC, provided that sector configurations are optimised to meet demand, particularly during evenings and holidays periods. 91
102 SWEDEN MALMO ACC Traffic forecast ACC Growth H 14% 19% 25% 32% Malmo B 10% 14% 18% 25% L 6% 9% 12% 17% Shortest Routes: No significant Impact % growth per ACC v. 2007, based on STATFOR MT Forecast Planned capacity enhancement measures - Sector evolution Capacity Plan Year System upgrade through planned software releases Measures planned Reorganisation of Baltic sea & West sectors New Eurocat platform (COOPANS) implemented Gradual availability of additional controllers NUAC implementation Max sectors tbd tbd tbd tbd Capacity increase p.a. Additional Information Sufficient capacity to meet expected demand NUAC implementation is provisionally planned in the timeframe , with the aim to increase efficiency and reduce costs for Air Navigation Services initially in Sweden and Denmark. En-route Summer delay forecast ( ) Based on the current capacity plan, no en-route Summer delays are expected for Malmo ACC. Expected Summer performance ( ) No problems are expected at Malmo ACC in 2009/
103 SWEDEN STOCKHOLM ACC Traffic forecast ACC Growth H 10% 13% 16% 19% Stockholm B 7% 10% 13% 16% L 4% 6% 8% 10% Shortest Routes: -7% % growth per ACC v. 2007, based on STATFOR MT Forecast Planned capacity enhancement measures - Sector evolution Capacity Plan Year System upgrade through planned software releases Measures planned Reorganisation of Baltic sea & West sectors New Eurocat platform (COOPANS) implemented Gradual availability of additional controllers NUAC implementation Max sectors tbd tbd tbd tbd Capacity increase p.a. Additional Information Sufficient capacity to meet expected demand NUAC implementation is provisionally planned in the timeframe , with the aim to increase efficiency and reduce costs for Air Navigation Services initially in Sweden and Denmark. En-route Summer delay forecast ( ) Based on the current capacity plan, no en-route Summer delays are expected for Stockholm ACC. Expected Summer performance ( ) No problems are expected at Stockholm ACC in 2009/
104 SWITZERLAND UAC WEST Traffic forecast ACC Growth H 12% 18% 23% 27% UAC West B 8% 12% 16% 21% L 4% 6% 9% 12% Shortest Routes: +5% % growth per ACC v. 2007, based on STATFOR MT Forecast Planned capacity enhancement measures - Sector evolution Capacity Plan Year Measures Increased staff levels New sectorisation SYSCO Mode S enhanced surveillance planned Datalink CPDLC ATFCM/DMEAN processes Max sectors Capacity increase p.a. 1% 4-7% 2-5% 4% En-route Summer delay forecast ( ) Based on the current capacity plan, the en-route Summer delays are expected to be around 0.7 minutes per flight in 2009 and 0.4 minutes per flight in 2010 for the baseline traffic growth. Expected Summer performance ( ) The baseline traffic growth for UAC West according to the latest STATFOR forecast is higher than that of last year, indicating a capacity gap Revision of current plans may be necessary if delays are to be kept within the optimum. Potential bottleneck sectors are KL1W, KL2W and all collapsed sectors. 94
105 SWITZERLAND UAC EAST Traffic forecast ACC Growth H 12% 17% 22% 28% UAC East B 8% 12% 15% 20% L 4% 6% 9% 12% Shortest Routes: +9% % growth per ACC v. 2007, based on STATFOR MT Forecast Planned capacity enhancement measures - Sector evolution Capacity Plan Year Measures planned Revised sectorisation New Ops room Implementation of stripless system SYSCO Mode S enhanced surveillance Increased staff level Datalink CPDLC ATFCM / DMEAN processes Max sectors Capacity increase p.a. 2-5% 2-4% 12-14% 4-5% En-route Summer delay forecast ( ) Based on the current capacity plan, the en-route Summer delays are expected to be around 1.2 minutes per flight in 2009 and 0.9 minutes per flight in 2010 for the baseline traffic growth. Expected Summer performance ( ) Most of the sectors appear to be overloaded in UAC East. The capacity gap will remain important in
106 SWITZERLAND GENEVA TCG Traffic forecast ACC Growth H 10% 15% 19% 22% TC Geneva B 8% 12% 15% 18% L 4% 7% 9% 11% Shortest Routes: -6% % growth per ACC v. 2007, based on STATFOR MT Forecast Planned capacity enhancement measures - Sector evolution Capacity Plan Year New SID/STARs New (partially based SYSCO sectorisation INI on P-RNAV) Measures planned HECT Holding tool INI stripless Increased staff levels Mode S enhanced surveilance ATFCM / DMEAN processes Max sectors Capacity increase p.a. 1-2% 1-2% -2% 4-6% En-route Summer delay forecast ( ) Based on the current capacity plan, the en-route Summer delays are expected to be around 0.9 minutes per flight in 2009 and 1 minute per flight in 2010 for the baseline traffic growth. Expected Summer performance ( ) The baseline traffic growth for Geneva TCG according to the latest STATFOR forecast is higher than that of last year, indicating a capacity gap Revision of current plans may be necessary if delays are to be kept within the optimum. 96
107 SWITZERLAND ZURICH TCZ Traffic forecast ACC Growth H 13% 17% 20% 24% TC Zurich B 9% 13% 16% 19% L 5% 8% 10% 13% Shortest Routes: -7% % growth per ACC v. 2007, based on STATFOR MT Forecast Planned capacity enhancement measures - Sector evolution Capacity Plan Year New Ops room Increased staff levels Measures Mode S planned Stripless HMI SYSCO enhanced surveillance ATFCM / DMEAN processes Max sectors Capacity increase p.a. 0% 1-2% 2-3% 2-4% En-route Summer delay forecast ( ) Based on the current capacity plan, the en-route Summer delays are expected to be around minutes per flight in 2009 and Expected Summer performance ( ) No significant problems are expected at TCZ in 2009/
108 TURKEY ANKARA ACC Traffic forecast ACC Growth H 21% 30% 38% 47% Ankara B 16% 23% 30% 37% L 12% 18% 25% 32% Shortest Routes: -4% % growth per ACC v. 2007, based on STATFOR MT Forecast Planned capacity enhancement measures - Sector evolution Capacity Plan Year New Ankara ACC (Max 25 Consolidation of operations of ATM system upgrade and sectorisation sectors) Implementation of SMART system Improved civil/military coordination Improved surveillance infrastructure (Replacement of current stations and Measures planned addition of new sensors) Implementation of A/G and G/G communications infrastructure improvements ATS route structure development Reduction of radar separation in Turkish airspace 10 sector configuration for Ankara ACC Additional controllers Revised upper airspace sectorisation (20 sectors + FL 245) and reconfiguration of ACC/APP with DFL 245 and 335 Training for transition to SMART and Significant new Ankara ACC (all Turkish Events airspace above FL 245) Max sectors Capacity increase p.a. 10% 10% En-route Summer delay forecast ( ) N/A Sufficient capacity available The en-route Summer delays are expected to be around 0.1 minutes per flight for Ankara in 2009 and % Expected Summer performance ( ) No problems are foreseen for Ankara during the planning period. 98
109 TURKEY ISTANBUL ACC Traffic forecast ACC Growth H 21% 28% 35% 43% Istanbul B 15% 21% 28% 34% L 11% 17% 22% 29% Shortest Routes: -10% % growth per ACC v. 2007, based on STATFOR MT Forecast Planned capacity enhancement measures - Sector evolution Capacity Plan Year Implementation Consolidation of operations of ATM of SMART system upgrade and sectorisation system Improved civil/military coordination Improved surveillance infrastructure (Replacement of current stations and addition of new sensors) Implementation of A/G and G/G communications infrastructure improvements Measures ATS route structure development planned Reduction of radar separation in Turkish airspace Additional controllers Transfer of airspace +FL245 to Ankara ACC Additional Maximum 4 sector configuration sectors Istanbul APP Training for transition to SMART and Significant new Ankara ACC (all Turkish Events airspace above FL 245) Max sectors (APP) 4 (APP) Capacity increase p.a. 10% 10% En-route Summer delay forecast ( ) N/A Sufficient capacity available The en-route Summer delays are expected to be around 0.1 minutes per flight for Istanbul in 2009 and % Expected Summer performance ( ) No significant problems are foreseen for Istanbul during the planning period. 99
110 TURKEY IZMIR ACC Traffic forecast ACC Growth H 18% 26% 32% 40% Izmir B 13% 18% 24% 30% L 8% 14% 20% 26% Shortest Routes: +10% % growth per ACC v. 2007, based on STATFOR MT Forecast Planned capacity enhancement measures - Sector evolution Capacity Plan Year Implementation Consolidation of operations of ATM of SMART system upgrade and sectorisation system Improved civil/military coordination Improved surveillance infrastructure (Replacement of current stations and addition of new sensors) Measures planned Implementation of A/G and G/G communications infrastructure improvements ATS route structure development Reduction of radar separation in Turkish airspace Significant Events Additional controllers Transfer of airspace +FL245 to Ankara ACC Training for transition to SMART and new Ankara ACC (all Turkish airspace above FL 245) Max sectors (APP) 5 (APP) N/A Capacity Sufficient 10% 10% increase p.a. capacity 10% available En-route Summer delay forecast ( ) The en-route Summer delays are expected to be around 0.5 minutes per flight in 2009 and around 0.3 minutes per flight in Expected Summer performance ( ) No significant problems are foreseen for Izmir during the planning period. 100
111 UKRAINE KHARKIV ACC Traffic forecast ACC Growth H 23% 34% 48% 62% Kharkiv B 19% 29% 39% 50% L 16% 22% 30% 40% Shortest Routes: No significant Impact % growth per ACC v. 2007, based on STATFOR MT Forecast Planned capacity enhancement measures - Sector evolution Capacity Plan Year Measures planned Max sectors Capacity Sufficient Capacity to meet expected demand increase p.a. En-route Summer delay forecast ( ) Based on the current capacity plan, no en-route Summer delays are expected. Expected Summer performance ( ) No problems are expected in 2009/
112 UKRAINE KYIV ACC Traffic forecast ACC Growth H 26% 36% 48% 60% Kyiv B 20% 32% 40% 49% L 16% 24% 31% 37% Shortest Routes: No significant Impact % growth per ACC v. 2007, based on STATFOR MT Forecast Planned capacity enhancement measures - Sector evolution Capacity Plan Year Measures planned Max sectors Capacity Sufficient Capacity to meet expected demand increase p.a. En-route Summer delay forecast ( ) Based on the current capacity plan, no en-route Summer delays are expected. Expected Summer performance ( ) No problems are expected in 2009/
113 UKRAINE L VIV ACC Traffic forecast ACC Growth H 21% 31% 43% 55% L'viv B 16% 25% 34% 44% L 13% 18% 24% 31% Shortest Routes: -4% % growth per ACC v. 2007, based on STATFOR MT Forecast Planned capacity enhancement measures - Sector evolution Capacity Plan Year Measures planned Max sectors Capacity Sufficient Capacity to meet expected demand increase p.a. En-route Summer delay forecast ( ) Based on the current capacity plan, no en-route Summer delays are expected. Expected Summer performance ( ) No problems are expected in 2009/
114 UKRAINE ODESA ACC Traffic forecast ACC Growth H 28% 39% 52% 65% Odesa B 22% 33% 42% 54% L 17% 26% 33% 40% Shortest Routes: +13% % growth per ACC v. 2007, based on STATFOR MT Forecast Planned capacity enhancement measures - Sector evolution Capacity Plan Year Measures planned Max sectors Capacity Sufficient Capacity to meet expected demand increase p.a. En-route Summer delay forecast ( ) Based on the current capacity plan, no en-route Summer delays are expected. Expected Summer performance ( ) No problems are expected in 2009/
115 UKRAINE SIMFEROPOL ACC Traffic forecast ACC Growth H 22% 32% 43% 57% Simferopol B 17% 26% 35% 46% L 14% 21% 28% 37% Shortest Routes: +18% % growth per ACC v. 2007, based on STATFOR MT Forecast Planned capacity enhancement measures - Sector evolution Capacity Plan Year Measures planned Max sectors Capacity Sufficient Capacity to meet expected demand increase p.a. En-route Summer delay forecast ( ) Based on the current capacity plan, no en-route Summer delays are expected. Expected Summer performance ( ) No problems are expected in 2009/
116 UNITED KINGDOM LONDON ACC Traffic forecast ACC Growth H 9% 13% 18% 22% London ACC B 6% 9% 12% 16% L 3% 5% 7% 10% Shortest Routes: No significant Impact % growth per ACC v. 2007, based on STATFOR MT Forecast Planned capacity enhancement measures - Sector evolution Capacity Plan Year Traffic management improvements Adaptation of sector configurations to demand Flexible use of existing staff Improved ATFCM Measures planned Complexity reduction and improved traffic presentation between sectors / ANSPs LUS/LMS reorganisation BYPASS Project Manche Project ifacts Northern/Upper sector development Daventry sector development Significant Events Training for ifacts Max sectors Capacity increase p.a. 3% 5% 5% 3% Summer Olympic Games En-route Summer delay forecast ( ) Based on the current capacity plan, the en-route Summer delays are expected to be around 1.8 minutes per flight in 2009, and 0.6 minutes per flight in Expected Summer performance ( ) There will be a capacity gap in 2009 and 2010, with delays higher than the optimum. Overall capacity increase is heavily dependent on timing of ifacts deployment. Several sectors appear overloaded at London ACC, including LMW, CLW, LAK, DTN, HRW and LND. The planned airspace structure development projects and the application of improved ATM and ATFCM techniques will improve the performance of these sectors. 106
117 UNITED KINGDOM LONDON TC Traffic forecast ACC Growth H 6% 9% 12% 14% London TC B 4% 6% 8% 10% L 2% 3% 5% 6% Shortest Routes: No significant Impact % growth per ACC v. 2007, based on STATFOR MT Forecast Planned capacity enhancement measures - Sector evolution Capacity Plan Year Traffic Management Improvements Adaptation of sector configurations to demand Flexible use of existing staff Measures planned Improved ATFCM Complexity reduction and improved traffic presentation between sectors / ANSPs TC North LHR Mixed Mode Stage I TC Midlands NW TC Tools Significant Events Summer Olympic Games Max sectors Capacity increase p.a. 2% 1% 3% 2% En-route Summer delay forecast ( ) Based on the current capacity plan, the en-route Summer delays are expected to be around minutes per flight in 2009 and Expected Summer performance ( ) Several sectors appear overloaded at London TC, including CPT, LAM, SWD, WIL. The planned airspace structure development projects and the application of improved ATM and ATFCM techniques will improve the performance of these sectors. 107
118 UNITED KINGDOM PRESTWICK ACC Traffic forecast (Manchester, Scottish and New Prestwick) ACC Growth H 8% 13% 18% 25% Manchester B 5% 8% 12% 15% L 2% 4% 6% 9% Shortest Routes: No significant Impact % growth per ACC v. 2007, based on STATFOR MT Forecast ACC Growth H 8% 12% 17% 22% Scottish B 5% 7% 10% 13% L 2% 4% 5% 7% Shortest Routes: No significant Impact % growth per ACC v. 2007, based on STATFOR MT Forecast ACC Growth H 9% 14% 19% 25% New Prestwick B 5% 8% 12% 15% L 2% 5% 6% 9% Shortest Routes: No significant Impact % growth per ACC v. 2007, based on STATFOR MT Forecast 108
119 Planned capacity enhancement measures - Sector evolution Capacity Plan Year Traffic Management Improvements Adaptation of sector configurations to demand Flexible use of existing staff Improved ATFCM Measures Complexity reduction and improved traffic presentation between sectors / ANSPs planned BYPASS project P600 Significant Events Max sectors Capacity increase p.a. Additional Information development Integration of Manchester into Prestwick Centre 7 Manchester 16 Scottish 1% Manchester Restructuring of Manchester and Scottish terminal airspace % 2% 2% 2% Scottish During 2009, some Manchester staff will be relocated to Prestwick. Training for the new Prestwick centre will take place during Autumn En-route Summer delay forecast ( ) Based on the current capacity plan, the en-route Summer delays are expected to be around 0.6 minutes per flight in Manchester in No delays are expected in Scottish in In 2010, en-route delays are expected to be around 0.2 minutes per flight in the new Prestwick ACC. Expected Summer performance ( ) Delays are likely to be higher than the optimum as a result of staff relocation and training commitments in The application of improved ATM and ATFCM techniques could help in improving the performance in the different the sectors. 109
120 INTENTIONALLY LEFT BLANK 110
121 ANNEX 2 : AIRPORTS This section presents information about each of the 25 airports identified as having a potential effect upon the network in terms of ATFCM delays. The following data is reported if available: IATA / ICAO airport code Airport Scheduling Information: Main constraints on scheduled capacity (Runway, Apron/Gate, Environment/Political, TMA capacity, Terminal or Other) Declared runway capacities: Total runway capacities for both, for arrivals and departures, during the scheduled arrival and departure peaks (source: AOE airport data sheets) Traffic and Forecasts: Traffic development from 2003 to actual and traffic forecast until 2012 for departures and arrivals IFR movements yearly grown (source: EUROCONTROL LCIP database) Data: CFMU Forecast : STATFOR Medium Term Forecast February 2008 Targets for Delay Reduction and Runway Capacity Increase (source: IATA/EUROCONTROL Joint Action Plan) EUROCONTROL AOE on going / planned activities: Status of the implementation activities in support of DMEAN: Analysis and Delay Reduction activities Airside Capacity Enhancement (ACE) activities Airport Collaborative Decision Making (A-CDM) activities (source: AOE project teams) Local Action Plans: Available and public information on planned airport capacity enhancement measures, expected measures to cope with eventual ATFCM arrival delay and the significant events that may affect the traffic such as new rapid exit taxiways, new runways, etc. (source: LCIP available at 111
.")
122 Airport: Amsterdam Schiphol, Netherlands Traffic and Forecasts: Targets: Delay Reduction: 10% Runway Capacity Increase: 5% EUROCONTROL AOE on going / planned activities: This airport is included in the IATA/EUROCONTROL Joint Action Plan (ref. Para.6.2.1). Delay Analysis and Delay Reduction Activities: To be planned Airport CDM Activities: Gap Analysis completed Recommendations accepted Project restructured during summer Implementation manager now appointed and Project Plan produced. DPI Trials: Shadow Mode & Live Operational trials planned Q Tentative only Implementation Timeframes: Q4/2008 Q1/
 and in the IATA/EUROCONTROL Joint Action Plan (ref. Para.6.2.1).")
123 Airport: Barcelona, Spain Traffic and Forecasts: Targets: Delay Reduction: 30% Runway Capacity Increase: - EUROCONTROL AOE On going / Planned Activities: This airport is included in the AENA/EUROCONTROL Joint Action Plan (ref. Para.6.2.2) and in the IATA/EUROCONTROL Joint Action Plan (ref. Para.6.2.1). Delay Analysis and Delay Reduction Activities: Delay analysis agreed to be performed between June - December 2008 Airport CDM Activities: Subject to commencement of CDM implementation Assumption for DPI exchange:
.")
124 Airport: Brussels, Belgium Traffic and Forecasts: Targets: Delay Reduction: 10% Runway Capacity Increase: - EUROCONTROL AOE On going / Planned Activities: This airport is included in the IATA/EUROCONTROL Joint Action Plan (ref. Para.6.2.1). Delay Analysis and Delay Reduction Activities: Actions started in 2008 Airport CDM Activities: A-CDM implemented and DMAN / A-CDM integration trials completed DPI operational trials commenced in In progress 114
.")
125 Airport: Budapest, Hungary Traffic and Forecasts: Targets: Delay Reduction: 20% Runway Capacity Increase: 10% EUROCONTROL AOE On going / Planned Activities: This airport is included in the IATA/EUROCONTROL Joint Action Plan (ref. Para.6.2.1). Delay Analysis and Delay Reduction Activities: Completed Airport Capacity Enhancement Activities: A final Steering Group meeting has been held in February Capacity Enhancement Action Plan agreed Airport CDM Activities: Gap analysis completed Recommendations accepted Project on hold due to systems integration aspects Assumption for DPI exchange implementation:

126 Airport: Copenhagen, Denmark Traffic and Forecasts: EUROCONTROL AOE On going / Planned Activities: Airport Capacity Enhancement Activities: Planned for Airport CDM Activities: Planned for

127 Airport: Dublin, Ireland Traffic and Forecasts: EUROCONTROL AOE On going / Planned Activities: Airport CDM Activities: Gap Analysis presented to Stakeholders end March Recommendations have been accepted and implementation structure being defined. DPI Trials assumption:

128 Airport: Florence, Italy Traffic and Forecasts: 118
. Delay Analysis and Delay Reduction Activities: Initial Detailed Delay Analysis took place in February 2008.")
129 Airport: Frankfurt/Main, Germany Traffic and Forecasts: Targets: Delay Reduction: 30% Runway Capacity Increase: - EUROCONTROL AOE On going / Planned Activities: This airport is included in the IATA/EUROCONTROL Joint Action Plan (ref. Para.6.2.1). Delay Analysis and Delay Reduction Activities: Initial Detailed Delay Analysis took place in February To be followed by a Final Analysis Airport CDM Activities: High Level meeting took place in April and approved the start of A-CDM Implementation project DPI Trials : 2010 (assuming A-CDM Implémentation commencement Q4/2008) 119

130 Airport: Heraklion, Greece Traffic and Forecasts: EUROCONTROL AOE On going / Planned Activities: Delay Analysis and Delay Reduction Activites: In progress Airport Capacity Enhancement Activities: In progress Airport CDM Activities: Gap Analysis Q1/2008. Recommendations have been accepted DPI Trials Assumption: 2011 (Subject to commencement of A-CDM implementation) 120
. Delay Analysis and Delay Reduction Activities: Completed Airport Capacity Enhancement Activities: In progress Action plan has been approved.")
131 Airport: Istanbul, Turkey Traffic and Forecasts: Targets: Delay Reduction: 30% Runway Capacity Increase: 20% EUROCONTROL AOE On going / Planned Activities: This airport is included in the IATA/EUROCONTROL Joint Action Plan (ref. Para.6.2.1). Delay Analysis and Delay Reduction Activities: Completed Airport Capacity Enhancement Activities: In progress Action plan has been approved. Airport CDM Activities: Gap analysis to be finalised by Q3/2008 Assumption for DPI exchange implementation: Local Action Plans: Creation of 2 RET: Implementation of a new Runway:
.")
132 Airport: London Heathrow, UK Traffic and Forecasts: Targets: Delay Reduction: 30 % by 2010 Mixed Mode Ops, AMAN, Landing rate resilience Runway Capacity Increase: - EUROCONTROL AOE On going / Planned Activities: This airport is included in the IATA/EUROCONTROL Joint Action Plan (ref. Para.6.2.1). Delay Analysis and Delay Reduction Activities: In progress Airport CDM Activities: Gap Analysis completed Recommendations accepted Implementation Timeframe: A-CDM Phases 1 and 2 implemented with full implementation on target Q1/2008 DPI Trials: 2008 (Shadow Mode & Live Operational trials planned Q2; Planning in place with CFMU) 122
 and in the IATA/EUROCONTROL Joint Action Plan (ref. Para.6.2.1).")
133 Airport: Madrid, Spain Traffic and Forecasts: Targets: Delay Reduction: 50% Runway Capacity Increase: 10% EUROCONTROL AOE On going / Planned Activities: This airport is included in the AENA/EUROCONTROL Joint Action Plan (ref. Para.6.2.2) and in the IATA/EUROCONTROL Joint Action Plan (ref. Para.6.2.1). Delay Analysis and Delay Reduction Activities: Delay analysis agreed to be performed between June - December 2008 Airport Capacity Enhancement Activities: As in the AENA / EUROCONTROL Action Plan Airport CDM Activities: Assumption for DPI exchange: 2011 Implementation A-CDM as from November
.")

134 Airport: Milan/Malpensa, Italy Traffic and Forecasts: Targets: Delay Reduction: 30% Runway Capacity Increase: - EUROCONTROL AOE On going / Planned Activities: This airport is included in the IATA/EUROCONTROL Joint Action Plan (ref. Para.6.2.1). Delay Analysis and Delay Reduction Activities: Completed Airport Capacity Enhancement Activities: Action plan has been agreed Airport CDM Activities: Gap Analysis completed Recommendations accepted Implementation continues. A-CDM link with DMAN planned Q Implementation Timeframe: Q DPI Trials Assumption: 2009 (A-CDM implementation fairly mature) 124

135 Airport: Milan Linate, Italy Traffic and Forecasts: 125
.")
136 Airport: Munich (MUC), Germany Traffic and Forecasts: Targets: Delay Reduction: 10% Runway Capacity Increase: - EUROCONTROL AOE On going / Planned Activities: This airport is included in the IATA/EUROCONTROL Joint Action Plan (ref. Para.6.2.1). Delay Analysis and Delay Reduction Activities: Partly completed Airport CDM Activities: A-CDM fully implemented and considered part of daily operations DPI exchange operational; continued finer tuning of message exchange 126

137 Airport: Palma, Spain Traffic and Forecasts: EUROCONTROL AOE On going / Planned Activities: This airport is included in the AENA/EUROCONTROL Joint Action Plan (ref. Para.6.2.2). Delay Analysis and Delay Reduction Activities: Delay analysis agreed to be performed between June - December 2008 Airport Capacity Enhancement Activities: As in the AENA / EUROCONTROL Action Plan Airport CDM Activities: Start in May 2008 Implementation starts in November 2009 Assumption for DPI exchange:

138 Airport: Paris /CDG, France Declared runway capacities (as of 30/03/08) : Scheduled arrival peak: -Arrivals: 61 Departures: 62 Total: 112 Scheduled departure peak: -Arrivals: 60 Departures: 65 Total: 110 Traffic and Forecasts: Targets: Delay Reduction: 30% Runway Capacity Increase: 10% EUROCONTROL AOE On going / Planned Activities: This airport is included in the IATA/EUROCONTROL Joint Action Plan (ref. Para.6.2.1). Airport CDM Activities: A-CDM project has been set up. Implementation Timeframe: 2010 DPI Trials Assumption: 2009 (A-CDM implementation underway; In line with CDG A- CDM 2010 project) 128
139 Airport: Prague, Czech Republic Traffic and Forecasts: Targets: Delay Reduction: 20% Runway Capacity Increase: 5% EUROCONTROL AOE On going / Planned Activities: This airport is included in the IATA/EUROCONTROL Joint Action Plan (ref. Para.6.2.1). Delay Analysis and Delay Reduction Activities: Completed Airport Capacity Enhancement Activities: Completed; Action Plan agreed Airport CDM Activities: Gap Analysis completed Recommendations accepted Cost Benefit Analysis completed and fully accepted by all partners. Commencement of A-CDM implementation Q1/2008 DPI Trials Assumption: 2009 (A-CDM implementation commencing Q2/2008; Based on implementation of A-CDM elements in 12 months, output should result in DPI exchange and testing possible) 129
.")
140 Airport: Rome Fiumicino, Italy Traffic and Forecasts: Targets: Delay Reduction: 30% Runway Capacity Increase: 10% EUROCONTROL AOE On going / Planned Activities: This airport is included in the IATA/EUROCONTROL Joint Action Plan (ref. Para.6.2.1). Delay Analysis and Delay Reduction Activities: Partly completed Airport Capacity Enhancement Activities: Action Plan under preparation Airport CDM Activities: Gap Analysis completed Recommendations under review Gap Analysis to be presented to Stakeholders in Q2/2008 DPI Trials Assumption: 2010 (A-CDM implementation commencement Q4/2008) 130

141 Airport: Thessaloniki, Greece Traffic and Forecasts: EUROCONTROL AOE On going / Planned Activities: Delay Analysis and Delay Reduction Activities: Planned Airport Capacity Enhancement Activities: Planned Airport CDM Activities: Assumption for DPI exchange implementation:
. Delay Analysis and Delay Reduction Activities: As in the AENA / EUROCONTROL Action Plan.")
142 Airport: Valencia, Spain Declared runway capacities: Arrival Departure Total Traffic and Forecasts: EUROCONTROL AOE On going / Planned Activities: This airport is included in the AENA/EUROCONTROL Joint Action Plan (ref. Para.6.2.2). Delay Analysis and Delay Reduction Activities: As in the AENA / EUROCONTROL Action Plan. Planned Airport Capacity Enhancement Activities: As in the AENA / EUROCONTROL Action Plan 132

143 Airport: Venezia, Italy Traffic and Forecasts: 133
.")
144 Airport: Vienna/Schwechat, Austria Traffic and Forecasts: Targets: Delay Reduction: 8% Runway Capacity Increase: 10% EUROCONTROL AOE On going / Planned Activities: This airport is included in the IATA/EUROCONTROL Joint Action Plan (ref. Para.6.2.1). Delay Analysis and Delay Reduction Activities: Completed Airport Capacity Enhancement Activities: Action Plan is being agreed Airport CDM Activities: Gap Analysis completed Recommendations accepted Vienna Airport CDM project officially launched in January 2008 Implementation timeframe: Mid to end 2009 DPI Trials assumption: 2009 (Based on implementation of A-CDM elements in 12 months, output should result in DPI exchange and testing possible) Local Action Plans: New terminal (17 new positions), partly in operation since end 2007 (8 positions), full operation by 2009 / Third runway:
145 Airport: Warsaw, Poland Traffic and Forecasts: Targets: Delay Reduction: 30% Runway Capacity Increase: 10% EUROCONTROL AOE On going / Planned Activities: This airport is included in the IATA/EUROCONTROL Joint Action Plan (ref. Para.6.2.1). Delay Analysis and Delay Reduction Activities: Planned Airport Capacity Enhancement Activities: A full ACE capacity planning project is planned for in the Spring/ Summer Airport CDM Activities: Gap Analysis presented early April 2008 Recommendations accepted Implementation plan being developed DPI Trials Assumption: 2011 (Subject to acceptance of A-CDM Gap Analysis recommendations and commencement of A-CDM implementation) 135
. Delay Analysis and Delay Reduction Activities: Planned Airport Capacity Enhancement Activities: Planned for Oct 2008.")
146 Airport: Zurich, Switzerland Traffic and Forecasts: Targets: Delay Reduction: 10% Runway Capacity Increase: - EUROCONTROL AOE On going / Planned Activities: This airport is included in the IATA/EUROCONTROL Joint Action Plan (ref. Para.6.2.1). Delay Analysis and Delay Reduction Activities: Planned Airport Capacity Enhancement Activities: Planned for Oct Airport CDM Activities: Gap Analysis completed Recommendations accepted Implementation in progress, very mature. DPI operational trials currently being evaluated 136
DMEAN. Dynamic Management of the European Airspace Network. European Medium-Term ATM Network Capacity Plan Assessment
 DMEAN Dynamic Management of the European Airspace Network European Medium-Term ATM Network Capacity Plan Assessment 2010-2013 Edition June 2009 CONTENTS 1. INTRODUCTION... 1 2. REVIEW OF PAST ATM NETWORK
EUROCONTROL. Visit of the Transport Attachés. 10 April Frank Brenner. Director General EUROCONTROL
 EUROCONTROL Visit of the Transport Attachés 10 April 2015 Frank Brenner Director General EUROCONTROL One day s traffic EUROCONTROL - Visit of the Transport Attachés - 10 April 2015 2 ATM Today Air Transport
APN/CEF Capacity Enhancement Function. Capacity Assessment & Planning Guidance. An overview of the European Network Capacity Planning Process
 APN/CEF Capacity Enhancement Function Capacity Assessment & Planning Guidance An overview of the European Network Capacity Planning Process Edition September 2007 European Organisation for the Safety of
ELEVENTH AIR NAVIGATION CONFERENCE. Montreal, 22 September to 3 October 2003
 4/8/03 English, French, Russian and Spanish only * ELEVENTH AIR NAVIGATION CONFERENCE Montreal, 22 September to 3 October 2003 Agenda Item 3: 3.1 : Air traffic management (ATM) performance targets for
International Civil Aviation Organization WORLDWIDE AIR TRANSPORT CONFERENCE (ATCONF) SIXTH MEETING. Montréal, 18 to 22 March 2013
 SIXTH MEETING. Montréal, 18 to 22 March 2013") International Civil Aviation Organization ATConf/6-WP/52 15/2/13 WORKING PAPER WORLDWIDE AIR TRANSPORT CONFERENCE (ATCONF) SIXTH MEETING Montréal, 18 to 22 March 2013 Agenda Item 2: Examination of key
International Civil Aviation Organization ATConf/6-WP/52 15/2/13 WORKING PAPER WORLDWIDE AIR TRANSPORT CONFERENCE (ATCONF) SIXTH MEETING Montréal, 18 to 22 March 2013 Agenda Item 2: Examination of key
THIRTEENTH AIR NAVIGATION CONFERENCE
 International Civil Aviation Organization WORKING PAPER 23/8/18 (Information Paper) English only THIRTEENTH AIR NAVIGATION CONFERENCE Montréal, Canada, 9 to 19 October 2018 COMMITTEE A Agenda Item 3: Enhancing
Legal and Institutional Aspects of ATM in Europe. Roderick D. van Dam Head of Legal Service EUROCONTROL
 Legal and Institutional Aspects of ATM in Europe Roderick D. van Dam Head of Legal Service EUROCONTROL EUROCONTROL: European Organisation for the Safety of Air Navigation Coordination and integration -
Follow up to the implementation of safety and air navigation regional priorities XMAN: A CONCEPT TAKING ADVANTAGE OF ATFCM CROSS-BORDER EXCHANGES
 RAAC/15-WP/28 International Civil Aviation Organization 04/12/17 ICAO South American Regional Office Fifteenth Meeting of the Civil Aviation Authorities of the SAM Region (RAAC/15) (Asuncion, Paraguay,
DANUBE FAB real-time simulation 7 November - 2 December 2011
 EUROCONTROL DANUBE FAB real-time simulation 7 November - 2 December 2011 Visitor Information DANUBE FAB in context The framework for the creation and operation of a Functional Airspace Block (FAB) is laid
Network Management, building on our experience of flow management and network planning.
 Network Management, building on our experience of flow management and network planning. Giovanni Lenti Head of Network Operation Services The European Organisation for the Safety of Air Navigation Air
EUROCONTROL REVIEW OF CIVIL MILITARY COORDINATION AND COOPERATION ARRANGEMENTS
 EUROCONTROL REVIEW OF CIVIL MILITARY COORDINATION AND COOPERATION ARRANGEMENTS Report commissioned by the Performance Review Commission December 2016 Background This report has been produced by the Performance
SIMULATION OF BOSNIA AND HERZEGOVINA AIRSPACE
 SIMULATION OF BOSNIA AND HERZEGOVINA AIRSPACE SECTORIZATION AND ITS INFLUENCE ON FAB CE Valentina Barta, student Department of Aeronautics, Faculty of Transport and Traffic Sciences, University of Zagreb,
Flight Efficiency Initiative
 Network Manager nominated by the European Commission EUROCONTROL Flight Efficiency Initiative Making savings through improved flight planning Flight efficiency The Network Manager is playing a pivotal
SES Performance Scheme
 SES Performance Scheme 12 th Florence Rail Forum 2 May 2016 Rolf TUCHHARDT European Commission, DG MOVE The Single European Sky policy initiative to improve the overall performance of air traffic management
NEFAB Project Feasibility Study Report Operational Concept
 NEFAB Project Feasibility Study Report Operational Concept Page 1 of 16 TABLE OF CONTENTS 1. INTRODUCTION... 4 2. AIRSPACE DESIGN... 6 2.1 ATS Routes and Free Routes 6 2.2 Sectorisation 6 2.3 Airspace
Network Manager Adding value to the Network 29 September 2011
 Network Manager Adding value to the Network 29 September 2011 Alain FOURNIE Head of Operational Monitoring & Reporting Directorate Network Management EUROCONTROL The European Organisation for the Safety
European Joint Industry CDA Action Plan
 Foreword In September 2008, CANSO, IATA and EUROCONTROL signed up to a Flight Efficiency Plan that includes a specific target to increase European CDA performance and achievement. This was followed in
European Performance Scheme
 European Performance Scheme Global Challenges to Improve Air Navigation Performance Asilomar Conference Grounds, Pacific Grove, CA 12 February 2015 Rolf TUCHHARDT European Commission, DG MOVE The SES policy
Conditions of Application of the Route Charges System and Conditions of Payment
 European Organisation for the safety of air navigation Central route charges office Conditions of Application of the Route Charges System and Conditions of Payment December 2018 (EN) EUROPEAN ORGANISATION
Free Route Airspace Workshop Conclusions and Future Projects Outlook
 Free Route Airspace Workshop Conclusions and Future Projects Outlook FRA Workshop EUROCONTROL HQ, Brussels 24-25 May 2018 Razvan Bucuroiu Head of Network Strategy and Development & Operations Planning
Introduction. European Airspace Concept Workshops for PBN Implementation
 Introduction European Airspace Concept Workshops for PBN Implementation OBJECTIVES The objective of this workshop is to provide an overview of the development of a PBN Airspace Concept, To introduce the
EUROCONTROL. Eric MIART Manager - Airport Operations Programme (APR)
") Traffic Forecast for 20 Years Resulting Challenges for Airports Potential Solutions AIRNETH, The Hague 12 th of April 2007 EUROCONTROL Eric MIART Manager - Airport Operations Programme (APR) www.eurocontrol.int/airports
Traffic Forecast for 20 Years Resulting Challenges for Airports Potential Solutions AIRNETH, The Hague 12 th of April 2007 EUROCONTROL Eric MIART Manager - Airport Operations Programme (APR) www.eurocontrol.int/airports
PERFORMANCE REPORT CAPACITY
 PERFORMANCE REPORT 2015-2019 CAPACITY December 2018 Contents Description & Analysis 3 FABEC TRAFFIC DEVELOPMENT (en-route) 4 FABEC TRAFFIC DEVELOPMENT (arrival) 5 KPI #1: En-route ATFM delay per controlled
ENVIRONMENTAL BENEFITS FROM IMPROVED OPERATIONAL MEASURES. Guido Kerkhofs Director ATM Programmes EUROCONTROL
 ENVIRONMENTAL BENEFITS FROM IMPROVED OPERATIONAL MEASURES Guido Kerkhofs Director ATM Programmes EUROCONTROL EUROCONTROL Air Traffic Emissions Estimates EU 27 States 2004-2006 Tonnes of CO 2 Drop Page
PERFORMANCE REPORT CAPACITY
 PERFORMANCE REPORT 2015-2019 CAPACITY January 2019 Contents Description & Analysis 3 FABEC TRAFFIC DEVELOPMENT (en-route) 4 FABEC TRAFFIC DEVELOPMENT (arrival) 5 KPI #1: En-route ATFM delay per controlled
European Organisation for the Safety of Air Navigation Central Route Charges Office (CRCO) Report on the Operation of the Route Charges System in 2016
 Report on the Operation of the Route Charges System in 2016") European Organisation for the Safety of Air Navigation Central Route Charges Office (CRCO) Report on the Operation of the Route Charges System in 2016 March 2017 TABLE OF CONTENTS EUROCONTROL CHARGING
European Organisation for the Safety of Air Navigation Central Route Charges Office (CRCO) Report on the Operation of the Route Charges System in 2016 March 2017 TABLE OF CONTENTS EUROCONTROL CHARGING
TWELFTH AIR NAVIGATION CONFERENCE
 International Civil Aviation Organization AN-Conf/12-WP/42 9/10/12 WORKING PAPER TWELFTH AIR NAVIGATION CONFERENCE Montréal, 19 to 30 November 2012 Agenda Item 2: Aerodrome operations improving airport
Hosted by General Civil Aviation Authority (GCAA)
") ICAO ATFM Seminar Hosted by General Civil Aviation Authority (GCAA) DFS experience related to ATFM from an individual state point of view Integration with the Network Manager Operation Center (NMOC, former
ICAO ATFM Seminar Hosted by General Civil Aviation Authority (GCAA) DFS experience related to ATFM from an individual state point of view Integration with the Network Manager Operation Center (NMOC, former
Single European Sky Awards Submission by the COOPANS Alliance. Short description of the project. (Required for website application)
") Single European Sky Awards 2016 Submission by the COOPANS Alliance 27 th January 2016 Draft vfinal Short description of the project (Required for website application) The COOPANS Alliance is an international
Single European Sky Awards 2016 Submission by the COOPANS Alliance 27 th January 2016 Draft vfinal Short description of the project (Required for website application) The COOPANS Alliance is an international
Traffic Development Policy
 2017-2018 Guidelines Strategy The aims at attracting incremental traffic to Genoa airport through: Point to point connections: development of new direct routes to domestic and international airports, including
EUROCONTROL Low-Cost Carrier Market Update
 EUROCONTROL Low-Cost Carrier Market Update June 2007 EUROCONTROL/STATFOR/Doc257 v1.0 12/09/07 EUROCONTROL Low-Cost Carrier Market Update June 2007 Summary: The market share of low-cost carriers in Europe
Monthly Network Operations Report
 Monthly Network Operations Report Analysis - February 2014 TABLE OF CONTENTS 1. TOTAL TRAFFIC... 2 2. ATFM DELAY AND ATTRIBUTIONS... 5 3. EN-ROUTE ATFM DELAYS... 6 4. AIRPORT/TMA ATFM DELAYS... 10 5. DAILY
European General Aviation Conference Schonhagen Airport. Martin Robinson CEO AOPA UK Deputy Vice President IAOPA Europe Berlin 15 th May 2006
 European General Aviation Conference Schonhagen Airport Martin Robinson CEO AOPA UK Deputy Vice President IAOPA Europe Berlin 15 th May 2006 Content What is General Aviation & Aerial Work Operations? Who
Modernising UK Airspace 2025 Vision for Airspace Tools and Procedures. Controller Pilot Symposium 24 October 2018
 Modernising UK Airspace 2025 Vision for Airspace Tools and Procedures Controller Pilot Symposium 24 October 2018 Our airspace Flight Information Regions London & Scottish FIRs: 1m km 2 11% of Europe s
Screening Chapter 14 Transport. Single European Sky (SES) 18 December Transport
 18 December Transport") Screening Chapter 14 Single European Sky (SES) 18 December 2014 SINGLE EUROPEAN SKY OBJECTIVES: INCREASE SAFETY, EFFICIENCY, CAPACITY & PERFORMANCE Reduce fragmentation and complexity of ATM in Europe
Screening Chapter 14 Single European Sky (SES) 18 December 2014 SINGLE EUROPEAN SKY OBJECTIVES: INCREASE SAFETY, EFFICIENCY, CAPACITY & PERFORMANCE Reduce fragmentation and complexity of ATM in Europe
AIR TRAFFIC FLOW MANAGEMENT INDIA S PERSPECTIVE. Vineet Gulati GM(ATM-IPG), AAI
, AAI") AIR TRAFFIC FLOW MANAGEMENT INDIA S PERSPECTIVE Vineet Gulati GM(ATM-IPG), AAI AIR TRAFFIC FLOW MANAGEMENT ATFM is a service provided with the objective to enhance the efficiency of the ATM system by,
AIR TRAFFIC FLOW MANAGEMENT INDIA S PERSPECTIVE Vineet Gulati GM(ATM-IPG), AAI AIR TRAFFIC FLOW MANAGEMENT ATFM is a service provided with the objective to enhance the efficiency of the ATM system by,
Forty years of vision. The EUROCONTROL Maastricht UAC story. years of vision EUROCONTROL MAASTRICHT UAC EUROCONTROL
 1972-2012 Forty years of vision The EUROCONTROL Maastricht UAC story years of vision EUROCONTROL MAASTRICHT UAC EUROCONTROL years of vision EUROCONTROL MAASTRICHT UAC Since the dawn of time, man has dreamed
User Forum FPL adherence campaign Lessons learned & discussion. Chris BOUMAN, Head of Network Development Unit EUROCONTROL Network Management
 User Forum 2011 FPL adherence campaign Lessons learned & discussion Chris BOUMAN, Head of Network Development Unit EUROCONTROL Network Management The European Organisation for the Safety of Air Navigation
PERFORMANCE REPORT CAPACITY
 PERFORMANCE REPORT 2015-2019 CAPACITY June 2018 Contents Description & Analysis 3 FABEC TRAFFIC DEVELOPMENT (en-route) 4 FABEC TRAFFIC DEVELOPMENT (arrival) 5 KPI #1: En-route ATFM delay per controlled
ICAO ATFM SEMINAR. Dubai, UAE, 14 December 2016
 ICAO ATFM SEMINAR Dubai, UAE, 14 December 2016 ICAO ATFM Seminar Session 2.2: ATFM Sub-regional and Regional Solutions Brian Flynn EUROCONTROL Network Manager Directorate 12 th December 2016 Central Flow
Cooperative traffic management
 3/17/2017 Cooperative traffic management Moderated by Peter Alty, SESAR JU #SESAR 2 Cooperative Traffic Management The Airport view 8 th March 2017 Alison Bates Head of Service Transformation and Ops Efficiency
The European Experience Flexible Use of Airspace (FUA)
") Ensuring a 'Flexible Use of Airspace'. The European Experience Flexible Use of Airspace (FUA) ICAO FUA Workshop Republic of Moldova Chisinau, 4 6 Aug 2009 Presented by EUROCONTROL Anders Hallgren (CND/ND/OI/PR)
Ensuring a 'Flexible Use of Airspace'. The European Experience Flexible Use of Airspace (FUA) ICAO FUA Workshop Republic of Moldova Chisinau, 4 6 Aug 2009 Presented by EUROCONTROL Anders Hallgren (CND/ND/OI/PR)
FASI(N) IoM/Antrim Systemisation Airspace Change Decision
 IoM/Antrim Systemisation Airspace Change Decision") Safety and Airspace Regulation Group FASI(N) IoM/Antrim Systemisation Airspace Change Decision CAP 1584 Contents Published by the Civil Aviation Authority, August 2017 Civil Aviation Authority, Aviation
Safety and Airspace Regulation Group FASI(N) IoM/Antrim Systemisation Airspace Change Decision CAP 1584 Contents Published by the Civil Aviation Authority, August 2017 Civil Aviation Authority, Aviation
UK Implementation of PBN
 UK Implementation of PBN Geoff Burtenshaw Directorate of Airspace Policy UK Civil Aviation Authority 1 UK airspace context Presentation Overview Future Airspace Strategy (FAS) (FAS) Industry Implementation
Workshop on the Performance Enhancement of the ANS through the ICAO ASBU framework. Dakar, Senegal, September 2017 presented by Emeric Osmont
 Workshop on the Performance Enhancement of the ANS through the ICAO ASBU framework Dakar, Senegal, 18-22 September 2017 presented by Emeric Osmont The Aviation Community Indra 2 The Aviation Community
TWELFTH AIR NAVIGATION CONFERENCE
 International Civil Aviation Organization 19/3/12 WORKING PAPER TWELFTH AIR NAVIGATION CONFERENCE Montréal, 19 to 30 November 2012 (Presented by the Secretariat) EXPLANATORY NOTES ON THE AGENDA ITEMS The
The economic impact of ATC strikes in Europe Key findings from our updated report for A4E
 pwc.com The economic impact of ATC strikes in Europe Key findings from our updated report for A4E Prepared for A4E Updates to our analysis since June 2016 Since releasing our Preliminary Findings in June
Capacity Planning and Assessment Network Operations Planning
 Capacity Planning and Assessment Network Operations Planning Air Traffic Services System Capacity Seminar/Workshop Nairobi, Kenya, 8 10 June 2016 Raffaele Russo EUROCONTROL Operations Planning Introduction
IRISH AVIATION AUTHORITY DUBLIN POINT MERGE. Presented by James O Sullivan PANS-OPS & AIRSPACE INSPECTOR Irish Aviation Authority
 IRISH AVIATION AUTHORITY DUBLIN POINT MERGE Presented by James O Sullivan PANS-OPS & AIRSPACE INSPECTOR Irish Aviation Authority 2012 Holding Holding Before Point Merge No Pilot anticipation of distance
COMMISSION OF THE EUROPEAN COMMUNITIES. Draft. COMMISSION REGULATION (EU) No /2010
 No /2010") COMMISSION OF THE EUROPEAN COMMUNITIES Brussels, XXX Draft COMMISSION REGULATION (EU) No /2010 of [ ] on safety oversight in air traffic management and air navigation services (Text with EEA relevance)
COMMISSION OF THE EUROPEAN COMMUNITIES Brussels, XXX Draft COMMISSION REGULATION (EU) No /2010 of [ ] on safety oversight in air traffic management and air navigation services (Text with EEA relevance)
NETWORK OPERATIONS REPORT OCTOBER 2011
 OBER. TRAFFIC TOTAL FLIGHTS Last months average daily traffic 8 6 4 8 6 79 5 97 44 5684 694 8786 4 4 9974 589 84 Traffic increased by.% compared to October. Compared to September, the traffic was 8. lower.
TRIPS OF BULGARIAN RESIDENTS IN ABROAD AND ARRIVALS OF VISITORS FROM ABROAD TO BULGARIA IN FEBRUARY 2011
 TRIPS OF BULGARIAN RESIDENTS IN ABROAD AND ARRIVALS OF VISITORS FROM ABROAD TO BULGARIA IN FEBRUARY 2011 In February 2011, the number of the trips of Bulgarian residents in abroad was 246.2 thousand or
Intra-European Seat Capacity. January February March April May June July August September October November December. Intra-European Sectors Flown
 ASK's (Million) Sectors Departing Seats 80,000,000 Intra-European Seat Capacity 70,000,000 60,000,000 50,000,000 40,000,000 30,000,000 20,000,000 10,000,000 0 January February March April May June July
ANNEX ANNEX. to the. Commission Implementing Regulation (EU).../...
.../...") Ref. Ares(2018)5478153-25/10/2018 EUROPEAN COMMISSION Brussels, XXX [ ](2018) XXX draft ANNEX ANNEX to the Commission Implementing Regulation (EU).../... laying down a performance and charging scheme in
Ref. Ares(2018)5478153-25/10/2018 EUROPEAN COMMISSION Brussels, XXX [ ](2018) XXX draft ANNEX ANNEX to the Commission Implementing Regulation (EU).../... laying down a performance and charging scheme in
Introducing Free Route Airspace: Summary Paper from NEFAB Customer Consultation Days Helsinki, October 21, 2014 and Oslo, October 23, 2014
 Introducing Free Route Airspace: Summary Paper from NEFAB Customer Consultation Days Helsinki, October 21, 2014 and Oslo, October 23, 2014 NEFAB Programme Office organised customer consultation days on
NETWORK OPERATIONS REPORT September 2011
 September 20. TRAFFIC TOTAL FLIGHTS 32000 Last 3 months average daily traffic 30000 28000 Traffic increased by 2.7% compared to September 200. 26000 24000 22000 Compared to August 20, the traffic was 2.%
COMMISSION IMPLEMENTING REGULATION (EU)
") 18.10.2011 Official Journal of the European Union L 271/15 COMMISSION IMPLEMENTING REGULATION (EU) No 1034/2011 of 17 October 2011 on safety oversight in air traffic management and air navigation services
18.10.2011 Official Journal of the European Union L 271/15 COMMISSION IMPLEMENTING REGULATION (EU) No 1034/2011 of 17 October 2011 on safety oversight in air traffic management and air navigation services
EUR/SAM corridor airspace concept
 TWENTYENTH MEETING ON THE IMPROVEMENT OF AIR TRAFFIC SERVICES OVER THE SOUTH ATLANTIC (SAT21) (Lisbon, Portugal, 8 to 10 June, 2016) Agenda Item 2: Air traffic management (ATM) RNP 4 IN THE EUR/SAM CORRIDOR
SESAR CONCEPT DEVELOPMENT: AN ANSP CASE STUDY. Owen DAVIES Brussels Representative Department of International Affairs, NATS
 SESAR CONCEPT DEVELOPMENT: AN ANSP CASE STUDY Owen DAVIES Brussels Representative Department of International Affairs, NATS Content of Presentation Introduction Overview of NATS involvement in SESAR Beyond
Operations Control Centre perspective. Future of airline operations
 Operations Control Centre perspective Future of airline operations This brochure was developed based on the results provided by the OCC project as part of the SESAR programme. This project was managed
L 342/20 Official Journal of the European Union
 L 342/20 Official Journal of the European Union 24.12.2005 COMMISSION REGULATION (EC) No 2150/2005 of 23 December 2005 laying down common rules for the flexible use of airspace (Text with EEA relevance)
ACI EUROPE POSITION PAPER
 ACI EUROPE POSITION PAPER November 2018 Cover / Photo: Stockholm Arlanda Airport (ARN) Introduction Air traffic growth in Europe has shown strong performance in recent years, but airspace capacity has
Report on the Operation of the Route Charges System in Central Route Charges Office (CRCO)
") European Organisation for the Safety of Air Navigation Central Route Charges Office (CRCO) Report on the Operation of the Route Charges System in 2010 March 2011 - 3 - TABLE OF CONTENTS TABLE OF CONTENTS...
European Organisation for the Safety of Air Navigation Central Route Charges Office (CRCO) Report on the Operation of the Route Charges System in 2010 March 2011 - 3 - TABLE OF CONTENTS TABLE OF CONTENTS...
European Network Operations Plan
 Network Manager nominated by the European Commission EUROCONTROL European Network Operations Plan 2013-2015 Transition Plan for Major Projects in Europe Winter 2013/2014 Edition November 2013 DOCUMENT
Measurement of environmental benefits from the implementation of operational improvements
 Measurement of environmental benefits from the implementation of operational improvements ICAO International Aviation and Environment Seminar 18 19 March 2015, Warsaw, Poland Sven Halle Overview KPA ASSEMBLY
The situation before the FUA
 DIRECTORATE CIVIL-MILITARY ATM COORDINATION FLEXIBLE USE of AIRSPACE in EUROPE «The military perspective» Olivier Mrowicki CHISINAU 4th August 2009 1 The situation before the FUA AIRPORT 1 AREA 4 AREA
Civil/Military Cooperation ICAO Workshop. Civil/Military Cooperation in Ukraine
 Civil/Military Cooperation ICAO Workshop Civil/Military Cooperation in Ukraine October 2013 Ukraine Gained independence in 1991 Population: 47 million Total area: 603,700 sq.km Land boundaries: 4,558 km
EUROCONTROL. Centralised Services concept. Joe Sultana Director Network Manager 1 July 2013
 EUROCONTROL Centralised Services concept Joe Sultana Director Network Manager 1 July 2013 EUROCONTROL Centralised Services 2 Why do we need Centralised Services? Europe needs to be competitive again! a
irport atchment rea atabase
 irport atchment rea atabase Examples 539 Airports Four range sizes 50, 75, 100 and 150 km. Time series 00-015 30+ variables About ACAD The database contains catchment area information for 539 European
User Forum Capacity Planning with DDR2 & NEST. Thierry Champougny / Laszlo Elbert / Stephanie Vincent
 User Forum 2013 Capacity Planning with DDR2 & NEST Thierry Champougny / Laszlo Elbert / Stephanie Vincent Expert Operation Planning 24/01/2013 General view Capacity Planning functions, provided by NEST
ATM STRATEGIC PLAN VOLUME I. Optimising Safety, Capacity, Efficiency and Environment AIRPORTS AUTHORITY OF INDIA DIRECTORATE OF AIR TRAFFIC MANAGEMENT
 AIRPORTS AUTHORITY OF INDIA ATM STRATEGIC PLAN VOLUME I Optimising Safety, Capacity, Efficiency and Environment DIRECTORATE OF AIR TRAFFIC MANAGEMENT Version 1 Dated April 08 Volume I Optimising Safety,
2.6% /14 Forward Plan. 4.1 Traffic Outlook. Eurocontrol STATFOR s 2013 Medium-Term Forecast for 2015
 4 2013/14 Forward Plan 2.6% Eurocontrol STATFOR s 2013 Medium-Term Forecast for 2015 4.1 Traffic Outlook Traffic levels continue to be affected by a combination of the fragile economic situation in the
Traffic, delays and forecasts European summer traffic falls outlook for modest long-term growth
 Skyway 17 Traffic, delays and forecasts European summer traffic falls outlook for modest long-term growth EUROCONTROL monitors the performance of Europe s wider air transport system and the more detailed
Context Scope Procurement approach Topics for discussions Timeline. EDA/ESA UAS Workshop May
 Upcoming feasibility studies Context Scope Procurement approach Topics for discussions Timeline EDA/ESA UAS Workshop May 2009 1 Context now 2 Satellite-UAS cooperative missions study Letter of Exchange
Directorate Network Management Monthly Network Operations Report Analysis - March 2012
 Directorate Network Management Monthly Network Operations Report Analysis - March 212 TABLE OF CONTENTS 1. TOTAL TRAFFIC... 1 2. ATFM DELAY AND ATTRIBUTIONS... 4 3. EN-ROUTE ATFM DELAYS... 5 3.1. EN-ROUTE
JAR-21: CERTIFICATION PROCEDURES FOR AIRCRAFT AND RELATED PRODUCTS AND PARTS. Please find attached a copy of JAR-21 Amendment 7 dated February 2007.
 oint Aviation Authorities Postal Address: P.O. Box 3000 2130 KA Hoofddorp Visiting Address: Saturnusstraat 50 The Netherlands Tel.: 31 (0)23-5679700 Fax: 31 (0)23-5621714 Our reference number: 00106evd
Draft Rule for the Provision and Use of Data Link Services Economic Appraisal
 Draft Rule for the Provision and Use of Data Link Services Edition Number : 0.5 Edition Date : 21/2/07 Status : Working Draft Intended for : General Public Category : Working Document DOCUMENT CHARACTERISTICS
CCBE LAWYERS STATISTICS 2016
 Austria 31/12/2015 6.057 1.242 Belgium (OBFG) How many s are 81-2 Bulgaria - 2 Croatia - 5 Czech Republic - 40 Germany - 1 Greece - 3 Hungary - 6 Italy - 1 Liechtenstein - 1 Lithuania - 2 The Netherlands
Civil and military integration in the same workspace
 Civil and military integration in the same workspace Presented by PLC 1 introduction Civilian and Military ATCOs work alongside each other in various countries and are employed in a number of different
ATM Master Plan Update Working Group
 REPORT - APPENDICES 27 th March 2010 REPORT - APPENDICES Edition 00.00.14 57 of 200 REPORT - APPENDICES Appendix A Table of Changes to IP 1 steps This table lists the proposed changes to 74 steps of the
2012 Performance Framework AFI
 2012 Performance Framework AFI Nairobi, 14-16 February 2011 Seboseso Machobane Regional Officer ATM, ESAF 1 Discussion Intro Objectives, Metrics & Outcomes ICAO Process Framework Summary 2 Global ATM Physical
Directorate Network Management Monthly Network Operations Report Analysis - May 2012
 Directorate Network Management Monthly Network Operations Report Analysis - May 212 TABLE OF CONTENTS 1. TOTAL TRAFFIC 1 2. ATFM DELAY AND ATTRIBUTIONS 4 3. EN-ROUTE ATFM DELAYS 5 4. AIRPORT/TMA ATFM DELAYS
JAR-147: APPROVED MAINTENANCE TRAINING/EXAMINATIONS. Please find attached a copy of JAR-147 Amendment 3 dated February 2007.
 oint Aviation Authorities Postal Address: P.O. Box 3000 2130 KA Hoofddorp Visiting Address: Saturnusstraat 50 The Netherlands Tel.: 31 (0)23-5679700 Fax: 31 (0)23-5621714 Our reference number: 01406evd
Analysis of en-route vertical flight efficiency
 Analysis of en-route vertical flight efficiency Technical report on the analysis of en-route vertical flight efficiency Edition Number: 00-04 Edition Date: 19/01/2017 Status: Submitted for consultation
NEFAB Annual Report 2016
 NEFAB Council #11/WP2 NEFAB Annual Report 2016 Version 1.0 Revision history Version Date Description/Change Author Approved 1.0 08.05.2017 LV 2 Main developments in 2016 NEFAB Strategy Implementation Plan
Civil-Military Cooperation. Advanced Flexible Use of Airspace
 Civil-Military Cooperation Advanced Flexible Use of Airspace Need for Airspace data sharing and collaboration Network Manager Military Civil Airlines Military Operational Requirements for the Use of Airspace
EUROCONTROL Short- and Medium-Term Forecast of Service Units: February 2011 Update
 Summary: This document presents the forecast of total service units in Europe 1 for 2011-2015 prepared by EUROCONTROL\STATFOR (Statistics and Service of EUROCONTROL). This forecast aims principally to
Proposed Changes to Inverness Airport s Airspace The Introduction of Controlled Airspace and Optimisation of Instrument Flight Procedures
 Proposed Changes to Inverness Airport s Airspace The Introduction of Controlled Airspace and Optimisation of Instrument Flight Procedures What is an Airspace Change Proposal? It is a formal UK Civil Aviation
JAR-145: APPROVED MAINTENANCE ORGANISATIONS. Please find attached a copy of Amendment 6 to JAR-145, effective 1 November 2004.
 oint Aviation Authorities Postal Address: P.O. Box 3000 2130 KA Hoofddorp Visiting Address: Saturnusstraat 8-10 The Netherlands Tel.: 31 (0)23-5679700 Fax: 31 (0)23-5621714 Our reference number: 07/03-11
assists in the development of airport capacity to meet growing demand supports the development of improved ground access to airports
 ATAG The Air Transport Action Group (ATAG) is a coalition of organisations from throughout the air transport industry, formed to press for economically beneficial aviation capacity improvements in an environmentally
FABEC Operations. From a project-driven approach to continuous operational improvements
 FABEC Operations From a project-driven approach to continuous operational improvements Andreas Pötzsch Chairman FABEC Operations and DFS Director En-route and Approach. Madrid, 07 March 2017 0 FABEC at
TRIPS OF BULGARIAN RESIDENTS ABROAD AND ARRIVALS OF VISITORS FROM ABROAD TO BULGARIA IN OCTOBER 2017
 TRIPS OF BULGARIAN RESIDENTS ABROAD AND ARRIVALS OF VISITORS FROM ABROAD TO BULGARIA IN OCTOBER 2017 In October 2017, the number of the trips of Bulgarian residents abroad was 439.0 thousand (Annex, Table
InterFAB Ops meeting Traffic volatility in Brussels hotspot sectors
 InterFAB Ops meeting Traffic volatility in Brussels hotspot sectors Maastricht Upper Area Control Centre Dirk De Herdt Team Leader Airspace & Network Planning 02-03 May 2016 Traffic volatility in Brussels
DEADLINE APPROACHES FOR AVIATION CARBON FOOTPRINT CAP
 12 DEADLINE APPROACHES FOR AVIATION CARBON FOOTPRINT CAP EUROCONTROL is due to release by the end of this year its first detailed assessment of the aviation industry s forecast environmental footprint in
TRIPS OF BULGARIAN RESIDENTS ABROAD AND ARRIVALS OF VISITORS FROM ABROAD TO BULGARIA IN NOVEMBER 2017
 TRIPS OF BULGARIAN RESIDENTS ABROAD AND ARRIVALS OF VISITORS FROM ABROAD TO BULGARIA IN NOVEMBER 2017 In November 2017, the number of the trips of Bulgarian residents abroad was 417.6 thousand (Annex,
Centralised Services 4 Advanced Flexible Use of Airspace Service
 EUROCONTROL Centralised Services 4 Advanced Flexible Use of Airspace Service Time for the next level A COST-EFFICIENT SOLUTION A centralised service (CS) is a support service for an air navigation service
TRIPS OF BULGARIAN RESIDENTS ABROAD AND ARRIVALS OF VISITORS FROM ABROAD TO BULGARIA IN JANUARY 2018
 TRIPS OF BULGARIAN RESIDENTS ABROAD AND ARRIVALS OF VISITORS FROM ABROAD TO BULGARIA IN JANUARY 2018 In January 2018, the number of the trips of Bulgarian residents abroad was 387.6 thousand (Annex, Table
EUROCONTROL. Centralised Services Workshop. Peter Matern CS#5 EAIMS 5 March 2014
 EUROCONTROL Centralised Services Workshop Peter Matern CS#5 EAIMS 5 March 2014 European AIS Database (EAD) A EUROCONTROL Service of which the provision of the service is outsourced, a real partnership
Network Preparations Re-opening of Airspace over Kosovo
 FMP Exchange 12 November 2013 Network Preparations Re-opening of Airspace over Kosovo Presented by the Network Manager Directorate European Organisation for the Safgety of Air Navigation Confirmed agreements
TWELFTH AIR NAVIGATION CONFERENCE
 International Civil Aviation Organization AN-Conf/12-WP/8 7/5/12 WORKING PAPER TWELFTH AIR NAVIGATION CONFERENCE Montréal, 19 to 30 November 2012 Agenda Item 3: Interoperability and data through globally