Report on the Operation of the Route Charges System in Central Route Charges Office (CRCO)
|
|
|
- Derrick Palmer
- 6 years ago
- Views:
Transcription
1 European Organisation for the Safety of Air Navigation Central Route Charges Office (CRCO) Report on the Operation of the Route Charges System in 2010 March 2011
2
3 - 3 - TABLE OF CONTENTS TABLE OF CONTENTS MAJOR DEVELOPMENTS IN CONTRACTING STATES OF THE EUROCONTROL ROUTE CHARGES SYSTEM KEY INDICATORS RULES AND PROCEDURES OF THE ROUTE CHARGES SYSTEM OPERATIONS OF THE CRCO UPDATE ON SERVICES TO STAKEHOLDERS BILATERAL AGREEMENTS WITH EUROCONTROL MEMBER STATES BILATERAL AGREEMENTS RELATING TO AIR NAVIGATION CHARGES UNIT RATES COST-BASES AND NATIONAL UNIT RATES WEIGHTED NATIONAL UNIT RATE ACTUAL COSTS CHANGES IN EN-ROUTE SERVICES ACTUAL COSTS UNIT COST PER KILOMETRE (LONG-TERM SERIES - DEFLATED COSTS) TRAFFIC STATISTICS TOTAL SERVICE UNITS GROWTH RATE TOTAL SERVICE UNITS TOTALS PER CHARGING ZONE SERVICE UNITS - EXEMPTED FLIGHTS DISTANCES - GROWTH RATE TOTAL DISTANCE PER CHARGING ZONE OPERATIONAL STATISTICS FLIGHTS PROCESSED GROWTH RATE TOTAL NUMBER OF FLIGHTS AND FLIGHT SEGMENTS RECOVERY RATES PRODUCTIVITY OF THE CENTRAL ROUTE CHARGES OFFICE FINANCIAL STATISTICS AMOUNTS BILLED FOR FLIGHTS PERFORMED IN AMOUNTS BILLED AND DISBURSED TO THE STATES VAT BILLED AND DISBURSED TO THE STATES ORIGIN OF TRAFFIC AND RECEIPTS... 26
4 - 4 -
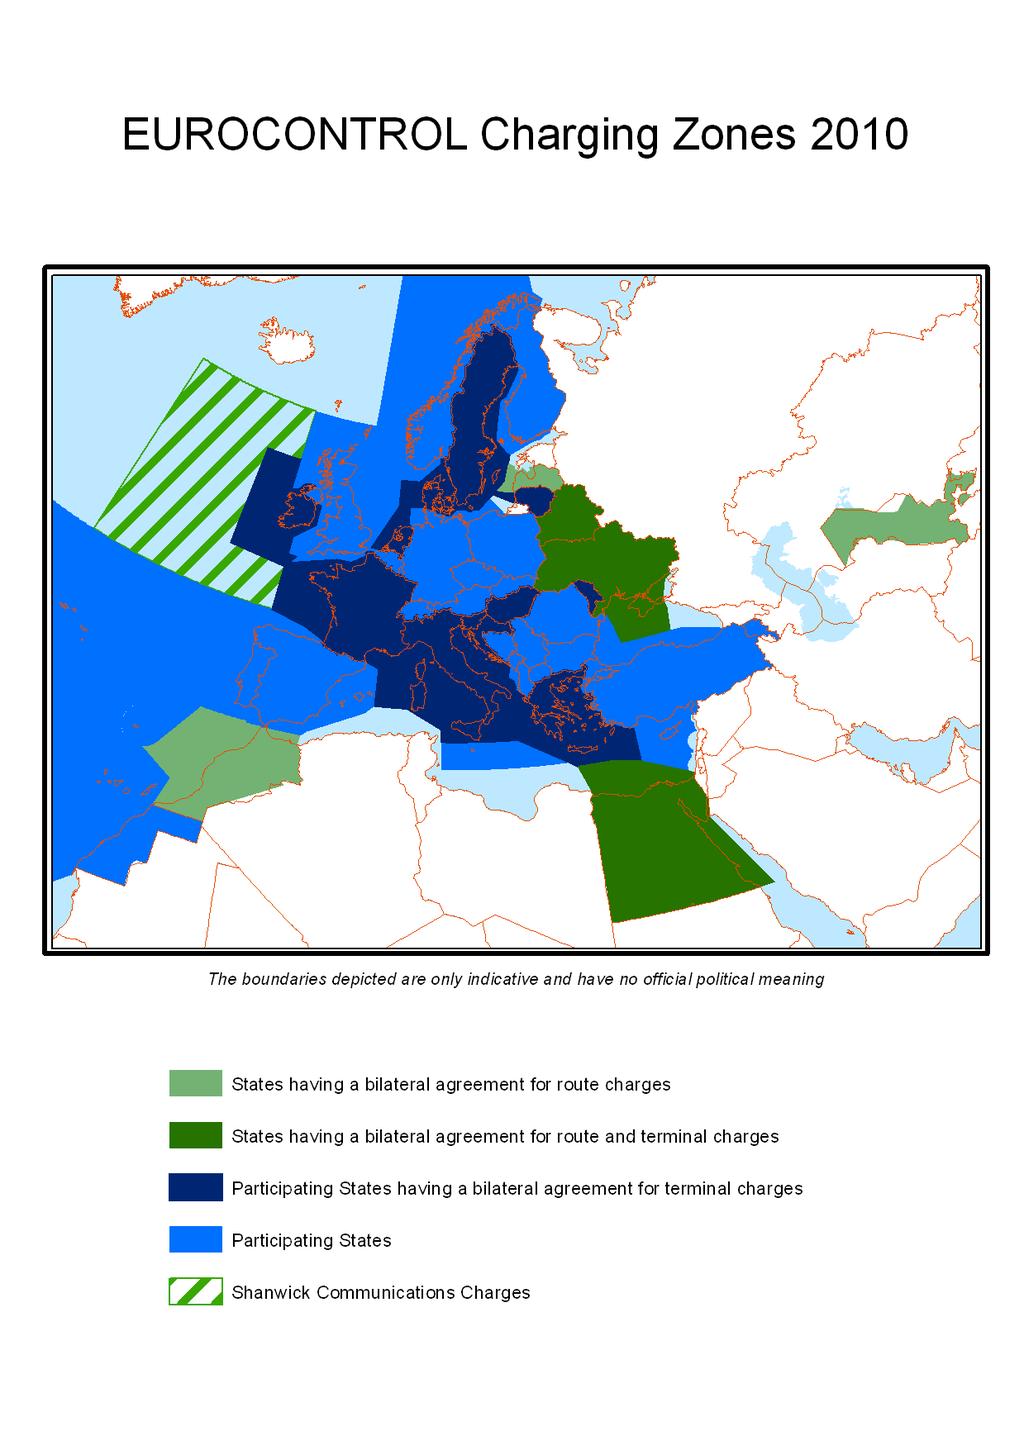
5 MAJOR DEVELOPMENTS IN Contracting States of the EUROCONTROL Route Charges System In 2010, 37 States participated in the Route Charges System. 1 Belgium 11 Spain 21 Sweden 31 Albania 2 Luxembourg 12 Greece 22 Italy 32 Bosnia and Herzegovina 3 Germany 13 Turkey 23 Slovak Republic 33 Serbia 4 France 14 Malta 24 Romania 34 Montenegro 5 United Kingdom 15 Cyprus 25 Croatia 35 Lithuania 6 Netherlands 16 Hungary 26 Bulgaria 36 Poland 7 Ireland 17 Norway 27 Monaco 37 Armenia 8 Switzerland 18 Denmark 28 FYROM 9 Portugal 19 Slovenia 29 Moldova 10 Austria 20 Czech Republic 30 Finland Table 1 - States participating in the Route Charges System in 2010 Latvia was technically integrated into the Route Charges System on 1 January 2011, and became the 38 th participating State 1.2. Key indicators Flights The CRCO processed 9.46 million messages relating to IFR flights operated from January to December 2010 in the airspace of the Contracting States, representing an increase of 0.9% over 2009 (see 5.1 and 5.2). Distances The number of kilometres recorded in the airspace of the Contracting States for the calculation of route charges was 8.71 billion kilometres in 2010, an increase of 2.9% over 2009 (see 4.4 and 4.5). Amounts billed The CRCO billed a total of EUR 6.57 billion in respect of route charges for flights operated from January to December 2010 in the airspace of the Participating States, an increase of 7.7% over 2009 (see 6.1 and 6.2). This amount excludes Value Added Tax (VAT) billed on behalf of VAT taxable Air Navigation Service Providers (ANSPs) of Contracting States (see 6.3). Amounts disbursed to the States The total amount disbursed to the Contracting States in 2010 (see 6.2) was EUR 6.42 billion plus EUR 0.4 million of bank interest, as well as EUR 1.65 million of interest on late payment. Medium and long-term recovery rates The medium-term recovery rate for 2009, measured on 31 December 2010, was 99.47%. The average long-term recovery rate for the period , measured on 22 February 2011, was 99.63% (see 5.3). Productivity of the EUROCONTROL CRCO The productivity of the CRCO, expressed as the number of flight messages processed per staff member, went up by 6.5% in 2010 (see 5.4).
6 Rules and procedures of the Route Charges System Principles for Establishing the Cost-Base and the Unit Rates The version of the Principles issued in October 2007, as amended in March 2010, remained applicable throughout 2010 (available on the CRCO web site). Guidance on the Rules and Procedures of the Route Charges System The version of the Guidance issued in November 2008, and amended in November 2010, remained applicable throughout 2010 (available on the CRCO web site). Conditions of Application of the Route Charges System and Conditions of Payment The version of the Conditions of application issued in October 2007 remained applicable throughout 2010 (available on the CRCO web site). Financial Regulations applicable to the Route Charges System The version of the Financial Regulations applicable to the Route Charges System that entered into force on 31 March 2009 remained applicable throughout Operations of the CRCO The CRCO operates the Route Charges System on behalf of the Contracting States. Aircraft operators are charged a single amount per flight, irrespective of the number of States overflown. Bills are established by the CRCO using flight messages sent by the Contracting States' Route Charges Offices (RCOs) and additional flight information made available via the EUROCONTROL Central Flow Management Unit (CFMU). The CRCO bills aircraft operators on a monthly basis, collects charges, and disburses the amounts collected to the States every week. Billing In 2010, the CRCO issued 40,514 bills (3,376 bills per month on average) to a total of 5,985 different airspace users. In 2009 these figures were 39,284, 3,274 and 5,866 respectively. In 2010, users filed 2,290 claims involving flights (2.292 and 43,421 in 2009 respectively). Correctly claimed flights amounted to 0.56% (0.33% in 2009) of the total flights processed. The average time for processing a claim was 39.9 days in 2009 (38.6 days in 2009). This figure refers to claims involving the CLA procedure only. Continuous efforts are made to maintain, and where possible to further accelerate the transmission and treatment of claims.
7 - 7 - Collection of charges The interest rate applicable on late payment was 11.58% per annum in 2010 (rate approved by the Permanent Commission on 2 December 2009 by Decision N o 113). In 2010, on average, 90.62% of the route charges were collected on the latest date for payment and 98.86% were recovered 30 days after (situation at 22 February 2011). These two percentage figures were respectively 88.77% and 98.58% in The increase in recovery rates reflected a slightly more favourable economic environment than in As at 31 December 2010, 99.47% of charges relating to 2009 were collected Update on Services to Stakeholders Adaptation to Single European Sky (SES) Requirements The first SES package was put in place early 2009, including changes to charging zones. Its aim was to deliver results that would be compatible with Functional Airspace Block (FAB) developments. A second SES package allowing for a better integration of terminal charges and management of incentives has been specified and is currently under development. Implementation of the EU VAT Package Further to the entering into force of the VAT Package in January 2010, the CRCO has adapted its application software to the new legislative requirements and has obtained from the States/ANSPs the information required to correctly invoice VAT. Renewal of the Application Software of the CRCO A project has been launched with a view to renew the application software, which uses ageing technologies. An in-depth analysis has been made to identify the major changes required for a more costeffective system that would offer the necessary the versatility to cope with emerging requirements from States and ANSP. This project will take several years and requires close cooperation with the National Route Charges Offices. Crisis Management The CRCO has updated its Risks Plan and integrated its own Business Continuity Plan in the Agency s Crisis Management Plan. CEFA (CRCO Extranet For Airspace Users) and DATALINK services The secured CRCO Extranet for Airspace users continued to confirm its success throughout the airspace user community. In December 2010, 1,323 users had signed a contract to use the CEFA services (1,164 in December 2009). The CRCO dispatched billing information electronically for 86.4% of the flights and 92% of the route charges billed. ETNA (Extranet to National Administrations) The ETNA Service is available to all Contracting States of the Multilateral Route Charges System (37 States in total) and to non-member States with a Bilateral Agreement. More than 900 reports are published each month throughout 120 accounts (three accounts per State: CAA, RCO and ANSP). During the month of December 2010, 11,500 pages were recorded as consulted by ETNA users.
8 - 8 - FRAUD Several campaigns were undertaken to counter the fraudulent attempts aiming at extorting funds from airspace users with fake identity and fake billing documents for air navigation charges. The CRCO thoroughly followed this matter and undertook all possible actions inform airspace users about such attempts. By allowing airspace users to crosscheck their billing documents against their financial situation available on a secured Internet site, CEFA has proven to be a reliable media for thwarting all fraudulent attempts. Facility for payments by Credit Card This facility has been in operation since In 2010 some 625 users used the credit card facility in 6,929 transactions amounting to 4.94 million euros. In 2009 these figures were 631, 6,342 and EUR 4.18 million respectively Bilateral agreements with EUROCONTROL Member States Billing and collection of Terminal Charges EUROCONTROL operates bilateral agreements relating to terminal charges with France (billing only), the Netherlands, Ireland, Denmark, Italy, Moldova, Hungary, Croatia, Slovenia, Lithuania, Sweden, and Greece. Any EUROCONTROL Member State may avail of terminal charges billing and collection services. Costs for billing and collecting terminal charges at the same time as en-route charges are very low since the same data is used for both types of charge. Moreover, claims submitted by users in relation to both types of charge are processed in a single and coherent operation. The total amount of terminal charges billed in 2010 was EUR million (including France), corresponding to 2.6 million flights. Billing and collection of Shanwick Communications Charges EUROCONTROL bills and collects Shanwick communications charges in respect of flights performed in the Shanwick Oceanic Region on behalf of the Irish Aviation Authority (IAA). In 2009, the total amount of charges billed amounted to EUR 16.1 million corresponding to 383,705 flights Bilateral agreements relating to air navigation charges EUROCONTROL operates bilateral agreements relating to air navigation charges with five non-member States, namely Belarus, Latvia (until 31/12/2010), Uzbekistan, Morocco and Egypt, as well as with one EUROCONTROL Member State, namely Ukraine (until the technical integration into the Multilateral Route Charges System). Air navigation charges comprise route charges, and optionally, terminal charges. In 2010, terminal charges were billed on behalf of Ukraine, Belarus and Egypt. The States concerned fund all resources required for operating these bilateral agreements, without any financial contribution from the EUROCONTROL Member States. The total amount of air navigation charges billed in 2010 was EUR million, corresponding to 1.31 million flights.
9 UNIT RATES Cost-bases and national unit rates The national unit rates were determined in accordance with the common "Principles for Establishing the Cost-Base for Route Facility Charges and the Calculation of the Unit Rates" and were approved by the Permanent Commission on 2 December 2009 by Decision N o 112. Table 2 sets out the cost-bases and national unit rates for 2010 (Average September 2009 exchange rates). The costs chargeable to users were derived from States' forecast costs (column 1), EUROCONTROL forecast costs (column 3), reductions for exempted flights (column 4) and States' under/over recoveries carried-over to 2010 (column 6). Table 2 - Cost-bases and national unit rates for 2010 National Income Eurocontrol Reductions for Reduced Balance Costs chargeable Chargeable National Charging areas Costs from other Costs exempted flights cost-base carried over to users service units unit rates EUR sources EUR EUR EUR EUR EUR EUR = = =7/8 Belgium-Luxembourg 147,456,404 13,494,917 2,599, ,351,900-7,937, ,289,487 2,174, Germany (1) 730,816, ,121, ,938,212 27,943, ,994,449 12,184, France 1,082,422,108 3,150,000 84,339,074 19,252,541 1,144,358,641 50,680,810 1,093,677,830 16,833, United Kingdom (2) 695,390,665 10,100, Netherlands 147,903,760 1,567,000 16,142,000 2,289, ,189, , ,020,651 2,452, Ireland 100,441,000 8,215,580 2,320, ,336,456 2,194, ,141,738 3,394, Sw itzerland 111,932,832 10,554,384 2,315, ,171,926 14,737, ,434,114 1,407, Portugal Lisboa 110,321,101 9,761,947 2,009, ,073,676-8,709, ,782,720 2,584, Austria 155,269,000 11,600,000 2,575, ,293,064-3,190, ,483,841 2,430, Spain Continental 726,199,086 75,689,411 52,574,690 14,701, ,382, ,382,705 8,196, Spain Canarias 108,223,891 15,406,811 10,768,310 1,387, ,197, ,197,844 1,499, Portugal Santa Maria 44,522,070 2,440,487 1,634,571 45,327,986 1,178,541 44,149,445 3,609, Greece 153,780,000 12,562,000 4,780, ,561,648-5,555, ,117,487 4,293, Turkey 227,434,360 17,205,000 8,584, ,055,339-4,209, ,264,433 8,108, Malta 10,773, , ,353 10,988, ,106 10,240, , Italy 560,174,568 34,523,869 51,572,753 16,781, ,442,252 1,796, ,646,231 8,154, Cyprus 40,569,000 2,426, ,484 42,470,737 3,521,510 38,949,227 1,294, Hungary 73,279,014 4,867,995 1,597,165 76,549,844 2,959,001 73,590,843 2,013, Norw ay 92,509,073 8,509, , ,018,891 4,911,883 95,107,008 1,495, Denmark 97,615,578 8,092,231 2,422, ,284,992-2,305,943 88,409,651 1,376, Slovenia 25,023, ,000 1,544, ,767 26,175,626 26,175, , Romania 137,478,507 7,592,750 9,220,070 4,223, ,881,998-10,812, ,694,035 3,137, Czech Republic 89,769,414 6,812,619 3,918,379 92,663, ,988 91,681,667 1,933, Sw eden 159,045, ,887 13,227, , ,333, , ,225,907 2,952, Slovak Republic 47,032,000 2,915,863 97,158 49,850,705 6,722,467 43,128, , Croatia 55,131,580 3,577, ,575 58,375, ,057 58,589,719 1,400, Bulgaria 76,542,370 4,699, ,933 80,645,497 5,350,541 75,294,957 1,759, FYROM 9,756, ,762 31,481 10,357, ,092 11,175, , Moldova 5,182, ,087 11,946 5,511,227-2,116 5,513, , Finland 28,842, ,335 3,868, ,416 31,316,987 2,029,019 29,287, , Albania 16,287, , ,499 17,021,213 80,800 16,940, , Bosnia and Herzegovina 23,149,469 1,084,935 53,945 24,180,458-1,767,171 25,947, , Serbia - Montenegro 64,629,952 4,319,896 69,804 68,880, ,425 68,010,619 1,734, Lithuania 16,906, ,572 1,287,120 72,776 17,856,573 1,100,595 16,755, , Poland 114,022,914 8,719,446 1,367, ,375, , ,662,716 3,021, Armenia 3,226, ,602 3,867 3,511,948 3,511, , Total 5,593,670, ,679, ,371,403 99,430,350 5,879,931,528 82,274,253 6,475,866, ,656, (1) Includes service units for flight segments performed as Operational Air Traffic Estimated number in Germany is per year. (2) The chargeable costs figure for the United Kingdom has been obtained by multiplying the unit rate by the forecast service units as agreed by the UK DOT/CAA Source: WP CER /FIN dated 24/11/2009
10 Weighted national unit rate The average weighted national unit rate for the Contracting States is calculated by dividing the sum of the costs chargeable to users by the sum of the chargeable service units in respect of the same year. The average weighted national unit rate for 2010 was EUR (see Table 2). Graph 1 gives the average weighted national unit rate in euros from 2006 to 2010, based on forecast costs and service units used to establish the national basic unit rates (with the exchange rates of September previous years). Graph 1 - Average weighted national unit rate EUR % -0.2% 1.6% 0.1%
11 ACTUAL COSTS 3.1. Changes in en-route services actual costs Table 3 shows the actual costs incurred by States to provide en route services in 2007, 2008 and States actual costs were converted into euros using the yearly average exchange rates and are set out in Table 3 below. States shares of EUROCONTROL costs are included. Table 3 - En-route services actual costs Growth Growth Charging areas (actual figures) (actual figures) (actual figures) rate rate EUR EUR EUR 2008/ /2008 Belgium-Luxembourg 161,008, ,194, ,650, % 2.1% Germany 807,855, ,715, ,464, % 5.3% France (1) 1,063,252,700 1,085,066,288 1,117,581, % 3.0% United Kingdom (2) 851,725, ,241, ,118, % -10.2% Netherlands 132,310, ,752, ,626, % 4.0% Ireland 102,173, ,642, ,199, % -3.2% Switzerland (3) 118,432, ,812, ,677, % -4.0% Portugal Lisboa 126,467, ,412, ,220, % -9.0% Aus tria 153,828, ,093, ,658, % -3.9% Spain-Continental 760,606, ,079, ,446, % -1.1% Spain-Canarias 117,889, ,669, ,326, % 0.5% Portugal Santa Maria 51,168,908 49,252,185 47,136, % -4.3% Greece 171,957, ,202, ,113, % -0.6% Turkey 196,198, ,239, ,390, % 3.8% Malta 11,716,122 11,146,086 11,335, % 1.7% Italy 585,420, ,010, ,560, % -1.1% Cyprus 37,489,111 40,077,000 43,799, % 9.3% Hungary 68,602,228 60,842,311 65,320, % 7.4% Norway 102,759,985 90,210,254 93,530, % 3.7% Denmark 90,227,528 98,147, ,866, % 4.8% Slovenia 19,161,435 23,020,031 23,808, % 3.4% Romania 133,021, ,962, ,177, % 5.7% Czech Republic 84,833,420 91,248,597 91,274, % 0.0% Sweden 151,481, ,907, ,608, % 7.0% Slovak Republic 33,884,552 39,953,264 43,454, % 8.8% Croatia 53,100,309 54,705,721 58,315, % 6.6% Bulgaria 68,963,582 78,663,771 78,183, % -0.6% FYROM 9,805,843 10,218,767 10,633, % 4.1% Moldova 4,025,476 5,260,835 6,143, % 16.8% Finland 28,605,635 29,668,241 30,022, % 1.2% Albania 13,951,008 13,439,598 15,487, % 15.2% Bosnia and Herzegovina 17,517,311 17,344,781 19,914, % 14.8% Sub-total 6,329,441,046 6,569,199,008 6,578,048, % 0.1% Serbia - Montenegro 61,316,354 70,235, % Lithuania 17,608,812 16,992, % Poland 112,857, ,349, % Armenia 3,466,447 Total 6,329,441,046 6,760,981,428 6,775,091, % 0.2% Note: (1) Jersey and Geneva included (2) Corresponds to the amount billed in respect of national charges (3) Excluding Geneva (France) Source: WP CE/R/10/91/3330 dated 06/12/2010
 Evolution of real (en-route) Air Navigation Services Unit Cost (over 1982-2011) The graph below shows for each year between 1982 and")
12 Unit cost per kilometre (long-term series - deflated costs) Evolution of real (en-route) Air Navigation Services Unit Cost (over ) The graph below shows for each year between 1982 and 2011, the unit cost per kilometre of the en-route services made available to users in the airspace of the 1982 Contracting States, i.e. Belgium, Luxembourg, Germany, France, United Kingdom, Netherlands, Ireland, Switzerland, Portugal (Lisboa and Santa Maria), Austria, Spain (Continental and Canaries). These eleven States represented 66% of the EUROCONTROL route charges in Costs are actual between 1982 and 2009 and forecast for 2010 and 2011 (forecasts presented to the November 2010 session of the enlarged Committee). They are deflated by the EUROSTAT GDP deflator available for the period and recommended for use by the statistical office of the European Communities. For these 11 States the unit cost per kilometre was EUR 0.91 in 2009 (actual costs as shown in Table 3 divided by the number of kilometres flown as shown in Table 8). Graph 2 - Unit cost per kilometre Evolution of real (en-route) ANS Unit Cost for the CRCO 88 Area over Index 100 in E2011F For the last 20+ years, the series has shown a cyclical evolution in the unit cost per kilometre, with peaks recorded in 1983 (+26% above 2011 level) and 1994 (+31% above 2011 level). The plateau reached in is significantly lower than the previous peaks, thus reflecting relatively lower unit costs since 2001 as compared with previous cycles. The real unit costs of these 11 States decreased until 2008 (lowest level over the period ) and have been increasing again since then.
13 TRAFFIC STATISTICS 4.1. Total service units growth rate For a given flight and a given charging zone, the route charge is equal to the number of service units multiplied by the unit rate. The number of service units is equal to the weight factor (i.e. the square root of the MTOW divided by 50) multiplied by the distance factor (i.e. the great circle distance between the entry and exit points at which the route indicated in the last filed flight plan crosses the charging zone boundary). During the past three years, the growth rate of the total number of service units was as follows: Table 4 Total Service units Year Service units Growth rate ,047, % ,865, % ,838, % ,759, % The growth rate of 3.5% between 2009 and 2010, about half of the growth rates of the years 2007 and 2008, was analysed by STATFOR in the Service Unit Forecast released on 28 February Service units in 2010 started at volumes similar to The ash cloud crisis in April and May however resulted in a significant loss of SUs in 2010 (around , representing 0.6% of the TSUs over 2010). The summer, however, saw strong growth, with July passing the 2008 peak, on the back of strong growth in the number of flights. This ended with a peak of growth at 7.1% observed in October The rest of the year showed lower growth figures with a minimum of 2.3% observed in December 2010 compared to December 2009 levels. This lower growth in TSUs is also partly driven by slower flight growth from the start of the winter timetable, as well as by the December poor weather around Europe that resulted in many flight cancellations. Graph 3 Growth rate of total service units (Millions) % 6.1% -5.1% 3.5%
14 Total service units totals per charging zone Table 5 gives, for each charging zone, the total number of service units (chargeable and exempted), generated from 2006 to 2010, as well as the average annual growth observed during the same period. Table 5 - Total number of service units generated Growth Average Charging areas rate annual growth 2010/ Belgium-Luxembourg 2,079,843 2,183,554 2,220,106 2,078,793 2,114, % 0.4% Germany 11,712,378 12,418,542 12,749,260 11,912,989 12,294, % 1.2% France 16,756,129 17,994,526 18,034,193 16,779,861 16,636, % -0.2% United Kingdom 10,425,611 10,895,789 11,043,630 9,914,403 9,480, % -2.3% Netherlands 2,517,718 2,639,028 2,621,275 2,425,841 2,476, % -0.4% Ireland 3,596,687 3,821,993 3,823,471 3,560,633 3,615, % 0.1% Switzerland 1,367,726 1,451,709 1,471,851 1,396,243 1,409, % 0.8% Portugal Lisboa 2,516,398 2,631,041 2,676,891 2,501,219 2,624, % 1.1% Aus tria 2,341,828 2,508,677 2,565,596 2,423,824 2,448, % 1.1% Spain-continental 8,517,801 9,244,448 9,128,844 8,358,173 8,641, % 0.4% Spain-Canarias 1,589,020 1,691,398 1,713,085 1,492,498 1,539, % -0.8% Portugal Santa Maria 3,187,641 3,304,362 3,483,618 3,478,747 3,696, % 3.8% Greece 3,753,956 4,049,184 4,258,001 4,138,832 4,454, % 4.4% Turkey 6,628,787 7,167,653 7,628,625 8,086,183 8,923, % 7.7% Malta 326, , , , , % 10.5% Italy 8,048,679 8,619,663 8,660,349 8,144,736 8,621, % 1.7% Cyprus 1,057,376 1,177,974 1,310,890 1,273,476 1,351, % 6.3% Hungary 2,062,800 2,104,422 2,092,142 2,038,443 2,091, % 0.3% Norway 1,342,212 1,419,826 1,537,052 1,494,584 1,582, % 4.2% Denmark 1,395,322 1,479,900 1,474,287 1,358,804 1,410, % 0.3% Slovenia 268, , , , , % 8.0% Romania 3,300,170 3,236,389 3,240,107 3,132,895 3,414, % 0.9% Czech Republic 1,895,700 1,940,179 2,019,121 2,022,528 2,190, % 3.7% Sweden 2,930,251 3,094,323 3,271,474 2,906,484 2,950, % 0.2% Slovak Republic 734, , , , , % 3.9% Croatia 1,028,323 1,203,751 1,270,788 1,298,237 1,450, % 9.0% Bulgaria 1,453,417 1,624,400 1,746,648 1,798,292 1,839, % 6.1% FYROM 173, , , , , % 1.4% Moldova 70,441 93, , , , % 26.7% Finland 737, , , , , % 0.1% Albania 263, , , , , % 11.2% Bosnia and Herzegovina 382, , , , , % 13.6% Sub-total 104,463, ,128, ,504, ,510, ,110, % 1.6% Serbia - Montenegro (1) 919,574 1,747,513 1,782,884 1,819, % Lithuania 383, , , % Poland 3,229,758 3,092,271 3,312, % Armenia (2) 111, , % Total 104,463, ,047, ,865, ,838, ,759, % 2.8% 2010 service units: situation at 28/01/2011 (1) 2007 service units - Serbia-Montenegro period 1/07/ /12/2007 (2) 2009 service units - Armenia period 1/03/ /12/2009
15 Service units - exempted flights Table 6 details the number of service units generated in each charging zone in For any given charging zone, the number of chargeable service units, (column 11), is the difference between the total service units (column 1) and the service units generated in respect of exempted flights (column 10). Table 6 - Service units generated in respect of exempted flights E X E M P T E D F L I G H T S Total Military Search State VFR Total Chargeable STATES Service (Member (non-member & Aircraft Training & Circular Other* (2) to (9) service units units States) States) Rescue < 2T (1) - (10) Belgium - Luxembourg 2,114,555 9,307 17, , , ,675 2,084,879 Germany 12,294,212 32,933 91, , , ,102 12,150,110 France 16,636,697 95,332 52, ,677 3,575 15,547 3,367 3, ,622 16,454,074 United Kingdom 9,480,262 29, , , ,745 1, ,671 9,317,591 Netherlands 2,476,273 4,942 22, , ,792 2,445,480 Ireland 3,615,036 4,325 62, ,255 3,546,781 Switzerland 1,409,298 1, , ,056 1,405,243 Portugal Lisboa 2,624,149 9,503 39, , ,375 2,572,775 Aus tria 2,448,711 2, , , ,838 2,441,873 Spain-Continental 8,641,861 26,126 78, ,941 1,181 3,626 5, ,550 8,521,311 Spain-Canarias 1,539,855 4,044 8, ,340 1,525,515 Portugal Santa Maria 3,696,385 12, , , , ,872 3,556,513 Greece 4,454,155 52,240 56, , ,369 4,339,786 Turkey 8,923,420 31, , , ,303 8,646,117 Malta 486,800 1,485 14, , ,853 Italy 8,621, ,194 93, , ,706 2,086 1, ,760 8,403,497 Cyprus 1,351,886 11,163 3, , ,577 1,335,310 Hungary 2,091,322 7,797 35, , ,455 2,045,867 Norway 1,582,742 7,701 5, ,093 2,935 18,821 1,563,921 Denmark 1,410,791 4,593 2, ,580 1,401,212 Slovenia 365, , ,364 Romania 3,414,282 2, , , ,540 3,303,742 Czech Republic 2,190,096 11,286 57, , , ,054 2,118,042 Sweden 2,950,007 6,137 1, , , ,897 2,938,110 Slovak Republic 855, , ,414 Croatia 1,450,834 1,727 1, ,377 1,446,457 Bulgaria 1,839,757 5,073 12, , ,797 1,820,961 FYROM 183, ,921 Moldova 181, ,346 Finland 739,502 3, , , ,520 Albania 403,785 1, , ,443 Bosnia and Herzegovin 637, ,298 Serbia - Montenegro 1,819, , ,577 1,817,638 Poland 3,312,823 10,914 1, , , ,543 3,296,279 Lithuania 370, , ,444 Armenia** 146, ,844 TOTAL 116,759, ,360 1,252, ,057 6,537 57,613 18,731 11,630 1,920, ,838,531 *: Other exempted flights are flights for checking navaids, humanitarian flights, police and custom flights as w ell as specific flights credited. **: Armenia: period 01/03/ /12/ service units: situation at 28/01/2011 (Source: EUROCONTROL / CRCO)
16 Distances - growth rate During the past three years, the growth rate of the number of kilometres recorded in the airspace of the Contracting States for the calculation of route charges (therefore, great circle distance after deduction of 20 km for departing and arriving flights) was as follows: Table 7 Total Distances for all charges zones Year Distances flown (km) Growth rate ,017,738, % ,467,732, % ,713,158, % Graph 4 Growth rate of distances (Billions of kms) % 5.5% -6.1% 2.9%
17 Total distance per charging zone Table 8 sets out the distances (see 4.4) in each charging zone from 2006 to 2010, as well as the average annual growth observed during the same period. Table 8 - Total distance per charging zone Growth Average Charging areas rate growth (1) (kilometres) (kilometres) (kilometres) (kilometres) (kilometres) 2009/ Belgium-Luxembourg 164,054, ,909, ,475, ,180, ,019, % -0.6% Germany 970,326,802 1,020,802,843 1,041,109, ,242, ,541, % 0.2% France 1,411,216,328 1,508,286,206 1,505,070,656 1,391,431,314 1,378,852, % -0.6% United Kingdom 776,333, ,758, ,201, ,145, ,387, % -3.1% Netherlands 190,599, ,062, ,679, ,992, ,330, % -1.0% Ireland 187,487, ,930, ,295, ,040, ,220, % -0.3% Switzerland 123,534, ,705, ,994, ,514, ,082, % -0.1% Portugal Lisboa 175,761, ,600, ,377, ,131, ,601, % 1.1% Austria 193,366, ,641, ,673, ,720, ,707, % 0.4% Spain-Continental 722,438, ,762, ,993, ,869, ,442, % -0.1% Spain-Canarias 105,772, ,431, ,901,790 96,388,187 99,651, % -1.5% Portugal Santa Maria 152,029, ,979, ,836, ,526, ,574, % 3.7% Greece 278,422, ,887, ,984, ,381, ,829, % 4.4% Turkey 404,260, ,986, ,180, ,166, ,701, % 8.7% Malta 19,507,279 22,327,858 25,034,762 25,427,754 29,064, % 10.5% Italy 679,178, ,592, ,381, ,098, ,945, % 1.1% Cyprus 71,464,414 79,590,623 89,321,814 87,994,772 93,898, % 7.1% Hungary 141,028, ,748, ,853, ,570, ,328, % 0.6% Norway 122,412, ,070, ,072, ,396, ,920, % 2.3% Denmark 117,802, ,256, ,583, ,281, ,961, % -0.4% Slovenia 23,609,951 27,517,584 29,348,418 28,161,945 30,773, % 6.8% Romania 196,657, ,262, ,293, ,677, ,750, % 1.6% Czech Republic 138,893, ,150, ,427, ,242, ,029, % 3.1% Sweden 242,035, ,899, ,506, ,561, ,998, % -0.3% Slovak Republic 53,843,234 53,082,653 56,436,208 55,594,966 61,102, % 3.2% Croatia 82,187,212 95,366,856 99,209, ,179, ,977, % 8.0% Bulgaria 101,682, ,018, ,841, ,028, ,918, % 6.1% FYROM 13,894,016 14,714,873 14,985,819 14,764,258 14,924, % 1.8% Moldova 4,716,174 5,992,524 7,444,089 8,280,599 10,572, % 22.4% Finland 60,881,762 60,463,174 62,283,329 58,346,496 58,740, % -0.9% Albania 19,418,246 23,199,748 24,147,968 26,247,965 29,864, % 11.4% Bosnia and Herzegovina 30,578,423 38,071,572 41,080,774 45,095,471 49,608, % 12.9% Sub-total 7,975,394,154 8,480,070,564 8,610,028,312 8,072,681,930 8,295,321, % 1.0% Serbia - Montenegro 70,914, ,191, ,778, ,530, % Poland 242,431, ,595, ,152, % Lithuania 31,087,285 26,498,502 28,881, % Armenia* 6,177,435 8,272, % Total 7,975,394,154 8,550,984,620 9,017,738,778 8,467,732,360 8,713,158, % 2010 distances: situation at 28/02/2011 (1) Average annual grow th during the period *: Armenia: period 01/03/ /12/2009
18 OPERATIONAL STATISTICS 5.1. Flights processed growth rate The number of flight messages processed corresponds to the number of flights, whether they are chargeable or exempted, recorded for charging purposes in the airspace of the Contracting States. During the past three years, the growth rate of the number of flight messages processed was as follows: Table 9 - Number of flight messages processed Year Flights processed Growth rate ,992, % ,375, % ,456, % Graph 5 Growth rate of flight messages processed (Millions) % 1.3% -6.2% 0.9%
19 Total number of flights and flight segments The total numbers of flight segments, given per charging zone, as well as the total number of flights recorded in the airspace of the Contracting States from 2006 to 2010, are shown in Table 10 below. Table 10 - Flight segments / Flights Growth Average Charging areas 2006 (1) 2007 (1) 2008 (1) 2009 (1) 2010 (1) rate growth (2) 2010/ Belgium-Luxembourg 1,064,835 1,112,966 1,119,647 1,032,732 1,047, % -0.4% Germany 3,049,712 3,192,615 3,240,459 3,012,059 3,065, % 0.1% France 2,850,634 3,021,004 3,010,360 2,790,107 2,784, % -0.6% United Kingdom 2,433,477 2,518,124 2,483,384 2,250,408 2,150, % -3.0% Netherlands 1,082,768 1,127,800 1,114,204 1,029,479 1,044, % -0.9% Ireland 564, , , , , % -2.3% Switzerland 1,098,086 1,160,161 1,162,109 1,080,737 1,085, % -0.3% Portugal Lisboa 398, , , , , % 1.7% Austria 1,125,759 1,212,614 1,235,837 1,138,117 1,163, % 0.8% Spain-Continental 1,644,359 1,784,336 1,750,388 1,584,184 1,614, % -0.5% Spain-Canarias 304, , , , , % -2.4% Portugal Santa Maria 113, , , , , % 2.0% Greece 550, , , , , % 4.2% Turkey 709, , , , , % 8.5% Malta 76,313 81,588 84,896 85,317 95, % 5.7% Italy 1,703,200 1,849,129 1,819,867 1,688,132 1,748, % 0.7% Cyprus 212, , , , , % 7.1% Hungary 603, , , , , % 0.7% Norway 463, , , , , % 1.1% Denmark 614, , , , , % -0.6% Slovenia 266, , , , , % 5.2% Romania 412, , , , , % 3.1% Czech Republic 631, , , , , % 1.8% Sweden 660, , , , , % -0.4% Slovak Republic 350, , , , , % 3.0% Croatia 342, , , , , % 7.6% Bulgaria 398, , , , , % 5.8% FYROM 117, , , , , % 1.8% Moldova 27,370 34,454 40,984 43,619 53, % 18.5% Finland 250, , , , , % -0.4% Albania 118, , , , , % 11.2% Bosnia and Herz. 166, , , , , % 10.3% Sub-total 24,408,183 25,875,366 26,207,049 24,521,176 25,083, % 0.7% Serbia - Montenegro 259, , , , % Poland 606, , , % Lithuania 184, , , % Armenia 40,727 52, % Total flight segments 24,408,183 26,134,880 27,491,975 25,787,694 26,437, % Total flights 9,337,456 9,868,409 9,992,864 9,375,943 9,456, % (1): Excluding VFR flights representing 1% of the total flight processed Impact of VFR flights on total distances, service units and charges is negligible VFR flights processed in 2010, of w hich w ere performed in Italian airspace. (2): Average annual grow th during the period flight segments and number of flights: situation at 19/01/2011
20 Recovery rates Medium and long-term recovery rates The medium-term recovery rate, or recovery rate after one year, is published annually by the CRCO. It is the recovery rate, at 31 December of year N, for amounts billed in respect of year N-1. The recovery rate for 2009, measured on 31 December 2010, was 99.47%. The long-term recovery rate reflects the trend performance of the CRCO. The graph below also shows the yearly recovery rates for the period measured on 22 February The average long-term recovery rate for this period is 99.63%. Graph 6 Medium and long-term recovery rates 100.0% 99.77% 99.81% 99.84% 99.5% 99.71% 99.76% 99.82% 99.17% 99.53% 99.47% 99.0% 99.07% 98.5% after 1 year 22/02/ % Quarterly recovery rates at latest date for payment and after 30 days The annual average recovery rate on the latest date for payment increased from 88.77% in 2009 to 90.62% in The after 30 days recovery rate increased from 98.58% in 2009 to 98.86% in Graph 7 - Recovery rates on latest date for payment and after 30 days 100.0% 98.2% 99.0% 98.7% 98.4% 99.1% 99.0% 99.0% 98.3% 95.0% 90.0% 87.4% 89.2% 89.2% 89.3% 89.7% 91.8% 90.7% 90.3% 85.0% 80.0% 75.0% On latest date for payment After 30 days 70.0%

21 Productivity of the CRCO Number of flight messages processed per staff The productivity of the CRCO, expressed as the number of flight messages processed per staff member, increased by 6.5%. Graph 8 - CRCO Productivity 100,000 95,283 99,197 99,216 94, ,007 90,000 80,000 70,000 60,000 50,000 40, % 0% -4.4% 6.5% 30,000 20,000 10, CRCO s actual costs compared to service units / amounts billed The table and graphs below show the ratios between the CRCO s actual net costs (route charges collection costs, Multilateral System net of receipts from bilateral agreements) and service units / amounts billed. The two ratios increased in Table 11 - Ratios between the CRCO s actual net costs and service units / amounts billed Year CRCO Costs Service units Cost per Amounts billed Ratio MEUR (millions) service unit MEUR % =2/ , % , % , % , % , %

22 Graph 9 - CRCO s actual net costs / service units In EUR per service unit Graph 10 - CRCO s actual net costs / amounts billed 0.4% 0.3% 0.32% 0.29% 0.28% 0.31% 0.27% 0.2% 0.1% 0.0%
23 FINANCIAL STATISTICS 6.1. Amounts billed for flights performed in 2010 The amounts billed to airspace users for flights operated from January to December 2010 totalled EUR 6.57 billion. This represents a increase of 7.7%. It excludes Value Added Tax (VAT) amounting to EUR 16.7 million billed on behalf of 16 VAT- taxable ANSPs of the respective Contracting States (see Table 14). Table 12 - Amounts billed for flights performed in (excluding VAT) Year Amounts billed (EUR) Growth rate ,438,196, % ,094,243, % ,565,365, % Graph 11 - Amounts billed for flights performed in (excluding VAT) (Billions of EUR) % 3.3% -5.3% 7.7%
24 Amounts billed and disbursed to the States Table 13 shows the total amounts billed for flights performed in 2010 and the amounts disbursed to the Contracting States during 2010, excluding VAT. Table 13 - Amounts billed and disbursed to the States in 2010 Amount billed Net amount disbursed States (excluding VAT) (excluding VAT) EUR EUR Belgium-Luxembourg 159,681, ,193, Germany 838,236, ,237, France 1,071,160, ,052,147, United Kingdom 668,468, ,442, Netherlands 160,912, ,970, Ireland 109,276, ,658, Switzerland 114,600, ,528, Portugal Lisboa 126,529, ,612, Austria 168,586, ,342, Spain-Continental 716,727, ,353, Spain-Canarias 104,146, ,561, Portugal Santa Maria 43,958, ,751, Greece 169,512, ,795, Turkey 257,308, ,735, Malta 12,176, ,843, Italy 576,816, ,322, Cyprus 40,366, ,482, Hungary 73,948, ,260, Norway 106,646, ,453, Denmark 90,161, ,086, Slovenia 27,746, ,952, Romania 146,835, ,336, Czech Republic 100,796, ,995, Sweden 180,752, ,362, Slovak Republic 46,061, ,423, Croatia 60,998, ,680, Bulgaria 78,172, ,073, FYROM 10,399, ,107, Moldova 7,286, ,844, Finland 29,604, ,827, Albania 17,335, ,480, Bosnia and Herzegovina 25,122, ,849, Serbia - Montenegro 65,128, ,515, Poland 137,006, ,940, Lithuania 18,386, ,811, Armenia 4,507, ,119, Total 6,565,365, ,416,101, National charges (all States) 6,550,435, Administrative charges (all States) 14,929, amounts billed: situation at 17/01/ amounts disbursed: Balance Sheet and Administrative (Operating Results) Accounts Financial Year 2010
25 VAT billed and disbursed to the States Table 14 shows the total amounts of VAT billed for flights performed in 2010 and the amounts disbursed during 2010 to the sixteen VAT- taxable ANSPs of the respective Contracting States applying VAT to route charges. Table 14 - VAT billed and disbursed to the Contracting States in 2010 VAT VAT States billed disbursed EUR EUR Germany 2,484, ,642, United Kingdom 431, , Ireland 298, , Switzerland 30, , Austria 497, , Norway 10,351, ,208, Denmark* 214, , Slovenia 50, , Romania 565, , Czech Republic 184, , Sweden** , Slovak Republic 366, , Croatia 128, , Moldova Finland 622, , Poland 442, , Lithuania 65, , Total 16,734, ,722, National charges (all States) 16,699, Administrative charges (all States) 35, amounts billed: situation at 17/01/ amounts disbursed: Balance Sheet and Administrative (Operating Results) Accounts Financial Year 2010 * VAT invoiced as from 01/03/2010 ** VAT not invoiced as from 01/04/2009
26 ORIGIN OF TRAFFIC AND RECEIPTS Table 15 shows the percentage of chargeable service units and route charges recorded for all the Contracting States in 2010, by user nationality. Contracting States' national users accounted for 74.9% of the total number of chargeable service units and for 80.6% of the total route charges billed. In 2010, 68.9% of the route charges were billed to the fifty main users of the airspace of the Contracting States. Table 15 - Total percentage of chargeable service units and route charges billed in 2010, by user nationality User nationality Chargeable service units Route charges billed Belgium 1.5% 1.7% Luxembourg 0.5% 0.5% Germany 11.7% 14.6% France 6.3% 6.7% United Kingdom 13.8% 15.8% Netherlands 3.7% 4.3% Ireland 6.0% 7.1% Switzerland 2.2% 2.4% Portugal 1.8% 1.5% Austria 1.6% 1.7% Spain 5.2% 5.0% Greece 0.9% 0.6% Turkey 5.6% 4.3% Malta 0.3% 0.3% Cyprus 0.4% 0.3% Hungary 1.2% 1.1% Norway 1.2% 1.5% Denmark 1.0% 1.0% Slovenia 0.2% 0.2% Czech Republic 0.9% 0.9% Sweden 2.5% 3.1% Italy 3.4% 3.4% Slovak Republic 0.1% 0.1% Romania 0.6% 0.4% Croatia 0.2% 0.2% Bulgaria 0.3% 0.3% Monaco 0.0% 0.0% FYROM 0.0% 0.0% Moldova 0.1% 0.0% Finland 1.0% 1.0% Albania 0.1% 0.0% Bosnia and Herzegovina 0.0% 0.0% Serbia - Montenegro 0.1% 0.1% Poland 0.6% 0.6% Lithuania 0.1% 0.1% Armenia 0.1% 0.0% Total Participating States 74.9% 80.6% USA 5.6% 4.8% Others 19.5% 14.6% Total all nationalities 100.0% 100.0% Total European Union 65.4% 72.1%
European Organisation for the Safety of Air Navigation Central Route Charges Office (CRCO) Report on the Operation of the Route Charges System in 2016
 Report on the Operation of the Route Charges System in 2016") European Organisation for the Safety of Air Navigation Central Route Charges Office (CRCO) Report on the Operation of the Route Charges System in 2016 March 2017 TABLE OF CONTENTS EUROCONTROL CHARGING
European Organisation for the Safety of Air Navigation Central Route Charges Office (CRCO) Report on the Operation of the Route Charges System in 2016 March 2017 TABLE OF CONTENTS EUROCONTROL CHARGING
EUROCONTROL Short- and Medium-Term Forecast of Service Units: February 2011 Update
 Summary: This document presents the forecast of total service units in Europe 1 for 2011-2015 prepared by EUROCONTROL\STATFOR (Statistics and Service of EUROCONTROL). This forecast aims principally to
CCBE LAWYERS STATISTICS 2016
 Austria 31/12/2015 6.057 1.242 Belgium (OBFG) How many s are 81-2 Bulgaria - 2 Croatia - 5 Czech Republic - 40 Germany - 1 Greece - 3 Hungary - 6 Italy - 1 Liechtenstein - 1 Lithuania - 2 The Netherlands
Legal and Institutional Aspects of ATM in Europe. Roderick D. van Dam Head of Legal Service EUROCONTROL
 Legal and Institutional Aspects of ATM in Europe Roderick D. van Dam Head of Legal Service EUROCONTROL EUROCONTROL: European Organisation for the Safety of Air Navigation Coordination and integration -
EUROCONTROL. Visit of the Transport Attachés. 10 April Frank Brenner. Director General EUROCONTROL
 EUROCONTROL Visit of the Transport Attachés 10 April 2015 Frank Brenner Director General EUROCONTROL One day s traffic EUROCONTROL - Visit of the Transport Attachés - 10 April 2015 2 ATM Today Air Transport
March 2015 compared with February 2015 Volume of retail trade down by 0.8% in euro area Down by 0.6% in EU28
 03-2006 06-2006 09-2006 12-2006 03-2007 06-2007 09-2007 12-2007 03-2008 06-2008 09-2008 12-2008 03-2009 06-2009 09-2009 12-2009 03-2010 06-2010 09-2010 12-2010 03-2011 06-2011 09-2011 12-2011 03-2012 06-2012
International Civil Aviation Organization WORLDWIDE AIR TRANSPORT CONFERENCE (ATCONF) SIXTH MEETING. Montréal, 18 to 22 March 2013
 SIXTH MEETING. Montréal, 18 to 22 March 2013") International Civil Aviation Organization ATConf/6-WP/52 15/2/13 WORKING PAPER WORLDWIDE AIR TRANSPORT CONFERENCE (ATCONF) SIXTH MEETING Montréal, 18 to 22 March 2013 Agenda Item 2: Examination of key
International Civil Aviation Organization ATConf/6-WP/52 15/2/13 WORKING PAPER WORLDWIDE AIR TRANSPORT CONFERENCE (ATCONF) SIXTH MEETING Montréal, 18 to 22 March 2013 Agenda Item 2: Examination of key
JAR-21: CERTIFICATION PROCEDURES FOR AIRCRAFT AND RELATED PRODUCTS AND PARTS. Please find attached a copy of JAR-21 Amendment 7 dated February 2007.
 oint Aviation Authorities Postal Address: P.O. Box 3000 2130 KA Hoofddorp Visiting Address: Saturnusstraat 50 The Netherlands Tel.: 31 (0)23-5679700 Fax: 31 (0)23-5621714 Our reference number: 00106evd
Please find attached a copy of JAR-66 Amendment 2 dated February 2007.
 oint Aviation Authorities Postal Address: P.O. Box 3000 2130 KA Hoofddorp Visiting Address: Saturnusstraat 50 The Netherlands Tel.: 31 (0)23-5679700 Fax: 31 (0)23-5621714 Our reference number: 01106evd
JAR-147: APPROVED MAINTENANCE TRAINING/EXAMINATIONS. Please find attached a copy of JAR-147 Amendment 3 dated February 2007.
 oint Aviation Authorities Postal Address: P.O. Box 3000 2130 KA Hoofddorp Visiting Address: Saturnusstraat 50 The Netherlands Tel.: 31 (0)23-5679700 Fax: 31 (0)23-5621714 Our reference number: 01406evd
TRIPS OF BULGARIAN RESIDENTS IN ABROAD AND ARRIVALS OF VISITORS FROM ABROAD TO BULGARIA IN FEBRUARY 2011
 TRIPS OF BULGARIAN RESIDENTS IN ABROAD AND ARRIVALS OF VISITORS FROM ABROAD TO BULGARIA IN FEBRUARY 2011 In February 2011, the number of the trips of Bulgarian residents in abroad was 246.2 thousand or
TRIPS OF BULGARIAN RESIDENTS ABROAD AND ARRIVALS OF VISITORS FROM ABROAD TO BULGARIA IN NOVEMBER 2018
 TRIPS OF BULGARIAN RESIDENTS ABROAD AND ARRIVALS OF VISITORS FROM ABROAD TO BULGARIA IN NOVEMBER 2018 In November 2018, the number of the trips of Bulgarian residents abroad was 426.3 thousand (Annex,
TRIPS OF BULGARIAN RESIDENTS ABROAD AND ARRIVALS OF VISITORS FROM ABROAD TO BULGARIA IN FEBRUARY 2018
 TRIPS OF BULGARIAN RESIDENTS ABROAD AND ARRIVALS OF VISITORS FROM ABROAD TO BULGARIA IN FEBRUARY 2018 In February 2018, the number of the trips of Bulgarian residents abroad was 379.5 thousand (Annex,
TRIPS OF BULGARIAN RESIDENTS ABROAD AND ARRIVALS OF VISITORS FROM ABROAD TO BULGARIA IN OCTOBER 2017
 TRIPS OF BULGARIAN RESIDENTS ABROAD AND ARRIVALS OF VISITORS FROM ABROAD TO BULGARIA IN OCTOBER 2017 In October 2017, the number of the trips of Bulgarian residents abroad was 439.0 thousand (Annex, Table
TRIPS OF BULGARIAN RESIDENTS ABROAD AND ARRIVALS OF VISITORS FROM ABROAD TO BULGARIA IN NOVEMBER 2017
 TRIPS OF BULGARIAN RESIDENTS ABROAD AND ARRIVALS OF VISITORS FROM ABROAD TO BULGARIA IN NOVEMBER 2017 In November 2017, the number of the trips of Bulgarian residents abroad was 417.6 thousand (Annex,
TRIPS OF BULGARIAN RESIDENTS ABROAD AND ARRIVALS OF VISITORS FROM ABROAD TO BULGARIA IN JANUARY 2018
 TRIPS OF BULGARIAN RESIDENTS ABROAD AND ARRIVALS OF VISITORS FROM ABROAD TO BULGARIA IN JANUARY 2018 In January 2018, the number of the trips of Bulgarian residents abroad was 387.6 thousand (Annex, Table
ELEVENTH AIR NAVIGATION CONFERENCE. Montreal, 22 September to 3 October 2003
 4/8/03 English, French, Russian and Spanish only * ELEVENTH AIR NAVIGATION CONFERENCE Montreal, 22 September to 3 October 2003 Agenda Item 3: 3.1 : Air traffic management (ATM) performance targets for
JAR-145: APPROVED MAINTENANCE ORGANISATIONS. Please find attached a copy of Amendment 6 to JAR-145, effective 1 November 2004.
 oint Aviation Authorities Postal Address: P.O. Box 3000 2130 KA Hoofddorp Visiting Address: Saturnusstraat 8-10 The Netherlands Tel.: 31 (0)23-5679700 Fax: 31 (0)23-5621714 Our reference number: 07/03-11
October 2013 compared with September 2013 Industrial production down by 1.1% in euro area Down by 0.7% in EU28
 10-2004 01-2005 04-2005 07-2005 10-2005 01-2006 04-2006 07-2006 10-2006 01-2007 04-2007 07-2007 10-2007 01-2008 04-2008 07-2008 10-2008 01-2009 04-2009 07-2009 10-2009 01-2010 04-2010 07-2010 10-2010 01-2011
Table I. General questions
 UNECE 1 04/03/2003 Replies to the on visa s Table I. General questions The numbers in brackets correspond to question numbers of the Andorra Armenia Azerbaijan Belarus for drivers is In general, no visas
An overview of Tallinn tourism trends
 An overview of Tallinn tourism trends August 2015 The data is collected from Statistics Estonia, Tallinn Airport and Port of Tallinn. In August 2015, 179,338 stayed overnight in Tallinn s accommodation
JAR-23: NORMAL, UTILITY, AEROBATIC, AND COMMUTER CATEGORY AEROPLANES. Please find attached a copy of JAR-23 Amendment 3 dated February 2007.
 oint Aviation Authorities Postal Address: P.O. Box 3000 2130 KA Hoofddorp Visiting Address: Saturnusstraat 50 The Netherlands Tel.: 31 (0)23-5679700 Fax: 31 (0)23-5621714 Our reference number: 00306evd
Conditions of Application of the Route Charges System and Conditions of Payment
 European Organisation for the safety of air navigation Central route charges office Conditions of Application of the Route Charges System and Conditions of Payment December 2018 (EN) EUROPEAN ORGANISATION
Introduction. European Airspace Concept Workshops for PBN Implementation
 Introduction European Airspace Concept Workshops for PBN Implementation OBJECTIVES The objective of this workshop is to provide an overview of the development of a PBN Airspace Concept, To introduce the
Please find attached a copy of JAR-25 Amendment 20 dated December 2007.
 oint Aviation Authorities Postal Address: P.O. Box 3000 2130 KA Hoofddorp Visiting Address: Saturnusstraat 40-44 The Netherlands Tel.: 31 (0)23-5679790 Fax: 31 (0)23 5657731 www.jaa.nl January 2008 JAR-25
EUROCONTROL Low-Cost Carrier Market Update
 EUROCONTROL Low-Cost Carrier Market Update June 2007 EUROCONTROL/STATFOR/Doc257 v1.0 12/09/07 EUROCONTROL Low-Cost Carrier Market Update June 2007 Summary: The market share of low-cost carriers in Europe
SES Performance Scheme
 SES Performance Scheme 12 th Florence Rail Forum 2 May 2016 Rolf TUCHHARDT European Commission, DG MOVE The Single European Sky policy initiative to improve the overall performance of air traffic management
European Performance Scheme
 European Performance Scheme Global Challenges to Improve Air Navigation Performance Asilomar Conference Grounds, Pacific Grove, CA 12 February 2015 Rolf TUCHHARDT European Commission, DG MOVE The SES policy
assists in the development of airport capacity to meet growing demand supports the development of improved ground access to airports
 ATAG The Air Transport Action Group (ATAG) is a coalition of organisations from throughout the air transport industry, formed to press for economically beneficial aviation capacity improvements in an environmentally
Network Management, building on our experience of flow management and network planning.
 Network Management, building on our experience of flow management and network planning. Giovanni Lenti Head of Network Operation Services The European Organisation for the Safety of Air Navigation Air
Filoxenia Conference Centre Level 0
 Filoxenia Conference Centre Level 0 Stair 3/Lift 2 First Aid Board of Governors Secretariat Stair 3 Stair 4 Stair 4 (to level 1 only at Level -1) Lift 2 CSO Team Office Zenon Kitievs A Zenon Kitievs B
% change vs. Dec ALL VISITS (000) 2,410 12% 7,550 5% 31,148 1% Spend ( million) 1,490 15% 4,370-1% 18,710 4%
 2,410 12% 7,550 5% 31,148 1% Spend ( million) 1,490 15% 4,370-1% 18,710 4%") HEADLINES FULL YEAR 2012 (PROVISIONAL) 1 Overall visits 31.148 million visits making 2012 the best year for inbound tourism since 2008 but not a record. 1% increase in visits on 2011 (30.798 visits) slightly
HEADLINES FULL YEAR 2012 (PROVISIONAL) 1 Overall visits 31.148 million visits making 2012 the best year for inbound tourism since 2008 but not a record. 1% increase in visits on 2011 (30.798 visits) slightly
TRAFFIC DEVELOPMENT POLICY 2018
 TRAFFIC DEVELOPMENT POLICY 2018 GUIDELINES Target The Traffic Development Policy aims at ATTRACTING INCREMENTAL TRAFFIC to our airport. The incentive system hereafter exposed is conceived to be a guideline
Common Market Organisation (CMO) Fruit and vegetables sector Evolution of EU prices of some F&V products
 Fruit and vegetables sector Evolution of EU prices of some F&V products") Common Market Organisation (CMO) Fruit and vegetables sector Evolution of EU prices of some F&V products Unit C.2. - Wine, spirits, horticultural products, specialised crops DG Agriculture and Rural Development
Common Market Organisation (CMO) Fruit and vegetables sector Evolution of EU prices of some F&V products Unit C.2. - Wine, spirits, horticultural products, specialised crops DG Agriculture and Rural Development
Cumulative Investments by Sector. Cumulative Investment by Country. Industry, Commerce & Agribusiness 18% Transport 30% Natural Resources 2%
 Cumulative Investments by Sector Cumulative Investment by Country Industry, Commerce & Agribusiness 18% Transport 30% Natural Resources 2% SERBIA 45% KOSOVO 2% MONTENEGRO 6% Financial Institutions 30%
The economic impact of ATC strikes in Europe Key findings from our updated report for A4E
 pwc.com The economic impact of ATC strikes in Europe Key findings from our updated report for A4E Prepared for A4E Updates to our analysis since June 2016 Since releasing our Preliminary Findings in June
BUSINESS AVIATION TRAFFIC TRACKER EUROPE. April 2017
 BUSINESS AVIATION TRAFFIC TRACKER EUROPE April 2017 DEPARTURES, ARRIVALS, INTERNALS AND OVERFLIGHTS (DAIO) REPORT TOTAL FLIGHTS Business Aviation (Single European Sky Area) Month Previous Arrival Departure
BUSINESS AVIATION TRAFFIC TRACKER EUROPE. January 2018
 BUSINESS AVIATION TRAFFIC TRACKER EUROPE January 2018 EXECUTIVE SUMMARY January starts a 2018 with the continuation of traffic growth AMAC Insurance Subcommittee Meeting Milano, 1 st of February January
EUROCONTROL. Central Route Charge Office Customer Guide to Charges
 EUROCONTROL Central Route Charge Office Customer Guide to Charges February 2019 Table of content THE MISSION OF EUROCONTROL S CENTRAL ROUTE CHARGES OFFICE (CRCO)... 3 FRAUD WARNING!... 4 HOW TO JOIN AND
COMMUNICATION FROM THE COMMISSION TO THE COUNCIL
 EUROPEAN COMMISSION Brussels, 14.10.2016 COM(2016) 652 final COMMUNICATION FROM THE COMMISSION TO THE COUNCIL European Development Fund (EDF): forecasts of commitments, payments and contributions from
BUSINESS AVIATION TRAFFIC TRACKER EUROPE. September 2018
 BUSINESS AVIATION TRAFFIC TRACKER EUROPE September 2018 EXECUTIVE SUMMARY September 2018 Back to Business With 66.133 flights, September 2018 marks a slight slow down (-0,7%) compared with September 2017
SLOVAKIA. Table 1. FDI flows in the host economy, by geographical origin. (Millions of US dollars)
") Table 1. FDI flows in the host economy, by geographical origin World 1 271 4 095 1 060 1 058 714 4 693 3 267 4 692-6 1 769 3 491 2 825 Developed economies 1 204 4 050 1 036 1 113 485 4 265 1 001 5 084-881
Table 1. FDI flows in the host economy, by geographical origin World 1 271 4 095 1 060 1 058 714 4 693 3 267 4 692-6 1 769 3 491 2 825 Developed economies 1 204 4 050 1 036 1 113 485 4 265 1 001 5 084-881
BUSINESS AVIATION TRAFFIC TRACKER EUROPE. May 2018
 BUSINESS AVIATION TRAFFIC TRACKER EUROPE May 2018 EXECUTIVE SUMMARY May 2018 traffic figures stable With in average 320 additional daily flights compared with April 2018, May 2018 marks the traditional
BUSINESS AVIATION TRAFFIC TRACKER EUROPE. June 2018
 BUSINESS AVIATION TRAFFIC TRACKER EUROPE June 2018 EXECUTIVE SUMMARY June 2018 traffic figures stable With in average 280 additional daily flights compared with May 2018, June 2018 marks the traditional
O 2 Call Options Explained
 March 2013 www.nimans.net/networkservices Tel: 01937 847 500 O 2 Call Options Explained International & Roaming UK To Abroad (UK based calls) International Favourites DISE Only The International Favourites
INFORMATION CIRCULAR TERMINAL CHARGES IN IRELAND
 INFORMATION CIRCULAR Effective from 1 January 2018 (Ref. EI 2018/01) TERMINAL CHARGES IN IRELAND 1. The EUROCONTROL Organisation is entrusted with the billing and collection of terminal charges on behalf
Rules for reimbursement of expenses for delegates attending meetings
 16 March 2017 EMA/MB/144136/2017 Management Board meeting of 16 March 2017 Rules for reimbursement of expenses for delegates attending meetings With effect from 01 April 2017 THE MANAGEMENT BOARD HAVING
Tourist flow in Italy Year 2017
 27 November 2018 Tourist flow in Italy Year 2017 The National Institute of Statistics releases data on tourist flows and their features in 2017 from a supply 1 and demand-side 2 perspective. In 2017, around
ROMANIA. Table 1. FDI flows in the host economy, by geographical origin. (Millions of US dollars)
") Table 1. FDI flows in the host economy, by geographical origin World.... 2 196 6 435 6 485 11 333 9 928 13 910 4 843 2 939 2 522 2 746 Developed economies.... 1 521 5 361 6 309 11 445 9 136 13 422 4 812
Table 1. FDI flows in the host economy, by geographical origin World.... 2 196 6 435 6 485 11 333 9 928 13 910 4 843 2 939 2 522 2 746 Developed economies.... 1 521 5 361 6 309 11 445 9 136 13 422 4 812
INFORMATION CIRCULAR TERMINAL CHARGES IN MALTA
 INFORMATION CIRCULAR Effective 1 January 2015 (Ref. LM 2015/01) TERMINAL CHARGES IN MALTA 1. The EUROCONTROL Organisation is entrusted with the collection of terminal charges on behalf of the Civil Aviation
CROATIA. Table 1. FDI flows in the host economy, by geographical origin. (Millions of US dollars)
") Table 1. FDI flows in the host economy, by geographical origin World 1 307 1 153 2 107 1 210 1 844 3 228 4 928 5 941 3 566 515 1 511 1 370 Developed economies 1 207 1 113 1 719 1 190 1 885 3 093 4 775
Table 1. FDI flows in the host economy, by geographical origin World 1 307 1 153 2 107 1 210 1 844 3 228 4 928 5 941 3 566 515 1 511 1 370 Developed economies 1 207 1 113 1 719 1 190 1 885 3 093 4 775
European General Aviation Conference Schonhagen Airport. Martin Robinson CEO AOPA UK Deputy Vice President IAOPA Europe Berlin 15 th May 2006
 European General Aviation Conference Schonhagen Airport Martin Robinson CEO AOPA UK Deputy Vice President IAOPA Europe Berlin 15 th May 2006 Content What is General Aviation & Aerial Work Operations? Who
GODINA XI SARAJEVO, BROJ 2 TOURISM STATISTICS. Tourism in BIH, February 2017
 number of nights GODINA XI SARAJEVO, 06.04.2017. BROJ 2 TOURISM STATISTICS Tourism in BIH, February 2017 In February 2017 tourists realised 56,042 tourist arrivals in Bosnia and Hercegovina which represent
Tourist flow in Italy Year 2016
 27 October 2017 Tourist flow in Italy Year 2016 The National Institute of Statistics releases data on tourist flows and their features in 2016 from the point view of supply 1 and demand 2 side. In 2016,
International Operations: NATA 2012 Air Charter Summit
 International Operations: NATA 2012 Air Charter Summit Larry Williams Senior Trip Owner Charter Management Blue Team Universal Weather and Aviation, Inc. Agenda Session Objective Discuss current hot topics
PRICE GUIDE OAYLLYS-PRIOS
 PRICE GUIDE OAYLLYS-PRIOS Effective from 3rd April 2018 iompost.com Sending Mail to the Isle of Man, UK and Channel Islands Letters, Large Letters & Packets We aim to deliver local items within 1 working
TWELFTH AIR NAVIGATION CONFERENCE
 International Civil Aviation Organization AN-Conf/12-WP/42 9/10/12 WORKING PAPER TWELFTH AIR NAVIGATION CONFERENCE Montréal, 19 to 30 November 2012 Agenda Item 2: Aerodrome operations improving airport
FINLAND. Table 1. FDI flows in the host economy, by geographical origin. (Millions of US dollars)
") Table 1. FDI flows in the host economy, by geographical origin World 3 732 8 046 3 319 2 823 4 750 7 652 12 451-1 144 718 7 359 2 550 4 158 Developed economies 3 638 8 003 2 382 2 863 4 934 7 258 12 450-855
Table 1. FDI flows in the host economy, by geographical origin World 3 732 8 046 3 319 2 823 4 750 7 652 12 451-1 144 718 7 359 2 550 4 158 Developed economies 3 638 8 003 2 382 2 863 4 934 7 258 12 450-855
PRESS RELEASE. ARRIVALS OF NON-RESIDENTS IN GREECE: January - June 2016 HELLENIC REPUBLIC HELLENIC STATISTICAL AUTHORITY. Piraeus, 13 October 2016
 HELLENIC REPUBLIC HELLENIC STATISTICAL AUTHORITY Piraeus, 13 October 2016 PRESS RELEASE ARRIVALS OF NON-RESIDENTS IN GREECE: January - June 2016 According to the Frontier Statistical Survey conducted by
Summer Work Travel Season Program Dates by Country
 The program dates are windows of opportunity for program participation. Within this timeframe, students are still subject to their university's official academic break schedule. Even though the window
Valid effective from 01 August 2018 Amendments: Add additional cities permitted for Russia in Europe (RU) and excluded for Russia in Asia (XU)
 and excluded for Russia in Asia (XU)") Valid effective from 01 August 2018 Amendments: Add additional cities permitted for Russia in Europe (RU) and excluded for Russia in Asia (XU) OW VISIT EUROPE 1. Application/Fares and Expenses A. Application
Valid effective from 01 August 2018 Amendments: Add additional cities permitted for Russia in Europe (RU) and excluded for Russia in Asia (XU) OW VISIT EUROPE 1. Application/Fares and Expenses A. Application
Россия/Russia + Important roads of Europe 2013 FX
 1 Road coverage CD-ROM 1 CD-ROM 2 ~100 % detailed street Important road of Europe Important road 2 Sales arguments CD-ROM 1 provides updated navigation data with a coverage of ~100 % of important roads
INFORMATION CIRCULAR TERMINAL CHARGES IN HUNGARY
 INFORMATION CIRCULAR Effective 1 January 2018 (Ref. LH 2018/01) TERMINAL CHARGES IN HUNGARY 1. The EUROCONTROL Organisation is entrusted with the billing and collection of terminal charges on behalf of
INFORMATION CIRCULAR SHANWICK COMMUNICATIONS CHARGES COLLECTED BY EUROCONTROL ON BEHALF OF THE IRISH AVIATION AUTHORITY
 INFORMATION CIRCULAR Effective 1 January 2015 (Ref. CEI 2015/01) SHANWICK COMMUNICATIONS CHARGES COLLECTED BY EUROCONTROL ON BEHALF OF THE IRISH AVIATION AUTHORITY 1. The EUROCONTROL Organisation is entrusted
irport atchment rea atabase
 irport atchment rea atabase Examples 539 Airports Four range sizes 50, 75, 100 and 150 km. Time series 00-015 30+ variables About ACAD The database contains catchment area information for 539 European
INFORMATION CIRCULAR TERMINAL CHARGES IN GREECE
 INFORMATION CIRCULAR Effective 1 January 2018 (Ref. LG 2018/01) TERMINAL CHARGES IN GREECE 1. The EUROCONTROL Organisation is entrusted with the billing and collection of terminal charges on behalf of
INFORMATION CIRCULAR ROUTE CHARGES IN MOROCCO
 INFORMATION CIRCULAR Effective 1 January 2018 (Ref. GM 2018/01) ROUTE CHARGES IN MOROCCO 1. The EUROCONTROL Organisation is entrusted with the billing and collection of route charges on behalf of the Office
7 th SESSION OF THE MEETING OF THE PARTIES December 2018, Durban, South Africa
 AGREEMENT ON THE CONSERVATION OF AFRICAN-EURASIAN MIGRATORY WATERBIRDS 7 th SESSION OF THE MEETING OF THE PARTIES 04-08 December 2018, Durban, South Africa Beyond 2020: Shaping flyway conservation for
IMD World Talent Report Factor 1 : Investment and Development
 THAILAND 2012 2013 2014 2015 2016 Overall Investment & Development Appeal Rank 2016 37 42 24 Readiness 49 of 61 Factor 1 : Investment and Development Total Public Expenditure on Education Percentage of
Survey on arrivals and overnight stays of tourists, total 2017
 MONTENEGRO STATISTICAL OFFICE R E L E A S E No: 34/2 Podgorica, 1 June 2018 When using the data please name the source Survey on arrivals and overnight stays of tourists, total In Montenegro, in, tourist
ICAO NAT Region updates
 ICAO NAT Region updates 70 N 80 N 80N 70N 60 N 60 N REYKJAVIK 50 N 50 N ICAO EUR/NAT SHANWICK GANDER 40 N 40 N ICAO EUR/NAT NAT traffic figures Outline NAT service development roadmap (MNPS to HLA/PBN,Reduced
INFORMATION CIRCULAR AIR NAVIGATION CHARGES IN BELARUS
 INFORMATION CIRCULAR Effective 1 January 2018 (Ref. UM 2018/01) AIR NAVIGATION CHARGES IN BELARUS 1. The EUROCONTROL Organisation is entrusted with the billing and collection of air navigation charges
EUROCONTROL Medium-Term Forecast Update
 EUROCONTROL Medium-Term Forecast Update Flight Movements 2009 2015 EXECUTIVE SUMMARY This report presents an update of the EUROCONTROL Medium-Term Forecast of flights published in February 2009 (MTF09).
Summer Work Travel Season Program Dates by Country
 Albania 1-Jul 30-Sep 3 Months Argentina 1-Dec 1-Apr 4 Months Armenia 1-Jun 31-Aug 3 Months Australia 15-Nov 8-Mar 3.5 Months Visa Waiver Country Austria 1-Jul 30-Sep 3 Months Visa Waiver Country Azerbaijan
1214th PLENARY MEETING OF THE COUNCIL
 Permanent Council Original: ENGLISH Chairmanship: Slovakia 1214th PLENARY MEETING OF THE COUNCIL 1. Date: Thursday, 31 January 2019 Opened: Suspended: Resumed: Closed: 10.05 a.m. 1.10 p.m. 3.10 p.m. 4.00
INFORMATION CIRCULAR TERMINAL CHARGES IN THE FORMER YUGOSLAV REPUBLIC OF MACEDONIA
 INFORMATION CIRCULAR Effective 1 January 2019 (Ref. LW 2019/01) TERMINAL CHARGES IN THE FORMER YUGOSLAV REPUBLIC OF MACEDONIA 1. The EUROCONTROL Organisation is entrusted with the billing and collection
Global Travel Trends 2005
 Preliminary World Travel Monitor Results from IPK international for the ITB Berlin Message, 03/10/06 Global Travel Trends 2005 Based on the new data from the 2005 World Travel Monitor, and as it does every
INTERNATIONAL REGISTRY IN ORGAN DONATION and TRANSPLANTATION
 INTERNATIONAL REGISTRY IN ORGAN DONATION and TRANSPLANTATION www.irodat.org Final Numbers 2016 December 2017 Dear colleagues On behalf of all IRODaT staff, we are glad to present the 2016 final numbers
The Nordic Countries in an International Comparison. Helga Kristjánsdóttir 20. apríl 2012
 The Nordic Countries in an International Comparison Helga Kristjánsdóttir 20. apríl 2012 15 Figure 1. World Bank, GDP growth (annual %) 10 5 0 1961 1963 1965 1967 1969 1971 1973 1975 1977 1979 1981 1983
Tourist arrivals and overnight stays in collective accommodation 1 July 2017 (p)
") Jul-16 Aug-16 Sep-16 Oct-16 Nov-16 Dec-16 Jan-17 Feb-17 Mar-17 Apr-17 May-17 Jun-17 Jul-17 MONTENEGRO STATISTICAL OFFICE R E L E A S E No: 158 Podgorica, 31 August 2017 When using the data please name
Jul-16 Aug-16 Sep-16 Oct-16 Nov-16 Dec-16 Jan-17 Feb-17 Mar-17 Apr-17 May-17 Jun-17 Jul-17 MONTENEGRO STATISTICAL OFFICE R E L E A S E No: 158 Podgorica, 31 August 2017 When using the data please name
The explanations of other terms used throughout the tables are contained in the section on Definitions immediately following the tables.
 FOREWORD 1 CONTENT 1.1 UK Airports - Annual Statements of Movements, Passengers and Cargo is prepared by the Civil Aviation Authority with the co-operation of the United Kingdom airport operators. The
7 th SESSION OF THE MEETING OF THE PARTIES December 2018, Durban, South Africa
 AGREEMENT ON THE CONSERVATION OF AFRICAN-EURASIAN MIGRATORY WATERBIRDS 7 th SESSION OF THE MEETING OF THE PARTIES 04-08 December 2018, Durban, South Africa Beyond 2020: Shaping flyway conservation for
Sole parents: participation and equality
 Sole parents: participation and equality Workshop on Gender Equality in Australia s Tax and Transfer System, 4-5 November 2015 Peter Whiteford, Crawford School of Public Policy peter.whiteford@anu.edu.au
5.3. Cannabis: Wholesale and Street Prices and Purity Levels
 5. Prices: Cannabis 5.3. Cannabis: Wholesale and Street Prices and Purity Levels HERBAL CANNABIS Africa East Africa Ghana 51.0 39.2-62.7 1999 Kenya 0.2 0.1-0.3-2002 119.8-1996 Madagascar 1.3 1.1-1.4 100.0
Independence Time Line
 Independence Time Line Place all highlighted dates on the time line. Identify each date with the country name and corresponding facts. Highlight the country name on the time line. Albania 28 November 1912
Call Type PAYU1 PAYU2 PAYU3 Out Of Bundle
 Jan-18 Mobile Tariff Information Headline Rates Call Type PAYU1 PAYU2 PAYU3 Out Of Bundle Calls to Own Mobiles 1p 1p 1p 1p Calls to Own Landlines 1p 1p 1p 1p Calls to UK Landlines (Starting 01, 02, 03)
ARMATS ARMENIAN AIR TRAFFIC SERVICES AERONAUTICAL INFORMATION SERVICES REPUBLIC OF ARMENIA GENERAL DEPARTMENT OF CIVIL AVIATION
 Tel: (37410) 292929/308 AFTN: UDDDYOYX E-mail: publication@armats.am ARMATS ARMENIAN AIR TRAFFIC SERVICES AERONAUTICAL INFORMATION SERVICES AIC A 02/18 07 DEC 17 REPUBLIC OF ARMENIA GENERAL DEPARTMENT
INFORMATION CIRCULAR TERMINAL CHARGES IN MOLDOVA
 INFORMATION CIRCULAR Effective 1 January 2018 (Ref. LU 2018/01) TERMINAL CHARGES IN MOLDOVA 1. The EUROCONTROL Organisation is entrusted with the billing and collection of terminal charges on behalf of
South East Norway (GeoCenter Euro Map) READ ONLINE
 READ ONLINE") South East Norway (GeoCenter Euro Map) READ ONLINE Map of Norway MapQuest - Our interactive map of Norway lets you view satellite images, When printing directly from the browser your directions or map
South East Norway (GeoCenter Euro Map) READ ONLINE Map of Norway MapQuest - Our interactive map of Norway lets you view satellite images, When printing directly from the browser your directions or map
TAIEX. Institution Building support for Agriculture and Rural Development by Twinning and TAIEX. Institution Building Unit DG Enlargement
 TAIEX Institution Building support for Agriculture and Rural Development by Twinning and TAIEX Institution Building Unit DG Enlargement Our Mission Statement Support beneficiary countries in understanding,
ARMATS ARMENIAN AIR TRAFFIC SERVICES AERONAUTICAL INFORMATION SERVICES REPUBLIC OF ARMENIA GENERAL DEPARTMENT OF CIVIL AVIATION
 Tel: (37410) 593045 Fax: (37410) 284916 AFTN: UDDDYOYX E-mail: publication@armats.com ARMATS ARMENIAN AIR TRAFFIC SERVICES AERONAUTICAL INFORMATION SERVICES AIC A 01/16 10 DEC 15 REPUBLIC OF ARMENIA GENERAL
Summer Work Travel Season Program Dates by Country
 The program dates are windows of opportunity for program participation. Within this timeframe, students are still subject to their university's official academic break schedule. Even though the window
Next Release: 13 April Next Release: 13 April December
 43070 Next Release: 13 April 2018 Next Release: 13 April 2018 December Date of publication: 15 March 2018 TABLE OF CONTENTS Charts 1 Gross consumption of natural gas by OECD region 3 2 Indigenous production
EU-Russia summit Strong recovery of trade in goods between EU27 and Russia in 2011 An EU27 deficit of 91 bn euro with Russia in 2011
 STAT/2/82 June 202 EU-Russia summit Strong recovery of trade in goods between EU27 and Russia in 20 An EU27 deficit of 9 bn euro with Russia in 20 Following a sharp fall in 2009, EU27 trade in goods with
INFORMATION CIRCULAR TERMINAL CHARGES IN DENMARK
 INFORMATION CIRCULAR Effective 1 January 2018 (Ref. EK 2018/01) TERMINAL CHARGES IN DENMARK 1. The EUROCONTROL Organisation is entrusted with the billing and collection of terminal charges on behalf of
KLAIPEDA GATEWAY TO THE EUROPEAN MARKET
 KLAIPEDA GATEWAY TO THE EUROPEAN MARKET KLAIPEDA VAIDAS VELYKIS BUSINES S D E V E LO P M E N T M A N A G E R EXCELLENT COMBINATION FAST DISTRIBUTION LOW COSTS HIGH QUALITY WHERE ONE BELT MEETS ONE ROAD
External Quality of Service Monitoring
 External Quality of Service Monitoring Improving the Quality of International Mail 2012 Results UNEX International letter performance continues to exceed objectives In 2012 European priority letter mail
MAIS3+ assessment: Current practices around Europe
 MAIS3+ assessment: Current practices around Europe Klaus Machata SafetyCube workshop, The Hague, 24 May 2016 Co-funded by the Horizon 2020 Framework Programme of the European Union 5/31/2016 Data collection
Central Route Charges Office. Customer Guide to Charges. January Version 7.0 EUROCONTROL
 Central Route Charges Office Customer Guide to Charges January 2013 - Version 7.0 EUROCONTROL The Mission of EUROCONTROL s Central Route Charges Office (CRCO) The Central Route Charges Office (CRCO) runs
PRESS RELEASE No. 24 of February 3, 2014 Tourism December and the Year 2013
 ROMANIA Press Office 16, Libertăţii Avenue, Sector 5, Bucharest Tel/Fax: 318 18 69; Fax 312 48 75 e-mail: romstat@insse.ro; biroupresa@insse.ro PRESS RELEASE No. 24 of February 3, 2014 Tourism and the