Operational Performance Reporting Manchester Airport March 2018
|
|
|
- Gervais Flowers
- 5 years ago
- Views:
Transcription

 82.")
1 Operational Performance Reporting Manchester Airport March 2018 Departure Punctuality - Mar-18 Last Month Last Year % Change Target Var to Target First Wave 79.8% 88.1% -8.3% 85.0% -5.2% Not First Wave 69.8% 81.8% -12.0% 85.0% -15.2% Grand Total 72.0% 83.3% -11.3% 85.0% -13.0% Departure Punctuality - Last 12 Months This Year Prev Year % Change Target Var to Target First Wave 81.9% 84.6% (2.7%) 82.0% -0.1% Not First Wave 69.6% 75.1% (5.5%) 82.0% -12.4% Grand Total 72.2% 77.3% (5.1%) 82.0% -9.8%
2 ATMs and Passenger Volumes Last Year Passengers MTD Change Last Year % Movements Movements Change Last Year % Passengers Passengers YTD Change Last Year % Movements Movements Flight Passengers Arriving 493, % % 6,692, % % 1 Departing 521, % % 6,687, % % 1 Total Change % 1,015, % % 13,380, % % Arriving 154, % % 2,984, % % 2 Departing 170, % % 2,983, % % 2 Total 324, % % 5,968, % % Arriving 312, % % 4,252, % % 3 Departing 334, % % 4,256, % % 3 Total 646, % % 8,509, % % Grand Total 1,986, % % 27,858, % %

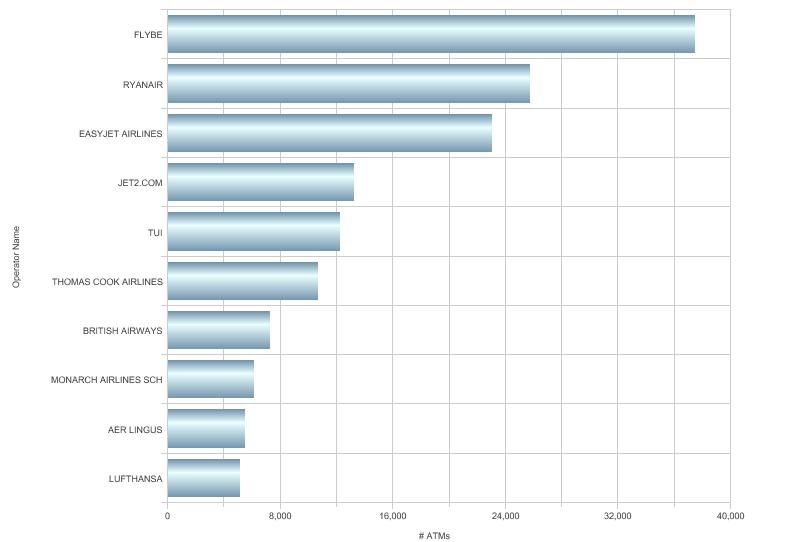
3 Monthly Airline Movements Top 10 Operator Name Operator IATA Code # ATMs % of ATMs # % Flights with no Delay FLYBE BE % % RYANAIR FR % % EASYJET EZY % % JET2.COM LS % % TUI TOM % % BRITISH AIRWAYS BA % % THOMAS COOK MT % % LUFTHANSA LH % % AER LINGUS EI % % SAS SCANDINAVIAN SK % 94 72% Grand Total % % Yearly Airline Movements Top 10 Operator Name Operator IATA Code # ATMs % of Total ATMs # % Flights with no Delay FLYBE BE % % RYANAIR FR % % EASYJET EZY % % JET2.COM LS % % TUI TOM % % THOMAS COOK MT % % BRITISH AIRWAYS BA % % MONARCH SCH ZB % % AER LINGUS EI % % LUFTHANSA LH % % Grand Total % %
4
5 Departure Punctuality by T1 Punctuality T2 Puntuality T3 Puntuality 68.16% 71.54% 75.87% First Wave Departure Punctuality Operator Name Operator IATA Code # Movements % of Movements Punctuality % LUFTHANSA LH % 92.73% RYANAIR FR % 85.65% FLYBE BE % 85.24% JET2.COM LS % 81.63% EASYJET EZY % 78.74% THOMAS COOK MT % 77.91% BRITISH AIRWAYS BA % 75.00% TUI TOM % 72.49% K.L.M. KL % 70.97% BRUSSELS SN % 65.38% Grand Total % 80.10%
6 Monthly Airline Performance by Departure Punctuality Departing Punctuality Ranking Operator Arriving IATA Code Movements Movements Punctuality Departing Punctuality Punctuality Change (Dep- Arr) Inbound Baggage Operator Name 1 GERMANIA ST % 67% 100% 33% 83% 2 CATHAY PACIFIC CX % 62% 93% 31% 90% 3 SAUDIA ARABIAN SV % 45% 91% 45% 64% 4 QATAR AIRWAYS QR % 94% 90% (4%) 92% 5 LOGANAIR LM % 93% 88% (6%) 85% 6 ROYAL AIR MAROC AT % 100% 87% (13%) 94% 7 FINNAIR AY % 85% 84% (2%) 87% 8 VIRGIN ATLANTIC AIRWAYS VS % 65% 83% 17% 84% 9 AUSTRIAN OS % 89% 81% (7%) 85% 10 ICELANDAIR FI % 87% 81% (6%) 52% 11 EASYJET SWITZERLAND EZS % 100% 80% (20%) 60% 12 FLYBE BE 2, % 81% 79% (2%) 85% 13 HAINAN HU % 79% 79% 0% 79% 14 AIR TRANSAT TS % 22% 78% 56% 44% 15 BRITISH AIRWAYS BA % 80% 77% (3%) 77% 16 AURIGNY AIR SERVICES GR % 88% 76% (12%) 95% 17 JET2.COM LS % 73% 76% 3% 91% 18 SWISS INTERNATIONAL LX % 90% 76% (14%) 90% AIR LINES 19 AIR FRANCE AF % 77% 74% (2%) 95% 20 LUFTHANSA LH % 70% 73% 3% 95% 21 K.L.M. KL % 85% 73% (12%) 94% 22 SINGAPORE SQ % 82% 73% (9%) 95% 23 VUELING VY % 84% 72% (12%) 96% 24 SAS SCANDINAVIAN SK % 72% 71% (1%) 98% 25 COBALT AIR CO % 90% 70% (20%) 80% 25 IBERIA EXPRESS I % 90% 70% (20%) 80% 25 UNITED UA % 48% 70% 22% 74% 28 ETIHAD AIRWAYS EY % 90% 70% (21%) 79% 29 RYANAIR FR 1, % 76% 70% (7%) 97% 30 THOMAS COOK MT % 63% 69% 6% 87% 31 EASYJET EZY 1, % 68% 69% 1% 80% 32 AER LINGUS EI % 81% 67% (15%) 83% 33 AEGEAN A % 100% 67% (33%) 67% 33 AIR ARABIA 3O % 67% 67% 0% 100% 33 AMERICAN AA % 52% 67% 15% 93% 36 BRUSSELS SN % 66% 66% 0% 94% 37 TUI TOM % 65% 66% 1% 80% 38 P.I.A. PK % 60% 63% 3% 35% 39 EUROWINGS EW % 64% 57% (7%) 93% 40 NORWEGIAN AIR SHUTTLE DY % 74% 55% (19%) 97% 40 OMAN AIR WY % 32% 55% 23% 97% 42 EMIRATES EK % 64% 46% (18%) 66% 43 AIR PORTUGAL TP % 62% 44% (17%) 63% 44 IRAQI AIRWAYS IA % 60% 40% (20%) 100% 45 TURKISH TK % 69% 23% (46%) 31% 46 FREEBIRD FHY % 0% 20% 20% 80% 47 TITAN AIRWAYS ZT % 40% 0% (40%) 20% Grand Total 14, % 75% 72% (3%) 86%
7 Monthly Airline Performance by Punctuality Change (difference between Arrival OTP and Departure OTP) Punctuality Change Operator Arriving Departing Punctuality Change (Dep- Inbound Ranking Operator Name IATA Code Movements Movements Punctuality Punctuality Arr) Baggage 1 AIR TRANSAT TS % 22% 78% 56% 44% 2 SAUDIA ARABIAN SV % 45% 91% 45% 64% 3 GERMANIA ST % 67% 100% 33% 83% 4 CATHAY PACIFIC CX % 62% 93% 31% 90% 5 OMAN AIR WY % 32% 55% 23% 97% 6 UNITED UA % 48% 70% 22% 74% 7 FREEBIRD FHY % 0% 20% 20% 80% 8 VIRGIN ATLANTIC AIRWAYS VS % 65% 83% 17% 84% 9 AMERICAN AA % 52% 67% 15% 93% 10 THOMAS COOK MT % 63% 69% 6% 87% 11 LUFTHANSA LH % 70% 73% 3% 95% 12 JET2.COM LS % 73% 76% 3% 91% 13 P.I.A. PK % 60% 63% 3% 35% 14 TUI TOM % 65% 66% 1% 80% 15 EASYJET EZY 1, % 68% 69% 1% 80% 16 BRUSSELS SN % 66% 66% 0% 94% 17 HAINAN HU % 79% 79% 0% 79% 17 AIR ARABIA 3O % 67% 67% 0% 100% 19 SAS SCANDINAVIAN SK % 72% 71% (1%) 98% 20 FINNAIR AY % 85% 84% (2%) 87% 21 FLYBE BE 2, % 81% 79% (2%) 85% 22 AIR FRANCE AF % 77% 74% (2%) 95% 23 BRITISH AIRWAYS BA % 80% 77% (3%) 77% 24 QATAR AIRWAYS QR % 94% 90% (4%) 92% 25 LOGANAIR LM % 93% 88% (6%) 85% 26 ICELANDAIR FI % 87% 81% (6%) 52% 27 RYANAIR FR 1, % 76% 70% (7%) 97% 28 EUROWINGS EW % 64% 57% (7%) 93% 29 AUSTRIAN OS % 89% 81% (7%) 85% 30 SINGAPORE SQ % 82% 73% (9%) 95% 31 K.L.M. KL % 85% 73% (12%) 94% 32 AURIGNY AIR SERVICES GR % 88% 76% (12%) 95% 33 VUELING VY % 84% 72% (12%) 96% 34 ROYAL AIR MAROC AT % 100% 87% (13%) 94% 35 SWISS INTERNATIONAL LX % 90% 76% (14%) 90% AIR LINES 36 AER LINGUS EI % 81% 67% (15%) 83% 37 AIR PORTUGAL TP % 62% 44% (17%) 63% 38 EMIRATES EK % 64% 46% (18%) 66% 39 NORWEGIAN AIR SHUTTLE DY % 74% 55% (19%) 97% 40 EASYJET SWITZERLAND EZS % 100% 80% (20%) 60% 40 COBALT AIR CO % 90% 70% (20%) 80% 40 IBERIA EXPRESS I % 90% 70% (20%) 80% 40 IRAQI AIRWAYS IA % 60% 40% (20%) 100% 44 ETIHAD AIRWAYS EY % 90% 70% (21%) 79% 45 AEGEAN A % 100% 67% (33%) 67% 46 TITAN AIRWAYS ZT % 40% 0% (40%) 20% 47 TURKISH TK % 69% 23% (46%) 31% Grand Total 14, % 75% 72% (3%) 86%
8 Monthly Delay Analysis by Airline Operator Name Total Delay Incidents Air Traffic Airline Airport Ground Servicing Misc Reactionary Weather RYANAIR EASYJET FLYBE JET2.COM TUI THOMAS COOK BRITISH AIRWAYS LUFTHANSA AER LINGUS EUROWINGS TURKISH EMIRATES AIR PORTUGAL SAS SCANDINAVIAN BRUSSELS K.L.M ETIHAD AIRWAYS SWISS INTERNATIONAL AIR LINES FINNAIR AURIGNY AIR SERVICES AIR FRANCE OMAN AIR SINGAPORE VIRGIN ATLANTIC AIRWAYS LOGANAIR P.I.A QATAR AIRWAYS NORWEGIAN AIR SHUTTLE AMERICAN VUELING UNITED AEGEAN HAINAN ICELANDAIR AUSTRIAN FREEBIRD TITAN AIRWAYS IBERIA EXPRESS AIR TRANSAT EASYJET SWITZERLAND CATHAY PACIFIC ORANGE 2 FLY 9 2 COBALT AIR SAUDIA ARABIAN ROYAL AIR MAROC AIR ARABIA IRAQI AIRWAYS 5 1 EUROPE AIRPOST CORENDON DUTCH 2 1 ENTER AIR GERMANIA 1 1 THOMAS COOK AS 1 1 PRIVILEGE STYLE S.A 1 1 TUIFLY 1 1 CONDOR 1 1
9 Grand Total

10 Percentage of - By Event Delay Category Code Description % of Total Air Traffic Control 9.4% Airline 18.7% Airport 25.3% Ground Servicing 8.8% Miscellaneous 5.4% Reactionary 22.5% Unknown 0.0% Unknown Delay Category Code 0.1% Weather 9.8% Percentage of - By Time Delay Category Code Description % of Total Air Traffic Control 6.8% Airline 21.9% Airport 10.0% Ground Servicing 5.5% Miscellaneous 3.1% Reactionary 36.5% Unknown 0.0% Unknown Delay Category Code 0.0% Weather 16.1%
11 Departing Taxi Times Arriving Taxi Times Manchester Operator Name 1 AEGEAN 23 AER LINGUS 14 Average Taxi Times 2 3 AIR ARABIA 14 AIR CONTRACTORS (ABR) 12 AIR FRANCE 13 AIR PORTUGAL 16 AIR TRANSAT 23 AMERICAN 21 AURIGNY AIR SERVICES 11 AUSTRIAN 16 BRITISH AIRWAYS 13 BRUSSELS 15 CATHAY PACIFIC 26 COBALT AIR 18 CONDOR 16 CORENDON DUTCH 15 EASYJET 13 EASYJET SWITZERLAND 11 EMIRATES 20 ENTER AIR 16 ETIHAD AIRWAYS 17 EUROPE AIRPOST 18 EUROWINGS 13 FINNAIR 13 FLYBE 14 FREEBIRD 15 GERMANIA 16 HAINAN 21 IBERIA EXPRESS 16 ICELANDAIR 16 IRAQI AIRWAYS 14 JET2.COM 17 K.L.M. 12 LOGANAIR 2 LUFTHANSA 13 NORWEGIAN AIR SHUTTLE 17 OMAN AIR 22 ORANGE 2 FLY 24 P.I.A. 19 PRIVILEGE STYLE S.A 23 QATAR AIRWAYS 20 ROYAL AIR MAROC 16 RYANAIR 13 SAS SCANDINAVIAN SAUDIA ARABIAN 19 SINGAPORE 20 SWISS INTERNATIONAL AIR LINES 13 THOMAS COOK 20 THOMAS COOK AS 11 TITAN AIRWAYS 14 TUI 18 TUIFLY 13 TURKISH 18 UNITED 22 VIRGIN ATLANTIC AIRWAYS 23 VLM AIRWAYS 19 VUELING 14 Grand Total Manchester Operator Name 1 AEGEAN 7 AER LINGUS 5 Average Taxi Times 2 3 AIR ARABIA 6 AIR CONTRACTORS (ABR) 6 AIR FRANCE 5 AIR PORTUGAL 7 AIR TRANSAT 12 ALITALIA 6 AMERICAN 9 AURIGNY AIR SERVICES 5 AUSTRIAN 8 BRITISH AIRWAYS 5 BRUSSELS 7 CATHAY PACIFIC 8 COBALT AIR 8 CONDOR 10 CORENDON DUTCH 8 EASYJET 4 EASYJET SWITZERLAND 4 EMIRATES 10 ENTER AIR 11 ETIHAD AIRWAYS 9 EUROWINGS 7 FINNAIR 8 FLYBE 7 FREEBIRD 9 GERMANIA 19 HAINAN 10 IBERIA EXPRESS 6 ICELANDAIR 7 IRAQI AIRWAYS 6 JET2.COM 7 K.L.M. 4 LOGANAIR 26 5 LUFTHANSA 6 NORWEGIAN AIR SHUTTLE 6 OMAN AIR 11 P.I.A. 12 PRIVILEGE STYLE S.A 6 QATAR AIRWAYS 10 ROYAL AIR MAROC 9 RYANAIR 10 6 SAS SCANDINAVIAN 6 SAUDIA ARABIAN 14 SINGAPORE 13 SWISS INTERNATIONAL AIR LINES 7 THOMAS COOK 10 THOMAS COOK AS -12 TITAN AIRWAYS 8 TUI 8 TUIFLY 6 TURKISH 8 UNITED 9 0 VIRGIN ATLANTIC AIRWAYS 12 VLM AIRWAYS 5 7 VUELING 6 Grand Total
12 Summary of Baggage Performance Baggage Category Arriving Passengers Arriving Movements Average Time to First Bag Average TIme to Last Bag Volume Last Bag SLA Missed Last Bag % A 97, % B 615, % C 168, % D 78, % Unknown 0 Grand Total 960, % Baggage Performance by Description Arriving Passengers Arriving Average Time to First Average TIme to Last Movements Bag Bag Volume Last Bag SLA Missed Last Bag % 1 493, % 2 154, % 3 312, % Grand Total 960, % Baggage SLA by Handling Agent Ramp Handling Agent Arriving Passengers Arriving Average Time to First Average TIme to Last Movements Bag Bag Volume Last Bag SLA Missed Last Bag % Aviator 91, % Dnata Ops 84, % Flight Support 4, % Menzies 352, % Premiere Handling 2, % Swissport 348, % Jet2 76, % Grand Total 960, %
Operational Performance Reporting Manchester Airport January 2018
 Operational Performance Reporting Manchester Airport January 2018 Departure - Jan-18 Last Month Last Year % Change Target Var to Target First Wave 89.7% 85.2% 4.5% 85.0% 4.7% Not First Wave 77.7% 76.3%
Departure Punctuality - Dec-17. Departure Punctuality - Last 12 Months
 Departure - Dec-17 Last Month Last Year % Change Target Var to Target First Wave 74.0% 84.1% -10.1% 85.0% -11.0% Not First Wave 55.4% 72.0% -16.6% 85.0% -29.6% Grand Total 59.4% 74.9% -15.5% 85.0% -25.6%
Operational Performance Reporting Manchester Airport August 2018
 Operational Performance Reporting Manchester Airport August 2018 Departure Punctuality - Aug-18 Last Month Last Year % Change Target Var to Target First Wave 83.4% 80.2% 3.2% 85.0% -1.6% Not First Wave
Departure Punctuality - Oct-17. Departure Punctuality - Last 12 Months
 MAG Airport Name Manchester Scheduled Date Between TIMESTAMP '2017-10-01 00:00:00' and TIMESTAMP '2017-10-31 00:00:00' Departure - Oct-17 Last Month Last Year % Change Target Var to Target First Wave 88.1%
Departure Punctuality - Apr-17. Departure Punctuality - Last 12 Months
 Departure - Apr-17 Last Month Last Year % Change Target Var to Target First Wave 87.6% 91.3% -3.8% 85.0% 2.6% Not First Wave 77.5% 81.5% -4.0% 85.0% -7.5% Grand Total 79.7% 83.6% -3.9% 85.0% -5.3% Departure
Departure Punctuality - Jun-17. Departure Punctuality - Last 12 Months
 Departure - Jun-17 Last Month Last Year % Change Target Var to Target First Wave 79.3% 79.8% -0.5% 85.0% -5.7% Not First Wave 68.3% 66.8% 1.5% 85.0% -16.7% Grand Total 70.7% 69.8% 0.8% 85.0% -14.3% Departure
Departure Punctuality - Feb-17. Departure Punctuality - Last 12 Months
 Operational Performance Reporting Manchester Airport February 2017 Departure - Feb-17 Last Month Last Year % Change Target Var to Target First Wave 85.2% 84.3% 0.8% 85.0% 0.2% Not First Wave 77.8% 80.5%
Departure Punctuality - Sep-17. Departure Punctuality - Last 12 Months
 Departure Punctuality - Sep-17 Last Month Last Year % Change Target Var to Target First Wave 73.0% 82.7% -9.7% 85.0% -12.0% Not First Wave 60.9% 73.4% -12.5% 85.0% -24.1% Grand Total 63.5% 75.5% -12.1%
Departure Punctuality - Aug-17. Departure Punctuality - Last 12 Months
 Departure - Aug-17 Last Month Last Year % Change Target Var to Target First Wave 80.2% 83.9% -3.8% 85.0% -4.8% Not First Wave 65.0% 71.0% -6.0% 85.0% -20.0% Grand Total 68.3% 73.9% -5.7% 85.0% -16.7% Departure
Departure Punctuality - May-17. Departure Punctuality - Last 12 Months
 MAG Airport Name Manchester Scheduled Date Between 2017-05-01 00:00:00 and 2017-05-31 00:00:00 Operator IATA Code (Report Defaults) Departure - May-17 Last Month Last Year % Change Target Var to Target
Number of complaints decided where a financial remedy awarded. Number of complaints received others
 Quarterly data for Q4 2017 from the CAA Approved entities and the CAA s Passenger Advice and Complaints Team Airline / Airport name of Aegean Airlines PACT 2 0 0 1 3 17 - - 25% Aer Lingus PACT 12 0 7 17
Remedy awarded (complaints decided in qtr)
") Quarterly complaints data for Q2 2018 from the CAA Approved ADR entities and the CAA s Passenger Advice and Team ADR entity No remedy per million pax Total Average award consumers Air Canada/Canada Rouge
Quarterly complaints data for Q2 2018 from the CAA Approved ADR entities and the CAA s Passenger Advice and Team ADR entity No remedy per million pax Total Average award consumers Air Canada/Canada Rouge
Punctuality for may 2018 per airline
 for may 2018 per airline Departures scheduled **) having less than 10 operations. Adria Airways 33 28 5 85% 9 73% 49 Aegean S.A. Aeroflot Russian 23 23 0 100% 5 78% 25 66 63 3 95% 10 85% 53 Air Baltic
Punctuality for july 2018 per airline
 Punctuality for july 2018 per airline Departures scheduled *) Delayed more than 15 minutes. **) having less than 10 operations. Planned Cancelled Delayed *) Punctuality Avg. delay (min) Adria Airways 31
Punctuality for june 2018 per airline
 Punctuality for june 2018 per airline Departures scheduled *) Delayed more than 15 minutes. **) s having less than 10 operations. Planned Cancelled Delayed *) Punctuality Avg. delay (min) Adria Airways
Punctuality for april 2018 per airline
 for april 2018 per airline Departures scheduled **) having less than 10 operations. Adria Airways 29 29 0 100% 10 66% 47 Aegean S.A. Aeroflot Russian 16 16 0 100% 0 100% 0 60 60 0 100% 2 97% 24 Air Baltic
Punctuality for march 2014 per airline
 for march 2014 per airline Departures scheduled **) having less than 10 operations. Aer Lingus 30 30 0 100% 2 93% 68 Aeroflot Russian 63 62 1 98% 1 98% 19 Air Baltic 73 72 1 99% 1 99% 19 Air Berlin 167
Punctuality for june 2015 per airline
 for june 2015 per airline Departures scheduled Adria Airways 16 16 0 100% 6 63% 28 Aegean s S.A. 23 23 0 100% 3 87% 24 Aer Lingus 30 30 0 100% 13 57% 45 Aeroflot Russian s 60 60 0 100% 10 83% 43 Air Baltic
Punctuality for july 2015 per airline
 for july 2015 per airline Departures scheduled **) having less than 10 operations. Acd/Ad Hoc 10 0 10 0% 0 100% 0 Adria Airways 18 18 0 100% 5 72% 25 Aegean S.A. 27 27 0 100% 12 56% 30 Aer Lingus 34 31
Punctuality for september 2018 per airline
 for september 2018 per airline Departures scheduled Adria Airways 31 29 2 94% 12 61% 57 Aegean s S.A. Aeroflot Russian s 24 24 0 100% 6 75% 28 60 60 0 100% 2 97% 24 Air Baltic 90 90 0 100% 6 93% 25 Air
Punctuality for may 2014 per airline
 for may 2014 per airline Departures scheduled **) having less than 10 operations. Adria Airways 18 18 0 100% 3 83% 118 Aer Lingus 30 30 0 100% 7 77% 36 Aeroflot Russian 62 62 0 100% 4 94% 58 Air Baltic
Punctuality for june 2014 per airline
 for june 2014 per airline Departures scheduled **) having less than 10 operations. Adria Airways 17 17 0 100% 4 76% 32 Aegean S.A. 12 12 0 100% 9 25% 39 Aer Lingus 30 30 0 100% 10 67% 34 Aeroflot Russian
Gatwick Airport (LGW)
") Gatwick Airport (LGW) Winter 16/17 (W16) Start of Season Report Report Date: Mon 24Oct16 Headlines W16 Start vs. W Start vs. W End Total Air Transport Movements (Passenger & Freight) 99,93 4.4% 9.9% Total
Gatwick Airport (LGW) Winter 16/17 (W16) Start of Season Report Report Date: Mon 24Oct16 Headlines W16 Start vs. W Start vs. W End Total Air Transport Movements (Passenger & Freight) 99,93 4.4% 9.9% Total
Punctuality for september 2013 per airline
 for september 2013 per airline Departures scheduled Adria Airways 17 17 0 100% 3 82% 20 Aer Lingus 26 26 0 100% 4 85% 22 Aeroflot Russian s 60 60 0 100% 9 85% 29 Air Baltic 85 84 1 99% 9 89% 32 Air Berlin
Punctuality for february 2017 per airline
 for february 2017 per airline Departures scheduled **) having less than 10 operations. Aegean S.A. Aeroflot Russian 12 12 0 100% 1 92% 32 59 56 3 95% 8 86% 105 Air Baltic 84 83 1 99% 6 93% 76 Air Berlin
MONTHLY PERFORMANCE REPORT DECEMBER gatwickairport.com/performance
 MONTHLY PERFORMANCE REPORT gatwickairport.com/performance At Gatwick we are committed to ensuring all areas of our business live up to the expectations of our passengers, our partners and our regulator.
Punctuality for november 2018 per airline
 for november 2018 per airline Departures scheduled Aegean s S.A. Aeroflot Russian s 21 21 0 100% 4 81% 31 60 60 0 100% 5 92% 24 Air Baltic 86 86 0 100% 3 97% 58 Air Canada 14 14 0 100% 8 43% 49 Air China
Punctuality for february 2018 per airline
 for february 2018 per airline Departures scheduled **) having less than 10 operations. Adria Airways 20 19 1 95% 0 100% 0 Aegean S.A. Aeroflot Russian 12 12 0 100% 4 67% 21 57 56 1 98% 8 86% 49 Air Baltic
AIRLINE PERFORMANCE 2012 ISABEL CYSNEIROS 27/03/2013
 AIRLINE PERFORMANCE 2012 ISABEL CYSNEIROS 27/03/2013 DEFINITIONS Late Handbacks: Slots returned after IATA Slot Handback Deadline - the difference between the slots held at the SOS (Start of Season) and
Punctuality for october 2017 per airline
 for october 2017 per airline Departures scheduled **) having less than 10 operations. Adria Airways 22 22 0 100% 5 77% 33 Aegean S.A. Aeroflot Russian 29 29 0 100% 7 76% 26 62 62 0 100% 9 85% 24 Air Baltic
MONTHLY PERFORMANCE REPORT FEBRUARY gatwickairport.com/performance
 MONTHLY PERFORMANCE REPORT gatwickairport.com/performance At Gatwick we are committed to ensuring all areas of our business live up to the expectations of our passengers, our partners and our regulator.
HEATHROW AIRPORT LHR Summer 2014 (S14) Start of Season
 Start of Season") HEATHROW AIRPORT LHR Summer 214 (S14) Start of Season KEY STATISTICS Summer 214 vs Summer 213 Air Transport Movements Allocated 282,172.6% Passenger Air Transport Movements Allocated 28,726.6% Total Seats
HEATHROW AIRPORT LHR Summer 214 (S14) Start of Season KEY STATISTICS Summer 214 vs Summer 213 Air Transport Movements Allocated 282,172.6% Passenger Air Transport Movements Allocated 28,726.6% Total Seats
MONTHLY PERFORMANCE REPORT MARCH gatwickairport.com/performance
 MONTHLY PERFORMANCE REPORT gatwickairport.com/performance At Gatwick we are committed to ensuring all areas of our business live up to the expectations of our passengers, our partners and our regulator.
MONTHLY PERFORMANCE REPORT OCTOBER gatwickairport.com/performance
 MONTHLY PERFORMANCE REPORT gatwickairport.com/performance At Gatwick we are committed to ensuring all areas of our business live up to the expectations of our passengers, our partners and our regulator.
MONTHLY PERFORMANCE REPORT OCTOBER gatwickairport.com/performance
 MONTHLY PERFORMANCE REPORT gatwickairport.com/performance At Gatwick we are committed to ensuring all areas of our business live up to the expectations of our passengers, our partners and our regulator.
MONTHLY PERFORMANCE REPORT JANUARY gatwickairport.com/performance
 MONTHLY PERFORMANCE REPORT gatwickairport.com/performance At Gatwick we are committed to ensuring all areas of our business live up to the expectations of our passengers, our partners and our regulator.
Punctuality for august 2017 per airline
 for august 2017 per airline Departures scheduled **) having less than 10 operations. Acd/Ad Hoc 12 0 12 0% 0 100% 0 Adria Airways 21 21 0 100% 4 81% 26 Aegean S.A. Aeroflot Russian 19 19 0 100% 9 53% 22
MONTHLY PERFORMANCE REPORT APRIL gatwickairport.com/performance
 MONTHLY PERFORMANCE REPORT gatwickairport.com/performance At Gatwick we are committed to ensuring all areas of our business live up to the expectations of our passengers, our partners and our regulator.
GATWICK AIRPORT LGW WINTER 2013/14 (W13) Start of season
 Start of season") GATWICK AIRPORT LGW WINTER 213/14 (W13) Start of season vs 212/13 Start vs 212/13 End KEY STATISTICS 213/14 Air Transport Movements 91,68 5.3% 8.8% Total Seats (m) 15.7 5.3% 8.4% Seats per Passenger ATM
GATWICK AIRPORT LGW WINTER 213/14 (W13) Start of season vs 212/13 Start vs 212/13 End KEY STATISTICS 213/14 Air Transport Movements 91,68 5.3% 8.8% Total Seats (m) 15.7 5.3% 8.4% Seats per Passenger ATM
The contents of this report may not be reproduced without the written consent of COHOR.
 Nice Côte d Azur Airport NCE/LFMN Summer 2018 - Start Of Season Report Report data extraction date: 27 March 2018 Table of contents Evolution of allocated slots at the Start Of Season (SOS)... 2 Total
Lyon St Exupéry Airport LYS/LFLL
 Lyon St Exupéry Airport LYS/LFLL Winter 2018 - Start Of Season Report Report data extraction date: 30 October 2018 Table of contents Evolution of allocated slots at the Start Of Season (SOS)... 2 Slots
The contents of this report may not be reproduced without the written consent of COHOR.
 Nice Côte d Azur Airport NCE/LFMN Winter 2018 - Start Of Season Report Report data extraction date: 31 October 2018 Table of contents Evolution of allocated slots at the Start Of Season (SOS)... 2 Total
Heathrow Airport (LHR)
") Heathrow Airport (LHR) Summer 2018 (S18) Start of Season Report Report Date: Wed 21Mar2018 Headlines S18 Start vs. S17 Start vs. S17 End Total Air Transport Movements (Passenger & Freight) 294775 0.2%
Heathrow Airport (LHR) Summer 2018 (S18) Start of Season Report Report Date: Wed 21Mar2018 Headlines S18 Start vs. S17 Start vs. S17 End Total Air Transport Movements (Passenger & Freight) 294775 0.2%
Manchester Airport (MAN)
") Manchester Airport (MAN) Summer 19 (S19) Start of Season Report Report Date: Thu 21Mar19 Headlines S19 Start vs. S18 Start vs. S18 End Total Air Transport Movements (Passenger & Freight) 128813 2.1% 4.8%
Manchester Airport (MAN) Summer 19 (S19) Start of Season Report Report Date: Thu 21Mar19 Headlines S19 Start vs. S18 Start vs. S18 End Total Air Transport Movements (Passenger & Freight) 128813 2.1% 4.8%
Global Airline On-time Arrival Performance Report November 2014
 Global Arrival Performance Report November 2014 Copyright @ 2014 VariFlight.com 1 Contents > > Part I Major Arrival Performance Figure 3 Part II Major Arrival Data 6 Copyright @ 2014 VariFlight.com 2 Part
Dublin Airport (DUB) Winter 2018/19 (W18) Start of Season Report Report Date: Thu 04-Oct-2018 Headlines W18 Start vs. W17 Start vs.
 Winter 2018/19 (W18) Start of Season Report Report Date: Thu 04-Oct-2018 Headlines W18 Start vs. W17 Start vs.") Dublin Airport (DUB) Winter 218/19 (W18) Start of Season Report Report Date: Thu 4-Oct-218 Headlines W18 Start vs. W17 Start vs. W17 End Total Air Transport Movements (Passenger & Freight) 86,83 6.% 9.4%
Dublin Airport (DUB) Winter 218/19 (W18) Start of Season Report Report Date: Thu 4-Oct-218 Headlines W18 Start vs. W17 Start vs. W17 End Total Air Transport Movements (Passenger & Freight) 86,83 6.% 9.4%
Lyon St Exupéry Airport LYS/LFLL
 Lyon St Exupéry Airport LYS/LFLL Summer 2017 - Start Of Season Report Report data extraction date: 27 March 2017 Table of contents Evolution of allocated slots at the Start Of Season (SOS)... 2 Slots distribution
MONTHLY PERFORMANCE REPORT DECEMBER gatwickairport.com/performance
 MONTHLY PERFORMANCE REPORT gatwickairport.com/performance At Gatwick we are committed to ensuring all areas of our business live up to the expectations of our passengers, our partners and our regulator.
I am writing in respect of your recent request of 5 February 2018, for the release of information held by the Civil Aviation Authority (CAA).
.") Communications Department External Information Services 5 March 2018 Reference: F0003589 Dear I am writing in respect of your recent request of 5 February 2018, for the release of information held by the
Communications Department External Information Services 5 March 2018 Reference: F0003589 Dear I am writing in respect of your recent request of 5 February 2018, for the release of information held by the
Punctuality for october 2012 per airline
 for october 2012 per airline Departures scheduled **) having less than 10 operations. Adria Airways 12 12 0 100% 3 75% 45 Aeroflot Russian Aerosvit 62 61 1 98% 8 87% 33 23 23 0 100% 5 78% 26 Air Baltic
Punctuality for july 2012 per airline
 for july 2012 per airline Departures scheduled **) having less than 10 operations. Adria Airways 32 31 1 97% 3 91% 46 Aeroflot Russian Aerosvit 62 61 1 98% 8 87% 25 31 30 1 97% 13 58% 78 Air Baltic 93
Headlines S19 Start vs. S18 Start vs. S18 End
 Dublin Airport (DUB) Summer 219 (S19) Start of Season Report Report Date: Tue 26Mar219 Headlines S19 Start vs. S18 Start vs. S18 End Total Air Transport Movements (Passenger & Freight) 148,42 3.7%.% Total
Global Airline On-time Arrival Performance Report October 2014
 Global Arrival Performance Report October 2014 Copyright @ 2014 VariFlight.com 1 Contents > > Part I Major Arrival Performance Figure 3 Part II Major Arrival Data 6 Copyright @ 2014 VariFlight.com 2 Part
Start of Season Report Nice Côte d Azur Airport Summer Nice Côte d Azur Airport NCE/LFMN. Summer Start Of Season Report
 Nice Côte d Azur Airport NCE/LFMN Summer 2017 - Start Of Season Report Report data extraction date: 29 March 2017 Table of contents Evolution of allocated slots at the Start Of Season (SOS)... 2 Total
I am writing in respect of your recent request of 10 January 2018, for the release of information held by the Civil Aviation Authority (CAA).
.") Communications Department External Information Services 7 February 2018 Reference: F0003557 Dear I am writing in respect of your recent request of 10 January 2018, for the release of information held by
Communications Department External Information Services 7 February 2018 Reference: F0003557 Dear I am writing in respect of your recent request of 10 January 2018, for the release of information held by
Start of Season Report Nice Côte d Azur Airport Winter Nice Côte d Azur Airport NCE/LFMN. Winter Start Of Season Report
 Nice Côte d Azur Airport NCE/LFMN Winter 2016 - Start Of Season Report Report data extraction date: 30 Octobre 2016 Table of contents Evolution of allocated slots at the Start Of Season (SOS)... 2 Total
Punktlighed for september 2018 pr. flyselskab
 Afgange rute Punktlighed for september 2018 pr. flyselskab *) Forsinket mere end 15 minutter. **) Flyselskaber med mindre end 10 operationer. Flyselskab Planlagt Aflyst Forsinket *) Punktlighed Gns. fors.
Lyon St Exupéry Airport LYS/LFLL
 Lyon St Exupéry Airport LYS/LFLL Winter 2014 - Start Of Season Report Report data extraction date: Monday 27 October 2014 Last modification made on: Table of contents Evolution of allocated slots at the
MONTHLY PERFORMANCE REPORT MAY gatwickairport.com/performance
 MONTHLY PERFORMANCE REPORT gatwickairport.com/performance DOCUMENT HISTORY Monthly Performance Report Published Republished Page Reference Metric Reason for Change May 01/05/2017 01/06/2017 12 Pier Service
Intra-European Seat Capacity. January February March April May June July August September October November December. Intra-European Sectors Flown
 ASK's (Million) Sectors Departing Seats 80,000,000 Intra-European Seat Capacity 70,000,000 60,000,000 50,000,000 40,000,000 30,000,000 20,000,000 10,000,000 0 January February March April May June July
Customer Relations Programme
 Customer Relations Programme 2018 2 Customer Relations Thank you for taking time to meet with us today We would like to give you an update on IAA We hope to gain a better understanding of how we can improve
Birmingham Airport (BHX)
") Birmingham Airport (BHX) Summer 218 (S18) Start of Season Report Report Date: Fri 23Mar218 Headlines S18 Start vs. S17 Start vs. S17 End Total Air Transport Movements (Passenger & Freight) 69,211 9.7%
Birmingham Airport (BHX) Summer 218 (S18) Start of Season Report Report Date: Fri 23Mar218 Headlines S18 Start vs. S17 Start vs. S17 End Total Air Transport Movements (Passenger & Freight) 69,211 9.7%
Heathrow Airport LHR Winter 2012 START OF SEASON REPORT
 Heathrow Airport LHR Winter 212 START OF SEASON REPORT KEY STATISTICS Winter 212 vs Winter 211 Start vs Winter 211 End Air Transport Movements 194,486-2.%.1% Total Seats (m) 4.1.1% 3.4% Seats per Passenger
The development of the potential for low-cost, one-stop connecting services in Europe From self-hubbing to reliable low cost connecting services?
 DLR.de 1 The development of the potential for low-cost, one-stop connecting services in Europe From self-hubbing to reliable low cost connecting services? German Aerospace Center, Cologne Institute of
EVOLUTION OF ALLOCATED SLOTS AT THE START OF SEASON (SOS)... 2 TOTAL SLOTS BY OPERATOR TOP SLOTS DISTRIBUTION PER ALLIANCE...
... 2 TOTAL SLOTS BY OPERATOR TOP SLOTS DISTRIBUTION PER ALLIANCE...") Paris - Charles de Gaulle Airport CDG/LFPG Winter 2017 - Start Of Season Report Report data extraction date: 30 October 2017 Table of contents EVOLUTION OF ALLOCATED SLOTS AT THE START OF SEASON (SOS)...
Paris - Charles de Gaulle Airport CDG/LFPG Winter 2017 - Start Of Season Report Report data extraction date: 30 October 2017 Table of contents EVOLUTION OF ALLOCATED SLOTS AT THE START OF SEASON (SOS)...
Punktlighed for august 2017 pr. flyselskab
 for august 2017 pr. flyselskab Afgange rute **) er med mindre end 10 operationer. Acd/Ad Hoc 12 0 12 0% 0 100% 0 Adria 21 21 0 100% 4 81% 26 Aegean S.A. Aeroflot Russian 19 19 0 100% 9 53% 22 62 62 0 100%
Japan Export Air. International Air Freight Fuel Surcharge. All Destinations
 Japan Export Air January 12, 218 International Air Freight Fuel Surcharge Carrier 3K Jet Star Asia Airways 66 1-Jan-15 Taiwan, Philippines 48 1-Jan-15 5C C.A.L. Cargo 13 1-Oct-12 China, Hong Kong, Korea,
Heathrow Airport LHR Winter 2013/14 (W13) Start of season
 Start of season") Heathrow Airport LHR Winter 213/14 (W13) Start of season KEY STATISTICS Winter 213/14 vs Winter 212/13 Air Transport Movements 193,618.4% Passenger Air Transport Movements Allocated 192,627.6% Total Seats
Heathrow Airport LHR Winter 213/14 (W13) Start of season KEY STATISTICS Winter 213/14 vs Winter 212/13 Air Transport Movements 193,618.4% Passenger Air Transport Movements Allocated 192,627.6% Total Seats
Japan Export Air. International Air Freight Fuel Surcharge. All Destinations
 Japan Export Air January 3, 218 International Air Freight Fuel Surcharge Carrier 3K Jet Star Asia Airways All s 66 1-Jan-15 Taiwan, Philippines 48 1-Jan-15 5C C.A.L. Cargo All s 13 1-Oct-12 China, Hong
Japan Export Air. International Air Freight Fuel Surcharge. All Destinations
 Japan Export Air March 30, 2019 International Air Freight Fuel Surcharge 3K Jet Star Asia Airways All s 66 1-Jan-15 Taiwan, Philippines 48 1-Jan-15 5C C.A.L. Cargo All s 130 1-Oct-12 China, Hong Kong,
Japan Export Air. International Air Freight Fuel Surcharge. All Destinations
 Japan Export Air February 27, 2019 International Air Freight Fuel Surcharge 3K Jet Star Asia Airways All s 66 1-Jan-15 Taiwan, Philippines 48 1-Jan-15 5C C.A.L. Cargo All s 130 1-Oct-12 China, Hong Kong,
I am writing in respect of your recent request of 11 January 2018, for the release of information held by the Civil Aviation Authority (CAA).
.") Communications Department External Information Services 8 February 2018 Reference: F0003558 Dear I am writing in respect of your recent request of 11 January 2018, for the release of information held by
Communications Department External Information Services 8 February 2018 Reference: F0003558 Dear I am writing in respect of your recent request of 11 January 2018, for the release of information held by
EVOLUTION OF ALLOCATED SLOTS AT THE START OF SEASON (SOS)... 2 TOTAL SLOTS BY OPERATOR TOP SLOTS DISTRIBUTION PER ALLIANCE...
... 2 TOTAL SLOTS BY OPERATOR TOP SLOTS DISTRIBUTION PER ALLIANCE...") Paris - Charles de Gaulle Airport CDG/LFPG Summer 2018 - Start Of Season Report Report data extraction date: 26 March 2018 Table of contents EVOLUTION OF ALLOCATED SLOTS AT THE START OF SEASON (SOS)...
Paris - Charles de Gaulle Airport CDG/LFPG Summer 2018 - Start Of Season Report Report data extraction date: 26 March 2018 Table of contents EVOLUTION OF ALLOCATED SLOTS AT THE START OF SEASON (SOS)...
DUBLIN INTERNATIONAL AIRPORT DUB S14 Start of Season Report
 DUBLIN INTERNATIONAL AIRPORT DUB S14 Start of Season Report Key Statistics Summer 214 Change from Summer 213 (End of Season) Change from Summer 213 (Start of Season) Air Transport Movements 17,76 1. 4.9%
AIA Passenger Traffic Highlights
 AIA Passenger Traffic Highlights A U G U S T 2016 Overall Passenger Traffic Development The airport s passenger traffic during August 16 reached 2.37 million passengers, exceeding the respective month
Headlines W15 Start vs. W14 Start vs. W14 End
 Dublin Airport (DUB) Winter 2/16 (W) Start of Season Report Report Date: Mon 12Oct2 Headlines W Start vs. W14 Start vs. W14 End Total Air Transport Movements (Passenger & Freight) 74,66 9.% 1.6% Total
For SOP the CAA holds data for the time period 1 August 2016 to 31 December 2016.
 Communications Department External Information Services 17 July 2017 Reference: F0003249 Dear I am writing in respect of your recent request of 19 June 2017, for the release of information held by the
ATM & GENESYS Digital Futures Summit IATA - NDC Program Update 23 rd April 2018
 ATM & GENESYS Digital Futures Summit IATA - NDC Program Update 23 rd April 2018 What s the market problem? Airlines Travel Agents Customer Experience Don t have the freedom to distribute their products
Stansted Airport (STN)
") Stansted Airport (STN) Summer 219 (S19) Start of Season Report Report Date: Wed 13Mar219 Headlines S19 Start vs. S18 Start vs. S18 End Total Air Transport Movements (Passenger & Freight) 12,2.8% 2.6% Total
Stansted Airport (STN) Summer 219 (S19) Start of Season Report Report Date: Wed 13Mar219 Headlines S19 Start vs. S18 Start vs. S18 End Total Air Transport Movements (Passenger & Freight) 12,2.8% 2.6% Total
AEROPORTO DI BOLOGNA FLIGHT TIMETABLE Scheduled flights
 AEROPORTO DI BOLOGNA 2019 FLIGHT TIMETABLE Scheduled flights Summer 2019 Updated 08/01/2019 Valid until 26/10/2019 Flight Timetable Guide From Airline Flight No. Departure Arrival Frequency Validity 1
AIRLINE PERFORMANCE WINTER 2013 ISABEL CYSNEIROS 29/05/2014
 AIRLINE PERFORMANCE WINTER 2013 ISABEL CYSNEIROS 29/05/2014 DEFINITIONS Late Handbacks: Slots returned after IATA Slot Handback Deadline - the difference between the slots held at the SOS (Start of Season)
GATWICK AIRPORT LGW SUMMER 2013 (S13) Start of season
 Start of season") GATWICK AIRPORT LGW SUMMER 213 (S13) Start of season vs Summer 212 Start vs Summer 212 End KEY STATISTICS Summer 213 Air Transport Movements 161,19 1.8% 4.8% Total Seats (m) 28. 1.9% 4.7% Seats per Passenger
GATWICK AIRPORT LGW SUMMER 213 (S13) Start of season vs Summer 212 Start vs Summer 212 End KEY STATISTICS Summer 213 Air Transport Movements 161,19 1.8% 4.8% Total Seats (m) 28. 1.9% 4.7% Seats per Passenger
Global Seat Capacity July. May. June. Global Sectors Flown July. May. June %
 Jan-14 Feb-14 Mar-14 Apr-14 May-14 Jun-14 Jul-14 Aug-14 Sep-14 Oct-14 Nov-14 Dec-14 Jan-15 Feb-15 Mar-15 Apr-15 May-15 Low cost Oneworld Skyteam Star Alliance Other Billion ASKs - YTD January February
Summer Start Of Season Report
 Paris - Charles de Gaulle Airport CDG/LFPG Summer 2015 - Start Of Season Report Report data extraction date: Monday 30 March 2015 Last modification made on: 03/30/2015 Table of contents Evolution of allocated
Half Year Traffic Highlights
 Half Year Traffic Highlights Presented by CEO, ALAN BORG 1 Presentation Contents 1. Traffic Highlights 2015 2. Route Development 2015 3. Industry Indicators 2015 4. Forecast 2015 5. Airport Investments
AEA CONSUMER REPORT FOR 2 nd QUARTER 2007
 Association of European Airlines Avenue Louise 350 B - 1050 Brussels Tel. +32 (0)2 639 89 89 Fax 639 89 99 E-mail aea.secretariat@aea.be Web www.aea.be 31 July 2007 AEA CONSUMER REPORT FOR 2 nd QUARTER
SFO Airline Guide 11/1/18 CBFANC AIR COMMITTEE
 SFO Airline Guide 11/1/18 CBFANC AIR COMMITTEE A/L # cd AIRLINE FIRMS CODE ISC PYBL TO HRS Wknd Hrs other phone PHONE# FAX# 549 M3 ABSA Y965 $40 + $10/FA 7-5 closed 310 645 1221 4155706040 4155706050 730
Global Seat Capacity May. June. July. Global Sectors Flown May. June. July
 Global Departing Seats (Millions) 5 45 4 35 3 25 2 15 5 4.6% 5.4% 6.3% 5.6% 5.4% 6.2% 6.8% 6.1% Global Seat Capacity 214 215 January February March April May June July August September October November
Group Flights. Conducted by YouGov on behalf of Civil Aviation Authority. Fieldwork Dates: 28th December th January 2018
 Conducted by YouGov on behalf of Civil Aviation Authority Fieldwork Dates: 28th December 2017-9th January 2018 ACF_Q1. For the following question, by "fly as part of a group", we mean flying anywhere (i.e.
Global Seat Capacity July. May. June. Global Sectors Flown July. May. June %
 Jan-14 Feb-14 Mar-14 Apr-14 May-14 Jun-14 Jul-14 Aug-14 Sep-14 Oct-14 Nov-14 Dec-14 Jan-15 Low cost Oneworld Skyteam Star Alliance Other Billion ASKs - YTD January February March April May June July August
Global Aviation Monitor (GAM)
") Global Aviation Monitor (GAM) Analysis and Short Term Outlook of Global, European and German Air Transport Main Results of Global Air Transport Supply Analysis and Outlook Background: Covers about 3,500
Global Aviation Monitor (GAM) Analysis and Short Term Outlook of Global, European and German Air Transport Main Results of Global Air Transport Supply Analysis and Outlook Background: Covers about 3,500
Prediction of Skytrax airline rankings, short formula (2e)
") Site: Wiki of Science at http://wikiofscience.wikidot.com Source page: 20120725 - Prediction of Skytrax airline rankings, short formula (2e) - 2010 at http://wikiofscience.wikidot.com/print:20120725-skytrax-al-short-perezgonzalez2010
Site: Wiki of Science at http://wikiofscience.wikidot.com Source page: 20120725 - Prediction of Skytrax airline rankings, short formula (2e) - 2010 at http://wikiofscience.wikidot.com/print:20120725-skytrax-al-short-perezgonzalez2010
Getting to Salamanca FROM MADRID AIRPORT
 Getting to Salamanca FROM MADRID AIRPORT COULDN T BE EASIER AND IT S FREE (if you re doing 2 weeks or more) ISLA Quality Spanish Courses Spain OUR RECOMMENDED TRIP IS SUMMED UP LIKE THIS madrid airport
Gatwick Airport (LGW)
") Gatwick Airport (LGW) Summer 18 (S18) Start of Season Report Report Date: Fri 23Mar18 Headlines S18 Start vs. S17 Start vs. S17 End Total Air Transport Movements (Passenger & Freight) 189,988.9% 2.1% Total
Gatwick Airport (LGW) Summer 18 (S18) Start of Season Report Report Date: Fri 23Mar18 Headlines S18 Start vs. S17 Start vs. S17 End Total Air Transport Movements (Passenger & Freight) 189,988.9% 2.1% Total
Global Aviation Monitor (GAM)
") Global Aviation Monitor (GAM) Analysis and Short Term Outlook of Global, European and German Air Transport Main Results of Global Air Transport Supply Analysis and Outlook Background: Covers about 3,500
Global Aviation Monitor (GAM) Analysis and Short Term Outlook of Global, European and German Air Transport Main Results of Global Air Transport Supply Analysis and Outlook Background: Covers about 3,500
Airline On-time Arrival Performance (Nov. 2017)
") Airline (Nov. 2017) Powered by VariFlight incomparable aviation database, the monthly report of Airline On-time Departure provides an overview of how global airlines are performing in November, 2017. Global
Airline (Nov. 2017) Powered by VariFlight incomparable aviation database, the monthly report of Airline On-time Departure provides an overview of how global airlines are performing in November, 2017. Global
Headlines S16 Start vs. S15 Start vs. S15 End
 Dublin Airport (DUB) Summer 216 (S16) Start of Season Report Report Date: Wed 23Mar216 Headlines S16 Start vs. S1 Start vs. S1 End Total Air Transport Movements (Passenger & Freight) 132,772 8.3% 8.6%
Global Aviation Monitor (GAM)
") Global Aviation Monitor (GAM) Analysis and Short Term Outlook of Global, European and German Air Transport Main Results of Global Air Transport Supply Analysis and Outlook Background: Covers about 3,500
Global Aviation Monitor (GAM) Analysis and Short Term Outlook of Global, European and German Air Transport Main Results of Global Air Transport Supply Analysis and Outlook Background: Covers about 3,500