- NEUTRAL. Savannah ORGIA PETER SALAMON MASTER OF URBAN DESIGN THESIS SAVANNAH COLLEGE OF ART AND DESIGN MAY 2015
|
|
|
- Claribel Berry
- 5 years ago
- Views:
Transcription

1 - NEUTRAL + RE δge Savannah ORGIA PETER SALAMON MASTER OF URBAN DESIGN THESIS SAVANNAH COLLEGE OF ART AND DESIGN MAY 2015
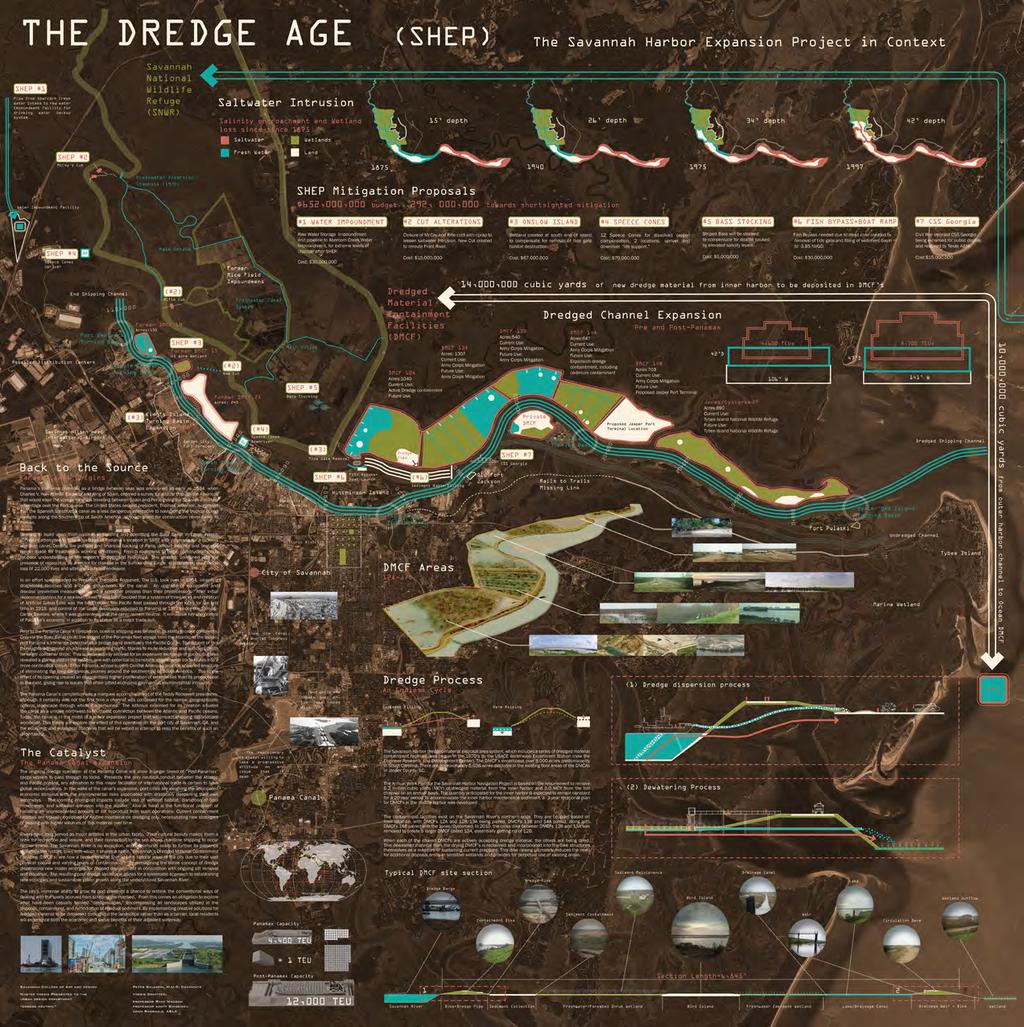
2 PANAMA CANAL EXPANSION THE CATALYST Suez ,000 km Panama ,000 km Prior Shortest Route New Shortest Route


3 = 1 TEU 4,400 TEU Panamax Capacity 12,000 TEU Post-Panamax Capacity

4 PRIME LOCAL CONDITIONS INFRASTRUCTURE

5 Savannah Hilton Head International Airport provides more than 38 daily direct flights Chicago Detroit Boston New York City Washington DC Charlotte Atlanta Dallas Savannah Houston New Orleans

6 2 on-terminal class 1 rail providers, Norfolk Southern and CSX, allow direct delivery of cargo to distribution centers Chicago Milwaukee Detroit Columbus Cleveland Pittsburgh New York City Kansas City Louisville Cincinatti Memphis Nashville Atlanta Charlotte Dallas Savannah Houston New Orleans Jacksonville Orlando Tampa Miami

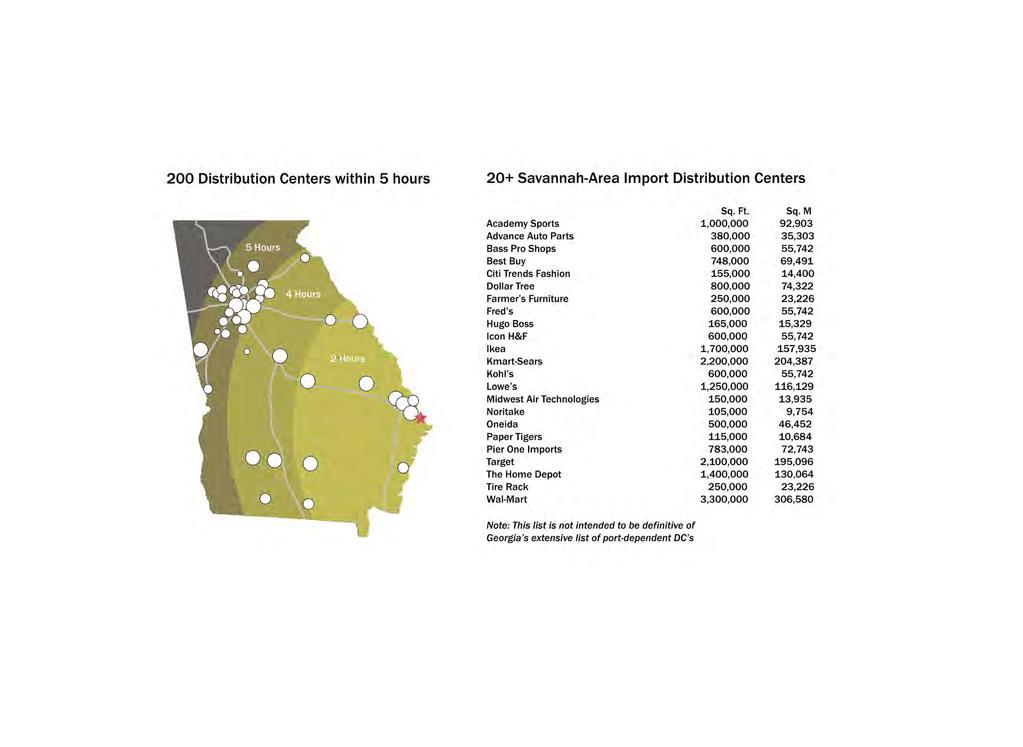
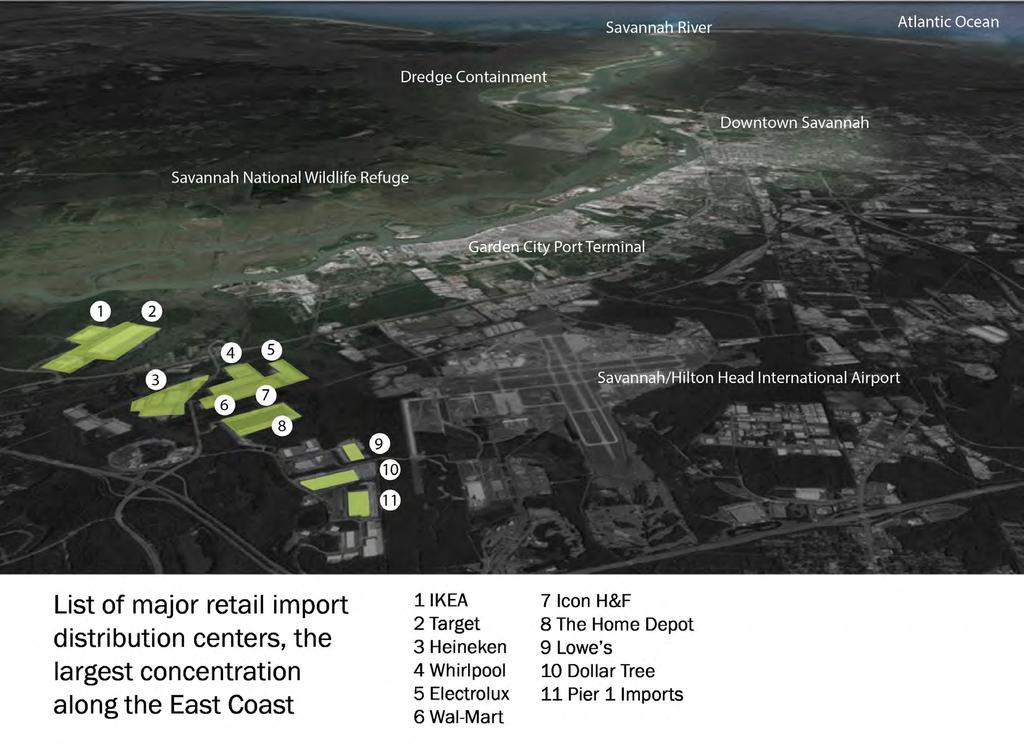
7 Savannah s central location and extensive highway system enables 24 hour delivery to % 44 of the country. 9 daily truck turnarounds is the highest of any US port city Kansas City Chicago Milwaukee Detroit Louisville Columbus Cincinatti Cleveland Pittsburgh Boston New York City Philadelphia Washington DC 20 Hours Memphis Nashville Atlanta Charlotte Columbia 10 Hours Charleston Dallas 5 Hours Savannah Houston New Orleans Jacksonville Orlando Tampa Miami
8
9


10 PORT GROWTH RANKING by TEU -


11 EXPANSION PROJECT SAVANNAH HARBOR -Army Corps of Engineers
 No significant local economic gain other than maintaining $1.1 million in local taxes TEU increase 2.9 million/yr in 2013 to 6.")
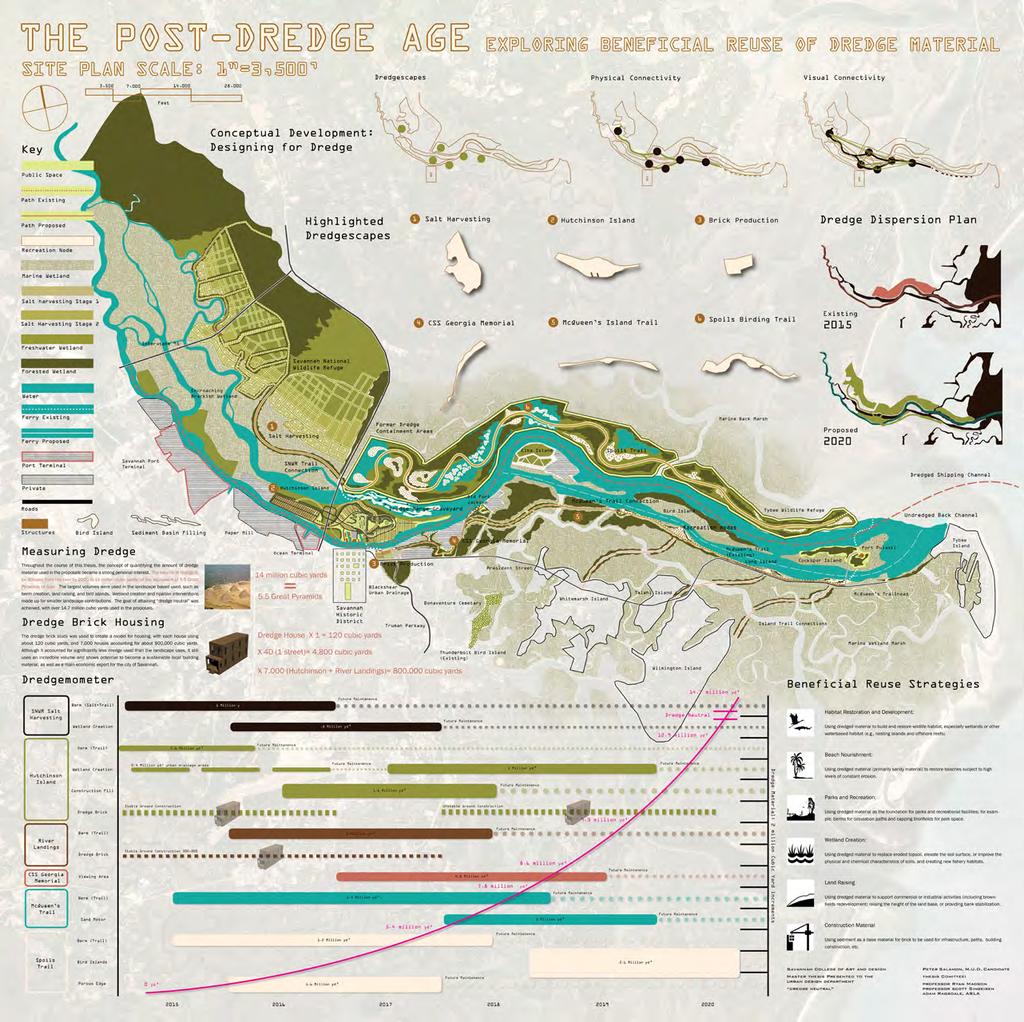
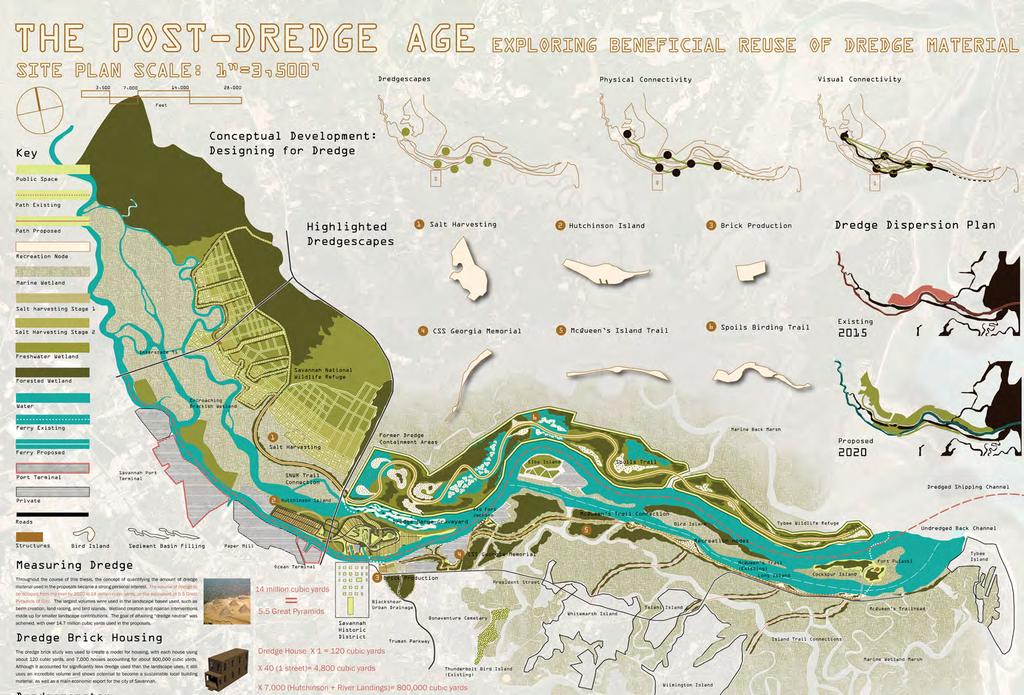
12 SHEP FIGURES ECONOMIC IMPACT $706 million cost, payback in net benefits in only 3 years. $174 million/yr more to United States Supports 352,146 full- and part-time jobs (8.3% of Georgia s total employment) No significant local economic gain other than maintaining $1.1 million in local taxes TEU increase 2.9 million/yr in 2013 to 6.5 million/yr by 2030 Largest benefit comes with estimated annual transportation cost savings of $213 million/yr, due to local infrastructure advantages


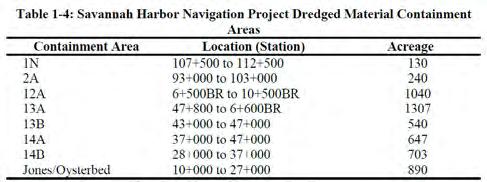
13 ECOLOGICAL IMPACT δ - DREDGE NEGATIVES Dangerously low dissolved oxygen levels = dead fish 14 million cubic yards of sediment = 5.5 Great Pyramids Saltwater Intrusion into Savannah National Wildlife Refuge


14 Dredge Dispersion Process Sediment Dewatering Process Sediment Filling Berm Raising
15

16

17

.")


18 BENEFICIAL REUSE STRATEGIES δ+ DREDGE POSITIVES Habitat Restoration and Development: Using dredged material to build and restore wildlife habitat, especially wetlands or other waterbased habitat (e.g., nesting islands and offshore reefs). Beach Nourishment: Using dredged material (primarily sandy material) to restore beaches subject to erosion Parks and Recreation: Using dredged material as the foundation for parks and recreational facilities; for example, waterside parks providing such amenities as swimming, picnicking, camping, or boating. Agri/Aquaculture: Using dredged material to replace eroded topsoil, elevate the soil surface, or improve the physical and chemical characteristics of soils. Also creating new fishery habitats. Infill using dredged material to support commercial or industrial activities (including brownfields redevelopment), primarily near waterways; for example, expanding or raising the height of the land base, or providing bank stabilization. Construction Material Using sediment as a base material for brick to be used for infrastructure, paths, building construction, etc.


19 SHEP MITIGATION PROPOSALS #1 WATER IMPOUNDMENT Water Impoundment, and pipeline to Abercorn Creek for extreme levels of chloride after SHEP. Cost: $30,000,000 #2 MCCOY+RIFLE CUTS Closure of McCoy s cut with rock diversion and sheet pile walls. This will attempt to prevent saltwater intrusion into the SNWRah Cost:al Wildlife Refuge #3 ONSLOW ISLAND Wetland created at south end of island to compensate for removal of tide gate habitat destruction. Cost: #4 SPEECE CONES 12 Sets of 6 Speece Cones for Dissolved Oxygen Compensation, upriver and downriver locations/ Cost #5 Fish Bypass Fish Bypass needed due to dead zone created by removal of tide gate. Cost: #6 CSS Georgia Civil War Ironclad CSS Georgia being exhumed for public display. Cost:$15,000,000 HALF OF $700 million SHEP budget is dedicated to mitigation proposals


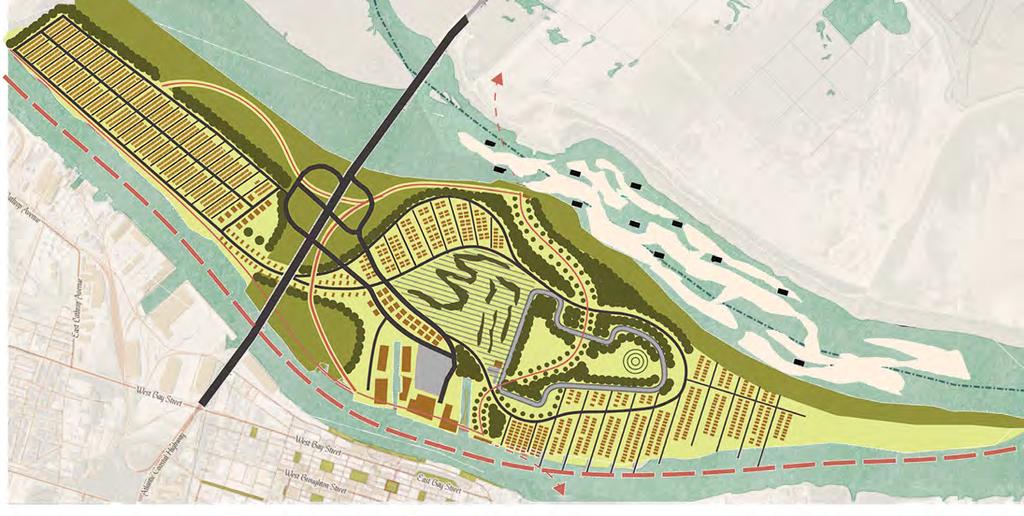
20 NEW PROPOSALS SALT HARVESTING The former rice fields of the National Wildlife Refuge will be retrofitted for salt harvesting to prevent further saline intrusion into the wetlands. HUTCHINSON AS THE HUB The underutilized Island, orignally a dredge containment area itself, becomes the core of all dredge-related operations. BRICK PRODUCTION A study proved that high quality brick can be made from Savannah River dredge. CSS GEORGIA MEMORIAL Civil War Ironclad being recovered from river s bottom is restored and displayed in a walk of relics. McQUEEN S TRAIL Final connection made to former rails to trails project SPOILS TRAIL The DMCF s can become a natural extension of the SNWR, as it will no longer be needed to house dredge.
21
22


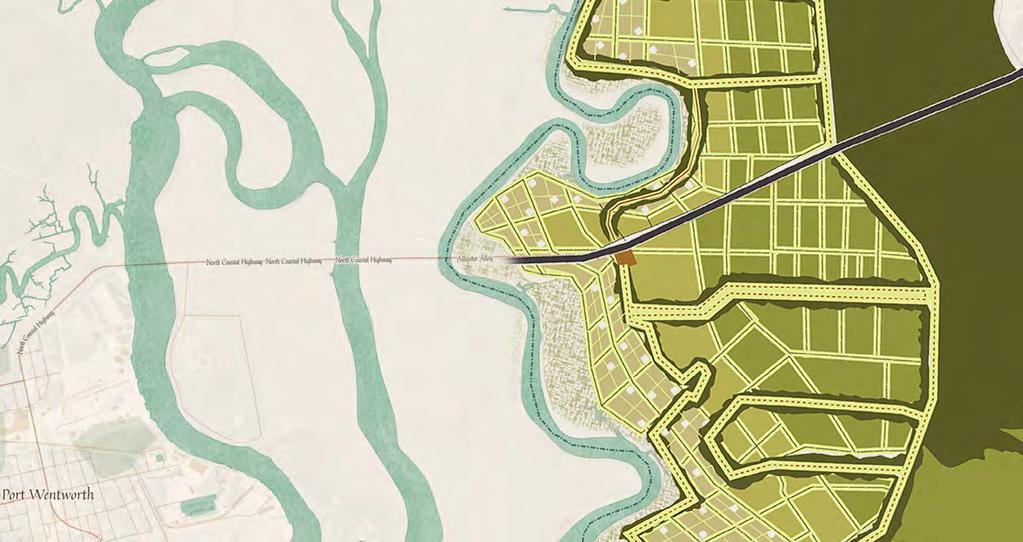

23 SALT HARVESTING SAVANNAH NATIONAL WILDLIFE REFUGE

24


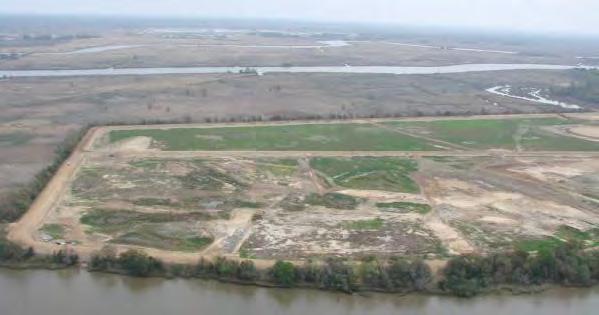
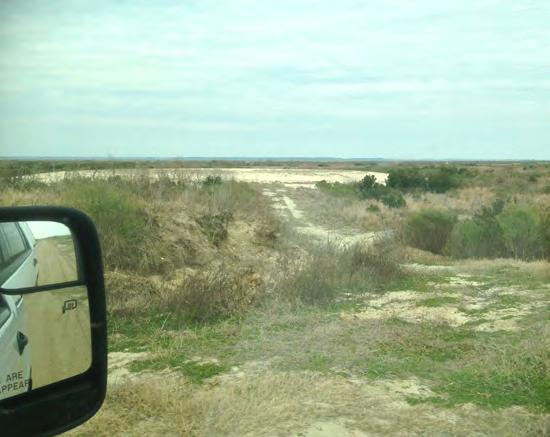
25 SPOILS TRAIL FORMER CONTAINMENT AREAS

26


= 4,800")


27 DREDGE BRICKWORKS SAVANNAH RIVER LANDINGS Dredge House X 1 = 120 cubic yards X 40 (1 street)= 4,800 cubic yards X 7,000 (Hutchinson + River Landings)= 800,000 cubic yards

28


29 HUTCHINSON HUB HUTCHINSON ISLAND

30


31 CSS GA MEMORIAL RAISED LOOKOUT POINT

32


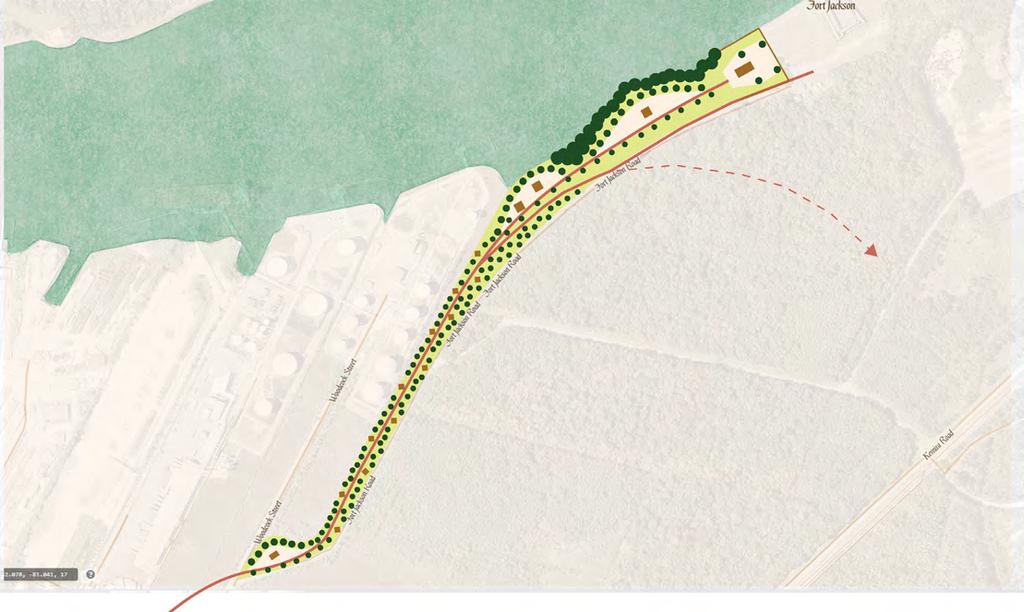
33 MCQUEEN S TRAIL MCQUEEN S ISLAND TO DOWNTOWN

34
 0.")
 Sand Motor 0.4 Million yd³ urban drainage areas Stable Ground Construction Stable Ground Construction 300,000 Future Maintenence 1.6 Million yd³ 1 Million yd³ 1.4 Million yd³ 5.")
35 DREDGEMOMETER Makes dredge measuring a SMAPT (Strategic Mapping Action Plan Transposed) SNWR Salt Harvesting Berm (Salt+Trail) Wetland Creation 1 Million yd³.8 Million yd³ Future Maintenence Future Maintenence Dredge Neutral 12.9 million yd³ 14.7 million yd³ Berm (Trail) 0.6 Million yd³ Future Maintenence Hutchinson Island River Landings CSS Georgia Memorial McQueen s Trail Wetland Creation Construction Fill Dredge Brick Berm (Trail) Dredge Brick Viewing Area Berm (Trail) Sand Motor 0.4 Million yd³ urban drainage areas Stable Ground Construction Stable Ground Construction 300,000 Future Maintenence 1.6 Million yd³ 1 Million yd³ 1.4 Million yd³ 5.4 million yd³ 1 Million yd³ Future Maintenence Unstable Ground Construction 9.3 million yd³ Future Maintenence 8.6 million yd³ Future Maintenence 0.8 Million yd³ 7.8 million yd³ Future Maintenence 1 Million yd³ Future Maintenence Future Maintenence Dredge Material: 2 million Cubic Yard increments Future Maintenence Berm (Trail) 1.2 Million yd³ Spoils Trail Bird Islands 2.6 Million yd³ Porous Edge 0 yd³ 1.6 Million yd³ Future Maintenence
36
Lower Income Journey to Work Market Share From American Community Survey
 Lower Income Journey to Work Market Share From American Community Survey 2006-2010 Table 1: Overall National Data Table 2: Car, Truck or Van Table 3: Transit Table 4: Metrics Table 1 Work Trip Market Share:
MANGO MARKET DEVELOPMENT INDEX REPORT
 MANGO MARKET DEVELOPMENT INDEX REPORT 2015-2016 UNDERSTANDING THE MARKET INDEX The Mango Market Development Index is designed to measure and compare mango sales volume relative to population by region
Monthly Employment Watch: Milwaukee and the Nation's Largest Cities
 Monthly Employment Watch: Milwaukee and the Nation's Largest Cities A monthly report on employment trends in the nation s largest cities Prepared by: The University of Wisconsin-Milwaukee Center for Economic
University of Denver
 Glenn R. Mueller, Ph.D. Professor University of Denver Franklin L. Burns School of Real Estate & Construction Management & Real Estate Investment Strategist glenn.mueller@du.edu Supply The new supply of
Monthly Employment Watch: Milwaukee and the Nation's Largest Cities
 Monthly Employment Watch: Milwaukee and the Nation's Largest Cities A monthly report on employment trends in the nation s largest cities Prepared by: The University of Wisconsin-Milwaukee Center for Economic
Mango Market Development Index
 Mango Market Development Index 2016-2017 Understanding the Market Index The Mango Market Development Index is designed to measure and compare mango volume sold at retail relative to population by region
Communicating the Importance of Seaports. Bringin It Home. Presented to AAPA Annual Convention Galveston, TX October 27, 2009
 Communicating the Importance of Seaports Bringin It Home Presented to AAPA Annual Convention Galveston, TX October 27, 2009 Jim Kruse Director, Center for Ports & Waterways Texas Transportation Institute
Hotel Valuation and Transaction Trends for the U.S. Lodging Industry
 Hotel Valuation and Transaction Trends for the U.S. Lodging Industry June 2010 Presented by Steve Rushmore, MAI, FRICS, CHA srushmore@hvs.com - 1 - Value Trend for a Typical U.S. Hotel 1987 1988 1989 1990
Interest Bearing. Availability Schedule. April For Encoded Cash Letter Deposits received in Miami. Instructions. Schedule
 Instructions Schedule Bank of America OnUs Supplemental Interest Bearing Availability Schedule For Encoded Cash Letter Deposits received in Miami April 2011 Schedule 01 Availability Schedule for Corporate
Auto Port Operational Strategy. Roy A. Schleicher Senior Director Trade Development & Global Marketing
 Auto Port Operational Strategy Roy A. Schleicher Senior Director Trade Development & Global Marketing October 2008 Strategic location of Jacksonville, Florida 10 75 95 Jacksonville Strategic location of
Union Pacific Update September 22, 2016 North East Association of Rail Shippers Conference
 Union Pacific Update September 22, 2016 North East Association of Rail Shippers Conference I Sam Calabro Assistant Vice President Domestic Intermodal Sales 1 Seattle Eastport Portland Twin Cities Duluth
Westshore Development Forum April 11, Hillsborough County Aviation Authority
 Westshore Development Forum April 11, 2017 Aviation in Florida Only state with four large hub airports $144 billion in annual economic activity or output Approximately 43.1 million visitors come to Florida
PUBLIC TRANSPORTATION INTRODUCTION
 PUBLIC TRANSPORTATION INTRODUCTION 1 OUTLINE Current Status and Recent Trends Significant Influences A Critical Assessment Arguments Supporting Public Transport Future Influences Ingredients for Future
1301 Wigmore St. Jacksonville, Fl 32206
 For Sale Industrial Waterfront Opportunity Shipping Channel Depth of 40 ± 1301 Wigmore St. Jacksonville, Fl 32206 Land Size: 39.5 acres Zoned: Waterfront Industrial Rail: NS active rail spur and rail lines
Parking Property Advisors and Parkopedia present: TOP 40 US CITIES PARKING INDEX
 Parking Property Advisors and Parkopedia present: TOP 40 US CITIES PARKING INDEX 2018 Parking Property Advisors and Parkopedia proudly present this 2018 Top 40 US Cities Parking Index. Whether you are
A COMPARISON OF THE MILWAUKEE METROPOLITAN AREA TO ITS PEERS
 KRY/WJS/EDL #222377 (PDF: #223479) 1/30/15 PRELIMINARY DRAFT Memorandum Report A COMPARISON OF THE MILWAUKEE METROPOLITAN AREA TO ITS PEERS EXECUTIVE SUMMARY This memorandum report provides a statistical
Monthly Employment Watch: Milwaukee and the Nation's Largest Cities
 Monthly Employment Watch: Milwaukee and the Nation's Largest Cities A monthly report on employment trends in the nation s largest cities Prepared by: The University of Wisconsin-Milwaukee Center for Economic
Park-Related Total* Expenditure per Resident, by City
 Park-Related Total* per Resident, by City FY 2008 City Population Total Park per Resident Washington, D.C. 591,833 $153,324,830 $259 Seattle 598,541 $150,672,543 $252 Scottsdale 235,371 $50,429,049 $214
U.S. Lodging Industry Update
 U.S. Lodging Industry Update First Watch on a Long Voyage R. MARK WOODWORTH AMERICAS RESEARCH AGENDA THE ECONOMY WHAT COULD END THE CURRENT CYCLE? LABOR COSTS OUR FORECASTS SHARING ECONOMY UPDATE First
Monthly Employment Watch: Milwaukee and the Nation's Largest Cities
 Monthly Employment Watch: Milwaukee and the Nation's Largest Cities A monthly report on employment trends in the nation s largest cities Prepared by: The University of Wisconsin-Milwaukee Center for Economic
Strategic Central Florida Location Big Bend Road & U.S. Highway 41
 Strategic Central Florida Location Big Bend Road & U.S. Highway 41 Park Highlights 337,447 SF (Building 13124) under construction June 2017 occupancy Cross-Dock 101 Trailer Spaces 1.5 miles from I-75 8
MINNEAPOLIS TOURISM MASTER PLAN STEERING COMMITTEE MEETING AUGUST 24, 2016
 MINNEAPOLIS TOURISM MASTER PLAN STEERING COMMITTEE MEETING AUGUST 24, 2016 TODAY S AGENDA Welcome & Introductions: Bill Background & Today s Objectives: Bill Co-Chairs Comments Mayor Hodges David Berg
94% occupancy weighted average remaining lease term of an astounding 9.87 years
 A R L I N G T O N, T E X A S O F F E R I N G S U M M A R Y EXECUTIVE OVERVIEW Colliers International is pleased to exclusively offer to qualified investors the opportunity to purchase Centerpoint I, II
Rank Place State Native Hawaiian and Pacific Islander population (alone or in combination
 TABLE 2a: 100 Largest Places Ranked by Number of s (race alone or in *) Living in Hard-to- Census Rank Place State (alone or in 1 Honolulu (CDP) HI 64,196 11,130 17.3 2 New York City NY 14,981 8,211 54.8
Waterways Council November 10, 2017
 Waterways Council November 10, 2017 MULTI-PURPOSE LANDLORD PORT The Port of New Orleans generates its own revenues as a multipurpose landlord port. Cargo 69%; cruise 21%; real estate 10% Diversity increases
Emerging Trends in Real Estate Sustaining Momentum but Taking Nothing for Granted
 Emerging Trends in Real Estate 2015 Sustaining Momentum but Taking Nothing for Granted PwC-ULI Outlook on trends 36th edition 368 interviews 1,055 survey responses 1,400+ participants, a record Who? District
Monthly Employment Watch: Milwaukee and the Nation's Largest Cities
 Monthly Employment Watch: Milwaukee and the Nation's Largest Cities A monthly report on employment trends in the nation s largest cities Prepared by: The University of Wisconsin-Milwaukee Center for Economic
Factors Influencing Visitor's Choices of Urban Destinations in North America
 Factors Influencing Visitor's Choices of Urban Destinations in North America Ontario Ministry of Tourism and Recreation May 21, 2004 Study conducted by Global Insight Inc. Executive Summary A. Introduction:
Monthly Employment Watch: Milwaukee and the Nation's Largest Cities
 Monthly Employment Watch: Milwaukee and the Nation's Largest Cities A monthly report on employment trends in the nation s largest cities Prepared by: The University of Wisconsin-Milwaukee Center for Economic
High-Speed Rail: Realizing the Potential of Megaregion Economies
 High-Speed Rail: Realizing the Potential of Megaregion Economies Petra Todorovich Director, America 2050 Regional Plan Association May 4, 2010 Rayburn House Office Building 1 2 1 Where High-Speed Rail
Airport development within VINCI
 Airport development within VINCI 1 The airport sector: a development goal since 1995 VINCI Concessions: a portfolio of outstanding airport concessions 22 airports in Mexico 2 airports in Cambodia: Phnom
Cat Island Chain Background & Access Guide
 Cat Chain Background & Access Guide Brown County Port & Resource Recovery Department 2561 S. Broadway, Green Bay, WI 54304 (920) 492-4950 www.portofgreenbay.com January 2018 1 Restoration of the Cat Chain
Pre-Response Meeting RLI # AV-01 Food & Beverage Service Terminals 1 & 2
 Pre-Response Meeting RLI #20120821-AV-01 Food & Beverage Service Terminals 1 & 2 January 17, 2013 FLL in Perspective 2011- FLL ranked as the 21 st busiest airport in the U.S. with 23,349,835 total passengers
MIAMI INTERNATIONAL REAL ESTATE CONGRESS ERIC OLAFSON MANAGER TRADE DEVELOPMENT
 MIAMI INTERNATIONAL REAL ESTATE CONGRESS ERIC OLAFSON MANAGER TRADE DEVELOPMENT Economic Impact One of Miami-Dade County s Principal Economic Engines 207,000 jobs $27 Billion annually 2 Cruise Capital
Girl Friends, Inc. ca
 Sc MG 415 Girl Friends, Inc. ca. 1939-2002 NEW YORK PUBLIC LIBRARY Schomburg Center for Research in Black Culture 515 Malcolm X Boulevard New York, New York 10037-1801 Bulk Dates: 1939-2002 Extent: Linear
RANKING OF THE 100 MOST POPULOUS U.S. CITIES 12/7/ /31/2016
 OVERVIEW OF THE DATA The following information is based on incoming communication to the National Human Trafficking Hotline via phone, email, and online tip report from December 7, 2007 December 31, 2016
CROSSGATE Highway 21, Port Wentworth, GA
 Highway 21, Port Wentworth, GA Manufacturing (Zoned EDZ) ± 256 AC. Commercial (Zoned PC-3) ± 27 AC. 1/2 Mile From the Port of Savannah 21 5.6 AC 3 MILES TO I-95 I Port of Savannah H F 29.8 AC G 18.6 AC
Location, Location, Location. 19 th Annual NIC Conference NIC MAP Data & Analysis Service
 Location, Location, Location 19 th Annual NIC Conference NIC MAP Data & Analysis Service The Great Occupancy Decline 94% Occupancy Trends Majority Nursing Seniors Housing 93% 92% 91% 92.8% 91.0% 90% 89%
INDIANA INTERSTATE AND INTRASTATE LOCAL REDUCED CITY-PAIR FARES
 The following section contains city-pair fares that are lower than walkup mileage-based fares. Although shown in only one direction, the fares in this section apply in both directions, unless otherwise
REGIONALLY FOCUSED. GLOBALLY COMPETITIVE.
 ABOUT EDC WHO WE ARE Mission: San Diego Regional Economic Development Corporation s mission is to maximize the region s economic prosperity and global competitiveness. Vision: The San Diego Region will
Major Metropolitan Area Sales Tax Rates
 August 19, 2010 No. 239 FISCAL FACT Major Metropolitan Area Sales Tax Rates By Lawrence Summers Introduction General sales taxes levied by state, county and city governments in the United States vary greatly,
Glenn R. Mueller, Ph.D. Professor University of Denver. Franklin L. Burns School of Real Estate & Construction Management & Dividend Capital Research
 Real Estate Cycles Glenn R. Mueller, Ph.D. Professor University of Denver Franklin L. Burns School of Real Estate & Construction Management & Real Estate Investment Strategist Dividend Capital Research
ILLINOIS INTERSTATE AND INTRASTATE LOCAL REDUCED CITY-PAIR FARES
 The following section contains city-pair fares that are lower than walkup mileage-based fares. Although shown in only one direction, the fares in this section apply in both directions, unless otherwise
Higher Education in America s Metropolitan Areas A Statistical Profile
 Higher Education in America s Metropolitan Areas A Statistical Profile MSA Study No.2 Higher Education in America s Metropolitan Areas A Statistical Profile CONTENTS Why Metro Areas? 1 Executive Summary
Appendix D: Aggregation Error for New England Metro Areas and for Places
 Appendix D: for New England Metro Areas and for Places D-1 Appendix D: s Figure D-1: New England Metro Areas - Summary of Tract s (2000) Metro ID (msapma99) Metro Area Name Census NCDB 1120 Boston, MA-NH
CONNECTICUT INTERSTATE AND INTRASTATE LOCAL REDUCED CITY-PAIR FARES
 PASSENGER TARIFF AND SALES MANUAL CONNECTICUT INTERSTATE AND INTRASTATE LOCAL REDUCED CITY-PAIR S The following section contains city-pair fares that are lower than walkup mileage-based fares. Although
Access Across America: Transit 2014
 Access Across America: Transit 2014 Final Report CTS 14-11 Prepared by: Andrew Owen David Levinson Accessibility Observatory Department of Civil, Environmental, and Geo- Engineering University of Minnesota
University of Denver. Dividend Capital Research
 Glenn R. Mueller, Ph.D. Professor University of Denver Franklin L. Burns School of Real Estate & Construction Management & Real Estate Investment Strategist Dividend Capital Research glenn.mueller@du.edu
Q U.S. HOTEL FIGURES
 Q4 2017 U.S. HOTEL FIGURES Q4 2017 U.S. HOTEL FIGURES EXECUTIVE SUMMARY HURRICANES, RISING INCOMES DRIVE STRONG YEAR-END DEMAND GROWTH Demand 3.7% Supply 1.9% Occupancy 1.8% ADR 2.4% RevPAR 4.2% Arrows
Census Affects Children in Poverty by Professors Donald Hernandez and Nancy Denton State University of New York, Albany
 Phone: (301) 457-9900 4700 Silver Hill Road, Suite 1250-3, Suitland, MD 20746 Fax: (301) 457-9901 Census Affects in Poverty by Professors Donald Hernandez and Nancy Denton State University of New York,
Social Media In Your New & Improved Phoenix Sky Harbor
 Social Media In Your New & Improved Phoenix Sky Harbor AZ Chapter of HSMAI September 19, 2013 It always begins & ends with: skyharbor.com Began Facebook page in October 2010 More than 27,000 people Like
MARKETBEAT U.S. Office
 MARKETBEAT U.S. Office Q4 2018 U.S. OFFICE Employment Indicators Market Indicators (Overall) Office: Net Absorption/Asking Rent 4Q TRAILING AVERAGE Office: Overall Vacancy Q4 17 Q4 18 Total Nonfarm Employment
Glenn R. Mueller, Ph.D. Professor University of Denver. Franklin L. Burns School of Real Estate & Construction Management &
 Real Estate Cycles Glenn R. Mueller, Ph.D. Professor University of Denver Franklin L. Burns School of Real Estate & Construction Management & Real Estate Investment Strategist Dividend Capital Research
2012 Airport Ground Transportation
 212 Airport Ground Transportation Fees and Fares Survey Summary March 212 AGTA 212 Airport Fees and Fares Survey Summary Survey Respondents Atlantic City International Airport Gulfport-Biloxi International
600 mile radius. Easton is located within 600 miles of 60% of the population in the United States. Buffalo 320 miles.
 The Town Center By Which All Others Are Measured Easton is within easy reach of all of the Columbus metroplex, and to some of the nation s largest population centers. Strategically located in the heart
MARKETBEAT U.S. Office
 MARKETBEAT U.S. Office Q2 2017 U.S. OFFICE Employment Indicators Q2 16 Q2 17 Total Nonfarm Employment 143.9M 146.2M Office-using Employment 30.1M 31.8M Unemployment 4.9% 4.4% Source: BLS Market Indicators
FBI Drug Demand Reduction Coordinators
 FBI Drug Demand Reduction Coordinators Alabama 2121 Building, Room 1400 Birmingham, AL 35203 (205) 252 7705 One St. Louis Centre One St. Louis Street Mobile, AL 36602 (334) 438 3674 Alaska 222 West Seventh
TOP 100. Transit Bus Fleets Agency 35 ft. Over Artic and 35 ft. Total +/- under 0 3, ,426 82
 L.A. Metro-No. 3 1 1 MTA New York City Transit New York City 2 2 New Jersey Transit Corp. Newark, N.J. 3 3 Metro Los Angeles 4 5 Toronto Transit Commission Toronto 5 10 Chicago Transit Authority Chicago
BLACK KNIGHT HPI REPORT
 CONTENTS 1 OVERVIEW 2 NATIONAL OVERVIEW 3 LARGEST STATES AND METROS 4 FEBRUARY S BIGGEST MOVERS 5 20 LARGEST STATES 6 40 LARGEST METROS 7 ADDITIONAL INFORMATION OVERVIEW Each month, the Data & Analytics
Agency 35 ft. Over Artic. Trolley 2012 Total and 35 ft. under. 1 1 MTA New York City Transit 0 3, ,344 New York City
 Capital Metro-No. 40 Courtesy Capital Metro 1 1 MTA New York City Transit 0 3,704 640 0 4,344 New York City 2 3 New Jersey Transit Corp. 47 2,263 85 0 2,395 Newark, N.J. 3 2 Metro 50 1,956 378 0 2,384
WILL TOMORROW BE BETTER THAN YESTERDAY?
 CBRE HOTELS The World s Leading Hotel Experts. WILL TOMORROW BE BETTER THAN YESTERDAY? HOTEL SECTOR UPDATE OCTOBER 31, 2017 THE AGENDA 1. U.S. Lodging Market The Macro-Economy and Hotels The Changing Traveler
OBSERVERS. We shall not be moved NAACP. national Convention. advance registration form. 104 th ANNUAL CONVENTION
 OBSERVERS We shall not be moved 104 NAACP th national Convention advance registration form orlando, florida July 13-17, 2013 1 AT-LARGE OBSERVERS advanced registration Section I CONTACT INFORMATION (Please
The Panama Canal Expansion: Myths and Realities for the North American Economy
 2015 Center for Transportation Studies Research Conference, University of Minnesota The Panama Canal Expansion: Myths and Realities for the North American Economy Jean-Paul Rodrigue Professor, Dept. of
333 W. Campbell Road, Suite 440 Richardson, Texas Cruising for Charity with Randy Limbacher in Tahiti July 28, 2007
 333 W. Campbell Road, Suite 440 Richardson, Texas 75080 972.238.1998 800.952.1998 Cruising for Charity with Randy Limbacher in Tahiti July 28, 2007 Join me for this special annual event to raise money
San Francisco Travel Association Selling in a Seller s Market DMO Perspective. May 21, 2014
 San Francisco Travel Association Selling in a Seller s Market DMO Perspective May 21, 2014 Agenda Discussion Themes 1. Meetings Are Important 2. Market Meetings Pace 3. Occupancy & Rate 4. Booking Windows
Hector International Airport Fargo, North Dakota
 Hector International Airport Fargo, North Dakota Volume 073 Twelve Months Ended September 2007 January 2008 Airlines Serving Fargo Carried 831 Onboard Passengers Per Day for the Twelve Months Ended September
Delta Already Has Access to 79 Percent of U.S.-Rome Traffic with Its JFK Service
 Already Has Access to 79 Percent of U.S.-Rome Traffic with Its Service Philadelphia R-103 (Rebuttal to -103) Seattle Portland Salt Lake City Denver Chicago Detroit Cleveland Columbus Dayton Pittsburgh
Engineering With Nature Geographic Project Mapping Tool (EWN ProMap)
") Engineering With Nature Geographic Project Mapping Tool (EWN ProMap) Cynthia Banks Program Manager Burton Suedel, PhD Research Biologist Michelle Bourne Research Biologist U.S. Army ERDC 23 June 2015 Dredging
Engineering With Nature Geographic Project Mapping Tool (EWN ProMap) Cynthia Banks Program Manager Burton Suedel, PhD Research Biologist Michelle Bourne Research Biologist U.S. Army ERDC 23 June 2015 Dredging
Hector International Airport Fargo, North Dakota
 Hector International Airport Fargo, North Dakota Volume 072 Twelve Months Ended June 2007 November 2007 Airlines Serving Fargo Carried 830 Onboard Passengers Per Day for the Twelve Months Ended June 2007,
Norwegian's Free Airfare Promotion
 Norwegian's Free Airfare Promotion Start planning your next vacation with 200+ cruises to incredible destinations, including Alaska, Bahamas & Florida, Bermuda, Canada & New England, Caribbean, Mexican
American Institute of Marine Underwriters
 American Institute of Marine Underwriters Mr. Scott Bergeron Chief Executive Officer, Liberian Registry Commissioner, Virginia Port Authority May 8, 2013 1 Existing Lock Dimensions vs. Expanded Lock Dimensions
August Air Traffic Statistics. Prepared by the Office of Corporate Risk and Strategy
 August 215 Air Traffic Statistics Prepared by the Office of Corporate Risk and Strategy Metropolitan Washington Airports Authority Air Traffic Statistics Table of Contents Summary Air Traffic Summary...
16,000 50,000 WALKATHON CITIES WALKERS MILES
 WALKATHON 54 USA ARIZONA Phoenix ARKANSAS Little Rock CALIFORNIA Fresno Los Angeles Sacramento San Diego San Francisco San Jose CONNECTICUT Hartford DELAWARE New Castle FLORIDA Miami Orlando Tampa GEORGIA
MARKETBEAT U.S. Office
 MARKETBEAT U.S. Office Q4 2017 U.S. OFFICE Employment Indicators Q4 16 Q4 17 Total Nonfarm Employment 145.2M 147.2M Office-using Employment 31.5M 32.1M Unemployment 4.7% 4.1% Source: BLS Market Indicators
Population Estimates for U.S. Cities Report 1: Fastest Growing Cities Based on Numeric Increase,
 ulation s for U.S. Cities Report 1: Fastest Growing Cities Based on Numeric Increase, 2015-2015 1 Phoenix AZ 32,113 2.0 1,582,904 1,615,017 167,393 11.6 2 Los Angeles CA 27,173 0.7 3,949,149 3,976,322
Who Sprawls the Most?
 SPRAWL AMERICAN STYLE Who Sprawls the Most? Jackie Cutsinger Research Assistant, Center for Urban Studies Wayne State University Measuring Sprawl in Major Metros Regionally stratified, nationally representative
A COMPARISON OF THE MILWAUKEE METROPOLITAN AREA TO ITS PEERS
 KRY/WJS/EDL #222377 v4 (PDF: #223479v2) 4/1/15 APPENDIX D REVISED DRAFT Memorandum Report A COMPARISON OF THE MILWAUKEE METROPOLITAN AREA TO ITS PEERS EXECUTIVE SUMMARY This report provides a statistical
MARKETBEAT U.S. Office
 MARKETBEAT U.S. Office Q3 2018 U.S. OFFICE Employment Indicators Market Indicators (Overall) Office: Net Absorption/Asking Rent 4Q TRAILING AVERAGE Office: Overall Vacancy Q3 17 Q3 18 Total Nonfarm Employment
An unforgettable experience for middle school students July 2016
 An unforgettable experience for middle school students What is ISCA? 11 31 July 2016 3 week exhilarating travel program to England: designed specifically for middle school students Cultural, historic &
Fort Lauderdale August 8, 2017
 Fort Lauderdale August 8, 2017 8/10/2017 TAP Software Analytics Division Brian Finucane TAP Reports Jeff Eastman TAP Hotel Reports Jeanne Eastman TAP Data Source Jeff Eastman Cloud Database Numerous Data
National Housing Trends
 National Housing Trends America s Choice of Best Long Term Investment Gallup 2017 The Cost of RENTING vs. BUYING HISTORICALLY: NOW: Percentage of Income Needed to Afford Median Rent 25.8% 29.2% Percentage
OB-GYN Workload & Potential Shortages: The Coming U.S. Women s Health Crisis
 OB-GYN Workload & Potential Shortages: The Coming U.S. Women s Health Crisis JULY 2017 Introduction Obstetricians and Gynecologists (OB-GYNs) are a critical part of the health care provider community.
Philadelphia Regional Port Authority. Channel Deepening Briefing to the Delaware Valley Goods Movement Task Force Our Port Our Legacy
 Philadelphia Regional Port Authority Channel Deepening Briefing to the Delaware Valley Goods Movement Task Force Our Port Our Legacy April 19, 2006 Philadelphia Regional Port Authority The Philadelphia
U.S. Office Snapshot Q1 2016
 MARKETBEAT U.S. Office Snapshot Q1 2016 U.S. OFFICE Employment Indicators Q1 15 Q1 16 Total Nonfarm Employment 140.8M 143.5M Offi ce-using Employment 30.2M 31.0M Unemployment 5.6% 4.9% Source: BLS Market
MARKETBEAT U.S. Office
 MARKETBEAT U.S. Office Q3 2017 U.S. OFFICE Employment Indicators Net Absorption/Rent 4-QTR TRAILING AVERAGE Q3 16 Q3 17 Total Nonfarm Employment 144.7M 146.6M Office-using Employment 31.3M 31.9M Unemployment
FLL s international traffic has tripled in the last 10 years and it is now 16% of total traffic
 FLL in Perspective FLL in Perspective 2013- FLL ranked as the 21 st busiest airport in the U.S. with 23,559,779 total passengers, 15 th in international passengers and 13 th in domestic Origin and Destination
Brightline Overview THE ONLY PRIVATELY OWNED, OPERATED AND MAINTAINED EXPRESS INTER-CITY TRAIN SERVICE IN THE UNITED STATES
 FSITE ANNUAL MEETING BEN PORRITT, SVP, CORPORATE AFFAIRS OCTOBER 30, 2018 Brightline Overview THE ONLY PRIVATELY OWNED, OPERATED AND MAINTAINED EXPRESS INTER-CITY TRAIN SERVICE IN THE UNITED STATES Removing
NAFTA Next Chicago, Illinois April 23 rd, 2014
 NAFTA Next Chicago, Illinois April 23 rd, 2014 IMPORTANCE OF THE PORT OF MIAMI TO FLORIDA/U.S. One of the top container seaports in Florida Second largest economic engine of Miami-Dade County Number 11
A S S E T P O R T F O L I O
 ASSET PORTFOLIO TABLE OF CONTENTS (IN ALPHABETICAL ORDER) LUXURY HOTELS Andaz Napa 1 Andaz San Diego 3 Andaz Savannah 5 Fairmont Dallas 7 Hotel Commonwealth 9 Loews New Orleans Hotel 11 The Ritz-Carlton,
Metropolitan Votes and the 2012 U.S. Election: Population, GDP, Patents and Creative Class
 politan Votes and the 2012 U.S. Election: Population, GDP, Patents and Creative Class Author: Shawn Gilligan, Shawn.Gilligan@rotman.utoronto.ca Zara Matheson, Zara.Matheson@rotman.utoronto.ca Kevin Stolarick,
 Snakes & Lattes is currently composed of three corporate owned and operated board game cafes in Toronto, ON. Over the last 7 years these have become renowned as Toronto's premiere board game cafe destinations.
MARKETBEAT U.S. Office
 MARKETBEAT U.S. Office Q1 2017 U.S. OFFICE Employment Indicators Q1 16 Q1 17 Total Nonfarm Employment 143.4M 145.7M Offi ce-using Employment 30.9M 31.7M Unemployment 4.9% 4.6% Source: BLS Market Indicators
Office Markets Beginning to Show Signs of Bottoming Out
 OFFiCE north america HIGHLIGHTS Office Markets Beginning to Show Signs of Bottoming Out MarKet indicators Relative to prior period VaCanCY net absorption ConstrUCtion Q2 Q3 * ross J. Moore Chief Economist
MARKETBEAT U.S. Office
 MARKETBEAT U.S. Office Q4 2016 U.S. OFFICE Employment Indicators Market Indicators (Overall) Q4 15 Q4 16 Vacancy Rate 13.5% 13.2% Net Absorption 20.5M 6.9M Under Construction 94.5M 100.2M Weighted Asking
TOP 100 Bus Fleets Agency 35 ft. and Over Artic under 35 ft. Total. 18 < metro magazine SEPTEMBER/OCTOBER 2018 metro-magazine.
 1 1 MTA New York City Transit/MTA Bus Co. 0 4,860 951 5,811 New York City 2 3 New Jersey Transit Corp. 418 2,879 85 3,382 Newark, N.J. 3 2 Los Angeles County Metropolitan Transportation Authority 50 1,882
State of the Airport Robert S. Bowen, Executive Director October 18, 2018
 Robert S. Bowen, Executive Director October 18, 2018 A Year of Change The last year will be remembered as a period when the airlines, bolstered by a growing national economy, moderate fuel prices and changing
DIRECT FASTENING. 20V MAX * Cordless Concrete Nailer
 DIRECT FASTENING 20V MAX * Cordless INTERCHANGEABLE CONTACT TRIPS Drywall and Mechanical contact trips for application versatility Removable; tool-free ADJUSTABLE POWER 3 settings for pin depth adjustment
Get Smart Market Insights from Our Research Team Customer Conference
 Get Smart Market Insights from Our Research Team 217 Customer Conference Presenters Amanda Nunnink Amanda Nunnink Steve Steve Guggenmos Guggenmos Sara Steve Hoffman Griffin Steve Sara Griffin Hoffmann
Delta and Minnesota. January 29, 2015
 Delta and Minnesota January 29, 2015 Delta & Minnesota: By The Numbers 456 Delta peak-day departures from Minneapolis/St. Paul 2 MSP is Delta s 2 nd largest hub (Seat departures July 2014) 145 Total nonstop
October Air Traffic Statistics. Prepared by the Office of Corporate Risk and Strategy
 October 214 Air Traffic Statistics Prepared by the Office of Corporate Risk and Strategy Metropolitan Washington Airports Authority Air Traffic Statistics Table of Contents Summary Air Traffic Summary...