Pre-Response Meeting RLI # AV-01 Food & Beverage Service Terminals 1 & 2
|
|
|
- Gregory McDonald
- 6 years ago
- Views:
Transcription


1 Pre-Response Meeting RLI # AV-01 Food & Beverage Service Terminals 1 & 2 January 17, 2013
2 FLL in Perspective FLL ranked as the 21 st busiest airport in the U.S. with 23,349,835 total passengers and ranked 13 th in domestic Origin and Destination traffic 2012 January through November total traffic was 21,417,511, up slightly over last year FLL s total traffic has increased by 42% in the last 10 years. During that period, international traffic has tripled and it is now 15% of total traffic FLL has nonstop service to every major market in the U.S. FLL s domestic fares are the lowest among Large Hub airports- 19% less than MIA and 12% less than PBI

3 FLL Top Carriers 2012 Others, 6.8% Airtran, 5.3% US Airways, 6.9% American, 5.1% Air Canada, 2.0% Spirit, 18.6% Virgin, 1.7% JetBlue, 17.8% Delta, 13.2% Southwest, 14.8% United, 7.8%
4 Airline Locations Terminal 1 Terminal 2 Terminal 3 Terminal 4 Concourse B Air Canada Concourse E Avianca Alaska Delta Bahamasair Air Transat Allegiant Canjet Caribbean Frontier Skyservice Spirit Midwest Sunwing Condor Southwest Westjet International Arrivals Concourse C Airtran United Silver Virgin America American Tiara Air Aruba Concourse F jetblue

5 Terminal Share Outbound Schedule Capacity (Seats) 2012 Terminal 4 3,034,964 22% Terminal 1 4,564,347 32% Terminal 3 4,383,700 31% Terminal 2 2,086,486 15%
6 Flights and Destinations Terminal 1, Concourse B Destination Flights Per Day Destination Flights Per Day Albany 1.0 Lexington 0.3 Austin 1.0 Kansas City 1.0 Asheville 0.3 Orlando 0.5 Hartford 1.0 Chicago-Midway 3.4 Birmingham 0.2 Manchester 1.0 Nashville 2.0 Milwaukee 1.0 Buffalo 1.1 New Orleans 2.7 Baltimore 4.6 Plattsburgh 0.5 Denver 3.4 Philadelphia 2.0 Grand Rapids 0.3 Phoenix 0.7 Greenville/Spartanburg 0.3 Providence 1.1 Houston-Hobby 2.0 Raleigh/Durham 1.0 Huntington 0.3 Seattle/Tacoma 1.0 Long Island-Macarthur 2.0 St. Louis 1.0 Jacksonville 3.7 Tampa 4.9 Las Vegas 1.0 Knoxville 0.3 Total 46.5
7 Terminal 1, Concourse B Projected Capacity Airline 2012 Q Q1 Diff % Diff Alaska Airlines 14,130 14,130 Frontier Airlines 32,568 20,916-11, % Allegiant Air 34,500 37,018 2, % Southwest Airlines 605, ,381-26, % Total 672, ,445-21, % Airline 2012 Q Q2 Diff % Diff Alaska Airlines 14,287 14,287 Frontier Airlines 19,437 20,640 1, % Allegiant Air 28,950 43,326 14, % Southwest Airlines 581, ,475-76, % Total 630, ,728-46, %
8 Flights and Destinations Terminal 1, Concourse C Destination Flights Per Day Destination Flights Per Day Atlanta 8.0 Houston 4.7 Bimini 0.7 Indianapolis 1.2 Baltimore 5.9 Los Angeles 2.6 Cleveland 1.7 Orlando 2.0 Columbus 1.0 Marsh Harbour 1.0 Denver 1.1 Chicago-O'Hare 2.0 North Eleuthera 1.0 Philadelphia 1.0 Newark 7.2 Pittsburgh 1.2 Key West 2.0 San Francisco 1.8 Freeport 2.0 San Juan 2.0 George Town 0.9 Treasure Cay 1.0 Governors Harbour 0.7 Tallahassee 1.6 Gainesville 0.4 Tampa 3.0 Washington-Dulles 1.1 Total 58.9
9 Terminal 1, Concourse C Projected Capacity Airline 2012 Q Q1 Diff % Diff Silver Airways Corp. 33,796 49,921 16, % AirTran Airways 167, ,847 53, % United Airlines 247, ,127 33, % Virgin America 71,523 58,392-13, % Total 520, ,287 90, % Airline 2012 Q Q2 Diff % Diff Silver Airways Corp. 49,236 55,760 6, % AirTran Airways 185, ,791 76, % United Airlines 239, ,980-4, % Virgin America 58,464 53,425-5, % Total 531, ,956 74, %
10 Flights and Destinations Terminal 2 Destination Flights Per Day Atlanta 12.5 Cincinnati 1.1 Detroit 5.8 New York-JFK 2.8 New York-La Guardia 5.5 Memphis 0.9 Minneapolis/St. Paul 1.7 Tallahassee 0.8 Ottawa 1.0 Montreal 3.8 Toronto 4.5 Total 40.3
11 Terminal 2 Projected Capacity Airline 2012 Q Q1 Diff % Diff Air Canada 123, ,838 9, % Delta Air Lines 479, ,858 8, % Total 602, ,696 17, % Airline 2012 Q Q2 Diff % Diff Air Canada 52,331 74,722 22, % Delta Air Lines 448, ,820-15, % Total 501, ,542 7, %
12 Traffic Outlook FAA Terminal Area Forecast (FY) January 2012 YOY % Change 30,000,000 25,000,000.5% 2.9% 3.1% 3.0% 2.5% 2.5% 20,000,000 15,000,000 10,000,000 5,000,

13 Building for the Future

14 Airport Expansion Terminal 4 Gate Replacement Project o Expanded international facilities and gates. o Groundbreaking this fall, estimated completion 2016 o $450 Million Terminal Modernizations o Multiple projects over the next 5 years to upgrade, improve and beautify terminals and concourses o $100 Million Terminal 1- Concourse A o 5 Additional gates o Presently in the planning stage South Runway Expansion Project o Estimated to be completed end of 2014 o $791 Million


15 Terminal 4 Gate Replacement Project

16 Terminal Modernizations Terminal 1 Enhanced Security Checkpoint

17 Terminal Modernizations Terminal 2 Expanded Concourse

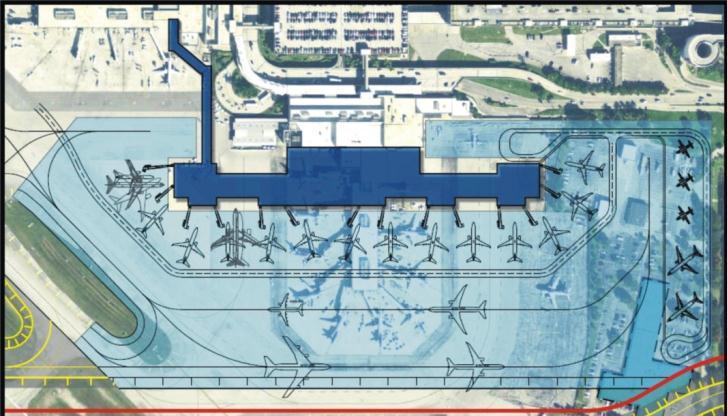
18 Terminal 1- Proposed Concourse A 5 Gates Based on Projected Growth and Passenger Demand Concourse C 9 Gates Concourse B 9 Gates A B C

 and Piles")

19 South Runway Expansion Update Runway Structures Bents (Walls) and Piles Runway Structure Piles, Utilities and Earthwork Runway MSE Wall
, and other economic impacts Total annual economic impact of $2.")
20 Fort Lauderdale-Hollywood International Airport Regional Economic Impact Employment o8,900 jobs on-airport o28,100 related off-airport Annual Economic Impact o$358 million in on-airport wages o$2.383 billion in off-airport wages, indirect, induced impacts (multiplier effect), and other economic impacts Total annual economic impact of $2.741 Billion South Runway Expansion Project* o Estimated 11,000 jobs over the life of the project o $1.4 Billion economic impact to regional economy *IMPLAM Economic Modeling
Westshore Development Forum April 11, Hillsborough County Aviation Authority
 Westshore Development Forum April 11, 2017 Aviation in Florida Only state with four large hub airports $144 billion in annual economic activity or output Approximately 43.1 million visitors come to Florida
World Class Airport For A World Class City
 World Class Airport For A World Class City Air Service Update October 2017 2017 Air Service Updates February 2017 Cleveland new destination, 2x weekly Raleigh-Durham new destination, 2x weekly March 2017
FLL s international traffic has tripled in the last 10 years and it is now 16% of total traffic
 FLL in Perspective FLL in Perspective 2013- FLL ranked as the 21 st busiest airport in the U.S. with 23,559,779 total passengers, 15 th in international passengers and 13 th in domestic Origin and Destination
November Air Traffic Statistics. Prepared by the Office of Corporate Risk and Strategy
 November 214 Air Traffic Statistics Prepared by the Office of Corporate Risk and Strategy Air Traffic Statistics Table of Contents Summary Air Traffic Summary... 1 SH&E Air Traffic Schedule Activity...
World Class Airport For A World Class City
 World Class Airport For A World Class City Air Service Update April 2017 2017 Air Service Updates February 2017 Cleveland new destination, 2x weekly Raleigh-Durham new destination, 2x weekly March 2017
August Air Traffic Statistics. Prepared by the Office of Corporate Risk and Strategy
 August 215 Air Traffic Statistics Prepared by the Office of Corporate Risk and Strategy Metropolitan Washington Airports Authority Air Traffic Statistics Table of Contents Summary Air Traffic Summary...
2016 Air Service Updates
 Air Service Update May 2016 2016 Air Service Updates February 2016 Pittsburgh new destination, 2x weekly April 2016 Los Angeles new departure, 1x daily Atlanta new departure, 1x daily Jacksonville new
World Class Airport For A World Class City
 World Class Airport For A World Class City Air Service Update December 2018 2018 Air Service Updates February 2018 Delta Air Lines Seattle new departure, seasonal, 2x weekly Delta Air Lines Boston new
2016 Air Service Updates
 Air Service Update September 2016 2016 Air Service Updates February 2016 Pittsburgh new destination, 2x weekly April 2016 Los Angeles new departure, 1x daily Atlanta new departure, 1x daily Jacksonville
September Air Traffic Statistics. Prepared by the Office of Marketing & Consumer Strategy
 September 217 Air Traffic Statistics Prepared by the Office of Marketing & Consumer Strategy This report includes only data submitted by airlines as of the date of publication: November 15, 217. Reports
2016 Air Service Updates
 Air Service Update June 2016 2016 Air Service Updates February 2016 Pittsburgh new destination, 2x weekly April 2016 Los Angeles new departure, 1x daily Atlanta new departure, 1x daily Jacksonville new
October Air Traffic Statistics. Prepared by the Office of Corporate Risk and Strategy
 October 214 Air Traffic Statistics Prepared by the Office of Corporate Risk and Strategy Metropolitan Washington Airports Authority Air Traffic Statistics Table of Contents Summary Air Traffic Summary...
Hector International Airport Fargo, North Dakota
 Hector International Airport Fargo, North Dakota Volume 073 Twelve Months Ended September 2007 January 2008 Airlines Serving Fargo Carried 831 Onboard Passengers Per Day for the Twelve Months Ended September
World Class Airport For A World Class City
 World Class Airport For A World Class City Air Service Update April 2018 2018 Air Service Updates February 2018 Seattle new departure, seasonal, 2x weekly Boston new departure, seasonal, 2x weekly March
September Air Traffic Statistics. Prepared by the Office of Corporate Risk and Strategy
 September 214 Air Traffic Statistics Prepared by the Office of Corporate Risk and Strategy Air Traffic Summary September 214 Commercial Total Dom Int'l Passengers % Change Passenger Activity (in Millions)
2016 Air Service Updates
 2016 Air Service Updates February 2016 Pittsburgh new destination, 2x weekly April 2016 Los Angeles new departure, 1x daily Atlanta new departure, 1x daily Jacksonville new destination, 2x weekly Philadelphia
Transborder Air Services Since 1994
 Tri-Airport Open Skies Initiative Transborder Air Services Since 1994 strategic transportation & tourism solutions Prepared for Aéroports de Montréal, The Greater Toronto Airport Authority, and the Vancouver
Greater Orlando Aviation Authority Orlando International Airport Airlines by Destination December 2017
 s by Destination Aguadilla, PR JetBlue 7 2 Akron/Canton, OH Southwest 1 Spirit 6 1 Albany, NY JetBlue 7 Southwest 14 1 Aruba, Netherlands Antilles Southwest 7 Atlanta, GA Delta 112 1 3 Frontier s 7 Southwest
Greater Orlando Aviation Authority Orlando International Airport Airlines by Destination February 2018
 s by Destination Aguadilla, PR JetBlue 7 Akron/Canton, OH Southwest 1 Spirit 7 Albany, NY JetBlue 7 Southwest 18 5 3 Aruba, Netherlands Antilles Southwest 7 Atlanta, GA Delta 113 1 Frontier s 7 Southwest
Bridget Rief, Vice President Planning and Development Metropolitan Airports Commission
 Bridget Rief, Vice President Planning and Development Metropolitan Airports Commission Topics Operations and Air Service Trends Economic Impact Striving for Excellence Planning for the Future Prep for
Greater Orlando Aviation Authority Orlando International Airport Airlines by Destination April 2017
 s by Destination Aguadilla, PR JetBlue 7 Akron/Canton, OH Southwest 1 4 Spirit 7 7 Albany, NY JetBlue 7 Southwest 20 1 1 Albuquerque, NM Southwest 1 1 Aruba, Netherlands Antilles Southwest 7 Atlanta, GA
Hector International Airport Fargo, North Dakota
 Hector International Airport Fargo, North Dakota Volume 072 Twelve Months Ended June 2007 November 2007 Airlines Serving Fargo Carried 830 Onboard Passengers Per Day for the Twelve Months Ended June 2007,
October 2018 October 2017 Change
 AIR TRAFFIC REPORT SUMMARY: OCTOBER PASSENGERS October October Change Domestic Passengers 1,969,141 1,861,225 5.8% International Passengers 89,328 74,157 20.5% Total Passengers 2,058,469 1,935,382 6.4%
August Air Traffic Statistics. Prepared by the Office of Marketing & Consumer Strategy
 August 218 Air Traffic Statistics Prepared by the Office of Marketing & Consumer Strategy This report includes only data submitted by airlines as of the date of publication: October 17, 218. Reports are
December Air Traffic Statistics. Prepared by the Office of Marketing & Consumer Strategy
 December 217 Air Traffic Statistics Prepared by the Office of Marketing & Consumer Strategy 1 This report includes only data submitted by airlines as of the date of publication: February 2, 217. Reports
Aviation Insights No. 5
 Aviation Insights Explaining the modern airline industry from an independent, objective perspective No. 5 November 16, 2017 Question: How has air travel in specific metropolitan areas changed in recent
air traffic statistics
 December 213 air traffic statistics Prepared by the Office of Finance Department of Internal Controls, Compliance and Financial Strategy Commercial Total Dom Int'l Passengers % Change Air Traffic Summary
air traffic statistics
 October 213 air traffic statistics Prepared by the Office of Finance Department of Internal Controls, Compliance and Financial Strategy Metropolitan Washington Airports Authority Air Traffic Statistics
February Air Traffic Statistics. Prepared by the Office of Corporate Risk and Strategy
 February 215 Air Traffic Statistics Prepared by the Office of Corporate Risk and Strategy Commercial Total Dom Int'l Passengers % Change Air Traffic Summary February 215 Passenger Activity (in Millions)
Greater Orlando Aviation Authority Orlando International Airport Destinations by Airline December 2017
 Aer Lingus Dublin, Ireland 3 3 0 0 Aeromexico Mexico City, Mexico 19 4 19 4 0 Air Canada Halifax, Nova Scotia 2 2 Montreal/Dorval, Quebec 12 1 Ottawa, Ontario 5 3 1 Toronto, Ontario 20 1 Vancouver, British
Greater Orlando Aviation Authority - Orlando International Airport Airlines by Destination July 2018
 s by Destination Aguadilla, PR JetBlue 14 -- -- Akron/Canton, OH Albany, NY Southwest 8-1 -- Albuquerque, NM Frontier s 3 -- 3 Southwest 2 -- -5 Amsterdam, Netherlands Delta 7 -- 7 Aruba, Netherlands Antilles
Hector International Airport Fargo, North Dakota
 Hector International Airport Fargo, North Dakota Volume 081 Twelve Months Ended March 2008 July 2008 Airlines Serving Fargo Carried 838 Onboard Passengers Per Day for the Twelve Months Ended March 2008,
Social Media In Your New & Improved Phoenix Sky Harbor
 Social Media In Your New & Improved Phoenix Sky Harbor AZ Chapter of HSMAI September 19, 2013 It always begins & ends with: skyharbor.com Began Facebook page in October 2010 More than 27,000 people Like
August air traffic statistics. Prepared by the Office of Corporate Risk and Strategy
 August 214 air traffic statistics Prepared by the Office of Corporate Risk and Strategy Metropolitan Washington Airports Authority Air Traffic Statistics Table of Contents Summary Air Traffic Summary...
June Air Traffic Statistics. Prepared by the Office of Corporate Risk and Strategy
 June 214 Air Traffic Statistics Prepared by the Office of Corporate Risk and Strategy Air Traffic Statistics Table of Contents Summary Air Traffic Summary... 1 SH&E Air Traffic Schedule Activity... 3 Passenger
July air traffic statistics. Prepared by the Office of Corporate Risk and Strategy
 July 214 air traffic statistics Prepared by the Office of Corporate Risk and Strategy Air Traffic Statistics Table of Contents Summary Air Traffic Summary... 1 SH&E Air Traffic Schedule Activity... 3 Passenger
February Air Traffic Statistics. Prepared by the Office of Marketing & Consumer Strategy
 February 218 Air Traffic Statistics Prepared by the Office of Marketing & Consumer Strategy 1 This report includes only data submitted by airlines as of the date of publication: April 18, 218. Reports
September Air Traffic Statistics. Prepared by the Office of Marketing & Consumer Strategy
 September 2018 Air Traffic Statistics Prepared by the Office of Marketing & Consumer Strategy This report includes only data submitted by airlines as of the date of publication: November 14, 2017. Reports
Lower Income Journey to Work Market Share From American Community Survey
 Lower Income Journey to Work Market Share From American Community Survey 2006-2010 Table 1: Overall National Data Table 2: Car, Truck or Van Table 3: Transit Table 4: Metrics Table 1 Work Trip Market Share:
SEPTEMBER 2014 BOARD INFORMATION PACKAGE
 SEPTEMBER 2014 BOARD INFORMATION PACKAGE MEMORANDUM TO: Members of the Airport Authority FROM: Lew Bleiweis, Executive Director DATE: September 19, 2014 Informational Reports: A. July, 2014 Traffic Report
Norwegian's Free Airfare Promotion
 Norwegian's Free Airfare Promotion Start planning your next vacation with 200+ cruises to incredible destinations, including Alaska, Bahamas & Florida, Bermuda, Canada & New England, Caribbean, Mexican
January Air Traffic Statistics. Prepared by the Office of Marketing & Consumer Strategy
 January 218 Air Traffic Statistics Prepared by the Office of Marketing & Consumer Strategy This report includes only data submitted by airlines as of the date of publication: March 21, 218. Reports are
MANGO MARKET DEVELOPMENT INDEX REPORT
 MANGO MARKET DEVELOPMENT INDEX REPORT 2015-2016 UNDERSTANDING THE MARKET INDEX The Mango Market Development Index is designed to measure and compare mango sales volume relative to population by region
Escape the Conventional. Air Access Report January 2014 to March 2014
 Escape the Conventional Air Access Report January 2014 to March 2014 PUERTO RICO S MAIN AIRPORTS Luis Muñoz Marín International Airport (SJU) in Carolina/San Juan metro area (main airport) - Owned by the
State of the Airport Robert S. Bowen, Executive Director October 18, 2018
 Robert S. Bowen, Executive Director October 18, 2018 A Year of Change The last year will be remembered as a period when the airlines, bolstered by a growing national economy, moderate fuel prices and changing
Air Service at GMIA. ASQ Milwaukee. January 21, 2013
 Air Service at GMIA ASQ Milwaukee January 21, 2013 Airlines that have served MKE GMIA Airlines 2002 to 2013 GMIA Total Passengers - Enplaned & Deplaned 10,000,000 9,000,000 8,000,000 7,000,000
Mango Market Development Index
 Mango Market Development Index 2016-2017 Understanding the Market Index The Mango Market Development Index is designed to measure and compare mango volume sold at retail relative to population by region
University of Denver
 Glenn R. Mueller, Ph.D. Professor University of Denver Franklin L. Burns School of Real Estate & Construction Management & Real Estate Investment Strategist glenn.mueller@du.edu Supply The new supply of
Greater Orlando Aviation Authority - Orlando International Airport Destinations by Airline November 2018
 Aer Lingus Dublin, Ireland 4 -- 1 4 0 1 Aeromexico Mexico City, Mexico 14 -- -1 14 0-1 Air Canada Halifax, Nova Scotia 1 1 1 Montreal/Dorval, Quebec 12-2 -- Ottawa, Ontario 1-1 -1 Toronto, Ontario 21 --
Monthly Employment Watch: Milwaukee and the Nation's Largest Cities
 Monthly Employment Watch: Milwaukee and the Nation's Largest Cities A monthly report on employment trends in the nation s largest cities Prepared by: The University of Wisconsin-Milwaukee Center for Economic
Welcome Central Florida Expressway Authority
 Welcome Central Florida Expressway Authority Central Florida Expressway Authority Phil Brown Executive Director Greater Orlando Aviation Authority November 12, 2015 In the Beginning The Orlando Experience
PORTLAND INTERNATIONAL AIRPORT
 PORTLAND INTERNATIONAL AIRPORT (PDX) OPERATIONS & CITIES SERVED 2018 (AS OF SEPTEMBER) SCHEDULED ARRIVALS 268 SCHEDULED DEPARTURES 268 NONSTOP CITIES (AIRPORTS) 57 DOMESTIC CITIES 51 INTERNATIONAL CITIES
Monthly Employment Watch: Milwaukee and the Nation's Largest Cities
 Monthly Employment Watch: Milwaukee and the Nation's Largest Cities A monthly report on employment trends in the nation s largest cities Prepared by: The University of Wisconsin-Milwaukee Center for Economic
Distance to Jacksonville from Select Cities
 Distance to Jacksonville from Select Cities Source: Mapquest.com, Expedia.com, ManagementReporting.com City Miles Driving Time (Hrs) Atlanta, GA 347 5.75 1 Boston, MA 1,160 18.5 4 Chicago, IL 1,063 17.5
Passengers Boarded At The Top 50 U. S. Airports ( Updated April 2
 (Ranked By Passenger Enplanements in 2006) Airport Table 1-41: Passengers Boarded at the Top 50 U.S. Airportsa Atlanta, GA (Hartsfield-Jackson Atlanta International) Chicago, IL (Chicago O'Hare International)
air traffic statistics
 September 213 air traffic statistics Prepared by the Office of Finance Department of Internal Controls, Compliance and Financial Strategy Commercial Total Int'l Dom Passengers % Change Air Traffic Summary
The Metropolitan Airports Commission and MSP International Airport
 The Metropolitan Airports Commission and MSP International Airport Brian Ryks, Executive Director and CEO Metropolitan Airports Commission My Flight Track Duluth Aberdeen St. Cloud Twin Cities Grand Rapids
PITTSBURGH INTERNATIONAL AIRPORT ANALYSIS OF SCHEDULED AIRLINE TRAFFIC. October 2016
 ANALYSIS OF SCHEDULED AIRLINE TRAFFIC October 2016 Passenger volume Pittsburgh International Airport enplaned passengers totaled 379,979 for the month of October 2016, a 7.0% increase from the previous
Florida's Scheduled Commercial Service Airports
 Florida's Scheduled Commercial Service Airports Volume 154 May 2016 - Domestic Airlines Serving Florida Carried 170,726 Onboard Passengers Per Day for, up 7.7% over the previous 12 months. Highlights in
Challenges and Changes! Jeff Hamiel! Metropolitan Airports Commission!
 Challenges and Changes! Jeff Hamiel! Metropolitan Airports Commission! Industry Consolidation! Trend: Airline Outsourcing! Above- and below-wing services! Aircraft cleaning! Wheelchair assistance services!
Delta Already Has Access to 79 Percent of U.S.-Rome Traffic with Its JFK Service
 Already Has Access to 79 Percent of U.S.-Rome Traffic with Its Service Philadelphia R-103 (Rebuttal to -103) Seattle Portland Salt Lake City Denver Chicago Detroit Cleveland Columbus Dayton Pittsburgh
Greater Orlando Aviation Authority - Orlando International Airport Airlines by Destination November 2018
 s by Destination Aguadilla, PR JetBlue 7 -- 2 Spirit 7 1 7 Akron/Canton, OH Spirit 6 1 -- Albany, NY Frontier s 3 -- 3 JetBlue 7 -- -- Southwest 14 6 -- Albuquerque, NM Frontier s 2 -- 2 Amsterdam, Netherlands
BATON ROUGE Metropolitan Airport
 BATON ROUGE Metropolitan Airport May August, 2011 presented by: Why the research? objective and methodology SCI was contacted by the Baton Rouge Metropolitan airport (BTR) to determine, using a quantitative
March Raymond James Institutional Investors Conference
 March 2009 Raymond James Institutional Investors Conference Safe Harbor Certain of the statements contained herein should be considered forward-looking statements, including within the meaning of the Private
Non-stop Scheduled Passenger Service at Fargo as of October Top 20 Domestic O&D Passenger Markets at Fargo Twelve Months Ended June 2006
 0 5000 10000 15000 20000 25000 30000 35000 40000 45000 50000 Airport Traffic Quarterly Non-stop Scheduled Passenger Service at Fargo as of October 2006 Top 20 Domestic O&D Passenger Markets at Fargo Twelve
2012 Airport Ground Transportation
 212 Airport Ground Transportation Fees and Fares Survey Summary March 212 AGTA 212 Airport Fees and Fares Survey Summary Survey Respondents Atlantic City International Airport Gulfport-Biloxi International
Agency 35 ft. Over Artic. Trolley 2012 Total and 35 ft. under. 1 1 MTA New York City Transit 0 3, ,344 New York City
 Capital Metro-No. 40 Courtesy Capital Metro 1 1 MTA New York City Transit 0 3,704 640 0 4,344 New York City 2 3 New Jersey Transit Corp. 47 2,263 85 0 2,395 Newark, N.J. 3 2 Metro 50 1,956 378 0 2,384
79006 AIR TRAVEL SERVICES 2001 AWARD
 Group 79006 AIR TRAVEL SERVICES 2001 AWARD Page 6 Office of General Services - Procurement Services Group Delta Air Lines Albany, NY - Albuquerque, NM ALB - ABQ 901.00 313.00 293.00 420 Delta Air Lines
Appendix D: Aggregation Error for New England Metro Areas and for Places
 Appendix D: for New England Metro Areas and for Places D-1 Appendix D: s Figure D-1: New England Metro Areas - Summary of Tract s (2000) Metro ID (msapma99) Metro Area Name Census NCDB 1120 Boston, MA-NH
333 W. Campbell Road, Suite 440 Richardson, Texas Cruising for Charity with Randy Limbacher in Tahiti July 28, 2007
 333 W. Campbell Road, Suite 440 Richardson, Texas 75080 972.238.1998 800.952.1998 Cruising for Charity with Randy Limbacher in Tahiti July 28, 2007 Join me for this special annual event to raise money
TOP 100. Transit Bus Fleets Agency 35 ft. Over Artic and 35 ft. Total +/- under 0 3, ,426 82
 L.A. Metro-No. 3 1 1 MTA New York City Transit New York City 2 2 New Jersey Transit Corp. Newark, N.J. 3 3 Metro Los Angeles 4 5 Toronto Transit Commission Toronto 5 10 Chicago Transit Authority Chicago
Enhancing Air Service Through Community Partnerships ACI NA Marketing & Communications Partnering with Carriers
 Enhancing Air Service Through Community Partnerships ACI NA ACI NA Marketing & Communications Partnering with Carriers June 21 21, 2011 Bradley D. Penrod, A.A.E., CEO/Executive Director Allegheny County
Massena, Ogdensburg and Watertown, NY. Albany and/or Boston
 Proposal of Hyannis Air Service, Inc. dba Cape Air to provide subsidized Essential Air Service for Massena, Ogdensburg and Watertown, NY To/From Albany and/or Boston Docket DOT-OST-1997-2842 Hyannis Air
Investor Presentation. December 13, 2006
 Investor Presentation December 13, 2006 Safe Harbor Disclosure Forward Looking Information Certain of the statements contained herein should be considered forward-looking statements within the meaning
Trends Shaping Houston Airports
 Trends Shaping Houston Airports Ian Wadsworth Chief Commercial Officer April 2014 Our mission is to connect Houston with the world Connect the people, businesses, cultures and economies of the world to
Fort Lauderdale August 8, 2017
 Fort Lauderdale August 8, 2017 8/10/2017 TAP Software Analytics Division Brian Finucane TAP Reports Jeff Eastman TAP Hotel Reports Jeanne Eastman TAP Data Source Jeff Eastman Cloud Database Numerous Data
May Air Traffic Statistics. Prepared by the Office of Corporate Risk and Strategy
 May 214 Air Traffic Statistics Prepared by the Office of Corporate Risk and Strategy Commercial Total Int'l Dom Air Traffic Summary May 214 Passenger Activity (in Millions) Current Month Year-to-Date Last
Monthly Employment Watch: Milwaukee and the Nation's Largest Cities
 Monthly Employment Watch: Milwaukee and the Nation's Largest Cities A monthly report on employment trends in the nation s largest cities Prepared by: The University of Wisconsin-Milwaukee Center for Economic
Location, Location, Location. 19 th Annual NIC Conference NIC MAP Data & Analysis Service
 Location, Location, Location 19 th Annual NIC Conference NIC MAP Data & Analysis Service The Great Occupancy Decline 94% Occupancy Trends Majority Nursing Seniors Housing 93% 92% 91% 92.8% 91.0% 90% 89%
Kansas City Aviation Department. Community Listening Session
 Kansas City Aviation Department Community Listening Session Listening Session Purpose The Kansas City Aviation Department is moderating these community listening sessions in order to gather feedback from
Airport development within VINCI
 Airport development within VINCI 1 The airport sector: a development goal since 1995 VINCI Concessions: a portfolio of outstanding airport concessions 22 airports in Mexico 2 airports in Cambodia: Phnom
2012 Airfares CA Out-of-State City Pairs -
 2012 Airfares Out-of-State City Pairs - Contracted rates are from July 1, 2012 through June 30, 2013. Please note all fares are designated as () and ( ) in airline computer reservation systems. fares are
Park-Related Total* Expenditure per Resident, by City
 Park-Related Total* per Resident, by City FY 2008 City Population Total Park per Resident Washington, D.C. 591,833 $153,324,830 $259 Seattle 598,541 $150,672,543 $252 Scottsdale 235,371 $50,429,049 $214
Monthly Employment Watch: Milwaukee and the Nation's Largest Cities
 Monthly Employment Watch: Milwaukee and the Nation's Largest Cities A monthly report on employment trends in the nation s largest cities Prepared by: The University of Wisconsin-Milwaukee Center for Economic
Monthly Employment Watch: Milwaukee and the Nation's Largest Cities
 Monthly Employment Watch: Milwaukee and the Nation's Largest Cities A monthly report on employment trends in the nation s largest cities Prepared by: The University of Wisconsin-Milwaukee Center for Economic
Emerging Trends in Real Estate Sustaining Momentum but Taking Nothing for Granted
 Emerging Trends in Real Estate 2015 Sustaining Momentum but Taking Nothing for Granted PwC-ULI Outlook on trends 36th edition 368 interviews 1,055 survey responses 1,400+ participants, a record Who? District
Aviation Insights No. 8
 Aviation Insights Explaining the modern airline industry from an independent, objective perspective No. 8 January 17, 2018 Question: How do taxes and fees change if air traffic control is privatized? Congress
Managing in a High Cost Energy World
 Arne Haak, AirTran Holdings, Inc. Managing in a High Cost Energy World Insert your Company Safe Harbor Certain of the statements contained herein should be considered forward-looking statements, including
TOP 100 Bus Fleets Agency 35 ft. and Over Artic under 35 ft. Total. 18 < metro magazine SEPTEMBER/OCTOBER 2018 metro-magazine.
 1 1 MTA New York City Transit/MTA Bus Co. 0 4,860 951 5,811 New York City 2 3 New Jersey Transit Corp. 418 2,879 85 3,382 Newark, N.J. 3 2 Los Angeles County Metropolitan Transportation Authority 50 1,882
Passenger and Cargo Statistics Report
 Passenger and Cargo Statistics Report Reno-Tahoe International Airport October 2018 U.S. DOMESTIC INDUSTRY OVERVIEW FOR OCTOBER 2018 Systemwide RNO Carriers Domestic Flights year over year comparison Average
Traffic Results YTD Mar 2017
 Traffic Results YTD Mar 2017 Departing Pax 348,583-14% Departing Pax - US/CAN 225,066 5% Total Seat Capacity - Outbound 447,620-17% Seat Capacity USA 253,332 5% LF USA 82% LF CANADA 88% Traffic Results
High-Speed Rail: Realizing the Potential of Megaregion Economies
 High-Speed Rail: Realizing the Potential of Megaregion Economies Petra Todorovich Director, America 2050 Regional Plan Association May 4, 2010 Rayburn House Office Building 1 2 1 Where High-Speed Rail
Hotel Valuation and Transaction Trends for the U.S. Lodging Industry
 Hotel Valuation and Transaction Trends for the U.S. Lodging Industry June 2010 Presented by Steve Rushmore, MAI, FRICS, CHA srushmore@hvs.com - 1 - Value Trend for a Typical U.S. Hotel 1987 1988 1989 1990
Monthly Employment Watch: Milwaukee and the Nation's Largest Cities
 Monthly Employment Watch: Milwaukee and the Nation's Largest Cities A monthly report on employment trends in the nation s largest cities Prepared by: The University of Wisconsin-Milwaukee Center for Economic
Parking Property Advisors and Parkopedia present: TOP 40 US CITIES PARKING INDEX
 Parking Property Advisors and Parkopedia present: TOP 40 US CITIES PARKING INDEX 2018 Parking Property Advisors and Parkopedia proudly present this 2018 Top 40 US Cities Parking Index. Whether you are
RANKING OF THE 100 MOST POPULOUS U.S. CITIES 12/7/ /31/2016
 OVERVIEW OF THE DATA The following information is based on incoming communication to the National Human Trafficking Hotline via phone, email, and online tip report from December 7, 2007 December 31, 2016
MARKETBEAT U.S. Office
 MARKETBEAT U.S. Office Q4 2018 U.S. OFFICE Employment Indicators Market Indicators (Overall) Office: Net Absorption/Asking Rent 4Q TRAILING AVERAGE Office: Overall Vacancy Q4 17 Q4 18 Total Nonfarm Employment
A COMPARISON OF THE MILWAUKEE METROPOLITAN AREA TO ITS PEERS
 KRY/WJS/EDL #222377 (PDF: #223479) 1/30/15 PRELIMINARY DRAFT Memorandum Report A COMPARISON OF THE MILWAUKEE METROPOLITAN AREA TO ITS PEERS EXECUTIVE SUMMARY This memorandum report provides a statistical
Denver International Airport Opportunities for Business
 Denver International Airport Opportunities for Business Presented to The DIA Way Small Business Opportunities Forum by Kim Day, Manager of Aviation August 31, 2009 1 Presentation Outline An Overview of
U.S. Lodging Industry Update
 U.S. Lodging Industry Update First Watch on a Long Voyage R. MARK WOODWORTH AMERICAS RESEARCH AGENDA THE ECONOMY WHAT COULD END THE CURRENT CYCLE? LABOR COSTS OUR FORECASTS SHARING ECONOMY UPDATE First