San Francisco Travel Association Selling in a Seller s Market DMO Perspective. May 21, 2014
|
|
|
- Irma Reynolds
- 6 years ago
- Views:
Transcription
1 San Francisco Travel Association Selling in a Seller s Market DMO Perspective May 21, 2014
2 Agenda Discussion Themes 1. Meetings Are Important 2. Market Meetings Pace 3. Occupancy & Rate 4. Booking Windows & Demand Drivers

3 Meetings Are Important
4 Meetings Are Important Economic Significance of Meetings to the U.S. Economy Source: PricewaterhouseCoopers LLP The Economic Significance of Meetings to the US Economy Interim Update for 2012 Convention Industry Council 1.8 million meetings 225 million participants $280 billion in total direct spending; $770 billion total economic contributions $150 billion on meeting planning & production $130 billion on Travel & Tourism commodities 50% Corporate/Business 27% Conventions/Conferences 23% Trade Shows & other Positive Impacts: Contributions to GDP, employment, labor income and taxes
5 Meetings Are Important Economic Significance of Meetings to the San Francisco Economy Source: San Francisco Travel Association 2,415 meetings (that we know of) 2.9 million participants $1.2 billion in total direct spend 52% Association 46% Corporate 2% Trade Shows & other 15% Health & Medical 23% High Tech, Computer, Electric 12% Trade Shows, Expositions Positive Impacts: Contributions to GDP, employment, labor income and taxes
6 SF Travel Association s Market Share 2013: 3.4 M combined group/airline RNs in San Francisco San Francisco Travel Association contributed up to 54% RNs generated by San Francisco Travel Association and by in-house hotel sales 1,824, % 1,589,331 46% San Francisco Travel Hotel Sales

7 San Francisco Citywide Group Market Share RNs generated by Moscone Center and by in-house hotel sales In 2013: 2.7M group RNs in San Francisco Citywide Group Contributions 852, % San Francisco Travel 2,755, % Hotel Sales
8
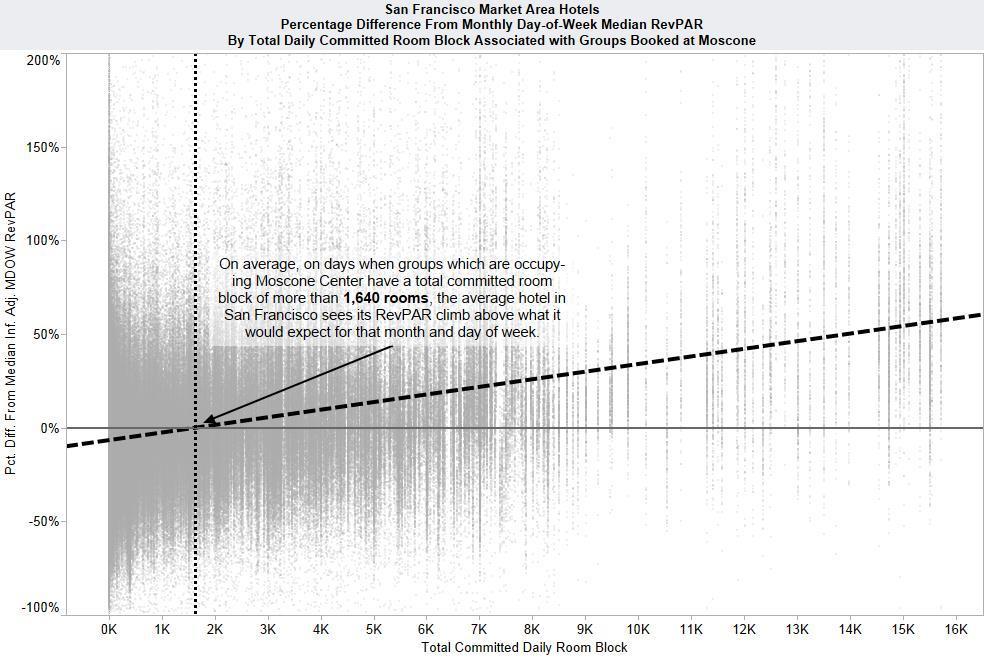
9 Compression Study Bottom Line Impact on hotels regardless of whether or not they contracted a block. Conventions help ALL the hotels in the San Francisco Market Hotels in all zones feel compression when a group using Moscone has between 1,380 committed rooms and 2,350 committed rooms Groups using more than 6,000 rooms drive significantly large RevPAR gains for hotels in all regions of the city from 10% gains to nearly 150% gains over what would be expected for that day and month Groups which can be classified as Scientific, Engineering, Technical, Computer, or Trade Shows & Expositions / Show Producers generally show the most rapid increases in RevPAR as their size increases. On average, an additional 500 in these room blocks moves RevPAR 4.4% from median MDOW RevPAR for hotels in TID Zone 1 Source: STR & SFTA
10 North America Meetings Market
11 Current Trends Booking cycle is drastically more short-term than before 2008 BUT: Total numbers of rooms contracted for future years is 7% higher than 2007 Short-term group commitments very strong North American market pace is at 90% for 2015 and close to 90% for and 2018 are now back over 80% after dipping below 80% for most of 2018 Up cycle means DRMs, DOSMs and chains are aggressive on room allotments and pricing Mid-West is pacing ahead of East AND West Coast During the downturn the West Coast was definitely the pace leader
12 North America Meetings Market DMO Perspective Room Nights Def. RNs 27.5 M 23.1 M 16.6M 12.9M 9.7 M 7.4 M Pace Target 26.7 M 22.9 M 18.3 M 14.9 M 11.7 M 9.1 M Source: Trends, Analysis & Projections, December 2013 Pace % 104% 101% 91% 87% 83% 81% Benchmark 26.8 M 26.8 M 26.8 M 26.8 M 26.8 M 26.8 M Demand 101 M 90.3 M 74 M 54 M 37.1 M 32.2M Lost 73.4 M 67.1 M 57.4 M 41 M 27.3 M 24.7 M Conversion 27% 26% 22% 24% 26% 23%
13 Mid-West Region Meetings Market DMO Perspective Room Nights Def. RNs 8.6 M 7.4 M 4.9 M 3.8 M 2.9 M 2.4 M Pace Target 8.0 M 7.0 M 5.5 M 4.5 M 3.5 M 2.6 M Source: Trends, Analysis & Projections, December 2013 Central Region: Arlington Austin Chicago Dallas Des Moines Fort Worth Houston Kansas City Little Rock Madison Memphis Milwaukee Minneapolis Nashville New Orleans Oklahoma City Omaha Overland Park San Antonio St. Louis Pace % 107% 105% 89% 84% 85% 94% Benchmark 8 M 8 M 8 M 8 M 8 M 8 M Demand 29.7 M 26.4 M 21 M 14.8 M 9.8 M 7.3 M Lost 21 M 18.9 M 15.9 M 11 M 6.8 M 4.8 M Conversion 29% 28% 24% 26% 30% 34%
14 Eastern Region Meetings Market DMO Perspective Source: Trends, Analysis & Projections, December 2013 Atlanta Baltimore Birmingham Charlotte Chattanooga Cincinnati Cleveland Detroit Fort Lauderdale Grand Rapids Indianapolis Jacksonville Lexington Louisville Northern Kentucky Orlando Ottawa Philadelphia Pittsburgh Quebec C ity Providence Puerto Rico Richmond Tampa Toronto Virginia Beach Washington DC Room Nights Def. RNs 11.9 M 10.1 M 7.4 M 5.6.M 4.2 M 3.1 M Pace Target 11.9 M 10.1 M 7.9 M 6.3 M 4.8 M 3.6 M Pace % 100% 101% 94% 88% 87% 84% Benchmark 11.9 M 11.9 M 11.9 M 11.9 M 11.9 M 11.9 M Demand 44.6 M 41 M 34 M 25.2 M 17.4 M 16.4 M Lost 32.6 M 30.1 M 26.5 M 19.6 M 13.1 M 13.4 M Conversion 27% 25% 22% 22% 24% 19%
15 West Region Meetings Market DMO Perspective Source: Trends, Analysis & Projections, December 2013 Western Zone Albuquerque Anaheim Calgary Denver Hawaii Los Angeles Palm Springs Phoenix Portland Sacramento San Diego San Francisco San Jose Seattle Spokane Vancouver Central Zone Room Nights Def. RNs 6.8 M 5.6 M 4.3 M 3.5 M 2.5 M 1.8 M Pace Target 6.7 M 5.8 M 4.8 M 4.1 M 3.4 M 2.8 M Pace % 102% 96% 88% 87% 74% 65% Benchmark 6.7 M 6.7 M 6.7 M 6.7 M 6.7 M 6.7 M Demand 26.6 M 23 M 19.1 M 13.9 M 9.9 M 8.5 M Lost 19.7 M 17.3 M 14.8 M 10.4 M 7.4 M 6.6 M Conversion 26% 25% 22% 25% 26% 22%
16 San Francisco Room Night Pace
17 San Francisco Meetings Market DMO Perspective Source: Trends, Analysis & Projections, April 2014 Moscone RN s Room Nights Def. RNs 934 k 1 M 839 K 888 K 779 K 777 K Pace Target 887 K 888 K 854 K 812 K 758 K 699 K Pace % 105% 114% 98% 109% 103% 111% Benchmark 893 K 893 K 893 K 893 K 893 K 893 K Demand 3.3 M 3.4 M 3.1 M 2.5 M 2.1M 1.8 M Lost 2.4 M 2.5 M 2.2 M 1.7 M 1.3 M 1.1 M Conversion 28% 25% 29% 31% 37% 40%
18 San Francisco Meetings Market DMO Perspective Source: Trends, Analysis & Projections, April 2014 Self-Contained Room Nights Def. RNs 976 K 612 K 267 K 155 K 92 K 53 K Pace Target 806 K 595 K 285 K 197 K 142 K 104 K Pace % 121% 103% 94% 79% 65% 51% Benchmark 806 K 818 K 818 K 818 K 818 K 818 K Demand 2 M 1.7 M 967 K 504 K 325 K 193 K Lost 1.05 M 1.1 M 700 K 348 K 232 K 140 K Conversion 48% 36% 28% 31% 298% 27%
19 San Francisco Meetings Market DMO Perspective Source: Trends, Analysis & Projections, April 2014 Combined Total RNs (Moscone & Self- Contained) Room Nights Def. RNs 1.9 M 1.6 M 1.1 M 1.05 M 872 K 830 K Pace Target 1.6 M 1.5 M 1.3 M 1.2 M 1.1 M 969 K Pace % 113% 106% 86% 89% 81% 86% Benchmark 1.6 M 1.7 M 1.7 M 1.7 M 1.7 M 1.7 M Demand 5.4 M 5.2 M 4.4 M 3.6 M 2.8 M 2.3M Lost 3.4 M 3.6 M 3.3 M 2.5 M 1.9 M 1.4 M Conversion 36% 31% 25% 29% 31% 36%
20 Top 25 US Markets: Occupancy, ADR & RevPAR

21 2013 Performance in Top 25 Markets Market Occupancy % ADR $ RevPAR $ New York U.S. Hotel Industry 62.3% Occupancy $110 ADR $69 RevPAR Oahu Island San Francisco/San Mateo Miami Los Angeles Anaheim Boston Source: STR Monthly Hotel Review; December 2013 Seattle San Diego Orlando

22 San Francisco Market: Occupancy & ADR
23 Occupancy and Average Rate PKF Consulting Year Occ % Chg ADR % Chg RevPar % Chg % +5.1% $ % $ % % +1.7% $ % $ % % +3.3% $ % $ % 2014 F 83.7% +0.9% $ % $ % 2015 F 84.0% +0.4% $ % $ % 2016 F 83.5% -0.6% $ % $ % 2017 F 83.5% -0.6% $ % $ % Source: PKF Hospitality Research Hotel Horizons March-May 2014
24 Occupancy and Average Rate Smith Travel Research Year Occ % Chg ADR % Chg RevPar % Chg % +5.1% $ % $ % % +1.7% $ % $ % % +3.3% $ % $ % 2014 F 85.5% +3.1% $ % $ % 2015 F 86.2% +0.8% $ % $ % 2016 F 84.6% -1.9% $ % $ % 2017 F 84.6% 0.0% $ % $ % Source: Smith Travel Research; February 2014
25 Downtown San Francisco Occupancy
26 SF Market Versus SF Downtown Occupancy Performance YTD December 2013 Source: STR & SFTA Area Transient Group Total SF Only Market Street Convention Center Union Square SOMA Financial District Nob Hill Fisherman s Wharf Civic Center San Mateo SFO Oakland/Hayward Marin
27 SF Market Versus SF Downtown Occupancy Performance YTD March 2014 Source: STR & SFTA Area Transient Group Total SF Only Market Street Convention Center Union Square SOMA Financial District Nob Hill Fisherman s Wharf Civic Center San Mateo SFO Oakland/Hayward Marin

28 Downtown San Francisco ADR
29 SF Market Versus SF Downtown ADR Performance YTD December 2013 Source: STR & SFTA Area Transient Group Total SF Only Market Street Convention Center Union Square SOMA Financial District Nob Hill Fisherman s Wharf Civic Center San Mateo SFO Oakland/Hayward Marin
30 SF Market Versus SF Downtown ADR Performance YTD March 2014 Source: STR & SFTA Area Transient Group Total SF Only Market Street Convention Center Union Square SOMA Financial District Nob Hill Fisherman s Wharf Civic Center San Mateo SFO Oakland/Hayward Marin
31 Day of Week Occupancy
32 SF Market Versus SF Downtown Day-of-Week Perspective YTD 2013 Source: STR & SFTA DOW Sun Mon Tue Wed Thu Fri Sat SF Only Market Street Convention Center Union Square SOMA Financial District Nob Hill Fisherman s Wharf Civic Center SFO Oakland/ Hayward Marin
33 SF Market Versus SF Downtown Day-of-Week Perspective YTD March 2014 Source: STR & SFTA DOW Sun Mon Tue Wed Thu Fri Sat SF Only Market Street Convention Center Union Square SOMA Financial District Nob Hill Fisherman s Wharf Civic Center SFO Oakland/ Hayward Marin

34 Booking window for Self- Contained
35 Booking Windows Self-Contained 62% or 620,000 room nights of all self-contained group business books 0-12 month out (in the year for the year) In a strong economy the self-contained booking window is even shorter, meaning meeting planners book closer to the actual event date Once self-contained groups are on-the-books, hotels will manage patterns and rates = Typically means more aggressive rates If possible contract blocks more than 12 months out in order to ensure best availability and best rates Avoid competing with short-term self-contained business and transient by contracting multiple years out if the client has an annual event Work with your local CVB to learn about the destination s need periods

36 Non- Convention Demand Drivers
37 2014 Demand Drivers Expected Occupancies in Downtown SF (Nicole's Crystal Ball): May: 86.0% June: 90.00% July: 90.0% Aug: 94.0% Sep: 90.0% Oct: 90.0% Nov: 80.00% Dec: 74.0% May 17: Bay-to-Breakers race (60,000) June 27-29: Gay Pride (750,000) July 20: AIDS Walk SF (20,000) July 26: SF Marathon (25,000) Aug 9-11: Outside Lands Festival (120,000) Sep 29: Folsom Street Fair (400,000) Oct 4-6: Strictly Hardly Bluegrass (750,000) Oct 8-12: Fleet Week (1.2 M) Oct 19: Nike Marathon (25,000)
38 Thank you Nicole Halmer Sr. Director Market Strategy & Research
San Francisco Travel Association Citywide Customer Advisory Council Meeting. August 21, 2014
 San Francisco Travel Association Citywide Customer Advisory Council Meeting August 21, 2014 Agenda Discussion Themes 1. Meetings Are Important 2. Market Meetings Pace 3. Occupancy & Rate 4. Economic Impact
Fort Lauderdale August 8, 2017
 Fort Lauderdale August 8, 2017 8/10/2017 TAP Software Analytics Division Brian Finucane TAP Reports Jeff Eastman TAP Hotel Reports Jeanne Eastman TAP Data Source Jeff Eastman Cloud Database Numerous Data
Monthly Employment Watch: Milwaukee and the Nation's Largest Cities
 Monthly Employment Watch: Milwaukee and the Nation's Largest Cities A monthly report on employment trends in the nation s largest cities Prepared by: The University of Wisconsin-Milwaukee Center for Economic
Monthly Employment Watch: Milwaukee and the Nation's Largest Cities
 Monthly Employment Watch: Milwaukee and the Nation's Largest Cities A monthly report on employment trends in the nation s largest cities Prepared by: The University of Wisconsin-Milwaukee Center for Economic
Lower Income Journey to Work Market Share From American Community Survey
 Lower Income Journey to Work Market Share From American Community Survey 2006-2010 Table 1: Overall National Data Table 2: Car, Truck or Van Table 3: Transit Table 4: Metrics Table 1 Work Trip Market Share:
Monthly Employment Watch: Milwaukee and the Nation's Largest Cities
 Monthly Employment Watch: Milwaukee and the Nation's Largest Cities A monthly report on employment trends in the nation s largest cities Prepared by: The University of Wisconsin-Milwaukee Center for Economic
University of Denver
 Glenn R. Mueller, Ph.D. Professor University of Denver Franklin L. Burns School of Real Estate & Construction Management & Real Estate Investment Strategist glenn.mueller@du.edu Supply The new supply of
Monthly Employment Watch: Milwaukee and the Nation's Largest Cities
 Monthly Employment Watch: Milwaukee and the Nation's Largest Cities A monthly report on employment trends in the nation s largest cities Prepared by: The University of Wisconsin-Milwaukee Center for Economic
Monthly Employment Watch: Milwaukee and the Nation's Largest Cities
 Monthly Employment Watch: Milwaukee and the Nation's Largest Cities A monthly report on employment trends in the nation s largest cities Prepared by: The University of Wisconsin-Milwaukee Center for Economic
Hotel Valuation and Transaction Trends for the U.S. Lodging Industry
 Hotel Valuation and Transaction Trends for the U.S. Lodging Industry June 2010 Presented by Steve Rushmore, MAI, FRICS, CHA srushmore@hvs.com - 1 - Value Trend for a Typical U.S. Hotel 1987 1988 1989 1990
MANGO MARKET DEVELOPMENT INDEX REPORT
 MANGO MARKET DEVELOPMENT INDEX REPORT 2015-2016 UNDERSTANDING THE MARKET INDEX The Mango Market Development Index is designed to measure and compare mango sales volume relative to population by region
Monthly Employment Watch: Milwaukee and the Nation's Largest Cities
 Monthly Employment Watch: Milwaukee and the Nation's Largest Cities A monthly report on employment trends in the nation s largest cities Prepared by: The University of Wisconsin-Milwaukee Center for Economic
Park-Related Total* Expenditure per Resident, by City
 Park-Related Total* per Resident, by City FY 2008 City Population Total Park per Resident Washington, D.C. 591,833 $153,324,830 $259 Seattle 598,541 $150,672,543 $252 Scottsdale 235,371 $50,429,049 $214
MPI Nashville Chapter
 MPI Nashville Chapter Monthly Meeting Embassy Suites Cool Springs September 20, 2017 Veronica Andrews Director, Digital Data Solutions vandrews@str.com @STR_Data 2017 STR, Inc. All Rights Reserved. Any
U.S. Lodging Industry Update
 U.S. Lodging Industry Update First Watch on a Long Voyage R. MARK WOODWORTH AMERICAS RESEARCH AGENDA THE ECONOMY WHAT COULD END THE CURRENT CYCLE? LABOR COSTS OUR FORECASTS SHARING ECONOMY UPDATE First
Mango Market Development Index
 Mango Market Development Index 2016-2017 Understanding the Market Index The Mango Market Development Index is designed to measure and compare mango volume sold at retail relative to population by region
Hotel InduSTRy Overview
 Hotel InduSTRy Overview Chris Klauda, CHIA Director, Destination Research cklauda@str.com ESTO Webinar November 12, 2015 1 1. Visit www.hotelnewsnow.com 2. Create Free Login 3. Click on Data Presentations
Rank Place State Native Hawaiian and Pacific Islander population (alone or in combination
 TABLE 2a: 100 Largest Places Ranked by Number of s (race alone or in *) Living in Hard-to- Census Rank Place State (alone or in 1 Honolulu (CDP) HI 64,196 11,130 17.3 2 New York City NY 14,981 8,211 54.8
RANKING OF THE 100 MOST POPULOUS U.S. CITIES 12/7/ /31/2016
 OVERVIEW OF THE DATA The following information is based on incoming communication to the National Human Trafficking Hotline via phone, email, and online tip report from December 7, 2007 December 31, 2016
Parking Property Advisors and Parkopedia present: TOP 40 US CITIES PARKING INDEX
 Parking Property Advisors and Parkopedia present: TOP 40 US CITIES PARKING INDEX 2018 Parking Property Advisors and Parkopedia proudly present this 2018 Top 40 US Cities Parking Index. Whether you are
Location, Location, Location. 19 th Annual NIC Conference NIC MAP Data & Analysis Service
 Location, Location, Location 19 th Annual NIC Conference NIC MAP Data & Analysis Service The Great Occupancy Decline 94% Occupancy Trends Majority Nursing Seniors Housing 93% 92% 91% 92.8% 91.0% 90% 89%
TravelClick: Business Intelligence Lodging Outlook. Sara Duggan. Regional Vice President, Business Intelligence TravelClick 03/23/18
 TravelClick: Business Intelligence 2018 Lodging Outlook Sara Duggan Regional Vice President, Business Intelligence TravelClick 03/23/18 25,000+ Partners 25 283 Million $49 Billion 365 North America Markets
Lodging Industry Overview. 14 December Bobby Bowers Smith Travel Research / STR Global
 Lodging Industry Overview 14 December 2011 Bobby Bowers Smith Travel Research / STR Global Global / U.S. Overview Key U.S. Markets Construction Pipeline Forecast Takeaways Today s Agenda RevPar Growth
WILL TOMORROW BE BETTER THAN YESTERDAY?
 CBRE HOTELS The World s Leading Hotel Experts. WILL TOMORROW BE BETTER THAN YESTERDAY? HOTEL SECTOR UPDATE OCTOBER 31, 2017 THE AGENDA 1. U.S. Lodging Market The Macro-Economy and Hotels The Changing Traveler
Appendix D: Aggregation Error for New England Metro Areas and for Places
 Appendix D: for New England Metro Areas and for Places D-1 Appendix D: s Figure D-1: New England Metro Areas - Summary of Tract s (2000) Metro ID (msapma99) Metro Area Name Census NCDB 1120 Boston, MA-NH
Hotel InduSTRy Overview What Lies Ahead
 University of Massachusetts Amherst ScholarWorks@UMass Amherst Tourism Travel and Research Association: Advancing Tourism Research Globally 2013 Marketing Outlook Forum - Outlook for 2014 Hotel InduSTRy
ustravel.org/travelpromotion
 Agenda 1. Power of Travel Promotion Resources 2. New Tool: Travel Economic Impact Calculator 3. Accessing data through Interactive Travel Analytics 4. Unused Vacation Time Opportunity 5. Highlights from
Southern Innkeepers 104 th Annual Meeting Lodging Overview. Jan D. Freitag Senior Vice President
 Southern Innkeepers 104 th Annual Meeting Lodging Overview Jan D. Freitag Senior Vice President 1 Agenda Total US Review Scales Segmentation Markets Pipeline Southern Innkeepers Hotels Performance 2012
TOP 100. Transit Bus Fleets Agency 35 ft. Over Artic and 35 ft. Total +/- under 0 3, ,426 82
 L.A. Metro-No. 3 1 1 MTA New York City Transit New York City 2 2 New Jersey Transit Corp. Newark, N.J. 3 3 Metro Los Angeles 4 5 Toronto Transit Commission Toronto 5 10 Chicago Transit Authority Chicago
Hotel Industry Performance Overview Washington Lodging Convention
 Hotel Industry Performance Overview Washington Lodging Convention Valerie Woods Director of Business Development, Hotels vwoods@str.com Valerie_STR 2016 STR, Inc. All Rights Reserved. Any reprint, use
Social Media In Your New & Improved Phoenix Sky Harbor
 Social Media In Your New & Improved Phoenix Sky Harbor AZ Chapter of HSMAI September 19, 2013 It always begins & ends with: skyharbor.com Began Facebook page in October 2010 More than 27,000 people Like
Agency 35 ft. Over Artic. Trolley 2012 Total and 35 ft. under. 1 1 MTA New York City Transit 0 3, ,344 New York City
 Capital Metro-No. 40 Courtesy Capital Metro 1 1 MTA New York City Transit 0 3,704 640 0 4,344 New York City 2 3 New Jersey Transit Corp. 47 2,263 85 0 2,395 Newark, N.J. 3 2 Metro 50 1,956 378 0 2,384
High-Speed Rail: Realizing the Potential of Megaregion Economies
 High-Speed Rail: Realizing the Potential of Megaregion Economies Petra Todorovich Director, America 2050 Regional Plan Association May 4, 2010 Rayburn House Office Building 1 2 1 Where High-Speed Rail
Emerging Trends in Real Estate Sustaining Momentum but Taking Nothing for Granted
 Emerging Trends in Real Estate 2015 Sustaining Momentum but Taking Nothing for Granted PwC-ULI Outlook on trends 36th edition 368 interviews 1,055 survey responses 1,400+ participants, a record Who? District
Hotel Valuation and Transaction Trends For the U.S. Lodging Industry
 Hotel Valuation and Transaction Trends For the U.S. Lodging Industry Steve Rushmore, MAI, FRICS, CHA President and Founder HVS 372 Willis Avenue Mineola, NY 11501 516-248-8828 ext. 204 srushmore@hvs.com
Major Metropolitan Area Sales Tax Rates
 August 19, 2010 No. 239 FISCAL FACT Major Metropolitan Area Sales Tax Rates By Lawrence Summers Introduction General sales taxes levied by state, county and city governments in the United States vary greatly,
REGIONALLY FOCUSED. GLOBALLY COMPETITIVE.
 ABOUT EDC WHO WE ARE Mission: San Diego Regional Economic Development Corporation s mission is to maximize the region s economic prosperity and global competitiveness. Vision: The San Diego Region will
Aviation Insights No. 5
 Aviation Insights Explaining the modern airline industry from an independent, objective perspective No. 5 November 16, 2017 Question: How has air travel in specific metropolitan areas changed in recent
MINNEAPOLIS TOURISM MASTER PLAN STEERING COMMITTEE MEETING AUGUST 24, 2016
 MINNEAPOLIS TOURISM MASTER PLAN STEERING COMMITTEE MEETING AUGUST 24, 2016 TODAY S AGENDA Welcome & Introductions: Bill Background & Today s Objectives: Bill Co-Chairs Comments Mayor Hodges David Berg
Q U.S. HOTEL FIGURES
 Q4 2017 U.S. HOTEL FIGURES Q4 2017 U.S. HOTEL FIGURES EXECUTIVE SUMMARY HURRICANES, RISING INCOMES DRIVE STRONG YEAR-END DEMAND GROWTH Demand 3.7% Supply 1.9% Occupancy 1.8% ADR 2.4% RevPAR 4.2% Arrows
TOP 100 Bus Fleets Agency 35 ft. and Over Artic under 35 ft. Total. 18 < metro magazine SEPTEMBER/OCTOBER 2018 metro-magazine.
 1 1 MTA New York City Transit/MTA Bus Co. 0 4,860 951 5,811 New York City 2 3 New Jersey Transit Corp. 418 2,879 85 3,382 Newark, N.J. 3 2 Los Angeles County Metropolitan Transportation Authority 50 1,882
Census Affects Children in Poverty by Professors Donald Hernandez and Nancy Denton State University of New York, Albany
 Phone: (301) 457-9900 4700 Silver Hill Road, Suite 1250-3, Suitland, MD 20746 Fax: (301) 457-9901 Census Affects in Poverty by Professors Donald Hernandez and Nancy Denton State University of New York,
District Match Data Availability
 District Match Data Availability National & State Data Location Available National Data Australia Parliament, Provincial and Territory Assemblies Canada Parliament, Provincial Legislative Assemblies New
Glenn R. Mueller, Ph.D. Professor University of Denver. Franklin L. Burns School of Real Estate & Construction Management &
 Real Estate Cycles Glenn R. Mueller, Ph.D. Professor University of Denver Franklin L. Burns School of Real Estate & Construction Management & Real Estate Investment Strategist Dividend Capital Research
PUBLIC TRANSPORTATION INTRODUCTION
 PUBLIC TRANSPORTATION INTRODUCTION 1 OUTLINE Current Status and Recent Trends Significant Influences A Critical Assessment Arguments Supporting Public Transport Future Influences Ingredients for Future
Hotel Valuation and Transaction Trends For the U.S. Lodging Industry
 Hotel Valuation and Transaction Trends For the U.S. Lodging Industry Stephen Rushmore, CHA, MAI President and Founder HVS International 372 Willis Avenue Mineola, NY 11501 516-248-8828 ext. 204 srushmore@hvsinternational.com
Norwegian's Free Airfare Promotion
 Norwegian's Free Airfare Promotion Start planning your next vacation with 200+ cruises to incredible destinations, including Alaska, Bahamas & Florida, Bermuda, Canada & New England, Caribbean, Mexican
 Snakes & Lattes is currently composed of three corporate owned and operated board game cafes in Toronto, ON. Over the last 7 years these have become renowned as Toronto's premiere board game cafe destinations.
A COMPARISON OF THE MILWAUKEE METROPOLITAN AREA TO ITS PEERS
 KRY/WJS/EDL #222377 (PDF: #223479) 1/30/15 PRELIMINARY DRAFT Memorandum Report A COMPARISON OF THE MILWAUKEE METROPOLITAN AREA TO ITS PEERS EXECUTIVE SUMMARY This memorandum report provides a statistical
2012 Airport Ground Transportation
 212 Airport Ground Transportation Fees and Fares Survey Summary March 212 AGTA 212 Airport Fees and Fares Survey Summary Survey Respondents Atlantic City International Airport Gulfport-Biloxi International
Glenn R. Mueller, Ph.D. Professor University of Denver. Franklin L. Burns School of Real Estate & Construction Management & Dividend Capital Research
 Real Estate Cycles Glenn R. Mueller, Ph.D. Professor University of Denver Franklin L. Burns School of Real Estate & Construction Management & Real Estate Investment Strategist Dividend Capital Research
Higher Education in America s Metropolitan Areas A Statistical Profile
 Higher Education in America s Metropolitan Areas A Statistical Profile MSA Study No.2 Higher Education in America s Metropolitan Areas A Statistical Profile CONTENTS Why Metro Areas? 1 Executive Summary
University of Denver. Dividend Capital Research
 Glenn R. Mueller, Ph.D. Professor University of Denver Franklin L. Burns School of Real Estate & Construction Management & Real Estate Investment Strategist Dividend Capital Research glenn.mueller@du.edu
Hector International Airport Fargo, North Dakota
 Hector International Airport Fargo, North Dakota Volume 072 Twelve Months Ended June 2007 November 2007 Airlines Serving Fargo Carried 830 Onboard Passengers Per Day for the Twelve Months Ended June 2007,
Hector International Airport Fargo, North Dakota
 Hector International Airport Fargo, North Dakota Volume 073 Twelve Months Ended September 2007 January 2008 Airlines Serving Fargo Carried 831 Onboard Passengers Per Day for the Twelve Months Ended September
Metropolitan Votes and the 2012 U.S. Election: Population, GDP, Patents and Creative Class
 politan Votes and the 2012 U.S. Election: Population, GDP, Patents and Creative Class Author: Shawn Gilligan, Shawn.Gilligan@rotman.utoronto.ca Zara Matheson, Zara.Matheson@rotman.utoronto.ca Kevin Stolarick,
October 2018 October 2017 Change
 AIR TRAFFIC REPORT SUMMARY: OCTOBER PASSENGERS October October Change Domestic Passengers 1,969,141 1,861,225 5.8% International Passengers 89,328 74,157 20.5% Total Passengers 2,058,469 1,935,382 6.4%
Get Smart Market Insights from Our Research Team Customer Conference
 Get Smart Market Insights from Our Research Team 217 Customer Conference Presenters Amanda Nunnink Amanda Nunnink Steve Steve Guggenmos Guggenmos Sara Steve Hoffman Griffin Steve Sara Griffin Hoffmann
DIRECT FASTENING. 20V MAX * Cordless Concrete Nailer
 DIRECT FASTENING 20V MAX * Cordless INTERCHANGEABLE CONTACT TRIPS Drywall and Mechanical contact trips for application versatility Removable; tool-free ADJUSTABLE POWER 3 settings for pin depth adjustment
Factors Influencing Visitor's Choices of Urban Destinations in North America
 Factors Influencing Visitor's Choices of Urban Destinations in North America Ontario Ministry of Tourism and Recreation May 21, 2004 Study conducted by Global Insight Inc. Executive Summary A. Introduction:
U.S. Hotel Industry Performance. Brad Garner Chief Operating Officer
 U.S. Hotel Industry Performance Brad Garner Chief Operating Officer 1 Agenda Total US Review Scale Review Segmentation Markets Supply Pipeline 2013 / 2014 Forecast 2 www.hotelnewsnow.com Click on Hotel
Hotel InduSTRy Overview
 Hotel InduSTRy Overview Lindsay Culbreath, CMHS, CHIA Senior Director of Business Development & Marketing STR Tennessee Business Travel Association October 14, 2014 STR provides monthly, weekly and daily
FBI Drug Demand Reduction Coordinators
 FBI Drug Demand Reduction Coordinators Alabama 2121 Building, Room 1400 Birmingham, AL 35203 (205) 252 7705 One St. Louis Centre One St. Louis Street Mobile, AL 36602 (334) 438 3674 Alaska 222 West Seventh
Access Across America: Transit 2014
 Access Across America: Transit 2014 Final Report CTS 14-11 Prepared by: Andrew Owen David Levinson Accessibility Observatory Department of Civil, Environmental, and Geo- Engineering University of Minnesota
FILED: NEW YORK COUNTY CLERK 10/14/ :25 PM INDEX NO / /4/2016 Office locations in US states: PwC
 FILED: NEW YORK COUNTY CLERK 10/14/2016 02:25 PM INDEX NO. 451962/2016 10/4/2016 Office locations in US states: PwC NYSCEF DOC. NO. 9 RECEIVED NYSCEF: 10/14/2016 PwC office locations in (by state) Below
333 W. Campbell Road, Suite 440 Richardson, Texas Cruising for Charity with Randy Limbacher in Tahiti July 28, 2007
 333 W. Campbell Road, Suite 440 Richardson, Texas 75080 972.238.1998 800.952.1998 Cruising for Charity with Randy Limbacher in Tahiti July 28, 2007 Join me for this special annual event to raise money
NBA - FRI DEC 7, 2018 TEAMS OL F
 NBA & NCAA SCHEDULE GAMES FROM DEC. 6 - DEC. 14, 2018 OSPUBLICATIONS.COM 1-702-991-2215 NBA - THURS DEC 6, 2018 701 NEW YORK 702 BOSTON 703 PHOENIX 704 PORTLAND 705 HOUSTON 706 UTAH 707 MARYLAND 708 PURDUE
National Housing Trends
 National Housing Trends America s Choice of Best Long Term Investment Gallup 2017 The Cost of RENTING vs. BUYING HISTORICALLY: NOW: Percentage of Income Needed to Afford Median Rent 25.8% 29.2% Percentage
Union Pacific Update September 22, 2016 North East Association of Rail Shippers Conference
 Union Pacific Update September 22, 2016 North East Association of Rail Shippers Conference I Sam Calabro Assistant Vice President Domestic Intermodal Sales 1 Seattle Eastport Portland Twin Cities Duluth
Rent Monitor. First Quarter Vol. 83 % GROWTH IN NATIONAL RENTS BY SECTOR NATIONAL EFFECTIVE RENTS BY SECTOR TOP 5 MARKETS GAINING MOMENTUM**
 Rent Monitor TM Asking Rents Vol. 83... Effective Rents... Concessions NATIONAL EFFECTIVE RENTS BY SECTOR 5 YEARS % GROWTH IN NATIONAL RENTS BY SECTOR 12 MONTHS 110 105 100 95 INDEX 1Q 2001 = 100 +4. +4.
Communicating the Importance of Seaports. Bringin It Home. Presented to AAPA Annual Convention Galveston, TX October 27, 2009
 Communicating the Importance of Seaports Bringin It Home Presented to AAPA Annual Convention Galveston, TX October 27, 2009 Jim Kruse Director, Center for Ports & Waterways Texas Transportation Institute
U.S. Hotel Industry Performance HBI Annual Conference
 U.S. Hotel Industry Performance HBI Annual Conference February 17, 2017 Jeff Higley VP/Editorial Director jeff@str.com @jeffhigley1 2016 STR, Inc. All Rights Reserved. Any reprint, use or republication
MARKETBEAT U.S. Shopping Center Q4 2018
 MARKETBEAT U.S. Shopping Center Q4 2018 U.S. SHOPPING CENTER Economic Indicators Market Indicators Rent Rate vs. Overall Vacancy Availability by Type Q4 17 Q4 18 Vacancy Rates 6.7% 6.3% Net Absorption
Regional Outlook STEVEN G. COCHRANE, MANAGING DIRECTOR
 Regional Outlook STEVEN G. COCHRANE, MANAGING DIRECTOR Differences Narrow; Southeast Vies for Lead Employment, % change yr ago 3.5 3.0 Southwest 2.5 2.0 1.5 East South Central South Atlantic Northeast
Interest Bearing. Availability Schedule. April For Encoded Cash Letter Deposits received in Miami. Instructions. Schedule
 Instructions Schedule Bank of America OnUs Supplemental Interest Bearing Availability Schedule For Encoded Cash Letter Deposits received in Miami April 2011 Schedule 01 Availability Schedule for Corporate
A CORPORATE OR MEDICAL USER OPPORTUNITY WELL-LOCATED OFF THE PA TURNPIKE AM Drive. Quakertown, PA INVESTMENT SUMMARY. Page 1
 A CORPORATE OR MEDICAL USER OPPORTUNITY WELL-LOCATED OFF THE PA TURNPIKE 1900 AM Drive Quakertown, PA INVESTMENT SUMMARY Page 1 EXECUTIVE SUMMARY On behalf of ownership, Avison Young is pleased to offer
Hector International Airport Fargo, North Dakota
 Hector International Airport Fargo, North Dakota Volume 081 Twelve Months Ended March 2008 July 2008 Airlines Serving Fargo Carried 838 Onboard Passengers Per Day for the Twelve Months Ended March 2008,
International Convention Badges
 Images may not be the actual size. (Reduced the image sizes to save white space in the catalog) Images provided by Lion Verle Malik Created 07/24/2015. 1923 1924 1925 7th Annual Convention June 26-29,
Raleigh-Durham 6.8% 209, , % Market Overview. Market Facts. Third Quarter 2018 / Retail Market Report
 Market Report Raleigh-Durham Market Facts Market Overview 6.8% Total market vacancy flat year-over-year 209,683 SF absorbed year-to-date 767,581 SF under construction 3.4% Triangle unemployment in August
Major US City Preparedness For an Oil Crisis Which Cities and Metro Areas are Best Prepared for $4 a Gallon Gas and Beyond?
 Major US City Preparedness For an Oil Crisis Which Cities and Metro Areas are Best Prepared for $4 a Gallon Gas and Beyond? March 4, 2008 By Warren Karlenzig President Common Current www.commoncurrent.com
November Air Traffic Statistics. Prepared by the Office of Corporate Risk and Strategy
 November 214 Air Traffic Statistics Prepared by the Office of Corporate Risk and Strategy Air Traffic Statistics Table of Contents Summary Air Traffic Summary... 1 SH&E Air Traffic Schedule Activity...
MARKETBEAT U.S. Office
 MARKETBEAT U.S. Office Q3 2018 U.S. OFFICE Employment Indicators Market Indicators (Overall) Office: Net Absorption/Asking Rent 4Q TRAILING AVERAGE Office: Overall Vacancy Q3 17 Q3 18 Total Nonfarm Employment
World Class Airport For A World Class City
 World Class Airport For A World Class City Air Service Update December 2018 2018 Air Service Updates February 2018 Delta Air Lines Seattle new departure, seasonal, 2x weekly Delta Air Lines Boston new
1Q 2014 Greater Atlanta HBA Builder Developer Lender Council meeting Information presented by. Atlanta Job Growth
 1Q 2014 Greater Atlanta HBA Builder Developer Lender Council meeting 5-21-2014 Information presented by Eugene James, Regional Director ejames@metrostudy.com 404-510-1080 connect on LinkedIn Atlanta Job
Westshore Development Forum April 11, Hillsborough County Aviation Authority
 Westshore Development Forum April 11, 2017 Aviation in Florida Only state with four large hub airports $144 billion in annual economic activity or output Approximately 43.1 million visitors come to Florida
OB-GYN Workload & Potential Shortages: The Coming U.S. Women s Health Crisis
 OB-GYN Workload & Potential Shortages: The Coming U.S. Women s Health Crisis JULY 2017 Introduction Obstetricians and Gynecologists (OB-GYNs) are a critical part of the health care provider community.
MARKETBEAT U.S. Office
 MARKETBEAT U.S. Office Q2 2017 U.S. OFFICE Employment Indicators Q2 16 Q2 17 Total Nonfarm Employment 143.9M 146.2M Office-using Employment 30.1M 31.8M Unemployment 4.9% 4.4% Source: BLS Market Indicators
16,000 50,000 WALKATHON CITIES WALKERS MILES
 WALKATHON 54 USA ARIZONA Phoenix ARKANSAS Little Rock CALIFORNIA Fresno Los Angeles Sacramento San Diego San Francisco San Jose CONNECTICUT Hartford DELAWARE New Castle FLORIDA Miami Orlando Tampa GEORGIA
SEPTEMBER 2014 BOARD INFORMATION PACKAGE
 SEPTEMBER 2014 BOARD INFORMATION PACKAGE MEMORANDUM TO: Members of the Airport Authority FROM: Lew Bleiweis, Executive Director DATE: September 19, 2014 Informational Reports: A. July, 2014 Traffic Report
MARKETBEAT U.S. Office
 MARKETBEAT U.S. Office Q3 2017 U.S. OFFICE Employment Indicators Net Absorption/Rent 4-QTR TRAILING AVERAGE Q3 16 Q3 17 Total Nonfarm Employment 144.7M 146.6M Office-using Employment 31.3M 31.9M Unemployment
October Air Traffic Statistics. Prepared by the Office of Corporate Risk and Strategy
 October 214 Air Traffic Statistics Prepared by the Office of Corporate Risk and Strategy Metropolitan Washington Airports Authority Air Traffic Statistics Table of Contents Summary Air Traffic Summary...
U.S. and Fort Lauderdale Hotel Industry Performance Fort Lauderdale August 8, 2017
 U.S. and Fort Lauderdale Hotel Industry Performance Fort Lauderdale August 8, 2017 Chris Klauda Director, Destination Research cklauda@str.com 2017 STR, Inc. All Rights Reserved. Any reprint, use or republication
Annual Meeting full listing
 Annual Meeting full listing May 7-11, 2017 Baltimore, Md. Annual Meeting May 1-5, 2016 Seattle, Wash Annual Meeting May 3-7, 2015 Denver, Colo. Annual Meeting May 4-8, 2014 Orlando, Fla. Annual Meeting
Passengers Boarded At The Top 50 U. S. Airports ( Updated April 2
 (Ranked By Passenger Enplanements in 2006) Airport Table 1-41: Passengers Boarded at the Top 50 U.S. Airportsa Atlanta, GA (Hartsfield-Jackson Atlanta International) Chicago, IL (Chicago O'Hare International)
MARKETBEAT U.S. Office
 MARKETBEAT U.S. Office Q1 2017 U.S. OFFICE Employment Indicators Q1 16 Q1 17 Total Nonfarm Employment 143.4M 145.7M Offi ce-using Employment 30.9M 31.7M Unemployment 4.9% 4.6% Source: BLS Market Indicators
MARKETBEAT U.S. Office
 MARKETBEAT U.S. Office Q4 2018 U.S. OFFICE Employment Indicators Market Indicators (Overall) Office: Net Absorption/Asking Rent 4Q TRAILING AVERAGE Office: Overall Vacancy Q4 17 Q4 18 Total Nonfarm Employment
Transborder Air Services Since 1994
 Tri-Airport Open Skies Initiative Transborder Air Services Since 1994 strategic transportation & tourism solutions Prepared for Aéroports de Montréal, The Greater Toronto Airport Authority, and the Vancouver
USA/Canada Lions. Leadership Forum Pins
 USA/Canada Lions Leadership Forum Pins USA/Canada Lions Leadership Pins CONTENTS USA/Canada Lions Leadership Loca ons USA/Canada Lions Leadership Theme Pins USA/Canada Lions Leadership Anniversary Pins
ANNUAL BUSINESS TRAVEL INDEX MARCH 2018
 ANNUAL BUSINESS TRAVEL INDEX MARCH 2018 www.ovationtravel.com www.lawyerstravel.com 800.431.1112 TABLE OF CONTENTS ANNUAL DOMESTIC AIRFARE AVERAGE PRICE PAID...3 ANNUAL INTERNATIONAL AIRFARE AVERAGE PRICE
PORTLAND INTERNATIONAL AIRPORT
 PORTLAND INTERNATIONAL AIRPORT (PDX) OPERATIONS & CITIES SERVED 2018 (AS OF SEPTEMBER) SCHEDULED ARRIVALS 268 SCHEDULED DEPARTURES 268 NONSTOP CITIES (AIRPORTS) 57 DOMESTIC CITIES 51 INTERNATIONAL CITIES