High-Speed Rail: Realizing the Potential of Megaregion Economies
|
|
|
- Gregory Morgan
- 5 years ago
- Views:
Transcription


1 High-Speed Rail: Realizing the Potential of Megaregion Economies Petra Todorovich Director, America 2050 Regional Plan Association May 4, 2010 Rayburn House Office Building 1 2 1


2 Where High-Speed Rail Works Best 3 Where High-Speed Rail Works Best Population Distance Transit connections Economic productivity Congestion In a megaregion 4 2


3 Metro Area Population 5 Top 40 Population Centers (10 Mile buffer) New York 7,318,733 San Diego 1,019,025 Los Angeles 3,539,479 San Antonio 1,010,456 Chicago 2,679,559 Seattle 962,684 Philadelphia 2,071,586 Milwaukee 922,468 Washington 1,856,767 Orlando 902, Boston 1,698,328 Columbus 898,083 Miami 1,668,855 Pittsburgh 897,058 Las Vegas 1,499,208 Cleveland 859,527 Houston 1,473,189 Sacramento 838,999 San Jose 1,465,661 Saint Louis 821,741 Denver 1,390,727 Cincinnati 817,328 Phoenix 1,375,409 Kansas City 763,394 Detroit 1,344, Indianapolis 762,971 San Francisco 1,284,613 Austin 750,989 Baltimore 1,269,746 Tucson 723,509 Minneapolis 1,200,827 Tampa 719,958 Dallas 1,181,947 Salt Lake City 702,254 Portland 1,161,880 Providence 686,381 Atlanta 1,086,245 Charlotte 674,624 Riverside 1,020,138 New Orleans 650,
4 Top 20 Population & Employment Centers (2 Mile buffer) Top 20 Population Centers (2 Mile Buffer) New York 524,767 San Francisco 342,881 Philadelphia 220,662 Baltimore 172,945 Boston 171,078 Los Angeles 156,656 Chicago 143,311 Washington 141,811 Las Vegas 124,305 Providence 123,098 Rochester 111,881 San Jose 111,775 Minneapolis 108,490 Trenton 107,669 Miami 102,068 Hartford 96,718 Denver 95,312 Milwaukee 95,064 Oxnard 94,108 Seattle 93,975 Top 20 Employment Centers (2 Mile Buffer) New York 1,667,072 Chicago 554,112 Boston 448,756 San Francisco 426,200 Washington 302,458 Philadelphia 234,859 Seattle 221,104 Los Angeles 189,991 Minneapolis 188,303 Pittsburgh 154,522 Baltimore 151,124 Portland 150,459 Denver 142,586 Houston 135,670 Dallas 133,401 Milwaukee 122,368 Saint Louis 111,298 New Orleans 102,051 Kansas City 101,308 7 Birmingham 90,729 Trip Distance Image: Yoav Hagler 8 4


5 Extent of Transit System & Metro Population 5.4 M 5.8 M 6.3 M 7.3 M Miami 7.6 M Houston 50 Miles Philadelphia Boston 9.5 M 21.3 M Baltimore-Washington Chicago New York 9 Los Angeles Transit Volumes 10 5


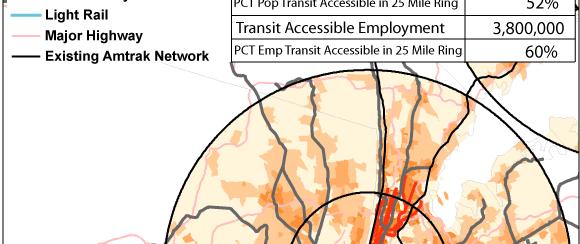
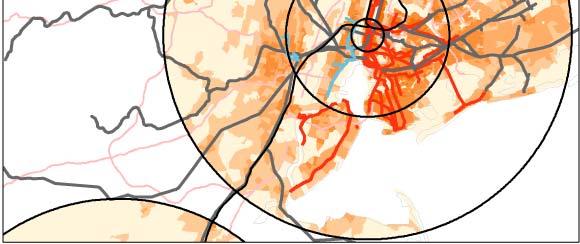
6 Houston Transit Volumes 11 New York Transit Volumes 12 6


7 Economic Productivity & Specialization Share of employment in service sector / knowledge industries industries Per Capita GDP San Francisco: $69,000 Washington DC: $69,000 Boston: $61, Flights Per Day by Megaregions 14 7


8 How does HSR promote economic development? 1. Boost productivity it for service sector businesses (time and money savings translates to productivity gains, higher wages) 15 How does HSR promote economic development? 2. Deepen labor markets for employers 3. Broaden employment pool for workers Source: Martin Prosperity Institute, University of Toronto 16 8


9 How does HSR promote economic development? 4. Foster economic synergies among specialized industries (agglomeration economies) Image: U. Penn Northeast Megaregion Studio How does HSR promote economic development? 5. Serve as a focal point of future development 6. Make better, more efficient use of infrastructure EuroStar Station and development, Lille, France 18 9
10 How does HSR promote economic development? 7.Evidence of economic benefits to smaller cities within 2 hours commuting distance of London. Chen and Hall (2010) The Impacts of High-Speed Trains on British Economic Geography 19 How does HSR promote economic development? 8. Transformative effects. The interstate system fundamentally altered relationships between time, cost, and space in a manner which allowed new economic opportunities to emerge that would never have emerged under previous technologies. National System of Interstate Highways, Public Roads Administration, 1947 Quote source: The Economic Impact of the Interstate Highway System. NCHRP Project (52) FY


11 Cautions and Caveats HSR in itself is not an economic development tool HSR benefits can be one way street, esp. for park and ride stations Haute Picardie a.k.a. beetroot station 21 Lyon St. Exupery Station Image: Flickr/ VerseVend Importance of Megaregion Coalitions Business Alliance for Northeast Mobility Coalition of chambers of commerce, civic organizations Pivotal role in passing PRIIA United support for Northeast Corridor Investments Reception in U.S. Capitol Apr 2008 Union Station Press Conference Oct


12 Long Term Commitment 23 Special Thanks Yoav Hagler, Associate Planner, America 2050 Frank Hebbert, Associate Planer, GIS Lin Zeng, America 2050 Intern Contact: Petra Todorovich, T:
Lower Income Journey to Work Market Share From American Community Survey
 Lower Income Journey to Work Market Share From American Community Survey 2006-2010 Table 1: Overall National Data Table 2: Car, Truck or Van Table 3: Transit Table 4: Metrics Table 1 Work Trip Market Share:
University of Denver
 Glenn R. Mueller, Ph.D. Professor University of Denver Franklin L. Burns School of Real Estate & Construction Management & Real Estate Investment Strategist glenn.mueller@du.edu Supply The new supply of
MANGO MARKET DEVELOPMENT INDEX REPORT
 MANGO MARKET DEVELOPMENT INDEX REPORT 2015-2016 UNDERSTANDING THE MARKET INDEX The Mango Market Development Index is designed to measure and compare mango sales volume relative to population by region
Monthly Employment Watch: Milwaukee and the Nation's Largest Cities
 Monthly Employment Watch: Milwaukee and the Nation's Largest Cities A monthly report on employment trends in the nation s largest cities Prepared by: The University of Wisconsin-Milwaukee Center for Economic
PUBLIC TRANSPORTATION INTRODUCTION
 PUBLIC TRANSPORTATION INTRODUCTION 1 OUTLINE Current Status and Recent Trends Significant Influences A Critical Assessment Arguments Supporting Public Transport Future Influences Ingredients for Future
REGIONALLY FOCUSED. GLOBALLY COMPETITIVE.
 ABOUT EDC WHO WE ARE Mission: San Diego Regional Economic Development Corporation s mission is to maximize the region s economic prosperity and global competitiveness. Vision: The San Diego Region will
Mango Market Development Index
 Mango Market Development Index 2016-2017 Understanding the Market Index The Mango Market Development Index is designed to measure and compare mango volume sold at retail relative to population by region
Monthly Employment Watch: Milwaukee and the Nation's Largest Cities
 Monthly Employment Watch: Milwaukee and the Nation's Largest Cities A monthly report on employment trends in the nation s largest cities Prepared by: The University of Wisconsin-Milwaukee Center for Economic
Monthly Employment Watch: Milwaukee and the Nation's Largest Cities
 Monthly Employment Watch: Milwaukee and the Nation's Largest Cities A monthly report on employment trends in the nation s largest cities Prepared by: The University of Wisconsin-Milwaukee Center for Economic
Monthly Employment Watch: Milwaukee and the Nation's Largest Cities
 Monthly Employment Watch: Milwaukee and the Nation's Largest Cities A monthly report on employment trends in the nation s largest cities Prepared by: The University of Wisconsin-Milwaukee Center for Economic
A COMPARISON OF THE MILWAUKEE METROPOLITAN AREA TO ITS PEERS
 KRY/WJS/EDL #222377 (PDF: #223479) 1/30/15 PRELIMINARY DRAFT Memorandum Report A COMPARISON OF THE MILWAUKEE METROPOLITAN AREA TO ITS PEERS EXECUTIVE SUMMARY This memorandum report provides a statistical
Monthly Employment Watch: Milwaukee and the Nation's Largest Cities
 Monthly Employment Watch: Milwaukee and the Nation's Largest Cities A monthly report on employment trends in the nation s largest cities Prepared by: The University of Wisconsin-Milwaukee Center for Economic
Park-Related Total* Expenditure per Resident, by City
 Park-Related Total* per Resident, by City FY 2008 City Population Total Park per Resident Washington, D.C. 591,833 $153,324,830 $259 Seattle 598,541 $150,672,543 $252 Scottsdale 235,371 $50,429,049 $214
Location, Location, Location. 19 th Annual NIC Conference NIC MAP Data & Analysis Service
 Location, Location, Location 19 th Annual NIC Conference NIC MAP Data & Analysis Service The Great Occupancy Decline 94% Occupancy Trends Majority Nursing Seniors Housing 93% 92% 91% 92.8% 91.0% 90% 89%
Metropolitan Votes and the 2012 U.S. Election: Population, GDP, Patents and Creative Class
 politan Votes and the 2012 U.S. Election: Population, GDP, Patents and Creative Class Author: Shawn Gilligan, Shawn.Gilligan@rotman.utoronto.ca Zara Matheson, Zara.Matheson@rotman.utoronto.ca Kevin Stolarick,
Monthly Employment Watch: Milwaukee and the Nation's Largest Cities
 Monthly Employment Watch: Milwaukee and the Nation's Largest Cities A monthly report on employment trends in the nation s largest cities Prepared by: The University of Wisconsin-Milwaukee Center for Economic
Hotel Valuation and Transaction Trends for the U.S. Lodging Industry
 Hotel Valuation and Transaction Trends for the U.S. Lodging Industry June 2010 Presented by Steve Rushmore, MAI, FRICS, CHA srushmore@hvs.com - 1 - Value Trend for a Typical U.S. Hotel 1987 1988 1989 1990
Parking Property Advisors and Parkopedia present: TOP 40 US CITIES PARKING INDEX
 Parking Property Advisors and Parkopedia present: TOP 40 US CITIES PARKING INDEX 2018 Parking Property Advisors and Parkopedia proudly present this 2018 Top 40 US Cities Parking Index. Whether you are
Appendix D: Aggregation Error for New England Metro Areas and for Places
 Appendix D: for New England Metro Areas and for Places D-1 Appendix D: s Figure D-1: New England Metro Areas - Summary of Tract s (2000) Metro ID (msapma99) Metro Area Name Census NCDB 1120 Boston, MA-NH
Access Across America: Transit 2014
 Access Across America: Transit 2014 Final Report CTS 14-11 Prepared by: Andrew Owen David Levinson Accessibility Observatory Department of Civil, Environmental, and Geo- Engineering University of Minnesota
San Francisco Travel Association Selling in a Seller s Market DMO Perspective. May 21, 2014
 San Francisco Travel Association Selling in a Seller s Market DMO Perspective May 21, 2014 Agenda Discussion Themes 1. Meetings Are Important 2. Market Meetings Pace 3. Occupancy & Rate 4. Booking Windows
TOP 100 Bus Fleets Agency 35 ft. and Over Artic under 35 ft. Total. 18 < metro magazine SEPTEMBER/OCTOBER 2018 metro-magazine.
 1 1 MTA New York City Transit/MTA Bus Co. 0 4,860 951 5,811 New York City 2 3 New Jersey Transit Corp. 418 2,879 85 3,382 Newark, N.J. 3 2 Los Angeles County Metropolitan Transportation Authority 50 1,882
TOP 100. Transit Bus Fleets Agency 35 ft. Over Artic and 35 ft. Total +/- under 0 3, ,426 82
 L.A. Metro-No. 3 1 1 MTA New York City Transit New York City 2 2 New Jersey Transit Corp. Newark, N.J. 3 3 Metro Los Angeles 4 5 Toronto Transit Commission Toronto 5 10 Chicago Transit Authority Chicago
Agency 35 ft. Over Artic. Trolley 2012 Total and 35 ft. under. 1 1 MTA New York City Transit 0 3, ,344 New York City
 Capital Metro-No. 40 Courtesy Capital Metro 1 1 MTA New York City Transit 0 3,704 640 0 4,344 New York City 2 3 New Jersey Transit Corp. 47 2,263 85 0 2,395 Newark, N.J. 3 2 Metro 50 1,956 378 0 2,384
Rank Place State Native Hawaiian and Pacific Islander population (alone or in combination
 TABLE 2a: 100 Largest Places Ranked by Number of s (race alone or in *) Living in Hard-to- Census Rank Place State (alone or in 1 Honolulu (CDP) HI 64,196 11,130 17.3 2 New York City NY 14,981 8,211 54.8
Get Smart Market Insights from Our Research Team Customer Conference
 Get Smart Market Insights from Our Research Team 217 Customer Conference Presenters Amanda Nunnink Amanda Nunnink Steve Steve Guggenmos Guggenmos Sara Steve Hoffman Griffin Steve Sara Griffin Hoffmann
Higher Education in America s Metropolitan Areas A Statistical Profile
 Higher Education in America s Metropolitan Areas A Statistical Profile MSA Study No.2 Higher Education in America s Metropolitan Areas A Statistical Profile CONTENTS Why Metro Areas? 1 Executive Summary
BLACK KNIGHT HPI REPORT
 CONTENTS 1 OVERVIEW 2 NATIONAL OVERVIEW 3 LARGEST STATES AND METROS 4 FEBRUARY S BIGGEST MOVERS 5 20 LARGEST STATES 6 40 LARGEST METROS 7 ADDITIONAL INFORMATION OVERVIEW Each month, the Data & Analytics
Hotel Valuation and Transaction Trends For the U.S. Lodging Industry
 Hotel Valuation and Transaction Trends For the U.S. Lodging Industry Stephen Rushmore, CHA, MAI President and Founder HVS International 372 Willis Avenue Mineola, NY 11501 516-248-8828 ext. 204 srushmore@hvsinternational.com
Westshore Development Forum April 11, Hillsborough County Aviation Authority
 Westshore Development Forum April 11, 2017 Aviation in Florida Only state with four large hub airports $144 billion in annual economic activity or output Approximately 43.1 million visitors come to Florida
Communicating the Importance of Seaports. Bringin It Home. Presented to AAPA Annual Convention Galveston, TX October 27, 2009
 Communicating the Importance of Seaports Bringin It Home Presented to AAPA Annual Convention Galveston, TX October 27, 2009 Jim Kruse Director, Center for Ports & Waterways Texas Transportation Institute
RANKING OF THE 100 MOST POPULOUS U.S. CITIES 12/7/ /31/2016
 OVERVIEW OF THE DATA The following information is based on incoming communication to the National Human Trafficking Hotline via phone, email, and online tip report from December 7, 2007 December 31, 2016
OB-GYN Workload & Potential Shortages: The Coming U.S. Women s Health Crisis
 OB-GYN Workload & Potential Shortages: The Coming U.S. Women s Health Crisis JULY 2017 Introduction Obstetricians and Gynecologists (OB-GYNs) are a critical part of the health care provider community.
Aviation Insights No. 5
 Aviation Insights Explaining the modern airline industry from an independent, objective perspective No. 5 November 16, 2017 Question: How has air travel in specific metropolitan areas changed in recent
Factors Influencing Visitor's Choices of Urban Destinations in North America
 Factors Influencing Visitor's Choices of Urban Destinations in North America Ontario Ministry of Tourism and Recreation May 21, 2004 Study conducted by Global Insight Inc. Executive Summary A. Introduction:
Emerging Trends in Real Estate Sustaining Momentum but Taking Nothing for Granted
 Emerging Trends in Real Estate 2015 Sustaining Momentum but Taking Nothing for Granted PwC-ULI Outlook on trends 36th edition 368 interviews 1,055 survey responses 1,400+ participants, a record Who? District
Social Media In Your New & Improved Phoenix Sky Harbor
 Social Media In Your New & Improved Phoenix Sky Harbor AZ Chapter of HSMAI September 19, 2013 It always begins & ends with: skyharbor.com Began Facebook page in October 2010 More than 27,000 people Like
FILED: NEW YORK COUNTY CLERK 10/14/ :25 PM INDEX NO / /4/2016 Office locations in US states: PwC
 FILED: NEW YORK COUNTY CLERK 10/14/2016 02:25 PM INDEX NO. 451962/2016 10/4/2016 Office locations in US states: PwC NYSCEF DOC. NO. 9 RECEIVED NYSCEF: 10/14/2016 PwC office locations in (by state) Below
Fort Lauderdale August 8, 2017
 Fort Lauderdale August 8, 2017 8/10/2017 TAP Software Analytics Division Brian Finucane TAP Reports Jeff Eastman TAP Hotel Reports Jeanne Eastman TAP Data Source Jeff Eastman Cloud Database Numerous Data
Puget Sound Trends. Executive Board January 24, 2019
 Puget Sound Trends Executive Board January 24, 2019 Overview Topics covered in today s presentation: How many jobs are there? Housing Trends Where do people work? How long does it take to get to work?
MINNEAPOLIS TOURISM MASTER PLAN STEERING COMMITTEE MEETING AUGUST 24, 2016
 MINNEAPOLIS TOURISM MASTER PLAN STEERING COMMITTEE MEETING AUGUST 24, 2016 TODAY S AGENDA Welcome & Introductions: Bill Background & Today s Objectives: Bill Co-Chairs Comments Mayor Hodges David Berg
U.S. Lodging Industry Update
 U.S. Lodging Industry Update First Watch on a Long Voyage R. MARK WOODWORTH AMERICAS RESEARCH AGENDA THE ECONOMY WHAT COULD END THE CURRENT CYCLE? LABOR COSTS OUR FORECASTS SHARING ECONOMY UPDATE First
University of Denver. Dividend Capital Research
 Glenn R. Mueller, Ph.D. Professor University of Denver Franklin L. Burns School of Real Estate & Construction Management & Real Estate Investment Strategist Dividend Capital Research glenn.mueller@du.edu
Major Metropolitan Area Sales Tax Rates
 August 19, 2010 No. 239 FISCAL FACT Major Metropolitan Area Sales Tax Rates By Lawrence Summers Introduction General sales taxes levied by state, county and city governments in the United States vary greatly,
Glenn R. Mueller, Ph.D. Professor University of Denver. Franklin L. Burns School of Real Estate & Construction Management & Dividend Capital Research
 Real Estate Cycles Glenn R. Mueller, Ph.D. Professor University of Denver Franklin L. Burns School of Real Estate & Construction Management & Real Estate Investment Strategist Dividend Capital Research
Rent Monitor. First Quarter Vol. 83 % GROWTH IN NATIONAL RENTS BY SECTOR NATIONAL EFFECTIVE RENTS BY SECTOR TOP 5 MARKETS GAINING MOMENTUM**
 Rent Monitor TM Asking Rents Vol. 83... Effective Rents... Concessions NATIONAL EFFECTIVE RENTS BY SECTOR 5 YEARS % GROWTH IN NATIONAL RENTS BY SECTOR 12 MONTHS 110 105 100 95 INDEX 1Q 2001 = 100 +4. +4.
Hector International Airport Fargo, North Dakota
 Hector International Airport Fargo, North Dakota Volume 072 Twelve Months Ended June 2007 November 2007 Airlines Serving Fargo Carried 830 Onboard Passengers Per Day for the Twelve Months Ended June 2007,
A COMPARISON OF THE MILWAUKEE METROPOLITAN AREA TO ITS PEERS
 KRY/WJS/EDL #222377 v4 (PDF: #223479v2) 4/1/15 APPENDIX D REVISED DRAFT Memorandum Report A COMPARISON OF THE MILWAUKEE METROPOLITAN AREA TO ITS PEERS EXECUTIVE SUMMARY This report provides a statistical
Population Estimates for U.S. Cities Report 1: Fastest Growing Cities Based on Numeric Increase,
 ulation s for U.S. Cities Report 1: Fastest Growing Cities Based on Numeric Increase, 2015-2015 1 Phoenix AZ 32,113 2.0 1,582,904 1,615,017 167,393 11.6 2 Los Angeles CA 27,173 0.7 3,949,149 3,976,322
ustravel.org/travelpromotion
 Agenda 1. Power of Travel Promotion Resources 2. New Tool: Travel Economic Impact Calculator 3. Accessing data through Interactive Travel Analytics 4. Unused Vacation Time Opportunity 5. Highlights from
World Class Airport For A World Class City
 World Class Airport For A World Class City Air Service Update April 2018 2018 Air Service Updates February 2018 Seattle new departure, seasonal, 2x weekly Boston new departure, seasonal, 2x weekly March
Glenn R. Mueller, Ph.D. Professor University of Denver. Franklin L. Burns School of Real Estate & Construction Management &
 Real Estate Cycles Glenn R. Mueller, Ph.D. Professor University of Denver Franklin L. Burns School of Real Estate & Construction Management & Real Estate Investment Strategist Dividend Capital Research
MARKETBEAT U.S. Office
 MARKETBEAT U.S. Office Q4 2018 U.S. OFFICE Employment Indicators Market Indicators (Overall) Office: Net Absorption/Asking Rent 4Q TRAILING AVERAGE Office: Overall Vacancy Q4 17 Q4 18 Total Nonfarm Employment
World Class Airport For A World Class City
 World Class Airport For A World Class City Air Service Update October 2017 2017 Air Service Updates February 2017 Cleveland new destination, 2x weekly Raleigh-Durham new destination, 2x weekly March 2017
District Match Data Availability
 District Match Data Availability National & State Data Location Available National Data Australia Parliament, Provincial and Territory Assemblies Canada Parliament, Provincial Legislative Assemblies New
 Snakes & Lattes is currently composed of three corporate owned and operated board game cafes in Toronto, ON. Over the last 7 years these have become renowned as Toronto's premiere board game cafe destinations.
FBI Drug Demand Reduction Coordinators
 FBI Drug Demand Reduction Coordinators Alabama 2121 Building, Room 1400 Birmingham, AL 35203 (205) 252 7705 One St. Louis Centre One St. Louis Street Mobile, AL 36602 (334) 438 3674 Alaska 222 West Seventh
Annual Meeting full listing
 Annual Meeting full listing May 7-11, 2017 Baltimore, Md. Annual Meeting May 1-5, 2016 Seattle, Wash Annual Meeting May 3-7, 2015 Denver, Colo. Annual Meeting May 4-8, 2014 Orlando, Fla. Annual Meeting
TRANSPORTATION PROGRAMS
 High Speed Transit Corridor Studies Rail/Freight Session 2011 ITE/MSA Spring Conference Black Canyon Conference Center Phoenix, Arizona March 9, 2011 The Maricopa Association of Governments (MAG) is the
Census Affects Children in Poverty by Professors Donald Hernandez and Nancy Denton State University of New York, Albany
 Phone: (301) 457-9900 4700 Silver Hill Road, Suite 1250-3, Suitland, MD 20746 Fax: (301) 457-9901 Census Affects in Poverty by Professors Donald Hernandez and Nancy Denton State University of New York,
16,000 50,000 WALKATHON CITIES WALKERS MILES
 WALKATHON 54 USA ARIZONA Phoenix ARKANSAS Little Rock CALIFORNIA Fresno Los Angeles Sacramento San Diego San Francisco San Jose CONNECTICUT Hartford DELAWARE New Castle FLORIDA Miami Orlando Tampa GEORGIA
Hector International Airport Fargo, North Dakota
 Hector International Airport Fargo, North Dakota Volume 073 Twelve Months Ended September 2007 January 2008 Airlines Serving Fargo Carried 831 Onboard Passengers Per Day for the Twelve Months Ended September
MARKETBEAT U.S. Office
 MARKETBEAT U.S. Office Q2 2017 U.S. OFFICE Employment Indicators Q2 16 Q2 17 Total Nonfarm Employment 143.9M 146.2M Office-using Employment 30.1M 31.8M Unemployment 4.9% 4.4% Source: BLS Market Indicators
MARKETBEAT U.S. Office
 MARKETBEAT U.S. Office Q3 2018 U.S. OFFICE Employment Indicators Market Indicators (Overall) Office: Net Absorption/Asking Rent 4Q TRAILING AVERAGE Office: Overall Vacancy Q3 17 Q3 18 Total Nonfarm Employment
Regional Outlook STEVEN G. COCHRANE, MANAGING DIRECTOR
 Regional Outlook STEVEN G. COCHRANE, MANAGING DIRECTOR Differences Narrow; Southeast Vies for Lead Employment, % change yr ago 3.5 3.0 Southwest 2.5 2.0 1.5 East South Central South Atlantic Northeast
333 W. Campbell Road, Suite 440 Richardson, Texas Cruising for Charity with Randy Limbacher in Tahiti July 28, 2007
 333 W. Campbell Road, Suite 440 Richardson, Texas 75080 972.238.1998 800.952.1998 Cruising for Charity with Randy Limbacher in Tahiti July 28, 2007 Join me for this special annual event to raise money
National Housing Trends
 National Housing Trends America s Choice of Best Long Term Investment Gallup 2017 The Cost of RENTING vs. BUYING HISTORICALLY: NOW: Percentage of Income Needed to Afford Median Rent 25.8% 29.2% Percentage
Norwegian's Free Airfare Promotion
 Norwegian's Free Airfare Promotion Start planning your next vacation with 200+ cruises to incredible destinations, including Alaska, Bahamas & Florida, Bermuda, Canada & New England, Caribbean, Mexican
Major US City Preparedness For an Oil Crisis Which Cities and Metro Areas are Best Prepared for $4 a Gallon Gas and Beyond?
 Major US City Preparedness For an Oil Crisis Which Cities and Metro Areas are Best Prepared for $4 a Gallon Gas and Beyond? March 4, 2008 By Warren Karlenzig President Common Current www.commoncurrent.com
Interest Bearing. Availability Schedule. April For Encoded Cash Letter Deposits received in Miami. Instructions. Schedule
 Instructions Schedule Bank of America OnUs Supplemental Interest Bearing Availability Schedule For Encoded Cash Letter Deposits received in Miami April 2011 Schedule 01 Availability Schedule for Corporate
MARKETBEAT U.S. Industrial Snapshot Q4 2015
 MARKETBEAT U.S. Industrial Snapshot Q4 2015 U.S. INDUSTRIAL Employment Indicators Q4 14 Q4 15 Total Nonfarm Employment 140.2M 143.0M Industrial Employment 23.4M 23.6M Unemployment 5.7% 5.0% Market Indicators
INDIANA INTERSTATE AND INTRASTATE LOCAL REDUCED CITY-PAIR FARES
 The following section contains city-pair fares that are lower than walkup mileage-based fares. Although shown in only one direction, the fares in this section apply in both directions, unless otherwise
Union Pacific Update September 22, 2016 North East Association of Rail Shippers Conference
 Union Pacific Update September 22, 2016 North East Association of Rail Shippers Conference I Sam Calabro Assistant Vice President Domestic Intermodal Sales 1 Seattle Eastport Portland Twin Cities Duluth
Hotel Valuation and Transaction Trends For the U.S. Lodging Industry
 Hotel Valuation and Transaction Trends For the U.S. Lodging Industry Steve Rushmore, MAI, FRICS, CHA President and Founder HVS 372 Willis Avenue Mineola, NY 11501 516-248-8828 ext. 204 srushmore@hvs.com
World Class Airport For A World Class City
 World Class Airport For A World Class City Air Service Update December 2018 2018 Air Service Updates February 2018 Delta Air Lines Seattle new departure, seasonal, 2x weekly Delta Air Lines Boston new
Passengers Boarded At The Top 50 U. S. Airports ( Updated April 2
 (Ranked By Passenger Enplanements in 2006) Airport Table 1-41: Passengers Boarded at the Top 50 U.S. Airportsa Atlanta, GA (Hartsfield-Jackson Atlanta International) Chicago, IL (Chicago O'Hare International)
International Convention Badges
 Images may not be the actual size. (Reduced the image sizes to save white space in the catalog) Images provided by Lion Verle Malik Created 07/24/2015. 1923 1924 1925 7th Annual Convention June 26-29,
What was Old is New Again
 What was Old is New Again IN THE BEGINNING.. Streetcars were the backbone of transit: First developed 1885-1889 Fostered economic development of urban areas. Near the streetcar s peak in the early 1920
MARKETBEAT U.S. Office
 MARKETBEAT U.S. Office Q1 2017 U.S. OFFICE Employment Indicators Q1 16 Q1 17 Total Nonfarm Employment 143.4M 145.7M Offi ce-using Employment 30.9M 31.7M Unemployment 4.9% 4.6% Source: BLS Market Indicators
WILL TOMORROW BE BETTER THAN YESTERDAY?
 CBRE HOTELS The World s Leading Hotel Experts. WILL TOMORROW BE BETTER THAN YESTERDAY? HOTEL SECTOR UPDATE OCTOBER 31, 2017 THE AGENDA 1. U.S. Lodging Market The Macro-Economy and Hotels The Changing Traveler
Airport development within VINCI
 Airport development within VINCI 1 The airport sector: a development goal since 1995 VINCI Concessions: a portfolio of outstanding airport concessions 22 airports in Mexico 2 airports in Cambodia: Phnom
Where High-Speed Rail Works Best
 1 Where High-Speed Rail Works Best September 2009 Yoav Hagler Associate Planner, America 2050 Petra Todorovich Director, America 2050 Executive Summary Defining the corridors in America that are most appropriate
United States Office 2Q 2016
 MARKETBEAT United States Office 2Q 2016 U.S. OFFICE Employment Indicators Market Indicators Net Absorption/Rent 4Q TRAILING AVERAGE Overall Vacancy 2Q 15 2Q 16 Total Nonfarm Employment 141.5M 143.9M Offi
Who Sprawls the Most?
 SPRAWL AMERICAN STYLE Who Sprawls the Most? Jackie Cutsinger Research Assistant, Center for Urban Studies Wayne State University Measuring Sprawl in Major Metros Regionally stratified, nationally representative
MARKETBEAT U.S. Office
 MARKETBEAT U.S. Office Q4 2017 U.S. OFFICE Employment Indicators Q4 16 Q4 17 Total Nonfarm Employment 145.2M 147.2M Office-using Employment 31.5M 32.1M Unemployment 4.7% 4.1% Source: BLS Market Indicators
TravelClick: Business Intelligence Lodging Outlook. Sara Duggan. Regional Vice President, Business Intelligence TravelClick 03/23/18
 TravelClick: Business Intelligence 2018 Lodging Outlook Sara Duggan Regional Vice President, Business Intelligence TravelClick 03/23/18 25,000+ Partners 25 283 Million $49 Billion 365 North America Markets
Hector International Airport Fargo, North Dakota
 Hector International Airport Fargo, North Dakota Volume 081 Twelve Months Ended March 2008 July 2008 Airlines Serving Fargo Carried 838 Onboard Passengers Per Day for the Twelve Months Ended March 2008,
3 Aviation Demand Forecast
 3 Aviation Demand 17 s of aviation demand were prepared in support of the Master Plan for Harrisburg International Airport (the Airport or HIA), including forecasts of enplaned passengers, air cargo, based
Pre-Response Meeting RLI # AV-01 Food & Beverage Service Terminals 1 & 2
 Pre-Response Meeting RLI #20120821-AV-01 Food & Beverage Service Terminals 1 & 2 January 17, 2013 FLL in Perspective 2011- FLL ranked as the 21 st busiest airport in the U.S. with 23,349,835 total passengers
MARKETBEAT U.S. Industrial
 MARKETBEAT U.S. Industrial Q4 2017 U.S. INDUSTRIAL Employment Indicators Q4 16 Q4 17 Total Nonfarm Employment 145.2M 147.2M Industrial Employment 25.4M 25.9M Unemployment 4.7% 4.1% Source: BLS Market Indicators
Transborder Air Services Since 1994
 Tri-Airport Open Skies Initiative Transborder Air Services Since 1994 strategic transportation & tourism solutions Prepared for Aéroports de Montréal, The Greater Toronto Airport Authority, and the Vancouver
MARKETBEAT U.S. Office
 MARKETBEAT U.S. Office Q4 2016 U.S. OFFICE Employment Indicators Market Indicators (Overall) Q4 15 Q4 16 Vacancy Rate 13.5% 13.2% Net Absorption 20.5M 6.9M Under Construction 94.5M 100.2M Weighted Asking
2012 Airport Ground Transportation
 212 Airport Ground Transportation Fees and Fares Survey Summary March 212 AGTA 212 Airport Fees and Fares Survey Summary Survey Respondents Atlantic City International Airport Gulfport-Biloxi International
Non-stop Scheduled Passenger Service at Fargo as of October Top 20 Domestic O&D Passenger Markets at Fargo Twelve Months Ended June 2006
 0 5000 10000 15000 20000 25000 30000 35000 40000 45000 50000 Airport Traffic Quarterly Non-stop Scheduled Passenger Service at Fargo as of October 2006 Top 20 Domestic O&D Passenger Markets at Fargo Twelve
Strategic Central Florida Location Big Bend Road & U.S. Highway 41
 Strategic Central Florida Location Big Bend Road & U.S. Highway 41 Park Highlights 337,447 SF (Building 13124) under construction June 2017 occupancy Cross-Dock 101 Trailer Spaces 1.5 miles from I-75 8
ILLINOIS INTERSTATE AND INTRASTATE LOCAL REDUCED CITY-PAIR FARES
 The following section contains city-pair fares that are lower than walkup mileage-based fares. Although shown in only one direction, the fares in this section apply in both directions, unless otherwise
Per capita carbon emissions from transportation and residential energy use, 2005
 Per capita carbon emissions from transportation and residential energy use, 2005 Metropolitan Area Carbon Footprint Honolulu, HI 1 1.356 Los Angeles-Long Beach-Santa Ana, CA 2 1.413 Portland-Vancouver-Beaverton,
SEPTEMBER 2014 BOARD INFORMATION PACKAGE
 SEPTEMBER 2014 BOARD INFORMATION PACKAGE MEMORANDUM TO: Members of the Airport Authority FROM: Lew Bleiweis, Executive Director DATE: September 19, 2014 Informational Reports: A. July, 2014 Traffic Report
MARKETBEAT U.S. Office
 MARKETBEAT U.S. Office Q3 2017 U.S. OFFICE Employment Indicators Net Absorption/Rent 4-QTR TRAILING AVERAGE Q3 16 Q3 17 Total Nonfarm Employment 144.7M 146.6M Office-using Employment 31.3M 31.9M Unemployment
DIRECT FASTENING. 20V MAX * Cordless Concrete Nailer
 DIRECT FASTENING 20V MAX * Cordless INTERCHANGEABLE CONTACT TRIPS Drywall and Mechanical contact trips for application versatility Removable; tool-free ADJUSTABLE POWER 3 settings for pin depth adjustment