Presented by: Daniel Santiago Vice President of Sales and Business Development
|
|
|
- Marilynn Bradley
- 5 years ago
- Views:
Transcription

1 Presented by: Daniel Santiago Vice President of Sales and Business Development


2 Regal Wings is the leading luxury air travel consolidator, supplying the lowest NET fares on First and Business Class seats on trips to International destinations originating in the US or Canada. As one of the largest consolidators for international luxury air tickets, Regal Wings has access to net, wholesale, contract, and consolidated fares that are unbeatable in the industry.


3 Weddings / Honeymoon
4 Weddings / Honeymoon v Weddings are one of the most important transcendental lifetime experiences in any family s history. v A Destination Wedding is a way for couples and their families to escape the routine planning and step into a luxurious world, where everything is taken care for them. v Honeymoons still are the big ticket item in any wedding party celebration. v Same-sex couples spent slightly more on their overall wedding costs and more per guest.
5 Opportunity v DWHSA Travel Agents have the opportunity to increase their commissions on destination wedding packages by up selling luxury air tickets to clients and still be under the published price using Regal Wings. v One of the most important aspects when planning a destination wedding is the flight, and that s where luxury begins. Most couples and families would pay a bit more if it means they will be comfortable throughout the journey.
6 Regal Wings Air Service Asia/South East Asia/Russia Africa Australia/New Zealand Europe Middle East South America Caribbean Mexico/Central America Full Service from the US and Canada Full Service from the US and Canada Full Service from the US and Canada Full Service from the US and Canada Full Service from the US and Canada Full Service from the US and Canada NO SERVICE, Considered Domestic in the US Market, Private Air Available NO SERVICE, Considered Domestic in the US Market, Private Air Available
7 Who can use the Service?
8 Supply Chain Lufthansa Swiss Brussels Airlines Air Canada United Tam Linhas Elal Jet Airways American Airlines Aerosvit Turkish Emirates China Eastern Air France Air India Virgin Atlantic Regal Wings Contracts DWHSA Travel Agent Passengers Airline Outside Consolidators Regal Wings DWHSA Travel Agent Passengers Alitalia British Airways Cathay pacific Delta Iberia Japan KLM Korean Lan Airlines Lot Polish Qantas Qatar Scandinavian Singapore US Air
9 Ticket Sales Process = Business Hours Connect directly with dedicated ticket specialist by at RES.NE@regalwings.com Specialist searches for best availability, sensible connections, and lowest possible fare Specialist quotes a NET price to DWHSA Travel Agent DWHSA Travel Agent determines markup (research online for pricing) and relays to passenger Passenger confirms purchase Credit card confirmation form sent by is completed by DWHSA Travel Agent Regal Wings issues E-ticket Itinerary/Invoice ed to Travel Agent (see E-ticket Confirmation)
10
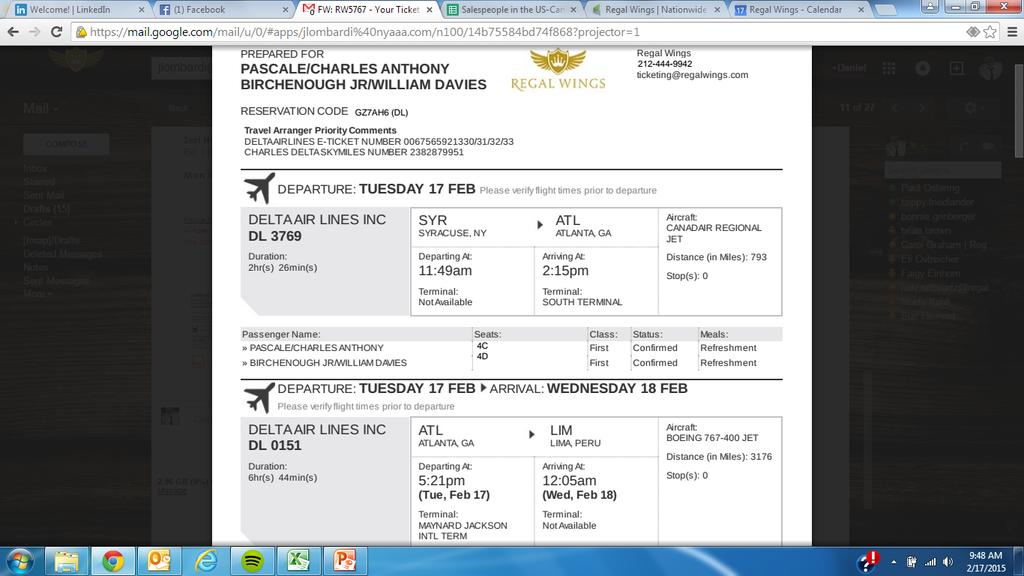
11 E-ticket Confirmation
12 Potential Profits Profits lay in the markup above Regal Wings price: Regal Wings price to DW Travel Agent: $2665 * Travel Agent sells: $3,165 Mark-up to passenger above our price: $500 Profit to Travel Agent:$500 * Price is set on a case basis, so the profits vary accordingly.

13 Pricing Examples 1 AZ 629I 15AUG J ORDFCO*SS1 250P 720A 16AUG S /DCAZ /E 2 AZ 720I 16AUG S FCOATH*SS1 840A 1140A /DCAZ /E 3 AZ 717I 28AUG F ATHFCO*SS1 600A 705A /DCAZ /E 4 AZ 628I 28AUG F FCOORD*SS1 930A 110P /DCAZ /E Published $8,147 / Regal Wings $3,167 (61% Off)

14 Pricing Examples 1 LH 457 Z 15AUG J LAXFRA SS1 310P 1110A 16AUG S /DCLH /E 2 LH 450 Z 28AUG F FRALAX SS1 205P 435P /DCLH /E Published $8, / Regal Wings $5,721.80(35% Off)
")
15 Pricing Examples 1 KE 38I 15AUG J ORDICN SS1 1235P 415P 16AUG S 2 KE 629I 16AUG S ICNDPS SS1 605P 1210A 17AUG M 3 KE 630I 28AUG F DPSICN SS1 125A 925A /DCKE /E 4 KE 37I 28AUG F ICNORD SS1 1040A 935A /DCKE /E Published $6,527 / Regal Wings $5,891 (10% Off)

16 Pricing Examples 1 DL3612A 15AUG J DFWJFK*SS1 935A 217P /DCDL /E 2 DL 40I 15AUG J JFKATH*SS1 446P 935A 16AUG S /DCDL /E 3 DL 41Z 03SEP Q ATHJFK*SS1 1200N 404P /DCDL /E 4 DL4034A 03SEP Q JFKDFW*SS1 642P 927P /DCDL /E Published $8,479 / Regal Wings $3,367 (60% Off)
17 Pricing Examples 1 LH 431Z 15AUG J ORDFRA*SS1 355P 715A 16AUG S /DCLH /E 2 LH 324Z 16AUG S FRAVCE*SS1 825A 940A /DCLH /E 3 LH 327Z 29AUG J VCEFRA*SS1 245P 410P /DCLH /E 4 LH 432Z 29AUG J FRAORD*SS1 505P 715P /DCLH /E Published $8,267 / Regal Wings $6,307 (23% Off)

18 Services/Perks Private Air Lowest available rates in Luxury Air tickets Dedicated Booking Agents Frequent flyers, opening new accounts if non-existent Commission paid UPON BOOKING Flight check: a secondary check 48 hours prior to departure time
19 Successful Sales/Commission v Remember that weddings are a special occasion for all parties involved, and it s very easy to appeal to the luxurious side of a client when they are planning their wedding, you just have to offer it. v It s always important to mention that you work with a Luxury Ticket provider to get the lowest prices in the industry, enhancing your chances to secure the sale.


20 Working with Regal Wings provides you with the support of a highly professional team and the knowledge of some of the strongest travel professionals in the industry. Our service offers amazing resources to independent and home-based travel agents. Improve your productivity, effectively manage your business and offer your clients value they won't find elsewhere.
21 Thank you for your time and we look forward to working with you! Daniel Santiago Vice President of Sales and Business Development Direct Line: x Daniel.Santiago@RegalWings.com Airfare Quotes: res.ne@regalwings.com
Japan Export Air. International Air Freight Fuel Surcharge. All Destinations
 Japan Export Air February 27, 2019 International Air Freight Fuel Surcharge 3K Jet Star Asia Airways All s 66 1-Jan-15 Taiwan, Philippines 48 1-Jan-15 5C C.A.L. Cargo All s 130 1-Oct-12 China, Hong Kong,
MONTHLY AIRPORT TRAFFIC REPORT September 2016
 MONTHLY AIRPORT TRAFFIC REPORT AIRCRAFT OPERATIONS 2016 2015 Change Domestic Air Carrier 59,030 59,038-0.01% Air Taxi 7,779 7,201 8.03% General Aviation 704 571 23.29% Military 21 12 75.00% Subtotal 67,534
MONTHLY AIRPORT TRAFFIC REPORT July 2016
 MONTHLY AIRPORT TRAFFIC REPORT AIRCRAFT OPERATIONS 2016 2015 Change Domestic Air Carrier 63,680 62,789 1.42% Air Taxi 7,548 8,007-5.73% General Aviation 717 558 28.49% Military 11 146-92.47% Subtotal 71,956
Japan Export Air. International Air Freight Fuel Surcharge. All Destinations
 Japan Export Air January 12, 218 International Air Freight Fuel Surcharge Carrier 3K Jet Star Asia Airways 66 1-Jan-15 Taiwan, Philippines 48 1-Jan-15 5C C.A.L. Cargo 13 1-Oct-12 China, Hong Kong, Korea,
Japan Export Air. International Air Freight Fuel Surcharge. All Destinations
 Japan Export Air January 3, 218 International Air Freight Fuel Surcharge Carrier 3K Jet Star Asia Airways All s 66 1-Jan-15 Taiwan, Philippines 48 1-Jan-15 5C C.A.L. Cargo All s 13 1-Oct-12 China, Hong
MONTHLY AIRPORT TRAFFIC REPORT March 2017
 MONTHLY AIRPORT TRAFFIC REPORT AIRCRAFT OPERATIONS 2017 2016 Change Domestic Air Carrier 60,360 61,951-2.57% Air Taxi 8,591 8,270 3.88% General Aviation 717 615 16.59% Military 14 27-48.15% Subtotal 69,682
Japan Export Air. International Air Freight Fuel Surcharge. All Destinations
 Japan Export Air March 30, 2019 International Air Freight Fuel Surcharge 3K Jet Star Asia Airways All s 66 1-Jan-15 Taiwan, Philippines 48 1-Jan-15 5C C.A.L. Cargo All s 130 1-Oct-12 China, Hong Kong,
MONTHLY AIRPORT TRAFFIC REPORT May 2015
 MONTHLY AIRPORT TRAFFIC REPORT AIRCRAFT OPERATIONS 2015 2014 Change Domestic Air Carrier 60,427 57,339 5.39% Air Taxi 7,825 10,967-28.65% General Aviation 547 635-13.86% Military 135 27 400.00% Subtotal
MONTHLY AIRPORT TRAFFIC REPORT April 2017
 MONTHLY AIRPORT TRAFFIC REPORT AIRCRAFT OPERATIONS 2017 2016 Change Domestic Air Carrier 56,570 60,697-6.80% Air Taxi 7,771 7,806-0.45% General Aviation 833 699 19.17% Military 23 14 64.29% Subtotal 65,197
Punctuality for june 2018 per airline
 Punctuality for june 2018 per airline Departures scheduled *) Delayed more than 15 minutes. **) s having less than 10 operations. Planned Cancelled Delayed *) Punctuality Avg. delay (min) Adria Airways
Heathrow Airport (LHR)
") Heathrow Airport (LHR) Summer 2018 (S18) Start of Season Report Report Date: Wed 21Mar2018 Headlines S18 Start vs. S17 Start vs. S17 End Total Air Transport Movements (Passenger & Freight) 294775 0.2%
Heathrow Airport (LHR) Summer 2018 (S18) Start of Season Report Report Date: Wed 21Mar2018 Headlines S18 Start vs. S17 Start vs. S17 End Total Air Transport Movements (Passenger & Freight) 294775 0.2%
MONTHLY AIRPORT TRAFFIC REPORT June 2017
 MONTHLY AIRPORT TRAFFIC REPORT AIRCRAFT OPERATIONS 2017 2016 Change Domestic Air Carrier 61,445 62,662-1.94% Air Taxi 8,267 7,656 7.98% General Aviation 644 685-5.99% Military 8 18-55.56% Subtotal 70,364
MONTHLY AIRPORT TRAFFIC REPORT July 2017
 MONTHLY AIRPORT TRAFFIC REPORT AIRCRAFT OPERATIONS 2017 2016 Change Domestic Air Carrier 63,535 63,680-0.23% Air Taxi 7,291 7,548-3.40% General Aviation 630 717-12.13% Military 15 11 36.36% Subtotal 71,471
Punctuality for september 2018 per airline
 for september 2018 per airline Departures scheduled Adria Airways 31 29 2 94% 12 61% 57 Aegean s S.A. Aeroflot Russian s 24 24 0 100% 6 75% 28 60 60 0 100% 2 97% 24 Air Baltic 90 90 0 100% 6 93% 25 Air
MONTHLY AIRPORT TRAFFIC REPORT August 2018
 MONTHLY AIRPORT TRAFFIC REPORT AIRCRAFT OPERATIONS 2018 2017 Change Domestic Air Carrier 65,465 63,201 3.58% Air Taxi 7,607 7,533 0.98% General Aviation 594 609-2.46% Military 15 3 400.00% Subtotal 73,681
MONTHLY AIRPORT TRAFFIC REPORT July 2018-(Revised)
") MONTHLY AIRPORT TRAFFIC REPORT AIRCRAFT OPERATIONS 2018 2017 Change Domestic Air Carrier 64,066 63,535 0.84% Air Taxi 7,468 7,291 2.43% General Aviation 550 630-12.70% Military 5 15-66.67% Subtotal 72,089
MONTHLY AIRPORT TRAFFIC REPORT AIRCRAFT OPERATIONS 2018 2017 Change Domestic Air Carrier 64,066 63,535 0.84% Air Taxi 7,468 7,291 2.43% General Aviation 550 630-12.70% Military 5 15-66.67% Subtotal 72,089
MONTHLY AIRPORT TRAFFIC REPORT February 2018
 MONTHLY AIRPORT TRAFFIC REPORT AIRCRAFT OPERATIONS 2018 2017 Change Domestic Air Carrier 51,809 51,854-0.09% Air Taxi 6,659 6,988-4.71% General Aviation 651 540 20.56% Military 6 9-33.33% Subtotal 59,125
MONTHLY AIRPORT TRAFFIC REPORT December 2018
 MONTHLY AIRPORT TRAFFIC REPORT AIRCRAFT OPERATIONS 2018 2017 Change Domestic Air Carrier 58,905 55,828 5.51% Air Taxi 6,948 6,810 2.03% General Aviation 499 565-11.68% Military 24 25-4.00% Subtotal 66,376
MONTHLY AIRPORT TRAFFIC REPORT September 2018
 MONTHLY AIRPORT TRAFFIC REPORT AIRCRAFT OPERATIONS 2018 2017 Change Domestic Air Carrier 58,763 55,902 5.12% Air Taxi 6,537 6,689-2.27% General Aviation 605 658-8.05% Military 14 17-17.65% Subtotal 65,919
ACI-NA 19th ANNUAL CONFERENCE EXHIBITION
 ACI-NA 19th ANNUAL CONFERENCE EXHIBITION Air Service Reality Check Ed Faberman Air Carrier Association of America September 28, 2010 GOOD TO BE IN PITTSBURGH!!! 2 Airline Industry Challenges Future of
Remedy awarded (complaints decided in qtr)
") Quarterly complaints data for Q2 2018 from the CAA Approved ADR entities and the CAA s Passenger Advice and Team ADR entity No remedy per million pax Total Average award consumers Air Canada/Canada Rouge
Quarterly complaints data for Q2 2018 from the CAA Approved ADR entities and the CAA s Passenger Advice and Team ADR entity No remedy per million pax Total Average award consumers Air Canada/Canada Rouge
MONTHLY AIRPORT TRAFFIC REPORT December 2017
 MONTHLY AIRPORT TRAFFIC REPORT AIRCRAFT OPERATIONS 2017 2016 Change Domestic Air Carrier 55,828 57,943-3.65% Air Taxi 6,810 7,642-10.89% General Aviation 565 569-0.70% Military 25 32-21.88% Subtotal 63,228
MONTHLY AIRPORT TRAFFIC REPORT April 2018
 MONTHLY AIRPORT TRAFFIC REPORT AIRCRAFT OPERATIONS 2018 2017 Change Domestic Air Carrier 60,928 56,570 7.70% Air Taxi 6,995 7,771-9.99% General Aviation 654 833-21.49% Military 9 23-60.87% Subtotal 68,586
Punctuality for may 2018 per airline
 for may 2018 per airline Departures scheduled **) having less than 10 operations. Adria Airways 33 28 5 85% 9 73% 49 Aegean S.A. Aeroflot Russian 23 23 0 100% 5 78% 25 66 63 3 95% 10 85% 53 Air Baltic
Malaysia s s 2020 Vision
 Kuala Lumpur International Airport: The New Southeast Asia Airline Hub? Lev Pinelis, M.S. Transportation December 7 th, 2004 1.231 Airport Systems Planning, Design, and Management Malaysia s s 2020 Vision
Punctuality for november 2018 per airline
 for november 2018 per airline Departures scheduled Aegean s S.A. Aeroflot Russian s 21 21 0 100% 4 81% 31 60 60 0 100% 5 92% 24 Air Baltic 86 86 0 100% 3 97% 58 Air Canada 14 14 0 100% 8 43% 49 Air China
Punctuality for july 2018 per airline
 Punctuality for july 2018 per airline Departures scheduled *) Delayed more than 15 minutes. **) having less than 10 operations. Planned Cancelled Delayed *) Punctuality Avg. delay (min) Adria Airways 31
J.P. Morgan 2019 Global Emerging Markets Corporate Conference. Miami, February 2019
 J.P. Morgan 2019 Global Emerging Markets Corporate Conference Miami, February 2019 This presentation may include forward-looking comments regarding the Company s business outlook and anticipated financial
India Market Update 2018
 India Market Update 2018 Growth Potential 1. 3 B i l l i o n P o p u l a t i o n O v e r 6 0 c i t i e s w i t h m i l l i o n + p o p u l a t i o n GDP Above 7% FASTEST Growing Large Economy in the World
Sector Report: AIRLINES
 Sector Report: AIRLINES 2017s EXECUTIVE SUMMARY You have downloaded a PDF of Sportcal Sponsorship s Airline Sector Report, summarising the key findings that are available within the report itself, as well
MONTHLY AIRPORT TRAFFIC REPORT January 2018
 MONTHLY AIRPORT TRAFFIC REPORT AIRCRAFT OPERATIONS 2018 2017 Change Domestic Air Carrier 55,461 55,980-0.93% Air Taxi 7,166 7,330-2.24% General Aviation 690 625 10.40% Military 6 11-45.45% Subtotal 63,323
MONTHLY AIRPORT TRAFFIC REPORT. April 2014
 MONTHLY AIRPORT TRAFFIC REPORT AIRCRAFT OPERATIONS 2014 2013 Change Domestic Air Carrier 55,529 55,119 0.74% Air Taxi 11,149 15,077-26.05% General Aviation 639 723-11.62% Military 13 14-7.14% Subtotal
Number of complaints decided where a financial remedy awarded. Number of complaints received others
 Quarterly data for Q4 2017 from the CAA Approved entities and the CAA s Passenger Advice and Complaints Team Airline / Airport name of Aegean Airlines PACT 2 0 0 1 3 17 - - 25% Aer Lingus PACT 12 0 7 17
ANA Fact Book All Nippon Airways Co., Ltd. Contents
 All Nippon Airways Co., Ltd. Contents 2 Domestic Passenger Market 4 International Passenger Market 5 Cargo Market 6 Haneda and Narita Airports 7 Global Alliance Statistics 8 Aircraft Specifications 9 Consolidated
The contents of this report may not be reproduced without the written consent of COHOR.
 Nice Côte d Azur Airport NCE/LFMN Summer 2018 - Start Of Season Report Report data extraction date: 27 March 2018 Table of contents Evolution of allocated slots at the Start Of Season (SOS)... 2 Total
Punctuality for february 2018 per airline
 for february 2018 per airline Departures scheduled **) having less than 10 operations. Adria Airways 20 19 1 95% 0 100% 0 Aegean S.A. Aeroflot Russian 12 12 0 100% 4 67% 21 57 56 1 98% 8 86% 49 Air Baltic
Punctuality for october 2017 per airline
 for october 2017 per airline Departures scheduled **) having less than 10 operations. Adria Airways 22 22 0 100% 5 77% 33 Aegean S.A. Aeroflot Russian 29 29 0 100% 7 76% 26 62 62 0 100% 9 85% 24 Air Baltic
Punctuality for april 2018 per airline
 for april 2018 per airline Departures scheduled **) having less than 10 operations. Adria Airways 29 29 0 100% 10 66% 47 Aegean S.A. Aeroflot Russian 16 16 0 100% 0 100% 0 60 60 0 100% 2 97% 24 Air Baltic
Punctuality for july 2012 per airline
 for july 2012 per airline Departures scheduled **) having less than 10 operations. Adria Airways 32 31 1 97% 3 91% 46 Aeroflot Russian Aerosvit 62 61 1 98% 8 87% 25 31 30 1 97% 13 58% 78 Air Baltic 93
MONTHLY AIRPORT TRAFFIC REPORT February 2014
 MONTHLY AIRPORT TRAFFIC REPORT AIRCRAFT OPERATIONS 2014 2013 Change Domestic Air Carrier 44,741 48,627-7.99% Air Taxi 11,144 13,003-14.30% General Aviation 569 543 4.79% Military 17 15 13.33% Subtotal
Mergers, Alliances and Consolidation- A Path to Sustainability?
 DAY 1: WEDNESDAY 18 APRIL 2012 Strategies and Tools for Mergers, Alliances and Consolidation- A Path to Sustainability? Captain Don Wykoff President International Federation of Air Line Pilots Associations
Prediction of Skytrax airline rankings, short formula (2e)
") Site: Wiki of Science at http://wikiofscience.wikidot.com Source page: 20120725 - Prediction of Skytrax airline rankings, short formula (2e) - 2010 at http://wikiofscience.wikidot.com/print:20120725-skytrax-al-short-perezgonzalez2010
Site: Wiki of Science at http://wikiofscience.wikidot.com Source page: 20120725 - Prediction of Skytrax airline rankings, short formula (2e) - 2010 at http://wikiofscience.wikidot.com/print:20120725-skytrax-al-short-perezgonzalez2010
Ancillary Fees Comparison Chart
 Ancillary Fees Comparison Chart Updated June 20, 2012 The information provided summarizes the ancillary fees of a representative sample of the major airlines. Most airlines provide exemptions for bag and
Punctuality for june 2014 per airline
 for june 2014 per airline Departures scheduled **) having less than 10 operations. Adria Airways 17 17 0 100% 4 76% 32 Aegean S.A. 12 12 0 100% 9 25% 39 Aer Lingus 30 30 0 100% 10 67% 34 Aeroflot Russian
The contents of this report may not be reproduced without the written consent of COHOR.
 Nice Côte d Azur Airport NCE/LFMN Winter 2018 - Start Of Season Report Report data extraction date: 31 October 2018 Table of contents Evolution of allocated slots at the Start Of Season (SOS)... 2 Total
trends bulletin 07/2011 Main airlines traffic 1 s quarter 2011 Main low cost airlines
 www.enac.fr Main airlines traffic 1 s quarter 2011 Airlines RPK* (millions) 2010** 10/09 (%) DELTA AIR LINES 310 900 2,2 1,3 UNITED / CONTINENTAL (1) 226 700-12,2-2,8 AMERICAN AL 201 900 2,5 1,6 AIR FRANCE-KLM
CHAPTER 2 Aviation Activity Forecasts
 CHAPTER 2 Aviation Activity Forecasts 2.1 Introduction 14 CFR Part 150 requires that noise exposure maps (NEMs) be prepared for two scenarios existing conditions and conditions 5 years into the future.
Punctuality for march 2014 per airline
 for march 2014 per airline Departures scheduled **) having less than 10 operations. Aer Lingus 30 30 0 100% 2 93% 68 Aeroflot Russian 63 62 1 98% 1 98% 19 Air Baltic 73 72 1 99% 1 99% 19 Air Berlin 167
Punctuality for june 2015 per airline
 for june 2015 per airline Departures scheduled Adria Airways 16 16 0 100% 6 63% 28 Aegean s S.A. 23 23 0 100% 3 87% 24 Aer Lingus 30 30 0 100% 13 57% 45 Aeroflot Russian s 60 60 0 100% 10 83% 43 Air Baltic
HEATHROW AIRPORT LHR Summer 2014 (S14) Start of Season
 Start of Season") HEATHROW AIRPORT LHR Summer 214 (S14) Start of Season KEY STATISTICS Summer 214 vs Summer 213 Air Transport Movements Allocated 282,172.6% Passenger Air Transport Movements Allocated 28,726.6% Total Seats
HEATHROW AIRPORT LHR Summer 214 (S14) Start of Season KEY STATISTICS Summer 214 vs Summer 213 Air Transport Movements Allocated 282,172.6% Passenger Air Transport Movements Allocated 28,726.6% Total Seats
Lyon St Exupéry Airport LYS/LFLL
 Lyon St Exupéry Airport LYS/LFLL Winter 2018 - Start Of Season Report Report data extraction date: 30 October 2018 Table of contents Evolution of allocated slots at the Start Of Season (SOS)... 2 Slots
trends bulletin
 www.enac.fr Main airlines traffic 1 st quarter 2012 Airlines RPK* (millions) 11/10 (%) 12/11 (%) DELTA AIR LINES 310 228-0,2 1,0 UNITED HOLDING 292 520-1,7 0,1 AIR FRANCE - KLM 214 956 6,9 7,2 AMERICAN
Departure Punctuality - Apr-17. Departure Punctuality - Last 12 Months
 Departure - Apr-17 Last Month Last Year % Change Target Var to Target First Wave 87.6% 91.3% -3.8% 85.0% 2.6% Not First Wave 77.5% 81.5% -4.0% 85.0% -7.5% Grand Total 79.7% 83.6% -3.9% 85.0% -5.3% Departure
MONTHLY AIRPORT TRAFFIC REPORT November 2013
 MONTHLY AIRPORT TRAFFIC REPORT AIRCRAFT OPERATIONS 2013 2012 Change Domestic Air Carrier 52,937 54,739-3.29% Air Taxi 13,964 13,566 2.93% General Aviation 504 515-2.14% Military 25 28-10.71% Subtotal 67,430
trends bulletin
 www.enac.fr Main airlines traffic 1 st quarter 2013 Airlines RPK* (millions) 12/11 (%) UNITED HOLDING 288 680-1,3-1,6 DELTA AIR LINES 271 808 0,7 1,7 AIR FRANCE - KLM 223 887 3,1 0,8 AMERICAN AL 203 299-0,1
Punctuality for october 2012 per airline
 for october 2012 per airline Departures scheduled **) having less than 10 operations. Adria Airways 12 12 0 100% 3 75% 45 Aeroflot Russian Aerosvit 62 61 1 98% 8 87% 33 23 23 0 100% 5 78% 26 Air Baltic
Punctuality for may 2014 per airline
 for may 2014 per airline Departures scheduled **) having less than 10 operations. Adria Airways 18 18 0 100% 3 83% 118 Aer Lingus 30 30 0 100% 7 77% 36 Aeroflot Russian 62 62 0 100% 4 94% 58 Air Baltic
Travel Policy Fly America Act Compliance Presentation. Presented by: Travel Services
 Travel Policy Fly America Act Compliance Presentation Presented by: Travel Services Agenda Fly America Act Exceptions Open Skies Agreement Documentation Requirements Good News and Bad News CTP demo 3 Travel
Steve Smith Director Cargo Supply Chain Management
 IATA e-freight project status Steve Smith Director Cargo Supply Chain Management Contents 1. Introduction: Vision and Board Mandate 2. Current Performance 3. 2010 progress to increasing e-freight capability:
Introduction: Airline Industry Overview Dr. Peter Belobaba Presented by: Alex Heiter & Ali Hajiyev
 Introduction: Airline Industry Overview Dr. Peter Belobaba Presented by: Alex Heiter & Ali Hajiyev Istanbul Technical University Air Transportation Management M.Sc. Program Network, Fleet and Schedule
Fly America and Open Skies. For Travel on Federal Sponsored Awards
 Fly America and Open Skies For Travel on Federal Sponsored Awards University and Sponsor Travel Policies Federal regulations require the customary standard commercial airfare (coach or equivalent), or
Los Angeles World Airports (LAWA) Traffic Comparison (TCOM) Los Angeles International Airport
 Traffic Comparison (TCOM) Los Angeles International Airport") Los Angeles World Airports (LAWA) Traffic Comparison (TCOM) Los Angeles Airport Passenger Traffic s 1 3,43,69 1,6,73 September 1 3,85,664 1,5,195 4.47% Calendar YTD September 9 % Change 1 9 3,4,561 31,6,815
Los Angeles World Airports (LAWA) Traffic Comparison (TCOM) Los Angeles Airport Passenger Traffic s 1 3,43,69 1,6,73 September 1 3,85,664 1,5,195 4.47% Calendar YTD September 9 % Change 1 9 3,4,561 31,6,815
01/2016. Main airlines traffic 2015 (1) RPK* (millions) /14 (% ) 1st quarter 16/15 (% ) Airlines
 RPK* (millions) /14 (% ) 1st quarter 16/15 (% ) Airlines") Main airlines traffic (1) Airlines RPK* (millions) AMERICAN AL GROUP 321 000 3,6 3,1 DELTA AIR LINES 303 100 4,0 3,2 UNITED HOLDING 295 500 2,6 0,5 EMIRATES AL 251 200 8,8 nd AIR FRANCE/KLM 235 700 2,8
Main airlines traffic (1) Airlines RPK* (millions) AMERICAN AL GROUP 321 000 3,6 3,1 DELTA AIR LINES 303 100 4,0 3,2 UNITED HOLDING 295 500 2,6 0,5 EMIRATES AL 251 200 8,8 nd AIR FRANCE/KLM 235 700 2,8
2017 Airline Satisfaction Survey
 2017 Airline Survey 2 Table of Contents Part 1: Outline of This Report 3 1. Outline of the Survey 4 2. Profile of the Respondents 5 Gender /Age / Area of Residence /Occupation /Annual income 5 Purpose
Punctuality for september 2013 per airline
 for september 2013 per airline Departures scheduled Adria Airways 17 17 0 100% 3 82% 20 Aer Lingus 26 26 0 100% 4 85% 22 Aeroflot Russian s 60 60 0 100% 9 85% 29 Air Baltic 85 84 1 99% 9 89% 32 Air Berlin
Punctuality for july 2015 per airline
 for july 2015 per airline Departures scheduled **) having less than 10 operations. Acd/Ad Hoc 10 0 10 0% 0 100% 0 Adria Airways 18 18 0 100% 5 72% 25 Aegean S.A. 27 27 0 100% 12 56% 30 Aer Lingus 34 31
Results of Airline Survey on Cargo Messaging
 IATA Cargo Messaging Survey 1 INTERNATIONAL AIR TRANSPORT ASSOCIATION 2011 Cargo Business Process Panel INTERNATIONAL AIR TRANSPORT ASSOCIATION 2010 Results of Airline Survey on Cargo Messaging September
STATISTICAL REPORT Fiscal YEAR SUMMARY. Houston Airport System P.O. Box Houston, TX
 STATISTICAL REPORT 215 Fiscal YEAR SUMMARY P.O. Box 616 Houston, TX 7725 16 Table of Contents 1 Aircraft Operations 2 3 George Bush Intercontinental 4 William P. Hobby 5 Originating Enplaned 6 7 8 Passenger
Los Angeles World Airports (LAWA) Traffic Comparison (TCOM) Los Angeles International Airport Calendar YTD January to December
 Traffic Comparison (TCOM) Los Angeles International Airport Calendar YTD January to December") Los Angeles World Airports (LAWA) Traffic Comparison (TCOM) Los Angeles Airport Calendar YTD January to December Jan-214 Jan-213 to to Dec-214 Dec-213 % Change Dec-214 Dec-213 % Change Passenger Traffic
Los Angeles World Airports (LAWA) Traffic Comparison (TCOM) Los Angeles Airport Calendar YTD January to December Jan-214 Jan-213 to to Dec-214 Dec-213 % Change Dec-214 Dec-213 % Change Passenger Traffic
trends bulletin 07/2014 Actual and planned fleet* (April 2014) * Source : FG-Flightglobal / ENAC Air Transport Data
 * Source : FG-Flightglobal / ENAC Air Transport Data") 0/0 Actual and planned fleet* (April 0) AEROFLOT RUSSIAN AL AIR CANADA AIR CHINA AIR FRANCE Airbus A00 Airbus A000 Airbus A00 Airbus A000 Airbus A000 Airbus A000 Boeing 00 0 Boeing 00 0 Boeing 00 Boeing
0/0 Actual and planned fleet* (April 0) AEROFLOT RUSSIAN AL AIR CANADA AIR CHINA AIR FRANCE Airbus A00 Airbus A000 Airbus A00 Airbus A000 Airbus A000 Airbus A000 Boeing 00 0 Boeing 00 0 Boeing 00 Boeing
Departure Punctuality - Feb-17. Departure Punctuality - Last 12 Months
 Operational Performance Reporting Manchester Airport February 2017 Departure - Feb-17 Last Month Last Year % Change Target Var to Target First Wave 85.2% 84.3% 0.8% 85.0% 0.2% Not First Wave 77.8% 80.5%
Grand Circle Cruise Line
 Grand Circle Cruise Line The Leader in Enriching Cultural Experiences since 1958 Air Information Contents Personalizing Your Flights... 3 Benefits of Grand Circle Air: Choice and Flexibility... 3 What
Departure Punctuality - Aug-17. Departure Punctuality - Last 12 Months
 Departure - Aug-17 Last Month Last Year % Change Target Var to Target First Wave 80.2% 83.9% -3.8% 85.0% -4.8% Not First Wave 65.0% 71.0% -6.0% 85.0% -20.0% Grand Total 68.3% 73.9% -5.7% 85.0% -16.7% Departure
Ancillary Fees Comparison Chart
 Ancillary Fees Comparison Chart IMPORTANT NOTICE: The grid below summarizes the ancillary fees of a representative sample of the major s as of May 2, 2011. s provide exemptions for bag and seat fe for
Facts & Figures. Non-US Airline Traffic Aircraft Data. Aircraft Values. US Consumer Complaints February US Fuel Cost And Consumption
 Facts & Figures Aircraft Data Aircraft Values Aircraft E-190 CRJ900 RJ100 MTOW 105.4-114.2 80.5-84.5 97.5-101.5 Engine Types CF34-10E5 92; CF34-10E5A1 87; CF34-10E6 99; CF34-10E6A1 28; CF34-10E7 10 CF34-8C5
Los Angeles World Airports (LAWA) Traffic Comparison (TCOM) Los Angeles International Airport
 Traffic Comparison (TCOM) Los Angeles International Airport") Los Angeles World Airports (LAWA) Traffic Comparison (TCOM) Los Angeles Airport Passenger Traffic s 1 3,75,6 1,34,133 December 1 3,474,16 1,35,576 7.% Calendar YTD December 9 % Change 1 9 43,134,145 41,419,913
Los Angeles World Airports (LAWA) Traffic Comparison (TCOM) Los Angeles Airport Passenger Traffic s 1 3,75,6 1,34,133 December 1 3,474,16 1,35,576 7.% Calendar YTD December 9 % Change 1 9 43,134,145 41,419,913
Punktlighed for september 2018 pr. flyselskab
 Afgange rute Punktlighed for september 2018 pr. flyselskab *) Forsinket mere end 15 minutter. **) Flyselskaber med mindre end 10 operationer. Flyselskab Planlagt Aflyst Forsinket *) Punktlighed Gns. fors.
Air Cargo Settlement 5 c/o Garden City Group, LLC P.O. Box Dublin, OH USA CLAIM FORM GENERAL INSTRUCTIONS
 Must be Postmarked No Later Than September 9, 2016 Air Cargo Settlement 5 c/o Garden City Group, LLC P.O. Box 10083 Dublin, OH 43017-6683 USA AR5 *P-AR5-POC/1* Claim Number: Control Number: CLAIM FORM
AFTA Travel Trends. December 2018
 AFTA Travel Trends December 2018 AFTA Travel Trends Report 2018 Inbound and Outbound overview Introduction This snapshot provides an overview of the balance of trade between Inbound and Outbound Travel
Departure Punctuality - May-17. Departure Punctuality - Last 12 Months
 MAG Airport Name Manchester Scheduled Date Between 2017-05-01 00:00:00 and 2017-05-31 00:00:00 Operator IATA Code (Report Defaults) Departure - May-17 Last Month Last Year % Change Target Var to Target
PORT OF SEATTLE - STIA PFC Quarterly Status Report - Revenue and Expenditures Activity thru 03/31/2016
 PORT OF SEATTLE - STIA PFC Quarterly Status Report - Revenue and Activity thru 03/31/2016 Total Collection Authority $2,167,378,460 Approved for Collection Approved for Use Approved Applications "Impose"
PORT OF SEATTLE - STIA PFC Quarterly Status Report - Revenue and Expenditures Activity thru 12/31/2016
 PORT OF SEATTLE - STIA PFC Quarterly Status Report - Revenue and Activity thru 12/31/2016 Total Collection Authority $2,167,378,460 Approved for Collection Approved for Use Approved Applications "Impose"
Departure Punctuality - Jun-17. Departure Punctuality - Last 12 Months
 Departure - Jun-17 Last Month Last Year % Change Target Var to Target First Wave 79.3% 79.8% -0.5% 85.0% -5.7% Not First Wave 68.3% 66.8% 1.5% 85.0% -16.7% Grand Total 70.7% 69.8% 0.8% 85.0% -14.3% Departure
PORT OF SEATTLE - STIA PFC Quarterly Status Report - Revenue and Expenditures Activity thru 03/31/2017 No change since 2016 Q4
 PORT OF SEATTLE - STIA PFC Quarterly Status Report - Revenue and Activity thru 03/31/2017 No change since 2016 Q4 Total Collection Authority $2,167,378,460 Approved for Collection Approved for Use Approved
Departure Punctuality - Sep-17. Departure Punctuality - Last 12 Months
 Departure Punctuality - Sep-17 Last Month Last Year % Change Target Var to Target First Wave 73.0% 82.7% -9.7% 85.0% -12.0% Not First Wave 60.9% 73.4% -12.5% 85.0% -24.1% Grand Total 63.5% 75.5% -12.1%
Punctuality for august 2017 per airline
 for august 2017 per airline Departures scheduled **) having less than 10 operations. Acd/Ad Hoc 12 0 12 0% 0 100% 0 Adria Airways 21 21 0 100% 4 81% 26 Aegean S.A. Aeroflot Russian 19 19 0 100% 9 53% 22
Miami-Dade Aviation Department Aviation Statistics Flight Ops - All Airlines Facility: MIA Units: Flight Operations. Wednesday, February 28,
 17,034 17,868 13,465 12,598 60,965-0.92 American Airlines Inc 61,533 17,495 18,251 13,281 12,506 7,601 8,548 2,275 1,271 19,695 21.51 Envoy Air Inc 16,209 5,735 6,764 2,394 1,316 4,504 5,579 1,440 353
THE STATE OF EUROPEAN AIRLINE COMPETITION IN THE ERA OF CONSOLIDATION
 THE STATE OF EUROPEAN AIRLINE COMPETITION IN THE ERA OF CONSOLIDATION Dr Nigel Dennis Senior Research Fellow Transport Studies Group University of Westminster 1 Ryanair, easyjet, Air Berlin and Emirates
Operational Performance Reporting Manchester Airport August 2018
 Operational Performance Reporting Manchester Airport August 2018 Departure Punctuality - Aug-18 Last Month Last Year % Change Target Var to Target First Wave 83.4% 80.2% 3.2% 85.0% -1.6% Not First Wave
Punctuality for february 2017 per airline
 for february 2017 per airline Departures scheduled **) having less than 10 operations. Aegean S.A. Aeroflot Russian 12 12 0 100% 1 92% 32 59 56 3 95% 8 86% 105 Air Baltic 84 83 1 99% 6 93% 76 Air Berlin
Airline Extension Policies
 Airline Extension Policies Extension request prior to departure are made through their website Gil Travel s Israel Trip Flight Extensions not by telephone. Gil travels website is updated prior to each
Miami-Dade Aviation Department Aviation Statistics Flight Ops - All Airlines Facility: MIA Units: Flight Operations. Tuesday, December 11, 2018
 50,946 53,422 40,332 37,789 182,489 0.60 American Airlines Inc 181,392 51,073 53,402 39,639 37,278 21,657 24,554 6,780 3,758 56,749 6.75 Envoy Air Inc 53,160 19,786 22,807 6,837 3,730 11,093 13,991 3,698
Miami-Dade Aviation Department Aviation Statistics Flight Ops - All Airlines Facility: MIA Units: Flight Operations. Friday, December 28, 2018
 51,124 53,607 40,295 37,729 182,755 0.87 American Airlines Inc 181,179 50,824 53,173 39,776 37,406 21,401 24,296 6,787 3,767 56,251 4.16 Envoy Air Inc 54,002 20,245 23,243 6,798 3,716 10,978 13,972 3,744
Miami-Dade Aviation Department Aviation Statistics Flight Ops - All Airlines Facility: MIA Units: Flight Operations
 38,439 40,280 30,403 28,506 137,628-0.58 American Airlines Inc 138,425 39,112 40,846 30,101 28,366 16,268 18,488 5,123 2,803 42,682 10.30 Envoy Air Inc 38,697 14,122 16,408 5,265 2,902 9,491 11,910 3,096
Operational Performance Reporting Manchester Airport March 2018
 Operational Performance Reporting Manchester Airport March 2018 Departure Punctuality - Mar-18 Last Month Last Year % Change Target Var to Target First Wave 79.8% 88.1% -8.3% 85.0% -5.2% Not First Wave
Miami-Dade Aviation Department Aviation Statistics Flight Ops - All Airlines Facility: MIA Units: Flight Operations. Wednesday, January 23, 2019
 51,338 53,806 40,322 37,775 183,241 1.61 American Airlines Inc 180,331 50,557 52,914 39,628 37,232 21,274 24,183 6,752 3,735 55,944 1.84 Envoy Air Inc 54,934 20,745 23,694 6,774 3,721 10,931 13,914 3,698
Investor Presentation
 Investor Presentation December, 2011 FORWARD-LOOKING STATEMENTS This document contains forward-looking statements, including with respect to the negotiation, implementation and effects of the proposed
PORT OF SEATTLE - STIA PFC Quarterly Status Report - Revenue and Expenditures Activity thru 06/30/2016
 PORT OF SEATTLE - STIA PFC Quarterly Status Report - Revenue and Activity thru 06/30/2016 Total Collection Authority $2,167,378,460 Approved for Collection Approved for Use Approved Applications "Impose"
Executive Summary with Graphs
 Executive Summary with Graphs Invoice dates from 1/1/28 to 6/3/28 Invoice dates from 7/1/27 to 6/3/28 Invoice dates from 1/1/28 to 6/3/28 Air Charges Summary Totals Averages Transactions - Invoices: Credits:
Departure Punctuality - Dec-17. Departure Punctuality - Last 12 Months
 Departure - Dec-17 Last Month Last Year % Change Target Var to Target First Wave 74.0% 84.1% -10.1% 85.0% -11.0% Not First Wave 55.4% 72.0% -16.6% 85.0% -29.6% Grand Total 59.4% 74.9% -15.5% 85.0% -25.6%