trends bulletin 07/2014 Actual and planned fleet* (April 2014) * Source : FG-Flightglobal / ENAC Air Transport Data
|
|
|
- Zoe Summers
- 5 years ago
- Views:
Transcription
1
2 0/0 Actual and planned fleet* (April 0) AEROFLOT RUSSIAN AL AIR CANADA AIR CHINA AIR FRANCE Airbus A00 Airbus A000 Airbus A00 Airbus A000 Airbus A000 Airbus A000 Boeing 00 0 Boeing 00 0 Boeing 00 Boeing 00 Boeing 00 Boeing MDF Ilyushin Il00 IRKUT MS00 IRKUT MS00 Sukhoi SSJ 00B 0 0 Total 0 Airbus A00 Airbus A000 Airbus A00 0 Boeing 00 Boeing 00 Boeing 00 Boeing 00 Embraer ERJ0 Total Airbus A00 0 Airbus A000 Airbus A00 Airbus A000 0 Airbus A000 Airbus A000 0 Boeing 00 Boeing 00 0 Boeing 00 0 Boeing 00 Boeing 00 Boeing 00 Boeing 00 Boeing 00 0 Boeing 00 COMAC C Total 0 Airbus A00 Airbus A00 Airbus A000 Airbus A00 Airbus A000 Airbus A000 Airbus A000 Airbus A000 Boeing 00 0 Boeing 00 Boeing F Boeing 00 Total AIR INDIA Airbus A00 Airbus A000 Airbus A00 0 Airbus A000 Boeing 00 Boeing 00 Boeing 00 Total 0 AIRBERLIN Airbus A00 Airbus A000 Airbus A00 Airbus A000 Boeing 00 Boeing 00 Boeing 00 Boeing 00 Total ALASKA AL Boeing 00 0 Boeing 00 Boeing 00 0 Boeing 00 Total ALITALIA Airbus A00 Airbus A000 Airbus A00 Airbus A000 Airbus A000 Boeing 00 0 Boeing MD Total ALL NIPPON AW (ANA) AAirbus A000 Boeing 00 Boeing 00 Boeing 00 Boeing 00 0 Boeing 00 Boeing 00 Boeing 00 0 Mitsubishi MRJ 0 Total AMERICAN AL Airbus A00 Airbus A00 Boeing 00 0 Boeing 00 0 Boeing 00 Boeing 00 Boeing 00 Boeing 00 Boeing 00 0 Boeing MD 0 Boeing MD Embraer ERJ 0 Total * Source : FGFlightglobal / ENAC Air Transport Data
3 0/0 ASIANA AVIANCA BRITISH AW (BA) CATHAY PACIFIC AW CHINA AL CHINA EASTERN AL Airbus A000 0 Airbus A00B00 Airbus A00 Airbus A00 Airbus A000 Airbus A Airbus A00 0 Airbus A000 Airbus A000 Airbus A000 Airbus A000 Airbus A000 Boeing 00 Boeing 00 Boeing 00 Boeing 00 Boeing 00 Boeing 00 Total COMAC C Model In Serv. Ord./Opt. Embraer ERJ Airbus A00 0 Gulfstream G0 Airbus A00 Total 0 Airbus A000 CHINA SOUTHERN AL Airbus A000 Airbus A00 0 ATR 00 Airbus A000 0 Boeing 00 Airbus A00 Total Fokker 0 0 Airbus A000 Airbus A00 Airbus A000 Airbus A00 Boeing 00 Airbus A000 Boeing 00 Airbus A00 Boeing 00 0 Airbus A0000 Boeing 00 Airbus A000 Boeing 00 Boeing 00 Boeing 00 Boeing 00 Boeing 00 Boeing F Boeing 00 Boeing 00 0 COMAC C Boeing Embraer ERJ Boeing 00 Embraer ERJ0 0 Boeing 00 Total Total DELTA AIR LINES Model In Serv. Ord./Opt. Airbus A00 Airbus A000 0 Airbus A000 Airbus A000 Airbus A Airbus A000 Boeing 00 Boeing 00 Boeing 00 0 Boeing 00 Boeing 00 Boeing 00 Boeing 00 0 Boeing 00 Boeing 00 Boeing 00 Total 0 Boeing 00 Boeing 00 Boeing 00 Airbus A000 Boeing 00 Airbus A000 Boeing DC Boeing 00 Boeing MD Boeing 00 Boeing MD Boeing MD00 Bombardier CRJ00 Total Bombardier CRJ00 Total 0 * Source : FGFlightglobal / ENAC Air Transport Data
4 0/0 EASYJET AL Airbus A00 Airbus A000 Total EMIRATES AL Airbus A00 Airbus A000 Airbus A000 Airbus A000 Airbus A0000 Airbus A000 Airbus A000 Boeing 00 Boeing 00F Boeing F Total ETIHAD AW Airbus A00 Airbus A000 Airbus A00 Airbus A000 Airbus A000F Airbus A000 Airbus A000 Airbus A0000 Airbus A000 0 Airbus A000 0 Boeing 00 0 Boeing 00 Boeing 00 Boeing F Boeing 0 Boeing 00 Total GOL TRANSPORTES AEREOS Model Boeing 00 In Serv. Ord./Opt. Boeing 00 Boeing 00 Total HAINAN AL Model Airbus A00 In Serv. Ord./Opt. Airbus A000 Airbus A000 Airbus A000 Boeing 00 Boeing 00 Boeing 00 Boeing 00 Boeing 00 Boeing 00 COMAC C 0 Total IBERIA Airbus A00 Airbus A000 Airbus A00 Airbus A000 Airbus A000 Total Total * Source : FGFlightglobal / ENAC Air Transport Data JAPAN AL Airbus A0000 Airbus A000 Boeing 00 Boeing 00 Boeing 00 0 Boeing 00 0 Boeing 00 0 Total JET AW Airbus A000 ATR 00 Boeing 00 Boeing 00 0 Boeing 00 Boeing 00 0 Total JETBLUE AW Airbus A000 0 Airbus A00 Embraer ERJ0 0 Total KLM/ROYAL DUTCH AL Airbus A000 Boeing 00 Boeing 00 Boeing 00 Boeing 00 Boeing 00 Boeing 00 Boeing MD Embraer ERJ0 Total KOREAN AIR/KAL Airbus A00B00 Airbus A000 Airbus A000 Boeing 00 Boeing 00 0 Boeing 00 Boeing 00 Boeing 00 Boeing 00 Boeing F Boeing 00 Boeing 00 0 Bombardier CSeries CS00 0 Cessna Cessna 0 Total LAN AL Airbus A00 Airbus A000 Airbus A00 Airbus A000 Boeing 00 Boeing 00 Boeing 00 * Source : FGFlightglobal / ENAC Air Transport Data Total 0
5 0/0 LUFTHANSA SAS Airbus A00 Airbus A00 Airbus A000 0 Airbus A000 Airbus A00 Airbus A00 Airbus A000 Airbus A000 Airbus A000 Airbus A000 Airbus A000 ATR 00 Airbus A000 0 Boeing 00 Boeing 00 Boeing 00 Boeing 00 Boeing 00 Boeing 00 Boeing 00 Boeing 00 Boeing 00 Boeing 00 0 Boeing MD 0 MALAYSIA AL QANTAS AW Total Airbus A000F Airbus A000 Boeing 00 Boeing 00 Boeing 00 Boeing 00 Total Airbus A000 0 Airbus A000 Boeing 00 Boeing 00 Boeing 00 Boeing 00 Boeing 00 SAUDIA Bombardier CRJ00 Bombardier CRJ00 Bombardier CRJ00 Total 0 Airbus A000 Airbus A00 Boeing 00 Boeing 00 Boeing 00 Boeing 00 Boeing SP Boeing 00 Boeing 00 Boeing MDF Boeing MD00 Embraer ERJ0 QATAR AW RYANAIR Total AiAirbus A00 Airbus A000 Airbus A00 0 Airbus A000 Airbus A000F Airbus A000 Airbus A0000 Airbus A000 Airbus A000 0 Boeing 00 Boeing F Boeing 00 Bombardier (CL00B) Total Boeing 00 Bombardier Learjet (XR) SINGAPORE INT'L AL SOUTHWEST AL SWISS Total Airbus A000 0 Airbus A000 Boeing 00 Boeing 0 Total 0 Boeing 00 Boeing 00 Boeing 00 Boeing 00 Boeing 00 Boeing 00 0 Total Airbus A00 Airbus A000 Airbus A00 Total Airbus A000 Bombardier CSeries CS00 0 Total Total Total 0 * Source : FGFlightglobal / ENAC Air Transport Data
6 0/0 TACA TAM LINHAS AEREAS THAI AW INT'L THOMSON AW TRANSAERO Airbus A00 Airbus A000 Airbus A00 Embraer ERJ0 Total 0 Airbus A00 Airbus A000 Airbus A00 Airbus A000 0 Airbus A000 Airbus A000 Boeing 00 0 Cessna 0 Total Airbus A00B00 Airbus A000 Airbus A000 Airbus A000 Airbus A000 Boeing 00 Boeing 00 Boeing 00 Boeing 00 Boeing 00 Total 0 Boeing 00 Boeing 00 Boeing 00 Boeing 00 Total 0 Airbus A000 Airbus A00 Airbus A000 Boeing 00 Boeing 00 Boeing 00 Boeing 00 Boeing 00 Boeing 00 0 Boeing 00 Boeing 00 Boeing 00 Boeing 00 Boeing 00 IRKUT MS00 Sukhoi SSJ 00B Tupolev Tu0S Tupolev Tu Total TURKISH AL/THY Model In Serv. Ord./Opt. Airbus A000 (F) Airbus A00 Airbus A000 Airbus A00 Airbus A000 Airbus A000F Airbus A000 Boeing 00 Boeing 00 0 Boeing Total 0 UNITED AL Airbus A00 Airbus A000 Airbus A0000 Boeing 00 Boeing 00 0 Boeing 00 Boeing 00 Boeing 00 Boeing 00 Boeing 00 Boeing 00 Boeing 00 Boeing 00 Boeing 0 Boeing 00 0 Boeing 00 Total 0 US AIRWAYS Airbus A00 Airbus A000 Airbus A00 Airbus A000 Airbus A000 Boeing 00 Boeing 00 Boeing 00 Boeing 00 0 Embraer ERJ0 0 Total VIRGIN ATLANTIC AW 0 Airbus A000 Airbus A000 Airbus A000 Boeing 00 Boeing 00 Total VIRGIN AUSTRALIA AL Airbus A000 ATR 00 ATR 00 Boeing 00 Boeing 00 Embraer ERJ0 Total 0 * Source : FGFlightglobal / ENAC Air Transport Data
 / (%) 0,,, 0, 0, 0,, 0 0, 0, 0, 0, 0 0,,0,0, st quarter / (%),,,,0 0,,,,,,,,0,,,,, ATLANTA BEIJINGCAPITAL LONDON HEATHROW TOKYO HANEDA")
 st quarter / (%) Number of movements ATLANTA, GA CHICAGO O'HARE DALLAS FORT WORTH LOS ANGELES INTERNATIONAL DENVER BEIJINGCAPITAL CHARLOTTE LAS VEGAS MC CARRAN HOUSTON INTERCONTINENTAL PARIS")
7 0/0 Main airports traffic* st quarter 0 Airports ATLANTA BEIJINGCAPITAL LONDON HEATHROW TOKYO HANEDA CHICAGOO'HARE LOS ANGELES INTERNATIONAL DUBAI PARIS CDG DALLAS FORT WORTH JAKARTA SOEKARNO HONG KONG SINGAPORE AMSTERDAM DENVER Total* Passengers (thousands) / (%) 0,,, 0, 0, 0,, 0 0, 0, 0, 0, 0 0,,0,0, st quarter / (%),,,,0 0,,,,,,,,0,,,,, ATLANTA BEIJINGCAPITAL LONDON HEATHROW TOKYO HANEDA CHICAGOO'HARE LOS ANGELES INTERN DUBAI PARIS CDG DALLAS FORT WORTH JAKARTA SOEKARNO HONG KONG SINGAPORE AMSTERDAM DENVER Passengers (thousands) Airports Movements 0 / (%) st quarter / (%) Number of movements ATLANTA, GA CHICAGO O'HARE DALLAS FORT WORTH LOS ANGELES INTERNATIONAL DENVER BEIJINGCAPITAL CHARLOTTE LAS VEGAS MC CARRAN HOUSTON INTERCONTINENTAL PARIS CDG LONDON HEATHROW AMSTERDAM PHOENIX SKY HARBOR PHILADELPHIA Total 0,, 0,, 0, 0,,,,,,,,, 0,, 0 0,, 0,,,0, 0, 0, 0 0 0,,,,,, ,, ATLANTA, GA CHICAGO O'HARE DALLAS FORT WORTH LOS ANGELES INTERN DENVER BEIJINGCAPITAL CHARLOTTE LAS VEGAS MC CARRAN HOUSTON INTERCON PARIS CDG LONDON HEATHROW AMSTERDAM PHOENIX SKY HARBOR PHILADELPHIA Airports HONG KONG MEMPHIS SHANGHAI PUDONG SEOUL INCHEON DUBAI ANCHORAGE LOUISVILLE INTERNATIONAL PARIS CDG TOKYO NARITA MIAMI SINGAPORE BEIJINGCAPITAL LOS ANGELES INTERNATIONAL TAIPEI Total Cargo and mail (thousand tons) / (%) 0,,0 0, 0,,,, 0, 0, 00 0, 0, 0,,, 0, st quarter / (%),,,,,0 0,,,, 0,,,,,, 0,, HONG KONG MEMPHIS SHANGHAI PUDONG SEOUL INCHEON DUBAI ANCHORAGE LOUISVILLE INTERN PARIS CDG TOKYO NARITA MIAMI SINGAPORE BEIJINGCAPITAL LOS ANGELES INTERN TAIPEI Cargo and mail (thousand tons) * Source ACI
8 0/0 Orders and deliveries of commercial aircraft commercial customers only, iluding aircraft leasing companies Deliveries Orders Deliveries st quarter 0 Airbus Boeing 0 Antonov Bombardier Embraer 0 Sukhoi ATR / (%) Total 0 Orders st quarter 0 Airbus Boeing Antonov Bombardier Embraer Sukhoi Mitsubishi ATR 0 / (%) Total 0 Deliveries by aircraft type Orders by aircraft type Deliveries Type st quarter 0 Airbus A A0 A A0 A0 Total 0 Orders Type st quarter Airbus A A0 A A0 A0 A0 A A0 A A0 A0 A0 total 0 0 Boeing Bombardier Embraer Sukhoi ATR B B B B CRJ Qseries EMB0 EMB EMB0 EMB SJ00 ATR00 ATR00 Boeing Bombardier Embraer Sukhoi Mitsubishi B B B B CRJ Qseries Cseries EMB0 EMB EMB0 EMB SJ00 MRJ0 B B B B CRJ Qseries Cseries EMB0 EMB EMB0 EMB SJ00 MRJ ATR ATR00 ATR00 ATR00 ATR00 0 This information is taken from the ENAC Air Transport databases For more information on the databases, please contact Mr Mehrdad FARZINPOUR (mehrdad.farzinpour@enac.fr) or Mr Bertrand VIDEAU (bertrand.videau@enac.fr)
trends bulletin
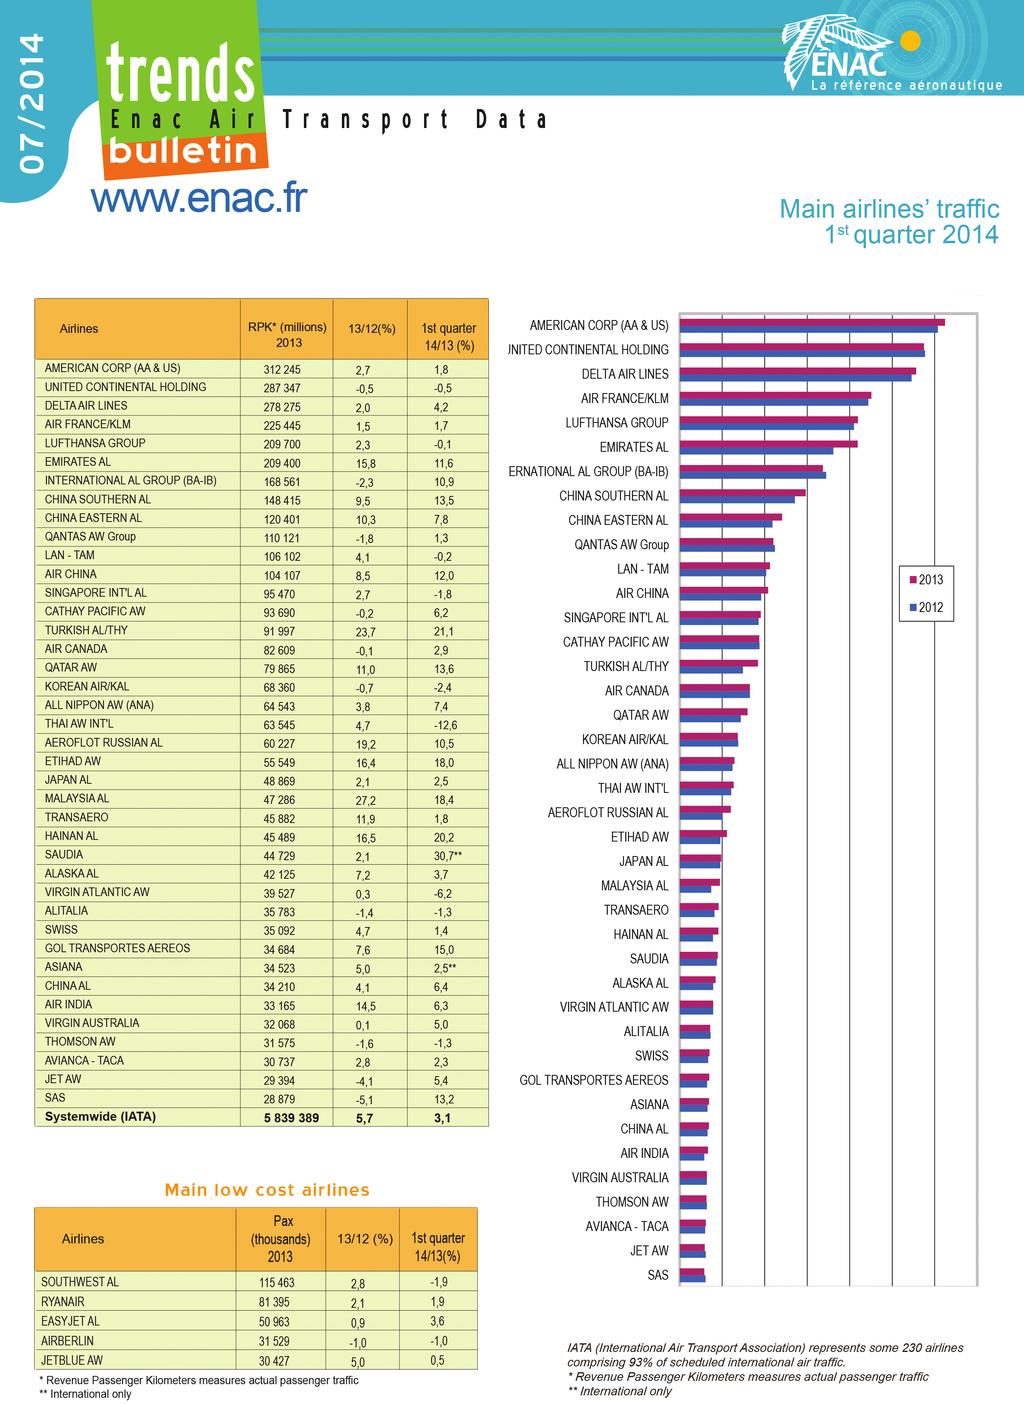
 www.enac.fr Main airlines traffic 1 st quarter 2013 Airlines RPK* (millions) 12/11 (%) UNITED HOLDING 288 680-1,3-1,6 DELTA AIR LINES 271 808 0,7 1,7 AIR FRANCE - KLM 223 887 3,1 0,8 AMERICAN AL 203 299-0,1
trends bulletin
 www.enac.fr Main airlines traffic 1 st quarter 2012 Airlines RPK* (millions) 11/10 (%) 12/11 (%) DELTA AIR LINES 310 228-0,2 1,0 UNITED HOLDING 292 520-1,7 0,1 AIR FRANCE - KLM 214 956 6,9 7,2 AMERICAN
trends bulletin 07/2011 Main airlines traffic 1 s quarter 2011 Main low cost airlines
 www.enac.fr Main airlines traffic 1 s quarter 2011 Airlines RPK* (millions) 2010** 10/09 (%) DELTA AIR LINES 310 900 2,2 1,3 UNITED / CONTINENTAL (1) 226 700-12,2-2,8 AMERICAN AL 201 900 2,5 1,6 AIR FRANCE-KLM
01/2016. Main airlines traffic 2015 (1) RPK* (millions) /14 (% ) 1st quarter 16/15 (% ) Airlines
 RPK* (millions) /14 (% ) 1st quarter 16/15 (% ) Airlines") Main airlines traffic (1) Airlines RPK* (millions) AMERICAN AL GROUP 321 000 3,6 3,1 DELTA AIR LINES 303 100 4,0 3,2 UNITED HOLDING 295 500 2,6 0,5 EMIRATES AL 251 200 8,8 nd AIR FRANCE/KLM 235 700 2,8
Main airlines traffic (1) Airlines RPK* (millions) AMERICAN AL GROUP 321 000 3,6 3,1 DELTA AIR LINES 303 100 4,0 3,2 UNITED HOLDING 295 500 2,6 0,5 EMIRATES AL 251 200 8,8 nd AIR FRANCE/KLM 235 700 2,8
trends bulletin
 Airlines www.enac.fr RPK* (millions) 1st 12/11 2nd 12/11 3nd 12/11 UNITED HOLDING 292 189-0,3 0,3 0,1-1,9 DELTA AIR LINES 270 817 1,1 0,2 0,9 0,0 AIR FRANCE - KLM 215 082 6,9 7,2 3,5 1,9 AMERICAN AL 203
Top 50 Passenger traffic between US and the others (country-pair) CANADA MEXICO UNITED KINGDOM JAPAN GERMANY FRANCE DOMINICAN (REP.
 CANADA MEXICO UNITED KINGDOM JAPAN GERMANY FRANCE DOMINICAN (REP.") Airlines nd: not disclosed Airlines www.enac.fr Main low-cost airlines Pax (thousands) RPK* (millions) SOUTHWEST AL 135 767 2,0 4,7 5,3 7,1 RYANAIR 86 290 6,0 29,7 15,6 11,2 EASYJET AL 54 137 6,2 7,1 7,6
Airlines nd: not disclosed Airlines www.enac.fr Main low-cost airlines Pax (thousands) RPK* (millions) SOUTHWEST AL 135 767 2,0 4,7 5,3 7,1 RYANAIR 86 290 6,0 29,7 15,6 11,2 EASYJET AL 54 137 6,2 7,1 7,6
trends bulletin 01/2012 Main airlines traffic 3 rd quarter 2011 Main low cost airlines
 www.enac.fr Main airlines traffic 3 rd Airlines RPK* (millions) ** 1st 2nd 3rd DELTA AIR LINES 310 900 2,2 1,3 0,9-0,4 UNITED / CONTINENTAL (1) 226 700-12,2-2,8 0,1-1,5 AMERICAN AL 201 900 2,5 1,6 1,8
Main airlines traffic 3 rd quarter nd quarter 16/15. 1st quarter 16/15. 3rd. quarter 16/15 01/ nd quarter 16/15. 3rd quarter 16/15.
 Main airlines traffic 3 rd Airlines AMERICAN AL Group 321 000 3,6 3,1 0,6-2,2 DELTA AIR LINES 303 100 4,0 3,2 3,0-0,2 UNITED HOLDING 295 500 2,6 0,5 0,1 2,4 EMIRATES AL 251 200 8,8 2,5 5,5 nd AIR FRANCE/KLM
trends bulletin 10/2015 Main airlines traffic 2 nd quarter 2015 Main low cost airlines 2nd quarter 15/14 (%) 1st quarter 15/14 (%)
 1st quarter 15/14 (%)") 10/ www.enac.fr Main airlines traffic 2 nd Airlines RPK* (millions) Main low cost airlines * Revenue-Passenger-Kilometer (RPK) measures actual passenger traffic AMERICAN AL GROUP 314 802 0,4-0,8-0,8 DELTA
10/ www.enac.fr Main airlines traffic 2 nd Airlines RPK* (millions) Main low cost airlines * Revenue-Passenger-Kilometer (RPK) measures actual passenger traffic AMERICAN AL GROUP 314 802 0,4-0,8-0,8 DELTA
Los Angeles World Airports (LAWA) Traffic Comparison (TCOM) Los Angeles International Airport Calendar YTD January to December
 Traffic Comparison (TCOM) Los Angeles International Airport Calendar YTD January to December") Los Angeles World Airports (LAWA) Traffic Comparison (TCOM) Los Angeles Airport Calendar YTD January to December Jan-214 Jan-213 to to Dec-214 Dec-213 % Change Dec-214 Dec-213 % Change Passenger Traffic
Los Angeles World Airports (LAWA) Traffic Comparison (TCOM) Los Angeles Airport Calendar YTD January to December Jan-214 Jan-213 to to Dec-214 Dec-213 % Change Dec-214 Dec-213 % Change Passenger Traffic
Orders and deliveries report
 AIRFINANCE DEALS DATABASE Orders and deliveries report Q4 215 www.airfinancejournal.com/dealsdatabase BACKLOG OVERVIEW BACKLOG WORLD BACKLOG DISTRIBUTION BY ASSET CLASS 23.7% 16.9% 3.8% Regional 11% Turboprop
Global Aviation Monitor (GAM)
") Global Aviation Monitor (GAM) Analysis and Short Term Outlook of Global, European and German Air Transport Main Results of Global Air Transport Supply Analysis and Outlook Background: Covers about 3,500
Global Aviation Monitor (GAM) Analysis and Short Term Outlook of Global, European and German Air Transport Main Results of Global Air Transport Supply Analysis and Outlook Background: Covers about 3,500
Los Angeles World Airports (LAWA) Traffic Comparison (TCOM) Los Angeles International Airport
 Traffic Comparison (TCOM) Los Angeles International Airport") Los Angeles World Airports (LAWA) Traffic Comparison (TCOM) Los Angeles Airport Passenger Traffic s 1 3,75,6 1,34,133 December 1 3,474,16 1,35,576 7.% Calendar YTD December 9 % Change 1 9 43,134,145 41,419,913
Los Angeles World Airports (LAWA) Traffic Comparison (TCOM) Los Angeles Airport Passenger Traffic s 1 3,75,6 1,34,133 December 1 3,474,16 1,35,576 7.% Calendar YTD December 9 % Change 1 9 43,134,145 41,419,913
Global Aviation Monitor (GAM)
") Global Aviation Monitor (GAM) Analysis and Short Term Outlook of Global, European and German Air Transport Main Results of Global Air Transport Supply Analysis and Outlook Background: Covers about 3,500
Global Aviation Monitor (GAM) Analysis and Short Term Outlook of Global, European and German Air Transport Main Results of Global Air Transport Supply Analysis and Outlook Background: Covers about 3,500
Los Angeles World Airports (LAWA) Traffic Comparison (TCOM) Los Angeles International Airport
 Traffic Comparison (TCOM) Los Angeles International Airport") Los Angeles World Airports (LAWA) Traffic Comparison (TCOM) Los Angeles Airport Passenger Traffic s 1 3,43,69 1,6,73 September 1 3,85,664 1,5,195 4.47% Calendar YTD September 9 % Change 1 9 3,4,561 31,6,815
Los Angeles World Airports (LAWA) Traffic Comparison (TCOM) Los Angeles Airport Passenger Traffic s 1 3,43,69 1,6,73 September 1 3,85,664 1,5,195 4.47% Calendar YTD September 9 % Change 1 9 3,4,561 31,6,815
Global Airline Capacity Winter 2013/14 Boeing Commercial Airplanes
 Global Airline Capacity Winter 2013/14 Boeing Commercial Airplanes Istanbul Technical University Air Transportation Management M.Sc. Program BOEING is a trademark of Boeing Management Company. Network,
Global Aviation Monitor (GAM)
") Global Aviation Monitor (GAM) Analysis and Short Term Outlook of Global, European and German Air Transport Main Results of Global Air Transport Supply Analysis and Outlook Background: Covers about 3,500
Global Aviation Monitor (GAM) Analysis and Short Term Outlook of Global, European and German Air Transport Main Results of Global Air Transport Supply Analysis and Outlook Background: Covers about 3,500
LAX SPECIFIC PLAN AVIATION ACTIVITY ANALYSIS REPORT CY 2017
 LAX SPECIFIC PLAN AVIATION ACTIVITY ANALYSIS REPORT CY 2017 Prepared May 2018 Los Angeles International Airport (LAX) Specific Plan Compliance Review Aviation Activity Analysis January - December 2017
FLEET WATCH A review of commercial aircraft orders and deliveries for 2015
 A review of commercial aircraft orders and deliveries for 215 AIRCRAFT ORDERS There were 2,684 commercial aircraft ordered during 215, data from Flightglobal s Fleets Analyzer shows. Together with 31 cancellations
Global Aviation Monitor (GAM)
") Global Aviation Monitor (GAM) Analysis and Short Term Outlook of Global, European and German Air Transport Main Results of Global Air Transport Supply Analysis and Outlook Background: Covers about 3,500
Global Aviation Monitor (GAM) Analysis and Short Term Outlook of Global, European and German Air Transport Main Results of Global Air Transport Supply Analysis and Outlook Background: Covers about 3,500
Facts & Figures. Non-US Airline Traffic Aircraft Data. Aircraft Values. US Consumer Complaints February US Fuel Cost And Consumption
 Facts & Figures Aircraft Data Aircraft Values Aircraft E-190 CRJ900 RJ100 MTOW 105.4-114.2 80.5-84.5 97.5-101.5 Engine Types CF34-10E5 92; CF34-10E5A1 87; CF34-10E6 99; CF34-10E6A1 28; CF34-10E7 10 CF34-8C5
MONTHLY AIRPORT TRAFFIC REPORT April 2017
 MONTHLY AIRPORT TRAFFIC REPORT AIRCRAFT OPERATIONS 2017 2016 Change Domestic Air Carrier 56,570 60,697-6.80% Air Taxi 7,771 7,806-0.45% General Aviation 833 699 19.17% Military 23 14 64.29% Subtotal 65,197
MONTHLY AIRPORT TRAFFIC REPORT September 2016
 MONTHLY AIRPORT TRAFFIC REPORT AIRCRAFT OPERATIONS 2016 2015 Change Domestic Air Carrier 59,030 59,038-0.01% Air Taxi 7,779 7,201 8.03% General Aviation 704 571 23.29% Military 21 12 75.00% Subtotal 67,534
MONTHLY AIRPORT TRAFFIC REPORT June 2017
 MONTHLY AIRPORT TRAFFIC REPORT AIRCRAFT OPERATIONS 2017 2016 Change Domestic Air Carrier 61,445 62,662-1.94% Air Taxi 8,267 7,656 7.98% General Aviation 644 685-5.99% Military 8 18-55.56% Subtotal 70,364
MONTHLY AIRPORT TRAFFIC REPORT July 2017
 MONTHLY AIRPORT TRAFFIC REPORT AIRCRAFT OPERATIONS 2017 2016 Change Domestic Air Carrier 63,535 63,680-0.23% Air Taxi 7,291 7,548-3.40% General Aviation 630 717-12.13% Military 15 11 36.36% Subtotal 71,471
Heathrow Airport (LHR)
") Heathrow Airport (LHR) Summer 2018 (S18) Start of Season Report Report Date: Wed 21Mar2018 Headlines S18 Start vs. S17 Start vs. S17 End Total Air Transport Movements (Passenger & Freight) 294775 0.2%
Heathrow Airport (LHR) Summer 2018 (S18) Start of Season Report Report Date: Wed 21Mar2018 Headlines S18 Start vs. S17 Start vs. S17 End Total Air Transport Movements (Passenger & Freight) 294775 0.2%
HEATHROW AIRPORT LHR Summer 2014 (S14) Start of Season
 Start of Season") HEATHROW AIRPORT LHR Summer 214 (S14) Start of Season KEY STATISTICS Summer 214 vs Summer 213 Air Transport Movements Allocated 282,172.6% Passenger Air Transport Movements Allocated 28,726.6% Total Seats
HEATHROW AIRPORT LHR Summer 214 (S14) Start of Season KEY STATISTICS Summer 214 vs Summer 213 Air Transport Movements Allocated 282,172.6% Passenger Air Transport Movements Allocated 28,726.6% Total Seats
MONTHLY AIRPORT TRAFFIC REPORT August 2018
 MONTHLY AIRPORT TRAFFIC REPORT AIRCRAFT OPERATIONS 2018 2017 Change Domestic Air Carrier 65,465 63,201 3.58% Air Taxi 7,607 7,533 0.98% General Aviation 594 609-2.46% Military 15 3 400.00% Subtotal 73,681
MONTHLY AIRPORT TRAFFIC REPORT February 2018
 MONTHLY AIRPORT TRAFFIC REPORT AIRCRAFT OPERATIONS 2018 2017 Change Domestic Air Carrier 51,809 51,854-0.09% Air Taxi 6,659 6,988-4.71% General Aviation 651 540 20.56% Military 6 9-33.33% Subtotal 59,125
MONTHLY AIRPORT TRAFFIC REPORT July 2018-(Revised)
") MONTHLY AIRPORT TRAFFIC REPORT AIRCRAFT OPERATIONS 2018 2017 Change Domestic Air Carrier 64,066 63,535 0.84% Air Taxi 7,468 7,291 2.43% General Aviation 550 630-12.70% Military 5 15-66.67% Subtotal 72,089
MONTHLY AIRPORT TRAFFIC REPORT AIRCRAFT OPERATIONS 2018 2017 Change Domestic Air Carrier 64,066 63,535 0.84% Air Taxi 7,468 7,291 2.43% General Aviation 550 630-12.70% Military 5 15-66.67% Subtotal 72,089
MONTHLY AIRPORT TRAFFIC REPORT December 2018
 MONTHLY AIRPORT TRAFFIC REPORT AIRCRAFT OPERATIONS 2018 2017 Change Domestic Air Carrier 58,905 55,828 5.51% Air Taxi 6,948 6,810 2.03% General Aviation 499 565-11.68% Military 24 25-4.00% Subtotal 66,376
MONTHLY AIRPORT TRAFFIC REPORT September 2018
 MONTHLY AIRPORT TRAFFIC REPORT AIRCRAFT OPERATIONS 2018 2017 Change Domestic Air Carrier 58,763 55,902 5.12% Air Taxi 6,537 6,689-2.27% General Aviation 605 658-8.05% Military 14 17-17.65% Subtotal 65,919
Remedy awarded (complaints decided in qtr)
") Quarterly complaints data for Q2 2018 from the CAA Approved ADR entities and the CAA s Passenger Advice and Team ADR entity No remedy per million pax Total Average award consumers Air Canada/Canada Rouge
Quarterly complaints data for Q2 2018 from the CAA Approved ADR entities and the CAA s Passenger Advice and Team ADR entity No remedy per million pax Total Average award consumers Air Canada/Canada Rouge
MONTHLY AIRPORT TRAFFIC REPORT July 2016
 MONTHLY AIRPORT TRAFFIC REPORT AIRCRAFT OPERATIONS 2016 2015 Change Domestic Air Carrier 63,680 62,789 1.42% Air Taxi 7,548 8,007-5.73% General Aviation 717 558 28.49% Military 11 146-92.47% Subtotal 71,956
MONTHLY AIRPORT TRAFFIC REPORT April 2018
 MONTHLY AIRPORT TRAFFIC REPORT AIRCRAFT OPERATIONS 2018 2017 Change Domestic Air Carrier 60,928 56,570 7.70% Air Taxi 6,995 7,771-9.99% General Aviation 654 833-21.49% Military 9 23-60.87% Subtotal 68,586
ANA Fact Book All Nippon Airways Co., Ltd. Contents
 All Nippon Airways Co., Ltd. Contents 2 Domestic Passenger Market 4 International Passenger Market 5 Cargo Market 6 Haneda and Narita Airports 7 Global Alliance Statistics 8 Aircraft Specifications 9 Consolidated
MONTHLY AIRPORT TRAFFIC REPORT May 2015
 MONTHLY AIRPORT TRAFFIC REPORT AIRCRAFT OPERATIONS 2015 2014 Change Domestic Air Carrier 60,427 57,339 5.39% Air Taxi 7,825 10,967-28.65% General Aviation 547 635-13.86% Military 135 27 400.00% Subtotal
MONTHLY AIRPORT TRAFFIC REPORT March 2017
 MONTHLY AIRPORT TRAFFIC REPORT AIRCRAFT OPERATIONS 2017 2016 Change Domestic Air Carrier 60,360 61,951-2.57% Air Taxi 8,591 8,270 3.88% General Aviation 717 615 16.59% Military 14 27-48.15% Subtotal 69,682
MONTHLY AIRPORT TRAFFIC REPORT December 2017
 MONTHLY AIRPORT TRAFFIC REPORT AIRCRAFT OPERATIONS 2017 2016 Change Domestic Air Carrier 55,828 57,943-3.65% Air Taxi 6,810 7,642-10.89% General Aviation 565 569-0.70% Military 25 32-21.88% Subtotal 63,228
TABLE OF CONTENTS. Scheduling Limits 2. Air Transport Movements 3. Total Seats and Seats per Movement 4. Airline Analysis 5.
 HEATHROW WINTER 211/12 Start of Season Report KEY STATISTICS Air Transport Movements -.4% Total Seats -1.1% Seats per Air Transport Movement -.7% TABLE OF CONTENTS Page Scheduling Limits 2 Air Transport
PORT OF SEATTLE - STIA PFC Quarterly Status Report - Revenue and Expenditures Activity thru 03/31/2016
 PORT OF SEATTLE - STIA PFC Quarterly Status Report - Revenue and Activity thru 03/31/2016 Total Collection Authority $2,167,378,460 Approved for Collection Approved for Use Approved Applications "Impose"
Global Aviation Monitor (GAM)
") Global Aviation Monitor (GAM) Analysis and Short Term Outlook of Global, European and German Air Transport Main Results of Global Air Transport Supply Analysis and Outlook Background: Covers about 3,500
Global Aviation Monitor (GAM) Analysis and Short Term Outlook of Global, European and German Air Transport Main Results of Global Air Transport Supply Analysis and Outlook Background: Covers about 3,500
Japan Export Air. International Air Freight Fuel Surcharge. All Destinations
 Japan Export Air January 12, 218 International Air Freight Fuel Surcharge Carrier 3K Jet Star Asia Airways 66 1-Jan-15 Taiwan, Philippines 48 1-Jan-15 5C C.A.L. Cargo 13 1-Oct-12 China, Hong Kong, Korea,
London Heathrow CDA Performance - by Airline and Aircraft. Period From : 01/03/2009 To: 31/03/2009. Wednesday, April 1, 2009 V1.4.1.
 Abs Jets A.S. Learjet (L23/L24/L25/28/L29) Aer Lingus Plc Airbus A320 0 0 1 100 292 96 0 0 Aeroflot-Russian s Jsc Airbus A321 0 0 0 0 310 93 0 0 Airbus A330-300 Airbus A319 0 0 0 0 16 63 0 0 Airbus A320
Japan Export Air. International Air Freight Fuel Surcharge. All Destinations
 Japan Export Air January 3, 218 International Air Freight Fuel Surcharge Carrier 3K Jet Star Asia Airways All s 66 1-Jan-15 Taiwan, Philippines 48 1-Jan-15 5C C.A.L. Cargo All s 13 1-Oct-12 China, Hong
Miami-Dade Aviation Department Aviation Statistics Flight Ops - All Airlines Facility: MIA Units: Flight Operations. Friday, December 28, 2018
 51,124 53,607 40,295 37,729 182,755 0.87 American Airlines Inc 181,179 50,824 53,173 39,776 37,406 21,401 24,296 6,787 3,767 56,251 4.16 Envoy Air Inc 54,002 20,245 23,243 6,798 3,716 10,978 13,972 3,744
Global Aviation Monitor (GAM)
") Global Aviation Monitor (GAM) Analysis and Short Term Outlook of Global, European and German Air Transport Main Results of Global Air Transport Supply Analysis and Outlook Background: Covers about 3,500
Global Aviation Monitor (GAM) Analysis and Short Term Outlook of Global, European and German Air Transport Main Results of Global Air Transport Supply Analysis and Outlook Background: Covers about 3,500
Japan Export Air. International Air Freight Fuel Surcharge. All Destinations
 Japan Export Air March 30, 2019 International Air Freight Fuel Surcharge 3K Jet Star Asia Airways All s 66 1-Jan-15 Taiwan, Philippines 48 1-Jan-15 5C C.A.L. Cargo All s 130 1-Oct-12 China, Hong Kong,
Miami-Dade Aviation Department Aviation Statistics Flight Ops - All Airlines Facility: MIA Units: Flight Operations. Wednesday, January 23, 2019
 51,338 53,806 40,322 37,775 183,241 1.61 American Airlines Inc 180,331 50,557 52,914 39,628 37,232 21,274 24,183 6,752 3,735 55,944 1.84 Envoy Air Inc 54,934 20,745 23,694 6,774 3,721 10,931 13,914 3,698
Japan Export Air. International Air Freight Fuel Surcharge. All Destinations
 Japan Export Air February 27, 2019 International Air Freight Fuel Surcharge 3K Jet Star Asia Airways All s 66 1-Jan-15 Taiwan, Philippines 48 1-Jan-15 5C C.A.L. Cargo All s 130 1-Oct-12 China, Hong Kong,
MONTHLY AIRPORT TRAFFIC REPORT January 2018
 MONTHLY AIRPORT TRAFFIC REPORT AIRCRAFT OPERATIONS 2018 2017 Change Domestic Air Carrier 55,461 55,980-0.93% Air Taxi 7,166 7,330-2.24% General Aviation 690 625 10.40% Military 6 11-45.45% Subtotal 63,323
J.P. Morgan 2019 Global Emerging Markets Corporate Conference. Miami, February 2019
 J.P. Morgan 2019 Global Emerging Markets Corporate Conference Miami, February 2019 This presentation may include forward-looking comments regarding the Company s business outlook and anticipated financial
PORT OF SEATTLE - STIA PFC Quarterly Status Report - Revenue and Expenditures Activity thru 06/30/2016
 PORT OF SEATTLE - STIA PFC Quarterly Status Report - Revenue and Activity thru 06/30/2016 Total Collection Authority $2,167,378,460 Approved for Collection Approved for Use Approved Applications "Impose"
PORT OF SEATTLE - STIA PFC Quarterly Status Report - Revenue and Expenditures Activity thru 12/31/2016
 PORT OF SEATTLE - STIA PFC Quarterly Status Report - Revenue and Activity thru 12/31/2016 Total Collection Authority $2,167,378,460 Approved for Collection Approved for Use Approved Applications "Impose"
PORT OF SEATTLE - STIA PFC Quarterly Status Report - Revenue and Expenditures Activity thru 03/31/2017 No change since 2016 Q4
 PORT OF SEATTLE - STIA PFC Quarterly Status Report - Revenue and Activity thru 03/31/2017 No change since 2016 Q4 Total Collection Authority $2,167,378,460 Approved for Collection Approved for Use Approved
Global Aviation Monitor (GAM)
") Global Aviation Monitor (GAM) Analysis and Short Term Outlook of Global, European and German Air Transport Main Results of Global Air Transport Supply Analyses and Outlook Background: Covers about 3.5
Global Aviation Monitor (GAM) Analysis and Short Term Outlook of Global, European and German Air Transport Main Results of Global Air Transport Supply Analyses and Outlook Background: Covers about 3.5
Number of complaints decided where a financial remedy awarded. Number of complaints received others
 Quarterly data for Q4 2017 from the CAA Approved entities and the CAA s Passenger Advice and Complaints Team Airline / Airport name of Aegean Airlines PACT 2 0 0 1 3 17 - - 25% Aer Lingus PACT 12 0 7 17
Miami-Dade Aviation Department Aviation Statistics Flight Ops - All Airlines Facility: MIA Units: Flight Operations. Wednesday, February 28,
 17,034 17,868 13,465 12,598 60,965-0.92 American Airlines Inc 61,533 17,495 18,251 13,281 12,506 7,601 8,548 2,275 1,271 19,695 21.51 Envoy Air Inc 16,209 5,735 6,764 2,394 1,316 4,504 5,579 1,440 353
The contents of this report may not be reproduced without the written consent of COHOR.
 Nice Côte d Azur Airport NCE/LFMN Summer 2018 - Start Of Season Report Report data extraction date: 27 March 2018 Table of contents Evolution of allocated slots at the Start Of Season (SOS)... 2 Total
Miami-Dade Aviation Department Aviation Statistics Flight Ops - All Airlines Facility: MIA Units: Flight Operations. Tuesday, December 11, 2018
 50,946 53,422 40,332 37,789 182,489 0.60 American Airlines Inc 181,392 51,073 53,402 39,639 37,278 21,657 24,554 6,780 3,758 56,749 6.75 Envoy Air Inc 53,160 19,786 22,807 6,837 3,730 11,093 13,991 3,698
Miami-Dade Aviation Department Aviation Statistics Flight Ops - All Airlines Facility: MIA Units: Flight Operations
 38,439 40,280 30,403 28,506 137,628-0.58 American Airlines Inc 138,425 39,112 40,846 30,101 28,366 16,268 18,488 5,123 2,803 42,682 10.30 Envoy Air Inc 38,697 14,122 16,408 5,265 2,902 9,491 11,910 3,096
The Need and Urgency for a Three-Runway System (3RS) August 7, 2014
 August 7, 2014") The Need and Urgency for a Three-Runway System (3RS) August 7, 2014 1 1 Need for 3RS? 2 Recent criticism HKIA is being managed inefficiently AA allows the proliferation of narrow-bodied aircraft and small
The Need and Urgency for a Three-Runway System (3RS) August 7, 2014 1 1 Need for 3RS? 2 Recent criticism HKIA is being managed inefficiently AA allows the proliferation of narrow-bodied aircraft and small
Punctuality for june 2018 per airline
 Punctuality for june 2018 per airline Departures scheduled *) Delayed more than 15 minutes. **) s having less than 10 operations. Planned Cancelled Delayed *) Punctuality Avg. delay (min) Adria Airways
MRJ Next Generation Regional Jet
 February 12th, 2016 MRJ Next Generation Regional Jet Masao Yamagami Chairman and CEO Mitsubishi Aircraft Corporation America, Inc. 1 Grow Aerospace to become the Main Industry in Japan Sale amount by industry
Punctuality for september 2018 per airline
 for september 2018 per airline Departures scheduled Adria Airways 31 29 2 94% 12 61% 57 Aegean s S.A. Aeroflot Russian s 24 24 0 100% 6 75% 28 60 60 0 100% 2 97% 24 Air Baltic 90 90 0 100% 6 93% 25 Air
EVOLUTION OF ALLOCATED SLOTS AT THE START OF SEASON (SOS)... 2 TOTAL SLOTS BY OPERATOR TOP SLOTS DISTRIBUTION PER ALLIANCE...
... 2 TOTAL SLOTS BY OPERATOR TOP SLOTS DISTRIBUTION PER ALLIANCE...") Paris - Charles de Gaulle Airport CDG/LFPG Winter 2017 - Start Of Season Report Report data extraction date: 30 October 2017 Table of contents EVOLUTION OF ALLOCATED SLOTS AT THE START OF SEASON (SOS)...
Paris - Charles de Gaulle Airport CDG/LFPG Winter 2017 - Start Of Season Report Report data extraction date: 30 October 2017 Table of contents EVOLUTION OF ALLOCATED SLOTS AT THE START OF SEASON (SOS)...
Prediction of Skytrax airline rankings, short formula (2e)
") Site: Wiki of Science at http://wikiofscience.wikidot.com Source page: 20120725 - Prediction of Skytrax airline rankings, short formula (2e) - 2010 at http://wikiofscience.wikidot.com/print:20120725-skytrax-al-short-perezgonzalez2010
Site: Wiki of Science at http://wikiofscience.wikidot.com Source page: 20120725 - Prediction of Skytrax airline rankings, short formula (2e) - 2010 at http://wikiofscience.wikidot.com/print:20120725-skytrax-al-short-perezgonzalez2010
PORT OF SEATTLE - STIA PFC Quarterly Status Report - Revenue and Expenditures Activity thru 09/30/2017
 PORT OF SEATTLE - STIA PFC Quarterly Status Report - Revenue and Activity thru 09/30/2017 Total Collection Authority $3,841,864,375 Approved for Collection Approved for Use Approved Applications "Impose"
February Air Traffic Statistics. Prepared by the Office of Corporate Risk and Strategy
 February 215 Air Traffic Statistics Prepared by the Office of Corporate Risk and Strategy Commercial Total Dom Int'l Passengers % Change Air Traffic Summary February 215 Passenger Activity (in Millions)
Rankings of Major U.S. Airports. Total Passengers 2016
 Rankings of Major U.S. Airports Total Passengers Total Passengers (Millions) 1 Hartsfield Atlanta Int'l (ATL) Atlanta 104.2 2.6 2 Los Angeles Int'l (LAX) Los Angeles 80.9 8.0 3 O'Hare Int'l (ORD) Chicago
The contents of this report may not be reproduced without the written consent of COHOR.
 Nice Côte d Azur Airport NCE/LFMN Winter 2018 - Start Of Season Report Report data extraction date: 31 October 2018 Table of contents Evolution of allocated slots at the Start Of Season (SOS)... 2 Total
TAIPEI, Taiwan EVA Air joins the Star Alliance network, further strengthening the Alliance s presence in Asia-Pacific.
 Wider choice in growing Cross-Straits market TAIPEI, Taiwan EVA Air joins the Star Alliance network, further strengthening the Alliance s presence in Asia-Pacific. At the official joining ceremony held
Punctuality for may 2018 per airline
 for may 2018 per airline Departures scheduled **) having less than 10 operations. Adria Airways 33 28 5 85% 9 73% 49 Aegean S.A. Aeroflot Russian 23 23 0 100% 5 78% 25 66 63 3 95% 10 85% 53 Air Baltic
October Air Traffic Statistics. Prepared by the Office of Corporate Risk and Strategy
 October 214 Air Traffic Statistics Prepared by the Office of Corporate Risk and Strategy Metropolitan Washington Airports Authority Air Traffic Statistics Table of Contents Summary Air Traffic Summary...
Punctuality for november 2018 per airline
 for november 2018 per airline Departures scheduled Aegean s S.A. Aeroflot Russian s 21 21 0 100% 4 81% 31 60 60 0 100% 5 92% 24 Air Baltic 86 86 0 100% 3 97% 58 Air Canada 14 14 0 100% 8 43% 49 Air China
MONTHLY AIRPORT TRAFFIC REPORT. April 2014
 MONTHLY AIRPORT TRAFFIC REPORT AIRCRAFT OPERATIONS 2014 2013 Change Domestic Air Carrier 55,529 55,119 0.74% Air Taxi 11,149 15,077-26.05% General Aviation 639 723-11.62% Military 13 14-7.14% Subtotal
CHAPTER 2 Aviation Activity Forecasts
 CHAPTER 2 Aviation Activity Forecasts 2.1 Introduction 14 CFR Part 150 requires that noise exposure maps (NEMs) be prepared for two scenarios existing conditions and conditions 5 years into the future.
Airports Council International
 Airports Council International HOW SECURITY CONTRIBUTES TO THE ECONOMIC COMPETITIVENESS OF THE AIR CARGO INDUSTRY 16APRIL 2014 Michael Rossell Director ICAO Relations ACI World 1 Mission ACI promotes the
Growth, Opportunities and the Changing Dynamics of the Commercial Aviation Industry
 Growth, Opportunities and the Changing Dynamics of the Commercial Aviation Industry Daniel Friedenzohn, J.D., M.A. Assistant Professor, Aeronautical Science Department Embry-Riddle Aeronautical University
November Air Traffic Statistics. Prepared by the Office of Corporate Risk and Strategy
 November 214 Air Traffic Statistics Prepared by the Office of Corporate Risk and Strategy Air Traffic Statistics Table of Contents Summary Air Traffic Summary... 1 SH&E Air Traffic Schedule Activity...
FLEET CHANGES AND THE ECONOMIC IMPACT OF NEW TECHNOLOGY AIRCRAFT
 FLEET CHANGES AND THE ECONOMIC IMPACT OF NEW TECHNOLOGY AIRCRAFT Presented by: Deborah Meehan President and COO Simat, Helliesen and Eichner, Inc. ACI-NA Economic Specialty Conference June 6, 2006 Montreal
Megahubs International Index 2018
 Published: Sep 2018 Megahubs International Index 2018 The World s Most Internationally Connected Airports 2018 OAG Aviation Worldwide Limited. All rights reserved Contents About OAG Megahubs International
Punctuality for july 2018 per airline
 Punctuality for july 2018 per airline Departures scheduled *) Delayed more than 15 minutes. **) having less than 10 operations. Planned Cancelled Delayed *) Punctuality Avg. delay (min) Adria Airways 31
Malaysia s s 2020 Vision
 Kuala Lumpur International Airport: The New Southeast Asia Airline Hub? Lev Pinelis, M.S. Transportation December 7 th, 2004 1.231 Airport Systems Planning, Design, and Management Malaysia s s 2020 Vision
MONTHLY AIRPORT TRAFFIC REPORT February 2014
 MONTHLY AIRPORT TRAFFIC REPORT AIRCRAFT OPERATIONS 2014 2013 Change Domestic Air Carrier 44,741 48,627-7.99% Air Taxi 11,144 13,003-14.30% General Aviation 569 543 4.79% Military 17 15 13.33% Subtotal
January Air Traffic Statistics. Prepared by the Office of Marketing & Consumer Strategy
 January 218 Air Traffic Statistics Prepared by the Office of Marketing & Consumer Strategy This report includes only data submitted by airlines as of the date of publication: March 21, 218. Reports are
STATISTICAL REPORT Fiscal YEAR SUMMARY. Houston Airport System P.O. Box Houston, TX
 STATISTICAL REPORT 215 Fiscal YEAR SUMMARY P.O. Box 616 Houston, TX 7725 16 Table of Contents 1 Aircraft Operations 2 3 George Bush Intercontinental 4 William P. Hobby 5 Originating Enplaned 6 7 8 Passenger
ACI-NA 19th ANNUAL CONFERENCE EXHIBITION
 ACI-NA 19th ANNUAL CONFERENCE EXHIBITION Air Service Reality Check Ed Faberman Air Carrier Association of America September 28, 2010 GOOD TO BE IN PITTSBURGH!!! 2 Airline Industry Challenges Future of
Hong Kong Yesterday: The Places By British Airways
 Hong Kong Yesterday: The Places By British Airways If looking for a ebook Hong Kong Yesterday: The Places by British Airways in pdf format, then you have come on to the correct site. We furnish full variation
Quarterly report 3Q 2012
 Quarterly report Quarterly report Introduction Introduction 2 Feature The future of aviation 3 Assets Orders Introduction 5 Widebody 7 Narrowbody 8 Regional 9 Customer lists 10 Deliveries Introduction
September Air Traffic Statistics. Prepared by the Office of Marketing & Consumer Strategy
 September 2018 Air Traffic Statistics Prepared by the Office of Marketing & Consumer Strategy This report includes only data submitted by airlines as of the date of publication: November 14, 2017. Reports
Selected highlights: The burgeoning Pacific market
 ACI releases preliminary world airport traffic rankings Robust gains in passenger traffic at hub airports serving trans-pacific and East Asian routes Montreal, 19 April 2017 Traffic at the world s 20 busiest
Effects of Deregulation on Airports. Effects of Deregulation on Airports
 Effects of Deregulation on Airports Dr. Richard de Neufville Professor of Engineering Systems and Civil and Environmental Engineering Massachusetts Institute of Technology Effects of Deregulation on Airports
Heathrow Airport LHR Winter 2012 START OF SEASON REPORT
 Heathrow Airport LHR Winter 212 START OF SEASON REPORT KEY STATISTICS Winter 212 vs Winter 211 Start vs Winter 211 End Air Transport Movements 194,486-2.%.1% Total Seats (m) 4.1.1% 3.4% Seats per Passenger
Changing Airline Industry Prof. Richard de Neufville
 Changing Airline Industry Prof. Richard de Neufville Istanbul Technical University Air Transportation Management M.Sc. Program Airport Planning and Management Module 08 January 2017 Airline Industry Reconfiguration
Punctuality for february 2018 per airline
 for february 2018 per airline Departures scheduled **) having less than 10 operations. Adria Airways 20 19 1 95% 0 100% 0 Aegean S.A. Aeroflot Russian 12 12 0 100% 4 67% 21 57 56 1 98% 8 86% 49 Air Baltic