MEETING LOCATION NOTICE The March 18, 2015 Noise Oversight Committee will be begin at 1:30 p.m. at the Richfield Municipal Building, 6700 Portland
|
|
|
- Cordelia Jones
- 5 years ago
- Views:
Transcription
1 MEETING LOCATION NOTICE The March 18, 2015 Noise Oversight Committee will be begin at 1:30 p.m. at the Richfield Municipal Building, 6700 Portland Avenue South, Richfield, MN. (The Committee Pre meeting will begin at 1:00 p.m. in the Heredia Meeting Room NOC members only).
 Noise Oversight Committee (NOC) MAC General Office Building Lindbergh Conference Room 6040 28 th Avenue South Minneapolis, MN 55450 NOC Committee Members Jeffrey Hart")
2 Metropolitan Airports Commission (MAC) Minneapolis-St. Paul International Airport (MSP) Noise Oversight Committee (NOC) MAC General Office Building Lindbergh Conference Room th Avenue South Minneapolis, MN NOC Committee Members Jeffrey Hart Co-Chair (Delta Air Lines) Elizabeth Petschel Co-Chair (Mendota Heights City Council) John Bergman At-Large Cities Representative (Apple Valley City Council) John Carlson (United Parcel Service) Karen Erazo (Sun Country Airlines) Cyndee Fields (Eagan City Council) Tim Fields At-Large User Representative (Delta Global Services) Tom Fitzhenry (Richfield City Council) Ben McQuillan (MBAA) Jon Oleson (Bloomington City Council) John Quincy (Minneapolis City Council) Bill Underwood (Chief Pilot Delta Air Lines) MEETING AGENDA March 18, :30 P.M. Richfield Municipal Building 6700 Portland Avenue South Richfield, MN (Jeff Hart Delta Air Lines & NOC Co Chair, will be the acting Chairperson for the meeting) *Note: 1:00 to 1:30 Committee Agenda Review Session (NOC members only in the Heredia Meeting Room) 1. 1:30 1:35 Review and Approval of the January 21, 2015 Meeting Minutes 2. 1:35 1:45 Review of Monthly Operations Reports: January and February, :10 2:20 Presentation: Runway Use System and RNAV STAR Update, Elaine Buckner, FAA Air Traffic Manager 4. 2:20 2:25 Presentation: MSP 2035 LTCP, Neil Ralston, MAC Airport Planner 5. 2:25 2: Annual Noise Contour Report 6. 2:35 2:40 Nighttime Operations Assessment 7. 2:40 2:55 January 28, 2015 Public Input Meeting 8. 2:55 3:00 Public Comment Period 9. 2:55 Adjourn


3 ITEM 1 MSP NOISE OVERSIGHT COMMITTEE DRAFT MEETING MINUTES Wednesday, 21 January 2015, 1:30pm Richfield Municipal Center City Council Chambers Call to Order A regularly-scheduled meeting of the MSP Noise Oversight Committee, having been duly called, was held Wednesday, 21 January 2015, in the City Council Chambers at the Richfield Municipal Center. Chair Petschel called the meeting to order at 1:31pm. The following were in attendance: Representatives: K. Erazo, B. Underwood, D. Miller, J. Quincy, E. Petschel, J. Hart, J. Carlson, T. Fitzhenry, J. Oleson, J. Bergman Staff: Others: J. Lewis, P. Mosites, D. Anderson C. Costello City of Richfield; D. Sloan Mendota Heights Airport Relations Commission; L. Olson City of Minneapolis; B. Stewart Edina; M. Doran Richfield; L. Grotz Edina; T. Link City of Inver Grove Heights; K. Hageman City of St. Paul; D. Lowman City of Bloomington; B. Shotwell Richfield; D. Boberg City of Bloomington; B. Hoffman City of St. Louis Park; S. Devich City of Richfield 1. Election John Nelson, Technical Advisor, announced that, at the Committee s agenda review session held just prior to today s meeting, Ann Swenson, Edina At-large Representative, was elected as the At-large Community Group s alternate representative. 2. Review and Approval of the 19 November 2014 Meeting Minutes Representative Hart, Delta Air Lines, noted that the last line of item 5 of the 19 November 2014 meeting minutes should read the 777 is quieter and does not require the use of Runway 4. IT WAS MOVED BY REPRESENTATIVE CARLSON AND SECONDED BY REPRESENTATIVE HART TO APPROVE THE MINUTES OF THE 19 NOVEMBER 2014 MEETING, AS CORRECTED.
4 The motion carried by unanimous vote. 2. Review of Operations Report Summary: November and December 2014 Dana Nelson, Assistant Manager, Noise Environment & Planning, said there was a 14% increase in the number of complaints filed in November 2014 compared to November 2013, and a 2% decrease in the number of complaints filed in December 2014 compared to December She said total complaints increased 21% in 2014 compared to She said the number of complainants decreased slightly in 2014 compared to She said the communities with the highest number of submitted noise complaints in 2014 were Minneapolis, Edina and Eagan. She said there was a 26% increase in the number of complaints for Minneapolis in 2014, compared to She said there was a 67% increase in the number of complaints for Edina in 2014, compared to She said there was a 7% increase in the number of complaints for Eagan in 2014, compared to D. Nelson said total aircraft operations decreased 7.4% in November 2014 compared to November 2013 and decreased 4.8% in December 2014 compared to December She said there were 411,760 total aircraft operations at MSP in 2014, a 4.6% decrease compared to She noted that 2004 was the year of peak operations at MSP, with a total of 540,727 operations. She noted that total operations in 2014 were about 24% lower than in the peak year of She noted that the 2007 forecast total operations number was approximately 582,000 and that 2014 was approximately 29% below that number. D. Nelson said air carrier jet operations in November 2014 decreased 5.5% compared to November 2013, and decreased 3.4% in December 2014 compared to December She said less than 0% of the air carrier jet fleet composition was Modified Stage 3 aircraft in both November and December 2014, with six B727 operations in December She said there were 37 total Modified Stage 3 aircraft operations in 2014, compared to 71 in She said the 2007 forecast total Modified Stage 3 aircraft operations was over 100,000 and that there were approximately 101,000 in the peak year of D. Nelson said passenger counts were up 3-7% each month in 2014 compared to D. Nelson said nighttime operations (10:30pm 6:00am) increased 18% in November 2014 compared to November She said unusual weather circumstances during that time could have contributed to delays across the National Airspace System and at MSP. She said nighttime operations (10:30pm 6:00am) decreased 2.3% in December 2014 compared to December D. Nelson noted 1.2% of nighttime (10:30pm 6:00am) departures in November 2014 were off of Runway 35 due to very strong north and northeast winds on November. She said departures were also occurring off of Runway 4 at that time. Chair Petschel, Mendota Heights, noted that December was an unusual month in how MSP was used and asked to have that explained. D. Nelson said that, typically, MSP operates more often in a north flow in December with use of Runways 30L and 30R for departures. She said there was a fairly even split in December 2014 between northerly and southerly winds, so Runways 12L and 12R were used for departures in December 2014 more often than usually occurs. D. Nelson presented information on November and December 2014 nighttime (10:30pm 6:00am) nighttime scheduled vs actual carrier jet operations. She noted there were no
5 scheduled Modified Stage 3 operations and no actual Modified Stage 3 operations in November She said a typical reason for the difference in actual and scheduled nighttime operations is delays in the National Airspace System. She noted that cargo carriers do not report their scheduled to the Official Airline Guide, which is the source the MAC uses for scheduled vs actual nighttime operations. She said there were 608 scheduled nighttime (10:30pm 6:00am) arrivals in December 2014 and 1,177 actual nighttime arrivals. She said there were 140 scheduled nighttime (10:30pm 6:00am) departures in December 2014 and 269 actual nighttime departures. D. Nelson said there were 2,573 Runway 17 carrier jet departures, and 99.7% compliance with the Runway 17 Carrier Jet Departure Procedure, in November She said there were 4,566 Runway 17 carrier jet departures, and 99.7% compliance with the Runway 17 Carrier Jet Departure Procedure, in December D. Nelson said 95.6% of carrier jet departures using the Eagan-Mendota Heights Departure Corridor remained in the Corridor in November 2014, and 97.5% remained in the Corridor in December D. Nelson said 52% of carrier jet departures used the Crossing-in-the-Corridor Procedure during the nighttime hours of 11:00pm 6:00am during November 2014, and 50% used it in December She said 28% of carrier jet departures used the Procedure during the daytime hours of 6:00am 11:00pm during November 2014, and 32% used it in December Representative Miller, Eagan, noted Eagan residents are concerned about nighttime operations turning southwest over Eagan neighborhoods. She noted that the City of Eagan requests the FAA keep aircraft over the industrial area longer before having them make turns, particularly during low-demand periods during nighttime hours. 3. Presentation: Climate and Weather Trends Michael Griesinger, National Oceanic and Atmospheric Administration, National Weather Service, Chanhassen MN Michael Griesinger, National Oceanic and Atmospheric Administration, National Weather Service, Chanhassen MN, gave a presentation on weather trends and aviation impacts. Highlights of the presentation include: A basic review of the greenhouse effect, in which the sun s energy passes through the atmosphere and heats the ground, the ground heats the air, the air absorbs some of the energy and sends it back to the earth, which warms the earth The greenhouse effect is natural and warms the earth by approximately 57 F Increasing greenhouse gases increases the power of the greenhouse effect Land air temperatures, ocean water temperatures and ocean air temperatures have increased steadily since approximately 1980; sea levels have risen as well; summer arctic ice coverage has decreased steadily since approximately 1980 and dramatically in the past 10 years; tropospheric air temperatures, upper ocean temperatures and atmosphere moisture are increasing; northern hemisphere snow cover and glacial mass are decreasing In general, there are increases in precipitation along with decreases in precipitation days, indicating more potential for flooding and drought
6 Climates changes occur because of continental drift, slight changes in the Earth s tilt, slight changes in the Earth s orbit, decadal oscillations, changes in solar output and volcanic eruptions, but most of these occur over the course of tens of thousands to millions of years Climate changes occur because of anthropogenic (human-caused) actions, particularly burning fossil fuels, which result in increased greenhouse gases, which increases the strength of the greenhouse effect Not all anthropogenic sources result in warming The only way to explain recent warming trend is through anthropogenic forcing In Minnesota, there was an observed annual warming of 1.3 F from : +1.6 F in spring; +0.8 in summer; +0.5 in fall; +2.2 F in winter In Minnesota, there was an observed annual increase of 3.1 in precipitation from : +0.7 in spring; +0.8 in summer; 1.2 in fall; +0.3 in winter Global predictions through the mid-21 st century are for warmer winters, wetter winters and springs, and drier summers In Minnesota, we can expect increased variability in the weather, more extremes; greater temperature variability in winter; wetter but highly variable springs; drier summers with droughts becoming more likely; and milder falls with less snow Biggest impact to aviation will be from increases in days with storms, particularly thunderstorms, which affect aircraft routes and increase delays There has been an increased tendency for the jet stream to develop blocks, which causes weather patterns to get stuck for a prolonged period of time; blocking due to loss of arctic sea ice, which leads to a weaker temperature gradient between the cold poles and warmer mid-latitudes; affects wind patterns and directions Chair Petschel, Mendota Heights, asked if the increase in severe weather is a reason for the increase in nighttime operations. Griesinger said the timing and location of storms around the National Airspace System will have an impact on delays. Representative Oleson, Bloomington, asked if it s possible to predict whether not storms will become less predictable in their nature and location. Griesinger said modeling has improved and should continue to improve, allowing for storm preparation ahead of time, at least within 48 hours. In terms of a seasonal perspective, he said it will be difficult to predict. Petschel asked how volcanic ash impacts immediate weather effects. Griesinger said volcanic ash has an impact on the temperature record for at least three years after a major eruption. Representative Hart, Delta Air Lines, asked where we re at in the sunspot cycle. Griesinger said a maximum cycle completed in 2010, which was the weakest cycle observed. He said sunspot cycles are 10-year cycles, high-to-low, and that by 2020 we ll be in a low section of the cycle. Hart asked if that would mean predictably cooler temperatures. Griesinger said it would be the opposite.
7 4. Consent Decree Noise Mitigation Program Update Patrick Mosites, MAC Airport Development Project Manager Patrick Mosites, MAC Airport Development, updated the Committee on the Noise Mitigation Program. He reminded Committee members that program was split into different phases that determined the level of mitigation a home would receive. He said over 7,000 homes were affected through the program. He outlined: The DNL phase called for a 5-decibel modification package; 457 homes in Bloomington, Richfield and Minneapolis were eligible to receive the package, and 404 homes participated; construction began in August 2008 and all construction was completed in December 2009 in compliance with the Consent Decree; average cost for this phase was approximately $33,410 per home The DNL60-62 phase 2a called for installation of central air-conditioning and $4,832 of mitigation menu items; 2,911 homes in Bloomington, Eagan, Richfield and Minneapolis were eligible, and 1688 homes participated; construction began in February 2009 and was completed in October 2012; mitigation menu items included central air-conditioning, primary doors, primary windows, storm windows, storm doors and insulation The DNL phase 2b called for $15,343 of mitigation menu items (if a home already had central air-conditioning or if a homeowner opted for this phase instead of phase 2a); 3,367 homes in Bloomington, Eagan, Richfield and Minneapolis were eligible and 3,367 homes participated; construction was completed in October 2012; mitigation menu items included primary doors, primary windows, storm windows, storm doors and insulation The 2005 DNL60 to 2005 DNL 64 phase called for homes to share $7 million for approved mitigation reimbursements; approximately 2,409 homes were eligible; reimbursements began in March 2010 and were completed in September 2014; at the request of the Commission, a final notice regarding reimbursement was sent to 1,053 homeowners in February 2014; 1,773 homes participated at a total cost of $5,512,485; average reimbursement claim was $2,906 The DNL phase called for multi-family units to receive through-the-wall air-conditioning unit covers or through-the-wall air-conditioning units or equivalent; 2,124 units (107 buildings) were eligible in Bloomington, Richfield and Minneapolis; 252 units had a through-the-wall air-conditioning unit or equivalent provided; 1,724 through-the-wall air-conditioning frames and covers were installed; installations began in 2009 and were completed in 2010 Mosites noted that, according to an amendment to the Consent Decree, eligibility of singlefamily and multi-family homes to receive mitigation under the First Amendment Program will be based on actual noise contours developed for the preceding calendar year, beginning March Mosites said he receives calls from home owners seeking information on the products that were installed as part of the mitigation program, as well as their warranties. He noted some calls are from new homeowners seeking information on whether or not their home received mitigation.
8 5. Structural Disturbance Complaint Trends John Nelson, Technical Advisor, said that residents using the MAC Noise Program Office s online noise complaint form can select any of the following complaint types: early/late (operation); excessive noise; frequency; ground; helicopter; low; run-up; structural disturbance; other. He said that complainants may select more than one type of complaint and that complainants sometimes select all of the types at one time when making a complaint. He said the most common complaints are for excessive noise, frequency of overflight and low altitude. J. Nelson said there has been an increase in structural disturbance complaints, and that investigation into the trend shows this is largely the result of two complainants entries. He said the complainants have filed thousands of complaints. He said the complainants locations are in Edina and Mendota Heights. He noted that structural disturbance complaints increased significantly after discussions were held on the implementation of RNAV at MSP. J. Nelson noted that, in construction terms, structural disturbance would involve movement in a load-bearing surface such as the foundation of a home, exterior walls and load-bearing walls, beams and/or columns of a home. He said this is not necessarily the case in the structural disturbance complaints received by the MAC, which often cite windows and/or pictures or other objects rattling. He noted that structural disturbance complaints tend to increase during summer months. Representative Quincy, Minneapolis, noted that MAC staff provided information on structural disturbance complaints to the City of Minneapolis. He noted that that information did not include the two complainants J. Nelson mentioned, but that it still showed a trend of increasing structural disturbance trends in He asked if the 2014 trend might correlate to complaints about low altitude operations. J. Nelson said he does not have an answer to that question today, but that staff have been discussing ways to fine-tune complaint data analysis, and will be forming a task force to look into doing so. Chair Petschel, Mendota Heights, reminded Committee members that complaint analysis is on the group s 2015 Work Plan. Representative Bergman, At-large Representative, asked what year structural disturbance was added as a complaint option. J. Nelson said he is not certain but that it appears in the monthly Technical Advisor s Reports going back to 2010, 6. History and Origin of NOC: Review of the 2002 Blue Ribbon Panel Recommendations John Nelson, Technical Advisor, noted that the MAC s Executive Director convened a blue ribbon panel in 2002 to develop a new framework for an aircraft noise advisory committee. He said the cities of Minneapolis, Eagan and Mendota Heights had representatives on the panel, as did Northwest Airlines, the Minnesota Business Aviation Association and United Parcel Service. He said the panel proposed community and airport user concerns be considered and that information be communicated via the MAC Noise Office, the MAC Aviation Noise and Satellite Program website, the MSP Noise News newsletter, the MAC noise complaint and information hotline, governmental body official policy development processes, MAC public hearings, MAC informational meetings, NOC members, the MAC Planning and Environment Committee and MAC board meetings. J. Nelson noted the panel s report proposed the NOC provide a balanced forum for discussing and evaluating noise impacts around MSP by: identifying, studying and analyzing airport noise issues; providing policy recommendations or options regarding airport noise issues to the MAC
9 PDE Committee and to the MAC board; monitoring compliance with established noise policy at MSP; and ensuring the collection of information and dissemination to the public. J. Nelson said the panel recommended there be 12 members on the NOC, with six representatives from the airport users and six representatives from the community. He said the panel recommended that community representation be defined as those communities within or touched by the most-recently developed and submitted Part DNL contour, and one atlarge representative to represent the cities of St. Paul, Burnsville, Inver Grove Heights, Sunfish Lake and St. Louis Park. J. Nelson noted that the City of Edina was added to the at-large community group in J. Nelson said the panel recommended that five of the six airport user representatives, including one at-large representative, be determined by the MSP Airport Airline Affairs Committee and the sixth airport user representative be appointed by the Minnesota Business Aviation Association. J. Nelson said that, with regard to administrative matters, the panel recommended Robert s Rules of Order be utilized by the NOC, that the NOC meet bi-monthly and that NOC members meet for agenda review pre-meetings before each Committee meeting. The panel also outlined the roles the MAC board and staff should play, the reporting relationships and responsibilities and the NOC s bylaws. J. Nelson noted that the NOC met for the first time on 26 June Chair Petschel, Mendota Heights, observed that the framework developed by the Blue Ribbon Panel was developed to avoid the pitfalls that made the Metropolitan Airport Sound Abatement Council ineffective. Petschel noted that she and Representative Hart presented the NOC s 2014 accomplishments and its 2015 Work Plan to the MAC Planning, Development and Environment Committee. She said she asked the PDE Committee members if the NOC appeared to be functioning and accomplishing as the MAC had envisioned. She said the Committee said yes. Representative Hart, Delta Air Lines, noted that the NOC uses and analyzes more data which has been helpful in explaining aircraft noise issues. He thanked Nelson for staff s efforts in those areas. 7. FAA Categorical Exclusion Declaration (CATEx) Environmental Review for MSP STARs John Nelson, Technical Advisor, informed Committee members that the FAA issued a Categorical Exclusion Declaration for the environment review of the MSP Standard Terminal Approach Routes (STARs). He said this means the FAA can proceed with additional STARs implementation steps, which include quality assurance checks, flight inspections, automation updates, charting, air traffic control training, publication and post-implementation review. He clarified that STARs are for arrival operations and not for departure operations. He said the FAA plans to publish and implement the STARs procedures, which include Optimized Profile Descents, in March and April He noted that MSP Air Traffic Control may begin using STARs one runway at a time at MSP, and not on all runways at once. Chair Petschel, Mendota Heights, asked if the FAA could update the Committee on how the STARs implementation is proceeding, after it begins. J. Nelson said he would coordinate an
10 update with MSP Air Traffic Control. Representative Quincy, Minneapolis, asked if aircraft must have specific equipment on board in order to utilize and implement the STARs. Representative Underwood, Delta Air Lines, said all of Delta s fleet types will be able to use the procedures and that he believes all Delta Connection partners will be able to as well. J. Nelson said that all of the aircraft serving MSP, with the exception of turboprop aircraft, can fly the OPD. Quincy asked if there will be an evaluation of the STARs procedures, in terms of noise impacts, after implementation. J. Nelson said it is staff s intent to examine which data and measures could be used to determine whether or not they are having an impact. He noted that it would be more difficult to make that determination for areas lying outside the range of the RMTs. Quincy said he is not expecting Minneapolis to experience any changes. He asked if the airlines will be able to determine if there are any environmental impacts from the procedures. Chad Leqve, MAC Director of Environment, said that the use of OPDs has the potential to reduce of greenhouse gas emissions from arriving aircraft and that MAC staff was discussing the possibility of OPD tracking with the FAA and Delta Air Lines. 8. Public Comment Period There were no public comments. The next meeting of the NOC is scheduled for Wednesday, 18 March The meeting adjourned at 3:03pm. Respectfully Submitted, Christene Sirois Kron, Recording Secretary
11 ITEM 2 MEMORANDUM TO: MSP Noise Oversight Committee (NOC) FROM: Dana Nelson, Manager Noise, Environment and Planning SUBJECT: REVIEW OF MONTHLY OPERATIONS REPORTS DATE: March 4, 2015 Each month of the year the Metropolitan Airports Commission (MAC) produces a Technical Advisor s Report for the Noise Oversight Committee (NOC). This report provides maps, tables, and charts that examine runway use, departures and arrivals, and noise levels associated with aircraft operations at Minneapolis-St. Paul International Airport (MSP). The detailed content of a typical Monthly Technical Advisor s Report is provided below: 1) Complaint Data a) Number of Complaints i) Type (noise, engine run-up, low altitude, etc.), time of day/night, and complaint city of origin listing. b) Noise Complaint Map i) Showing location and number of complaints. 2) Runway Use a) FAA Available Time for Runway Usage i) Showing the airport layout and hours per month (all hours and nighttime hours) that each runway end met FAA Aviation Performance Metrics. b) MSP All Operations Runway Usage i) Showing the airport layout and the percentage of monthly flights for each runway. c) MSP Carrier Jet Operations Runway Usage i) Showing the airport layout and percentage of monthly flights by the air carriers. d) MSP Carrier Jet Fleet Composition i) Table showing type of aircraft, number of monthly operations at MSP, percentage of operations for each aircraft type and FAR Part 36 Take-Off Noise Levels. 3) Nighttime Runway Use (10:30 p.m. to 6:00 a.m.) a) MSP All Operations Nighttime Runway Usage i) Showing the airport layout and the percentage of use of each runway at night. b) MSP Carrier Jet Operations Nighttime Runway Usage i) Showing the airport layout and percentage of nighttime flights by the air carriers. c) MSP Scheduled Nighttime Operators i) Tables and a chart showing the names of the air carriers, number of operations per carrier and time of night of flights, including the schedule of nighttime jet operations. d) MSP Top 15 Nighttime Operators by Type and Stage Mix i) Tables and a chart the aircraft type (A320, MD 90, etc.), stage mix (Stage 3, hushkitted, etc.), and type of aircraft used by the air carriers by time of night. 4) Airport Noise and Operations Monitoring System a) Flight Tracks
12 i) A series of maps showing the density of weekly arrivals and departures and weekly flight tracks during the nighttime for each runway. b) MSP MACNOMS Remote Monitoring Tower Site Locations Map i) A map showing the locations of each of the 39 Remote Monitoring Towers (RMT). c) Time Above db Threshold for MSP Arrival/Departure-Related Noise Events Tables showing the address location of each RMT and the amount of time for the month that each RMT recorded jet aircraft noise arrivals and departures events >=65dB, >= 80dB, >= 90dB and => 100dB. d) MSP Arrival/Departure-Related Noise Events i) Tables showing the count of jet aircraft arrival and departure events >=65dB, >= 80dB, >= 90dB and => 100dB. e) MSP Top Ten Aircraft Noise Events per RMT i) Tables showing the flight number, aircraft type, runway and L MAX (db). f) Analysis of Daily and Monthly Aircraft Noise Events DNL At the March 18, 2015 NOC meeting, MAC staff will provide an update on the Technical Advisor s Reports for January and February, 2015.
13 ITEM 3 MEMORANDUM TO: MSP Noise Oversight Committee (NOC) FROM: Dana Nelson, Manager Noise, Environment and Planning SUBJECT: PRESENTATION: RUNWAY USE SYSTEM AND RNAV STAR UPDATE ELAINE BUCKNER, FAA AIR TRAFFIC MANAGER DATE: March 4, 2015 The 2015 Noise Oversight Committee (NOC) Work Plan includes a topic titled: Evaluate and Advocate Enhanced FAA RUS Usage/Implementation. Background At the May 8, 2014, Noise Oversight Committee (NOC) meeting an analysis of the Federal Aviation Administration's (FAA) utilization of the Runway Use System (RUS) at Minneapolis-St. Paul International Airport (MSP) was presented. In short, the analysis found that traffic demand, wind speed, and wind direction play a significant role in FAA/Air Traffic Control s utilization of the RUS. 1 On November 3, 2014, Metropolitan Airports Commission (MAC) staff provided the Planning, Development and Environment Committee (PD&E) a briefing on the specifics of the RUS. At the November 19, 2014 NOC meeting, the FAA reviewed the various factors and considerations that influence its runway use determinations. Since that meeting, MAC staff have facilitated discussions between the FAA, City of Minneapolis representatives, and the NOC Chairs to evaluate effective RUS utilization. The FAA has committed to evaluating its utilization of the RUS to ensure that it is being implemented as effectively as possible and will present its RUS evaluation findings at the NOC meeting in March. On February 2, 2015, FAA Air Traffic Control Manager Elaine Buckner gave a presentation to the MAC PD&E Committee on the complexities of runway use and the variables that impact discretion in runway use determinations. The FAA noted that Air Traffic Control s (ATC) mission is to provide a safe, orderly, and expeditious flow of traffic into and out of MSP. The FAA reviewed the existing runway use preferences for departures and arrivals indicating that the RUS is considered in use when operations are in a southeast flow and that wind conditions and demand are the primary driving factors in runway use configuration. The FAA noted the complexity of changing runway configurations under certain conditions and reviewed other factors that impact runway use such as surface conditions, de-icing needs, braking action, navigational equipment and visibility impacts on Instrument Landing System minimums. The FAA also noted that they were in the process of reviewing current opportunities available to increase RUS utilization. 1 In addition to the significant issues of air traffic demand levels and wind conditions, there are a number of variables that may affect the use of the RUS at MSP. These include, among others: safety procedures, efficiency considerations, aircraft separation minimums, runway conditions/construction/maintenance/closures, meteorological conditions, visibility, navigational equipment maintenance, ATC work load levels, aircraft ground movements, airspace capacity, and the de-confliction of aircraft on the ground and in the airspace, aircraft emergencies, pilot requests, aircraft weight/destination and performance characteristics. The individual and cumulative synergistic effects of these variables add significant complexity to the runway use selection and configuration in place at MSP at any given time.
14 FAA RUS Review On February 20, 2015, MAC staff met with the FAA (Elaine Buckner and Marcy Woodruff) and Minneapolis representatives (Council Member Palmisano, Council Member Quincy, John Dybvig, Emily Ziring and Loren Olson) regarding the RUS. The FAA explained the process it used to review current runway use practices and possible opportunities available to increase RUS utilization at MSP going forward. During these discussions, the FAA emphasized that the RUS has been, and will remain, an important consideration in determining runway use configurations at MSP. Specifically, the FAA offered the following actions going forward to help address the communities concerns over use of the RUS: MSP ATC has reemphasized with its controllers a renewed systematic approach for analyzing shoulder-hour bank trends to maximize noise-friendly configurations as long as possible during shoulder-hour transitions into, and out of, high-demand driven daily flow configurations. The early morning arrival bank has consistently been occurring later in the morning. This offers FAA ATC the opportunity, when winds aloft and on the ground permit, to operate MSP in a mixed configuration, with arrivals on Runways 30L and 30R and departures off Runway 17, until approximately 7:20 a.m. Previously, the airport would be in a north flow around 6:45 a.m. to anticipate the earlier arrival bank. The result of utilizing the mixed configuration for a longer period during the morning is that the arrival and departure operations occur to the south and southeast of the airport, taking best advantage of the RUS without conducting head-to-head operations. The evening shoulder hours may also represent an opportunity for an earlier transition to the RUS, which is used most often from 12:00 a.m. to 5:00 a.m. Currently, the last departure bank occurs around 10:00 p.m. and consists of a larger number of departures with western destinations. Preliminary FAA analysis indicates that there are potential opportunities to depart aircraft off Runways 12L and 12R and use Runway 35 for arrivals. This configuration does create complex airspace challenges between westbound departures with the Runway 35 arrival path. The FAA plans to continue to analyze this option with a final determination on its use expected in the coming months. Special briefings have been held with ATC staff at MSP regarding best practices to support RUS configurations. The Minneapolis representatives were very supportive of the above measures. However, they requested that two additional items be included in the forthcoming NOC discussion on the status of these RUS discussions. The topics were: Evaluation of nighttime arrival number trends and the possible impacts to South Minneapolis of the RUS prioritization of a southeast flow during nighttime hours. Evaluation of the possibility of achieving a better balance between Runways 30L and 30R when departure operations are occurring to the northwest of MSP. RNAV STAR Update Area Navigation (RNAV) Standard Terminal Arrival Routes (STAR) are planned to be published on March 5, Use of the RNAV STARs at MSP is anticipated to begin on March 24, Implementation of the STARs utilizing Required Navigation Performance (RNP) is anticipated to begin on April 30, 2015.
15 On March 18, 2015, Elaine Buckner, FAA Air Traffic Manager, will be addressing the NOC to summarize the FAA s RUS evaluation and will also provide an update on the MSP RNAV STAR implementation.
16 ITEM 4 MEMORANDUM TO: MSP Noise Oversight Committee (NOC) FROM: Dana Nelson, Manager Noise, Environment and Planning SUBJECT: PRESENTATION: MSP 2035 LONG TERM COMPREHENSIVE PLAN NEIL RALSTON, MAC AIRPORT PLANNER DATE: March 4, 2015 The Metropolitan Council has adopted guidelines to integrate information pertinent to planning, developing, and operating the region s airports in a manner compatible with their surrounding environs. The process to ensure this orderly development is documented in a Long Term Comprehensive Plan (LTCP) for each airport. In recognition of the dynamic nature of the aviation industry, the plans are to be updated regularly. The current LTCP for the Minneapolis-St. Paul International Airport (MSP) was completed in July 2010, and used 2030 as its planning horizon. The next LTCP will address planning and facility development needs at MSP for the next 20 years, out to a planning horizon year of The MSP LTCP is focused on developing facilities to accommodate forecast growth in a safe and efficient manner with a high level of customer service. Proposed improvements are phased to reflect the gradual growth of demand at MSP and to reflect lead time required for detailed planning, environmental analysis, design, and implementation. The LTCP will be updated every five years, consistent with Metropolitan Council guidelines, to ensure planning activities address changes in the aviation industry, demand, and local and national economic conditions. Among the various actions necessary for the completion of the MSP 2035 LTCP are the following: An inventory of existing baseline conditions and infrastructure. A projected forecast of annual passenger counts and annual aircraft operations. Anticipated landside, terminal, and airside facility requirements to meet forecast needs. Preparation of development alternatives. Recommendation of a preferred development program. A review of environmental considerations. The current schedule for the preparation of the 2035 MSP LTCP includes presentations to the Noise Oversight Committee by Neil Ralston, MAC Airport Planner on March 18, 2015 and May 20, The final draft of the 2035 MSP LTCP is expected to be released for public review in July 2015.
17 ITEM 5 MEMORANDUM TO: MSP Noise Oversight Committee (NOC) FROM: Dana Nelson, Manager Noise, Environment and Planning SUBJECT: 2014 MSP ANNUAL NOISE CONTOUR ANALYSIS DATE: March 4, 2015 In October 2007, the Metropolitan Airports Commission (MAC) and the cities of Minneapolis, Richfield and Eagan, received judicial approval of a Consent Decree that provided settlement of the noise mitigation lawsuits filed in Among the several conditions of the Consent Decree, the MAC was required to prepare an Annual Noise Contour Analysis by March of each calendar year that reflects an assessment of actual noise generated by operations at Minneapolis-St. Paul International Airport (MSP). Section 8.1(d) of the original 2007 Noise Mitigation Consent Decree reads: By March 1 of each year, MAC shall develop and make available to the public a noise contour report using the FAA s Integrated Noise Model to reflect noise conditions from the prior calendar year, using actual MSP operations data derived from the Airport Noise and Operations Monitoring System or a functionally equivalent flight tracking and noise monitoring system ( Monitoring System ). This noise contour report shall contain, at a minimum: (1) the noise contour for the previous calendar year; (2) a grid point analysis of noise levels associated with that contour; (3) comparisons in grid point and graphic form of the differences in noise levels between the previous calendar year s contour and the 2007 DNL level; and (4) comparisons to actual and monitored noise levels from MAC s Monitoring System, consistent with previous validation analyses. MAC shall consult with the Plaintiffs during the development of the previous year contour report. In September 2013, the First Amendment to the original Consent Decree received judicial approval. The First Amendment provides terms and conditions that extend the Noise Mitigation Program out to the year 2024 and new eligibility requirements for participation in the program. Specifically, the First Amendment Section 9.4(b) states, relative to the Annual Actual Noise Contour area map for Noise Mitigation Program eligibility, that: The home is located, for a period of three consecutive years, with the first of the three years beginning no later than calendar year 2020 (i) in the actual DNL noise contour prepared by the MAC under Section 8.1(d) of this Consent Decree and (ii) within a higher noise impact mitigation area when compared to the Single-Family home s status under the noise mitigation programs for Single-Family homes provided in Sections 5.1 through 5.3 of this Consent Decree or when compared to the Multi-Family home s status under the noise mitigation programs for Multi-Family homes provided in Section 5.4 of this Consent Decree. The noise contour boundary will be based on the block intersect methodology. The MAC will offer noise mitigation under Section IX of this Consent Decree to owners of eligible Single-Family homes and Multi-Family homes in the year following the MAC s determination that a Single-Family or Multi-Family home is eligible for noise mitigation under this Section.
, have met the first or second year(s) of eligibility of the three-consecutive years of higher noise impact requirement.")
18 The 2014 MSP Annual Noise Contour Analysis has an added significance since the properties identified as having a higher DNL noise impact in 2014 than depicted in the 2007 DNL Forecast Mitigated Contours (shown in Figures 4.2 below), have met the first or second year(s) of eligibility of the three-consecutive years of higher noise impact requirement. In this second year (2014) of actual noise contour mapping as established by the terms of the First Amendment to the Consent Decree, the only residential properties that meet the mitigation eligibility criteria are located within the City of Minneapolis. There are 120 single-family units that meet the first year of eligibility within the 63 DNL contour for the 5-Decibel Reduction Package described in the Consent Decree, as amended. In addition, there are 39 single-family units that were previously eligible for the homeowner reimbursement noise mitigation program, and another 126 single-family units previously outside the program that meet the first year of eligibility in 2014 for the DNL noise contour noise mitigation package options described in the original Consent Decree, as amended. All residential homes that achieved the first year of eligibility in 2013 moved into the second consecutive year of eligibility in There are 119 single-family units within the DNL noise contour that were previously eligible for the homeowner reimbursement noise mitigation program, and another 18 single-family units previously outside of the DNL contour that meet the second consecutive year of eligibility in 2014 for the DNL noise contour noise mitigation package options described in the Consent Decree, as amended. There are 89 multi-family living units within the DNL noise contour that were previously outside the program that meet the second consecutive year of eligibility for the Multi-Family Home Mitigation Package described in the Consent Decree, as amended. Figure 4.2 from the report provided below shows the blocks in Minneapolis that have met the first and second year(s) of noise mitigation eligibility:
19 The 2014 MSP Annual Noise Contour Analysis also notes that aircraft activity at MSP decreased in 2014 compared to The Federal Aviation Administration reported 411,760 aircraft operations at MSP in 2014, which is approximately 4.6% fewer operations than occurred in The 2014 MSP Annual Noise Contour Analysis is attached and is available on the Internet at: At the March 18, 2015 NOC meeting, the MAC staff will provide a briefing of the 2014 MSP Annual Noise Contour Analysis.
20 Minneapolis-St. Paul International Airport (MSP) Annual Noise Contour Analysis Comparison of the 2014 Actual Noise Contour and the 2007 Forecast Noise Contour MAC Noise Program Office and HNTB Corporation
21 [This page is left blank intentionally] I
22 Table of Contents List of Tables... III List of Figures...IV Executive Summary...VI Chapter 1: Background Corrective Land Use Efforts at MSP to Address Airport Noise Forecast Mitigated Noise Contour Airport Noise Litigation Noise Mitigation Settlement and Annual Noise Contour Analysis Final MSP 2020 Improvements Environmental Assessment/Environmental Assessment Worksheet (EA/EAW)... 7 Chapter 2: 2014 Actual Noise Contour Actual Noise Contour Development Integrated Noise Model Aircraft Operations and Fleet Mix Runway Use Flight Tracks Atmospheric Conditions Modeled Versus Measured DNL Levels Noise Contour Impacts Chapter 3: Comparison of the 2014 Actual Noise Contour and the 2007 Forecast Noise Contour Comparison of 2014 Actual and 2007 Forecast Noise Contour Inputs Integrated Noise Model Considerations Aircraft Operations and Fleet Mix Comparison Runway Use Comparison Flight Track Considerations Atmospheric Conditions Comparison Comparative Integrated Noise Model Grid Point Analysis Contour Comparison Summary Chapter 4: 2014 Actual Noise Contour and the First Amendment to the Consent Decree First Amendment to the Noise Mitigation Consent Decree Actual Contour Noise Mitigation Impact II
23 List of Tables Table 1.1: Summary of 2007 Forecast Mitigated DNL Noise Contour Single-Family and Multi-Family Unit Counts... 3 Table 2.1: 2014 Total Operations Table 2.2: 2014 Aircraft Fleet Mix Average Daily Operations Table 2.3: 2014 Runway Use Table 2.4: 2014 Measured vs. Modeled INM DNL Values at RMT Locations Table 2.5: Summary of 2014 Actual DNL Noise Contour Single-Family and Multi-Family Unit Counts Table 3.1: Comparison of 2007 Forecast Mitigated and 2014 Actual Total Operations Table 3.2: Comparison of 2007 Forecast Mitigated Fleet Mix and 2014 Actual Fleet Mix Table 3.3: Comparison of 2007 Forecast Mitigated and 2014 Actual Runway Use Table 4.1: Summary of 2014 Actual DNL Noise Contour Single-Family Unit Counts by Block with First Year Mitigation Eligibility Status Table 4.2: Summary of 2014 Actual DNL Noise Contour Single-Family Unit Counts by Block with Second Consecutive Year Mitigation Eligibility Status Table 4.3: Summary of 2014 Actual DNL Noise Contour Multi-Family Unit Counts by Block with First Year Mitigation Eligibility Status Table 4.4: Summary of 2014 Actual DNL Noise Contour Multi-Family Unit Counts by Block with Second Consecutive Year Mitigation Eligibility Status III
24 List of Figures Figure ES-1: 2014 Actual Contours with First Amendment Mitigation... IX Figure ES-2: 2014 Actual Contours with Consecutive Years of Mitigation Eligibility City of Minneapolis... X Figure 1.1: 2007 Forecast Mitigated Contours... 5 Figure 2.1: 2014 INM Tracks Runway 30L Departures Overall Use Percentage Figure 2.2: 2014 INM Tracks Runway 30R Departures Overall Use Percentage Figure 2.3: 2014 INM Tracks Runway 4 Departures Overall Use Percentage Figure 2.4: 2014 INM Tracks Runway 12L Departures Overall Use Percentage Figure 2.5: 2014 INM Tracks Runway 12R Departures Overall Use Percentage Figure 2.6: 2014 INM Tracks Runway 22 Departures Overall Use Percentage Figure 2.7: 2014 INM Tracks Runway 17 Departures Overall Use Percentage Figure 2.8: 2014 INM Tracks Runway 35 Departures Overall Use Percentage Figure 2.9: 2014 INM Tracks Runway 12R Arrivals Overall Use Percentage Figure 2.10: 2014 INM Tracks Runway 12L Arrivals Overall Use Percentage Figure 2.11: 2014 INM Tracks Runway 22 Arrivals Overall Use Percentage Figure 2.12: 2014 INM Tracks Runway 30R Arrivals Overall Use Percentage Figure 2.13: 2014 INM Tracks Runway 30L Arrivals Overall Use Percentage Figure 2.14: 2014 INM Tracks Runway 35 Arrivals Overall Use Percentage Figure 2.15: 2014 INM Tracks Runway 4 Arrivals Overall Use Percentage Figure 2.16: 2014 INM Tracks Runway 17 Arrivals Overall Use Percentage Figure 2.17: 2014 Actual Contours Figure 2.18: 2007, 2008, 2009, 2010, 2011, 2012, 2013, and 2014 Actual Contours Figure 3.1: Decibel Levels from 2014 Actual Grid Point DNLs Figure 3.2: Decibel Levels from 2014 Actual Grid Point DNLs City of Minneapolis IV
25 Figure 3.3: Decibel Levels from 2014 Actual Grid Point DNLs City of Richfield Figure 3.4: Decibel Levels from 2014 Actual Grid Point DNLs Cities of Bloomington and Eagan Figure 3.5: Decibel Levels from 2014 Actual Grid Point DNLs Cities of Eagan, Mendota Heights and Inver Grove Heights Figure 3.6: Decibel Levels from 2007 Forecast Mitigated Grid Point DNLs Figure 3.7: Decibel Levels from 2007 Forecast Mitigated Grid Point DNLs City of Minneapolis Figure 3.8: Decibel Levels from 2007 Forecast Mitigated Grid Point DNLs City of Richfield Figure 3.9: Decibel Levels from 2007 Forecast Mitigated Grid Point DNLs Cities of Bloomington and Eagan Figure 3.10: Decibel Levels from 2007 Forecast Mitigated Grid Point DNLs Cities of Eagan, Mendota Heights and Inver Grove Heights Figure 3.11: Difference in db Level Between 2007 Forecast Mitigated and 2014 Actual Grid Point DNLs for Blocks Included in Noise Mitigation Settlement Figure 3.12: Difference in db Level Between 2007 Forecast Mitigated and 2014 Actual Grid Point DNLs for Blocks Included in Noise Mitigation Settlement City of Minneapolis Figure 3.13: Difference in db Level Between 2007 Forecast Mitigated and 2014 Actual Grid Point DNLs for Blocks Included in Noise Mitigation Settlement City of Richfield Figure 3.14: Difference in db Level Between 2007 Forecast Mitigated and 2014 Actual Grid Point DNLs for Blocks Included in Noise Mitigation Settlement Cities of Bloomington and Eagan Figure 3.15: Difference in db Level Between 2007 Forecast Mitigated and 2014 Actual Grid Point DNLs for Blocks Included in Noise Mitigation Settlement Cities of Eagan, Mendota Heights and Inver Grove Heights Figure 3.16: 2014 Actual Contours and 2007 Forecast Mitigated Contours Figure 4.1: 2014 Actual Contours with First Amendment Mitigation Figure 4.2: 2014 Actual Contours with Consecutive Years of Mitigation Eligibility City of Minneapolis V
26 Executive Summary Background The issue of noise at Minneapolis-St. Paul International Airport (MSP) includes a long history of local efforts to quantify and mitigate noise impacts in a manner responsive to concerns raised by the communities around the airport and consistent with federal policy. In 1992, the Metropolitan Airports Commission (MAC) embarked on a 14 CFR Part 150 Program at MSP, which included a noise mitigation program for single-family and multi-family residences and schools, as well as property acquisition and relocation based on mitigation eligibility defined by the 1996 forecast 65 Day-Night Average Sound Level (DNL) noise contour. When the original Part 150 Program was completed in 2006, noise mitigation had been provided to over 7,800 single-family homes, 1,327 multi-family units, 18 schools and 437 residential properties were acquired around MSP at a cost of approximately $385.6 million. In 1999 the MAC began an update to the Part 150 Program at MSP. The resulting program used 2007 forecast operations to produce a 2007 forecast noise contour (a 2005 forecast noise contour was also developed as part of this process but was ultimately not used due to the length of the planning process and associated changes in forecasting variables). One of the largest discussion items in the Part 150 Update process focused on the mitigation program the MAC would offer in the to 60 DNL noise contour area. Expansion of noise mitigation efforts beyond the federally-recognized level of 65 DNL was outlined as part of the Dual-Track Airport Planning Process (a process begun in 1989 and concluded in 1998 that examined moving MSP versus expanding it in its current location, undertaken at the direction of the Minnesota State Legislature). Through the Part 150 Update, the MAC detailed a specific mitigation package to be offered in the 64 to 60 DNL noise contour area, proposing central air-conditioning to single-family homes that did not have it, with a homeowner co-pay based on the degree of noise impact. Airport Noise Litigation and the Consent Decree The cities located around MSP expressed dissatisfaction with the Part 150 Update 64 to 60 DNL noise mitigation proposal in the context of the Dual-Track Airport Planning Process discussions. In early 2005, the Cities of Minneapolis, Eagan, and Richfield and the Minneapolis Public Housing Authority filed suit in Hennepin County District Court against the MAC on the grounds that the MAC violated environmental quality standards and the Minnesota Environmental Rights Act by failing to provide a 5-decibel noise reduction package (as was provided in the DNL noise contour) to single-family homes in the 64 to 60 DNL contours. In September 2005, plaintiffs seeking class action certification filed a separate action against the MAC alleging breach of contract claims associated with mitigation in the 64 to 60 DNL contours. In 2007, the MAC and the Cities of Minneapolis, Eagan, and Richfield and the Minneapolis Public Housing Authority entered into a Consent Decree that settled the cities and class action litigation. The 2007 Consent Decree provided the 5-decibel noise mitigation package to single-family homes in the 2007 forecast 63+ DNL noise contours and lesser noise mitigation package options to single family-homes located in the 2007 forecast 63 to 60 DNL noise contours, with a noise mitigation reimbursement option for single-family homes located between the forecast 2007 and DNL noise contours. Multi-family structures were offered a uniform package in the 2007 forecast 60+ DNL noise contours. All phases of the 2007 Consent Decree noise mitigation program have been completed at a cost of approximately $95 million. Completion of the 2007 Consent Decree increased the total number of single-family homes that have received noise mitigation around MSP to over 15,000, and multi-family units to 3,303. The total cost of the MAC s noise mitigation programs to date is over $480 million. VI
27 MSP 2020 Improvements EA/EAW In January 2013, the MAC published the Final MSP 2020 Improvements Environmental Assessment/Environmental Assessment Worksheet (EA/EAW), which reviewed the potential and cumulative environmental impacts of MSP terminal and landside developments needed through the year A new noise mitigation plan was proposed in the EA/EAW leading to an amendment to the 2007 Consent Decree. First Amendment to the 2007 Consent Decree The First Amendment to the 2007 Consent Decree establishes noise mitigation eligibility based on actual noise contours that the MAC prepares for MSP on an annual basis. For a home to be considered eligible for mitigation it must be located in the actual 60+ DNL noise contour, within a higher noise impact mitigation eligibility area when compared to its status relative to the 2007 Consent Decree noise mitigation program, for a total of three consecutive years, with the first of the three years beginning no later than The noise contour boundary is based on the block intersect methodology. Homes will be mitigated in the year following their eligibility determination. The First Amendment mitigation program eligibility assessment began with the 2013 actual noise contour. In 2014, an additional chapter was added to the 2013 Annual Noise Contour Analysis to assess the mitigation area and eligibility per the amended 2007 Consent Decree. This report marks the second consecutive year of noise mitigation eligibility analysis under the terms of the First Amendment to the 2007 Consent Decree in the context of the 2014 actual noise contour. Noise Mitigation Eligibility Status under the First Amendment to the 2007 Consent Decree Based on the 411,760 total operations at MSP in 2014, the actual 60 DNL contour is approximately 44.2 percent smaller than the 2007 forecast contour and the 65 DNL contour is approximately 51.9 percent smaller than the 2007 forecast contour. The predominant contraction in the contours from the 2007 forecast to the 2014 actual noise contour scenario is driven largely by fleet mix changes, including a 99.9 percent reduction in Modified Hushkit Stage 3 aircraft operations and a 29.3 percent reduction in total aircraft operations. However, there is a small area in South Minneapolis where the 2014 actual noise contours extend beyond the 2007 forecast noise contours establishing first, and in some cases second consecutive, year impacts in certain residential areas above their noise mitigation eligibility impact levels under the terms of the 2007 Consent Decree. This small expansion of noise impacts can largely be attributed to nighttime runway use variances between what was forecasted for 2007 and what actually occurred in 2014, particularly an increase of the nighttime arrival operations on Runway 12R. This same trend existed in 2013, although to a lesser degree. In this second year of actual noise contour mapping, as established by the terms of the First Amendment to the 2007 Consent Decree, there are a total of 285 single-family homes that meet the first-year eligibility criteria of the three consecutive year higher noise impact mitigation eligibility requirement. Of the 285 single-family homes, 39 were previously eligible for the homeowner reimbursement noise mitigation program (located between the 2007 and 2005 forecast 60 DNL contours) and another 126 homes were outside the program, under the terms of the 2007 Consent Decree. These homes are now within the 2014 actual DNL noise contour. If these homes remain within the actual DNL noise contour for three consecutive years, they will be eligible for one of two mitigation options, as detailed in Section 9.5(b) of the First Amendment to the 2007 Consent Decree. Additionally, there are 120 single-family homes previously in the DNL contour under the terms of the 2007 Consent Decree that meet the first year eligibility criteria of the three consecutive year higher noise impact mitigation eligibility requirement within the 63 DNL contour. If these homes remain within the actual 63+ DNL noise contour for three consecutive years, they will be eligible for mitigation upgrades necessary to achieve the 5-decibel noise reduction package. All single-family and multi-family units that met the first year of the three consecutive year higher noise impact mitigation eligibility requirement by virtue of the 2013 actual noise contour achieve a second year of consecutive increased noise impact with the 2014 actual noise contour. There are a total of 137 single-family homes and 89 multi-family units that meet the second consecutive year of higher noise impact. Of the 137 single-family homes, 119 homes were previously eligible for the homeowner reimbursement noise mitigation program (located between the 2007 and 2005 forecast 60 DNL contours) and another 18 homes were previously outside the program and are now within the DNL noise contour. If these single-family homes remain within the DNL VII
28 actual noise contour for another year, they will be eligible for one of two mitigation options, as detailed in Section 9.5(b) of the First Amendment to the 2007 Consent Decree. Additionally, there are 89 multi-family units which were not included in the 2007 Consent Decree noise mitigation program that are located within the 2014 actual DNL contours establishing their second consecutive year at a higher noise impact mitigation eligibility level. If these multi-family units remain within the actual DNL noise contour for one more year, they will be eligible for the Multi-Family Home Mitigation Package as defined in Section 9.6 of the First Amendment to the Consent Decree. The blocks meeting the first and second consecutive year(s) of the three consecutive year higher noise impact mitigation eligibility requirement for increased noise mitigation from the MAC are shown in Figures ES-1 and ES- 2. VIII

29 IX

30 X
31 Chapter 1 Background The issue of noise at Minneapolis-St. Paul International Airport (MSP) includes a long history of local efforts to quantify and mitigate noise impacts in a manner responsive to concerns raised by the communities around the airport and consistent with federal policy. These efforts have resulted in the conceptualization and implementation of many initiatives to reduce noise impacts around MSP. One of the most notable of these initiatives has been the sound insulation program originally implemented under 14 Code of Federal Regulations (C.F.R.) Part 150. Part 150 provides a framework for airport operators to develop a comprehensive noise plan for an airport in the form of a Noise Compatibility Program (NCP). A Part 150 NCP is comprised of two fundamental approaches to addressing noise impacts around an airport: (1) Land Use Measures, and (2) Noise Abatement Measures (operational measures to reduce noise). A key component of Part 150 program planning is the development of a base case Noise Exposure Map (NEM) and a five-year forecast NEM without (unmitigated forecast scenario) and with (forecast mitigated scenario) the recommended operational noise abatement measures. Including operational noise abatement measures is important because how an airport is operated and how aircraft procedures are executed have a direct effect on an airport s noise impact. NEMs are commonly referred to as noise contours. Forecast mitigated noise contours depict the areas that may be eligible for Land Use Measures (compatible land use plans, property acquisition, residential relocation, and sound mitigation) around an airport. Recognizing the need for increased infrastructure and the emerging importance of noise issues as operations at MSP increased, the Metropolitan Airports Commission (MAC) submitted its first MSP Part 150 Study to the Federal Aviation Administration (FAA) in October NEMs were accepted by the FAA in October 1989, and portions of the NCP were approved in April The NCP included Corrective Land Use Measures which called for the soundproofing of residences, schools and other public buildings. A 1992 update to the NCP and NEM marked the beginning of corrective mitigation measures in the forecast 1996 NEM 65 and greater Day-Night Average Sound Level (DNL) noise contours. 1.1 Corrective Land Use Efforts at MSP to Address Airport Noise From 1992 to 2006, the residential noise mitigation program was a large and visible part of the Part 150 program at MSP. The MAC designed the MSP residential noise mitigation program using FAA structural Noise Level Reduction (NLR) documentation to establish product-specific Sound Transmission Class (STC) ratings and associated NLR goals, creative bidding practices, and cooperative prioritization and funding efforts. Through innovative approaches to enhancing the program as new information and technologies became available, the MSP residential noise mitigation program quickly became a national model. Because testing and evaluation of single-family homes near MSP indicated that the majority of such homes provided an average 30 decibels (db) of exterior to interior sound attenuation, the MAC developed a 5 db package for single-family homes within the 65 DNL and greater noise contours. This package provided an average exterior-to-interior noise reduction level of 5 db, ensuring a noticeable level of reduction designed to meet the FAA s target of a 45 DNL interior noise level in each home. 1 The 5 db package offered a menu of mitigation measures that the MAC might install to achieve an average 5 db noise reduction and meet the 45 DNL interior noise level in an individual home. The menu of mitigation measures included: windows; prime doors; attic insulation; baffling of attic vents, mail slots and chimneys; and the addition of central air-conditioning. The MAC 1 FAA, Guidelines for the Sound Insulation of Residences Exposed to Aircraft Operations, October 1992, pg
32 determined which specific mitigation measures were necessary for a particular home after assessing the home s existing condition. As a result of detailed and extensive project management and quality control, the program achieved an excellent record of homeowner satisfaction. Throughout the duration of the program, when homeowners were asked if the improvements were effective at reducing aircraft noise, at least 95 percent responded yes. When asked if the modifications improved interior home comfort, at least 95 percent responded yes. In 2004, the MAC awarded the final bids for the remaining unmitigated homes in the DNL noise contour. In early 2006, the MAC completed the mitigation of an additional 165 single-family homes in the 2007 forecast mitigated 65 DNL noise contour. With the completion of the 165 single-family homes, all eligible and participating homes within the 2007 forecast mitigated 65 DNL contour have been mitigated. This represented a significant accomplishment for an industry-leading airport noise mitigation program. The program resulted in the mitigation of over 7,800 single-family homes in communities around MSP. The financial investment in the MSP Residential Sound Insulation Program was among the largest in the nation for such programs. Throughout the 14-year project ( ) several variables had an impact on the project s annual financial profile. Year-to-year variations in housing stock and material costs caused fluctuations in the unit, or per-house, costs. This, combined with variations in annual budgets as a result of challenges such as the terrorist attacks of September 11, 2001, resulted in a fluctuating rate of annual home completions. Annual average mitigation costs per single-family home ranged from a low of $17,300 in 1994 to a high of $45,000 in The MAC spent a total of approximately $229.5 million on the single-family home mitigation program during its 14-year lifespan. In addition to the single-family mitigation program, the MAC also mitigated multi-family units and schools, and engaged in property acquisition and relocation. The multi-family component of the residential noise mitigation program began in 2001, and was significantly smaller in both the number of structures mitigated and the associated costs. With completion of multi-family structures in the DNL noise contour, the MAC mitigated approximately 1,327 multi-family units at a total cost of approximately $11.1 million. There were no additional multi-family structures inside the 2007 forecast mitigated 65 DNL noise contour. All eligible and participating multifamily structures within the 2007 forecast mitigated 65 DNL noise contour have been mitigated. Also, since 1981, the MAC has mitigated 18 schools located around MSP. This total represents all of the schools located within the DNL noise contour. In response to Minnesota State Legislature s directives, the MAC also provided mitigation to certain schools located outside the DNL noise contour. The costs of insulating individual schools varied from $850,000 to $8 million. A total of approximately $52 million was spent on the school sound insulation program. In addition to the residential and school noise mitigation programs, the MAC implemented a residential property acquisition program that facilitated the relocation of sensitive land uses, such as residential buildings, in noise impact areas. The intent of the residential acquisition program was to address impacted properties in the DNL noise contour, with the property owners and the city in which the respective property resided agreeing that acquisition was the desirable means of mitigating the homes. As a result, the MAC acquired approximately 437 residential properties. In total, the MAC expended approximately $93.0 million on the residential property acquisition program. 2
33 Forecast Mitigated Noise Contour In late 1998, the MAC authorized an update to the Part 150 program at MSP. The update process began in 1999 with the development of noise contours and noise abatement and land use measures. The MAC published a draft Part 150 Update document in October 2000 and submitted the study, including a 2005 forecast NEM and revised NCP, to the FAA for review. In May 2002, after further consideration of the events of September 11, 2001, the MAC withdrew the study to update the forecast and associated noise contours. The forecast update process began in February This effort focused on updating the base case year from a 2000 scenario to a 2002 base case, and updating the forecast year from 2005 to The purpose of the forecast update was to ensure that the noise contours considered the impacts of the events of September 11, 2001 and ongoing changes in the MSP aircraft fleet. In addition to updating the forecast, the MAC and the MSP Noise Oversight Committee (NOC) conducted a review of the Integrated Noise Model (INM) input methodology and data to ensure continued consensus with the previous contour (i.e., November 2001) development process. On November 17, 2003, the MAC approved the revised forecast and fleet mix numbers and INM input methodology and data for use in developing the 2002 and 2007 NEMs. In March 2004, the MAC revised the forecast to incorporate certain corrections in general aviation numbers and to reflect Northwest Airlines announcement that it would resume service of five RJ85 aircraft that had been taken out of service previously. The 2004 Part 150 Update resulted in a comprehensive Noise Compatibility Program (NCP) recommendation. In addition to several land use measures around MSP, the NCP included provisions for a number of operational Noise Abatement (NA) Measures. The aircraft and airport operational noise abatement initiatives in the 2004 Part 150 Update focused on aircraft operation procedures, runway use, departure and arrival flight tracks, voluntary operational agreements with the airlines, and provisions for further evaluation of technology. The MAC has implemented the operational NA Measures outlined in the November 2004 Part 150 Update NCP that are reflected in the 2007 forecast mitigated noise contour included in the 2004 MSP Part 150 Update. Based on the estimate of 582,366 total operations in the 2007 forecast mitigated scenario, approximately 7,234.4 acres are in the 65 DNL noise contour and approximately 15,708.3 acres are in the 60 DNL noise contour. Table 1.1 contains the count of single-family (one to three units per structure) and multi-family (more than three units per structure) dwelling units within the 2007 forecast mitigated noise contours. The counts are based on the block intersect methodology, where all structures on a block that is within or touched by the noise contour are counted. The count of completed units reflects all units that have received mitigation prior to February Table 1.1 MINNEAPOLIS-ST.PAUL INTERNATIONAL AIRPORT Summary of 2007 Forecast Mitigated DNL Noise Contour Single-Family and Multi-Family Unit Counts (Block Intersect Implementation Method, Completed Reflect All Units Completed Prior to February 2015) Dwelling Units Within DNL (db) Interval City Count Single-Family Multi-Family Total Total Minneapolis Completed Bloomington Completed Richfield Completed Eagan Completed Mendota Heights Completed All Cities Completed *Units that declined mitigation or were determined to be ineligible for participation in the current program are not included in the table. Source: MAC analysis,
34 All eligible and participating homes within the 2007 forecast mitigated 60 DNL noise contour have been mitigated. As a result of updated parcel information the MAC obtained from Metro GIS in January 2015, the unit counts in Table 1.1 differ from previous figures published for the 2007 forecast mitigated noise contours in the November 2004 Part 150 Update document. In 2012, the home mitigation phases within the DNL contour were completed. Approximately 1,222 units (310 single-family and 912 multi-family units) did not receive mitigation because either the homeowner declined or they were determined to be ineligible. A depiction of the 2007 forecast mitigated noise contours are provided in Figure Airport Noise Litigation One of the largest discussion items in the Part 150 Update process that began in 1999 focused on the mitigation program that the MAC would offer in the 64 to 60 DNL noise contour area. The FAA recognizes sensitive land uses, such as residential land uses eligible for noise mitigation under Part 150, only within the 65 and greater DNL noise contours. However, as part of the Dual-Track Airport Planning Process (a process that examined moving MSP versus expanding it in its current location, undertaken at the direction of the Minnesota State Legislature), the MAC made a policy decision to provide some level of noise mitigation out to the 60 DNL noise contour at MSP. During the Dual-Track Airport Planning Process, an MSP Noise Mitigation Committee was developed and tasked with proposing a noise mitigation plan to be considered in conjunction with the expansion of MSP at its present location. Throughout the Part 150 Update process, the intent of the MSP Noise Mitigation Committee s recommendation regarding mitigation outside the 65 DNL contour was a topic of detailed discussion and debate. During the course of the Part 150 Update process the MAC formulated a number of mitigation proposals, culminating in a final MAC position on mitigation outside the 65 DNL contour. In the November 2004 Part 150 Update, the MAC s recommendation for mitigation in the 64 to 60 DNL contours called for providing central air-conditioning to singlefamily homes that did not have it, with a homeowner co-pay based on the degree of noise impact. The MAC based eligibility for the mitigation proposal on the 2007 forecast mitigated noise contour using the block intersect methodology. The cities located around MSP expressed dissatisfaction with the MAC proposal, asserting that the MSP Noise Mitigation Committee recommended that the 5 db package was to be expanded to all properties in the 64 to 60 DNL noise contours. The MAC countered that the MSP Noise Mitigation Committee s recommendations did not specify the mitigation package elements to be offered in the 64 to 60 DNL noise contour area and that, because homes in Minnesota have higher than the national average pre-existing noise attenuation characteristics, the full 5 db package was not necessary outside the 65 DNL contour. In early 2005, the Cities of Minneapolis, Eagan, and Richfield filed suit in Hennepin County District Court claiming, among other things, the MAC violated environmental quality standards and the Minnesota Environmental Rights Act (MERA) by failing to provide a 5 db package to single-family homes in the 64 to 60 DNL contours. In September 2005, plaintiffs seeking class action certification filed a separate action against the MAC alleging breach of contract claims associated with mitigation in the 64 to 60 DNL contours. In January 2007, Hennepin County District Judge Stephen Aldrich granted the cities partial summary judgment. The court found, among other things, that the MAC, by virtue of implementing the 5 db package, created an environmental standard that the MAC violated by recommending different mitigation in the 64 to 60 DNL noise contour area. In February 2007, the court held a trial on the cities MERA and mandamus claims. Before the court entered final judgment post-trial, however, the parties negotiated a global settlement resolving the cities case and the class action suit. 4

35 5
36 1.4 Noise Mitigation Settlement and Annual Noise Contour Analysis On October 19, 2007, Judge Stephen Aldrich approved a Consent Decree entered into by the MAC and the Cities of Minneapolis, Eagan, and Richfield and the Minneapolis Public Housing Authority that settled the cities litigation. The Consent Decree provided that it became effective only if: (1) the FAA advised the MAC in writing by November 15, 2007 that the Decree was an appropriate use of airport revenue and was consistent with the MAC s federal grant obligations; and (2) that the court approved a settlement in the class action case by January 17, Both of these conditions were satisfied, and in 2008 the MAC began implementing single-family and multifamily mitigation out to the DNL noise contours and mitigation reimbursement funds out to the DNL noise contours, as the Consent Decree required. Under the Decree, mitigation activities would vary based on noise contour. Homes in the most noise-impacted contours were eligible for more extensive mitigation than those in less-impacted areas. The 2007 Consent Decree provided that approximately 457 homes in the to 63 DNL forecast noise contours were eligible to receive the same level of noise mitigation that the MAC provided in the DNL and greater contours. The to 63 DNL noise contour mitigation program was designed to achieve 5 db of noise reduction on average, with mitigation measures that might include the following, depending upon the home s existing condition: central air-conditioning; exterior and storm window repair or replacement; prime door and storm door repair or replacement; wall and attic insulation; baffling of roof vents and chimney treatment. The Decree required that the MAC complete construction of mitigation in the and 63 DNL noise contours by December 31, The MAC has completed that task. In addition, under the Decree, owners of the approximately 5,428 single-family homes in the to 60 DNL noise contours were eligible for one of two mitigation packages: 1) homes that did not have central air-conditioning as of September 1, 2007 would receive it and up to $4,000 (including installation costs) in other noise mitigation products and services they could choose from a menu provided by the MAC; or 2) owners of homes that already had central air-conditioning installed as of September 1, 2007 or who chose not to receive central air-conditioning were eligible for up to $14,000 (including installation costs) in noise mitigation products and services they could choose from a menu provided by the MAC. The mitigation menu included acoustical modifications such as: exterior and storm window repair or replacement; prime door and storm door repair or replacement; wall and attic insulation; and baffling of roof vents and chimney treatment. The Decree required that the MAC complete construction of mitigation in the to 60 DNL contours by December 1, The MAC has completed that task. According to the provisions in the Consent Decree, single-family homes in the and 63 DNL contours and in the to 60 DNL contours whose earlier owners opted out of the previously-completed MAC noise mitigation program for the and greater DNL contours, but that had new owners on September 1, 2007, were eligible to opt in and receive noise mitigation. If the total cost to the MAC of the opt-in mitigation is less than $7 million, any remaining funds were used to reimburse owners of single-family homes between the 2005 mitigated 60 DNL contour and the 2007 forecast mitigated 60 DNL contour for purchase and installation of products included on a menu provided by the MAC. The amount each homeowner received was determined by subtracting dollars spent for the opt-in program from the total $7 million budget, and then by dividing the remainder of funds among the total number of single-family homes within the DNL and DNL contours. The MAC issued reimbursements and completed reimbursement claim payments in September The total cost of the opt-in mitigation and the 2005 mitigated 60 DNL contour reimbursement mitigation program was capped at $7 million. By December 2012, the MAC completed the 5 db reduction noise mitigation program for all of the single-family homes in the DNL contours. (404 homes participated in the program.) In addition, the MAC completed 6
37 all of the single-family homes in the DNL contours in December (5,055 homes participated in the program.) A total of 1,773 single-family homes between the 2005 mitigated 60 DNL contour and the 2007 forecast mitigated 60 DNL contour were provided reimbursements for approved noise mitigation enhancements and the program was completed. With regard to the multi-family noise mitigation program, the MAC installed acoustical covers on the air-conditioners or completed the installation of new air-conditioning units in 1,976 living units marking completion of that program in The total cost to implement mitigation under the original Consent Decree was approximately $95 million, (which is inclusive of the $7 million for opt-in mitigation and single-family mitigation reimbursement). With the final MAC payments in September 2014 for noise mitigation reimbursements, all of the phases of the noise mitigation program required under the original Consent Decree have been completed. In addition to the MAC s mitigation obligations, the Consent Decree releases legal claims that the cities and homeowners have against the MAC in exchange for the actions that the MAC would perform under the Decree. (Consent Decree Section 8.1, p. 38). The releases cease to be effective for a certain location if the average annual aircraft noise level in DNL at that location is at or above DNL 60 and is at least 2 db in DNL higher than the DNL level for that location in the 2007 mitigated noise contours. The MAC determines future DNL values by using the FAA s Integrated Noise Model and actual MSP operations data to generate a noise contour reflecting noise conditions at MSP for the prior calendar year. (Consent Decree Section 8.1(d), pp ) The MAC must develop a noise contour reflecting noise conditions for the prior calendar year by March 1 of each year. The MAC has prepared this report to satisfy Section 8.1(d) of the Consent Decree. MAC staff and representatives from the Cities of Minneapolis, Eagan, and Richfield met on February 11 and 20, 2008 to discuss and finalize the annual report format. The actual contour that the MAC must develop under Section 8.1(d) of the Consent Decree is relevant to the release provisions in Section 8.1 as well as the determination of mitigation eligibility as defined by an amendment to the Consent Decree, described in Chapter 4 of this report. 1.5 Final MSP 2020 Improvements Environmental Assessment/Environmental Assessment Worksheet (EA/EAW) In January 2013, the MAC published the Final MSP 2020 Improvements Environmental Assessment/Environmental Assessment Worksheet (EA/EAW), which reviewed the potential and cumulative environmental impacts of MSP terminal and landside developments needed through the year Of the several development alternatives examined, Alternative 2 Airlines Relocate was determined to be the Preferred Alternative. This alternative outlined improvements needed to 2020, presuming that the non- SkyTeam airlines currently located in Terminal 1-Lindbergh are relocated to Terminal 2-Humphrey. SkyTeam is an alliance of 20 member airlines, including Delta Air Lines. This development was supported in recognition of the fact that MSP s two-terminal system could be utilized more efficiently by relocating all airlines other than the SkyTeam airlines to Terminal 2-Humphrey and developing terminal and land side infrastructure accordingly to accommodate future forecasted demand. This would relieve capacity constraints at Terminal 1-Lindbergh while better balancing the mix of passengers and landside capacity at the two terminals. As is detailed in the EA/EAW, the Federal Aviation Administration s (FAA) Finding of No Significant Impact/Record of Decision (FONSI/ROD) and summarized in the MAC s related Findings of Fact, Conclusions of Law, and Order, the Preferred Alternative scenario does not have the potential for significant environmental effects. The forecasted noise contours around MSP are driven by natural traffic growth that is anticipated to occur with or without implementation of the 2020 Improvements. However, given past noise mitigation activities surrounding MSP, the terms of the 2007 Consent Decree in City of Minneapolis, et. al. v. Metropolitan Airports Commission, and local land use compatibility guidelines defined by the Metropolitan Council, many of the public comments on the EA/EAW focused on future noise mitigation efforts. 7
38 Additionally, the anticipated completion of the Consent Decree noise mitigation program in 2014, and the possible implementation of Performance-Based Navigation (PBN) procedures by the FAA at MSP contemplated at the time of the EA/EAW comment period, raised community interest regarding future of noise mitigation at MSP. In response, MAC staff, in consultation with the MSP Noise Oversight Committee (NOC), began the process of developing a noise mitigation plan to be included in the EA/EAW. The resulting recommended noise mitigation program established that noise mitigation program eligibility be based upon actual noise contours that the MAC would prepare for MSP on an annual basis. To be eligible for noise mitigation, a home would need to be located for three consecutive years in a higher noise mitigation impact area when compared to the home s status under the terms of the 2007 Consent Decree. The Final MSP 2020 Improvements EA/EAW detailed the following mitigation program elements: Mitigation eligibility would be assessed annually based on the actual noise contours for the previous year. The annual mitigation assessment would begin with the actual noise contour for the year in which the FAA FONSI/ROD for the EA/EAW was issued. For a home to be considered eligible for mitigation it must be located in the actual 60+ DNL noise contour, within a higher noise impact mitigation area when compared to its status relative to the original Consent Decree noise mitigation program, for a total of three consecutive years, with the first of the three years beginning no later than The noise contour boundary would be based on the block intersect methodology. Homes would be mitigated in the year following their eligibility determination. On January 7, 2013, the FAA published the Final MSP 2020 Improvements EA/EAW and the Draft Finding of No Significant Impact/Record of Decision (FONSI/ROD), which included the following position regarding the proposed noise mitigation program: The FAA is reviewing MAC's proposal for noise mitigation of homes for consistency with the 1999 FAA Policy and Procedures concerning the use of airport revenue and other applicable policy guidance. During the public comment period on the FAA s Draft FONSI/ROD many communities submitted comments urging the FAA to approve the MAC s revised noise mitigation proposal. On March 5, 2013, the FAA approved the FONSI/ROD for the Final MSP 2020 Improvements EA/EAW. Specifically, on page 15 of the approved FONSI/ROD, the FAA stated that noise mitigation would not be a condition of FAA approval of the MSP 2020 Improvements project because [n]o areas of sensitive land uses would experience a 1.5 db or greater increase in the 65 DNL noise contour when comparing the No Action Alternative for 2020 and 2025 with the Proposed Action [Preferred Alternative Airlines Relocate scenario] for the respective years. However, the FAA included a letter dated March 5, 2013, as Attachment D to the FONSI/ROD that addresses the conditions under which airport revenue may be used for off-airport noise mitigation. In that letter, the FAA stated: As a matter of general principle mitigation measures imposed by a state court as part of a consent decree are eligible for use of airport revenue. Conceptually MAC could use airport revenues if it were to amend the 2007 consent decree to include the proposed mitigation. Based on the FAA guidance, the MAC initiated discussions with the other parties to the Consent Decree (Cities of Minneapolis, Richfield and Eagan and the Minneapolis Public Housing Authority) to begin the amendment process. Additionally, at the March 20, 2013, NOC meeting, the Committee was updated on the progress of this issue and voted unanimously, supporting the following position: NOC supports the noise mitigation program as detailed in the final EA/EAW in principal and supports follow-up negotiations between the parties to the Consent Decree to establish mutually agreeable terms 8
39 for the modification of the Consent Decree consistent with the March 5 th FAA letter in Appendix D of the FONSI ROD, for consideration by the Court. This report was updated to provide maps analyzing changes that occur in noise mitigation eligibility as compared to the 2007 Consent Decree, and associated trends relative to consecutive yearly impacts. This information is detailed in Chapter 4. 9
40 Chapter Actual Noise Contour As discussed previously, Section 8.1(d) of the Consent Decree requires the MAC to prepare, by March 1 of each year, an actual noise contour reflecting the noise conditions around MSP for the prior calendar year. This chapter provides detailed information on the 2014 actual noise contour at MSP Actual Noise Contour Development Integrated Noise Model The FAA-established mechanism for quantifying airport noise impacts is the Integrated Noise Model (INM). The availability of federal or airport-generated funds for the purpose of noise mitigation efforts is contingent upon the development of a Noise Exposure Map (DNL noise contours) in a manner that is consistent with the federal criteria (i.e., INM and DNL). The INM is used to assess the noise impact of aircraft operations. The INM uses input files consisting of information relative to runway use, flight track use, aircraft fleet mix, aircraft performance and thrust settings, topography information, and atmospheric conditions to generate a Noise Exposure Map. The DNL metric adds a 10-decibel penalty to aircraft operations that occur between the hours of 10 p.m. and 7 a.m. to account for relatively low nighttime ambient noise levels and the fact that most people are asleep during this time. The INM model generates contours that depict an annualized average day of aircraft noise impacts. The DNL contours generated are the focal point of any noise mitigation measures and residential parcel eligibility described in the terms of the First Amendment to the Consent Decree. Quantifying aircraft-specific noise characteristics in INM is accomplished through the use of a comprehensive noise database that has been developed under the auspices of Federal Aviation Regulation (FAR) Part 36. As part of the airworthiness certification process, aircraft manufacturers are required to subject aircraft to a battery of noise tests. Through the use of federally adopted and endorsed algorithms, this aircraft-specific noise information is used in the generation of INM DNL contours. Justification for such an approach is rooted in national standardization of noise quantification at airports. The FAA Office of Environment and Energy developed the INM. Since 1978, the INM has been the FAA's standard tool for determining the predicted noise impact in the vicinity of airports. The INM is designed to estimate long-term average effects using average annual input conditions. The current version of INM, 7.0d, was released in May 2013, and was used to develop the 2014 actual noise contour. The 7.0d version update includes software and modeling corrections and a number of database updates. The MAC contracted with an aviation consulting group, HNTB Corporation, to provide INM data processing used in the preparation of the 2014 actual noise contour Aircraft Operations and Fleet Mix The past 14 years have presented many challenges to the aviation industry. From a local perspective, operational levels and the aircraft fleet mix at MSP have been subject to effects from the events of September 11, 2001, high fuel prices, a flurry of bankruptcy filings by several legacy airlines including the former Northwest Airlines, and an economic recession. Additionally, overall market forces appear to be favoring consolidation, as indicated by major airline acquisitions and mergers, beginning with Delta Air Lines acquisition of Northwest Airlines in 2008, followed by United Airlines acquisition of Continental Airlines in 2012, the merger of American Airlines and US Airways in 2013 and the merger of Southwest Airlines and AirTran in These developments have had profound effects 10
41 on airline and airport operations. For example, the actual 2014 operational level at MSP is below the operational level documented at the airport over 22 years ago. The MAC derived MSP operations numbers for this study from the MAC s Noise and Operations Monitoring System (MACNOMS) data. The MACNOMS total operations number was 0.7 percent lower than the FAA Operations Network (OPSNET) number. To rectify the numbers, the MAC adjusted the MACNOMS data upward to equal the total 2014 FAA OPSNET number. Table 2.1 provides the total number of 2014 aircraft operations at MSP by operational category. The 2014 total operations number of 411,760 is down from the 2013 number of 431,573 (4.6 percent decrease). Considering the multi-faceted nature of the variables that are presently impacting the operational level at MSP, forecasting long-term operational implications is complex. All signs, however, in the near-term Table 2.1 seem to point to a fundamental change in the MINNEAPOLIS-ST. PAUL INTERNATIONAL AIRPORT nature of airline operations at MSP, especially 2014 Total Operations in the type of aircraft flown by all airlines and in Operations Category 2014 Operations particular by Delta Air Lines. The use of larger Scheduled Passenger aircraft and the elimination of DC-9 operations 375,072 Air Carrier (a) by Delta Air Lines in January 2014 are examples. The use of newer, larger, and quieter manufactured Stage 3 aircraft is on the rise. Some examples at MSP of these newer aircraft are the Airbus A320/319, CRJ-900 Regional Jets, Boeing B /400, Boeing B /800, and Boeing Cargo 12,199 Charter 190 GA (b) 21,862 Military 2,437 TOTAL 411,760 (a) Includes both air carrier and regional carrier operations (b) Includes both GA and non-scheduled air taxi operations Source: Actual year-to-date 2014 MACNOMS data adjusted to match FAA OPSNET data (to account for unavailable MACNOMS operations data). When comparing the DC9 hushkitted aircraft to the Airbus A319, 15 A319 operations would be required to generate the same noise impact as one DC9 operation. The Airbus A319 aircraft represents newer technology engine noise emission levels compared to the DC9 aircraft. Table 2.2 provides a breakdown of the 2014 aircraft fleet mix at MSP. The average daily number of Modified ( hushkitted ) Stage 3 aircraft operations was down in 2014 to 0.1 from 0.2 in In 2014, the average daily number of total nighttime operations was 95.3, up from the 95.0 average daily nighttime operations in Overall, the 2014 total average daily operations number of 1,128.1 is down by 4.6 percent from the 1,182.4 average daily operations in
42 Table 2.2 MINNEAPOLIS-ST. PAUL INTERNATIONAL AIRPORT 2014 Aircraft Fleet Mix Average Daily Operations Group Aircraft Type Day Night Total Manufactured/Re-engined Stage 3 Jet B PW RR CF JT LR A R A A A A A A A A AN BD BD BEC CL CLREGJ CNA CNA CNA525C CNA CNA CNA55B CNA560E CNA560U CNA560XL CNA CNA CNA CRJ CRJ D328J DC EMB EMB EMB14L
43 Table 2.2 MINNEAPOLIS-ST. PAUL INTERNATIONAL AIRPORT 2014 Aircraft Fleet Mix Average Daily Operations Group Aircraft Type Day Night Total EMB Manufactured/Re-engined Stage 3 Jet EMB (cont d) EMB F FAL FAL20A FAL FAL G G GIV GV HK HS HS IA IA LEAR LEAR LEAR LEAR LEAR MD11GE MD11PW MD MD MD MD MD MD MD R Total ,088.8 Modified ( Hushkitted ) Stage 3 Jet 727EM N DC93LW DC95HW DC9Q Total Microjet CNA ECLIPSE Total Stage 2 Less than 75,000 lb. MTOW FAL GII GULF LEAR SABR Total Propeller 1900D AC ATR ATR BAEJ BAEJ BEC BEC
44 Table 2.2 MINNEAPOLIS-ST. PAUL INTERNATIONAL AIRPORT 2014 Aircraft Fleet Mix Average Daily Operations Group Aircraft Type Day Night Total Propeller (cont d) BEC BEC30B BEC BEC BEC BEC BEC BEC BEC BEC BEC9F BECM CNA CNA CNA CNA CNA CNA CNA CNA CNA CNA CNA CNA CNA CNA CNA CNA CNA DA DHC EMB GASEPV M20J MU P PA23AZ PA PA28AR PA28DK PA PA31T PA32LA PA32SG PA PA PA PA PA PC RWCM RWCM SAAB SAMER SAMER SD
45 Table 2.2 MINNEAPOLIS-ST. PAUL INTERNATIONAL AIRPORT 2014 Aircraft Fleet Mix Average Daily Operations Group Aircraft Type Day Night Total Propeller (cont d) SD SF SR STBM TED Total Military C-130E F HAWK KC T Total Helicopter B206L B R R S S SA355F Total Grand Total 1, ,128.1 Note: Totals may differ due to rounding. Source: MAC-provided INM Input Data, HNTB Runway Use FAA control of runway use throughout the year for arrival and departure operations at MSP has a notable effect on the noise impact around the airport. The number of people and dwellings impacted by noise is a direct result of the number of operations on a given runway and the land uses off the end of the runway. Historically, prior to the opening of Runway 17/35, arrival and departure operations occurred on the parallel runways at MSP (12L/30R and 12R/30L) in a manner that resulted in approximately 50 percent of the arrival and departure operations occurring to the northwest over South Minneapolis and 50 percent to the southeast over Mendota Heights and Eagan. As a result of the dense residential land uses to the northwest and the predominantly industrial/commercial land uses to the southeast of MSP, focusing departure operations to the southeast has long been the preferred operational configuration from a noise reduction perspective. Since the introduction of Runway 17/35 at MSP in 2005, another opportunity exists to route aircraft over an unpopulated area the Minnesota River Valley. With use of the Runway 17 Departure Procedure, westbound departure operations are routed such that they avoid close-in residential areas southwest of Runway 17. Thus, use of Runway 17 for departure operations is the second preferred operational configuration (after Runways 12L and 12R) for noise reduction purposes. 15
46 Table 2.3 provides the runway use percentages for From 2013 to 2014 arrival operation percentages decreased on Runways 30R and 35 and increased on Runways 30L, 12L and 12R. There were no changes in the arrival operation percentages on Runways 4, 17 and 22. The most notable changes in total arrival runway use from 2013 to 2014 were a one percent increase (from 19.4 percent to 20.4 percent) in Runway 12R arrival operations and a one percent decrease (from 18.2 percent to 17.2 percent) in Runway 35 arrival operations. The most notable change in arrival runway use during the nighttime hours was on Runway 30R, where operations increased from 20.7 percent in 2013 to 21.6 percent in Departure operations increased on Runways 4, 12R, 12L, 17 and 30L and decreased on Runway 30R from 2013 to There were no changes in departure operation percentages on Runways 22 and 35. The most notable change in total departure runway use from 2013 to 2014 was a decrease (from 26.0 percent to 23.9 percent) in Runway 30R departure operations. The most notable change in departure runway use during the nighttime hours was on Runway 30L, where operations increased from 23.1 percent in 2013 to 27.8 percent in Flight Tracks The INM departure and arrival flight track locations used to develop the 2014 actual noise contour were identical to those used for the 2013 actual noise contour. These flight tracks differ from those used to develop the 2007 forecast mitigated noise contour due to enhanced modeling methods and improved technologies. Sub-tracks were also added to each of the backbone tracks. The INM s standard distribution was used in distributing the flights to the sub-tracks. The same methodology as in previous annual reports was used to assign 2014 radar data to the INM flight tracks. The radar-to-inm flight track correlation process employs a best-fit analysis of the radar flight track data based on linear trends. This approach provides the ability to match each radar flight track directly to the appropriate INM track. Figures 2.1 to 2.16 provide the updated backbone INM departure and arrival flight track and the use information used to develop the 2014 actual noise contour Atmospheric Conditions Table 2.3 MINNEAPOLIS-ST. PAUL INTERNATIONAL AIRPORT 2014 Runway Use Operation Runway Day Night Total 4 0.0% 0.1% 0.0% 12L 19.5% 14.3% 19.0% 12R 19.7% 26.7% 20.4% % 0.0% 0.0% Arrivals % 0.0% 0.0% 30L 19.0% 35.5% 20.6% 30R 22.9% 21.6% 22.8% % 1.9% 17.2% Total 100.0% 100.0% 100.0% 4 0.1% 0.3% 0.1% 12L 13.0% 14.4% 13.1% 12R 4.9% 28.3% 6.6% % 15.8% 23.4% Departures % 0.0% 0.0% 30L 33.2% 27.8% 32.8% 30R 24.7% 13.4% 23.9% % 0.0% 0.0% Total 100.0% 100.0% 100.0% Overall 4 0.1% 0.2% 0.1% 12L 16.2% 14.3% 16.0% 12R 12.2% 27.4% 13.5% % 6.7% 11.7% % 0.0% 0.0% 30L 26.2% 32.2% 26.7% 30R 23.8% 18.1% 23.3% % 1.1% 8.6% Total 100.0% 100.0% 100.0% Note: Totals may not add up to 100% due to rounding. Source: MAC-provided INM Input Data, HNTB 2015 The MAC gathered atmospheric data for the 2014 actual noise contour from the Minnesota State Climatology Office. The 2014 annual average temperature of 43.6 degrees Fahrenheit and 2014 average annual wind speed of 8.3 knots were used in the INM modeling process. The 2014 average annual pressure of inches of Mercury and a 2014 annual average relative humidity of percent were also used. 16

47 17

48 18

49 19

50 20

51 21
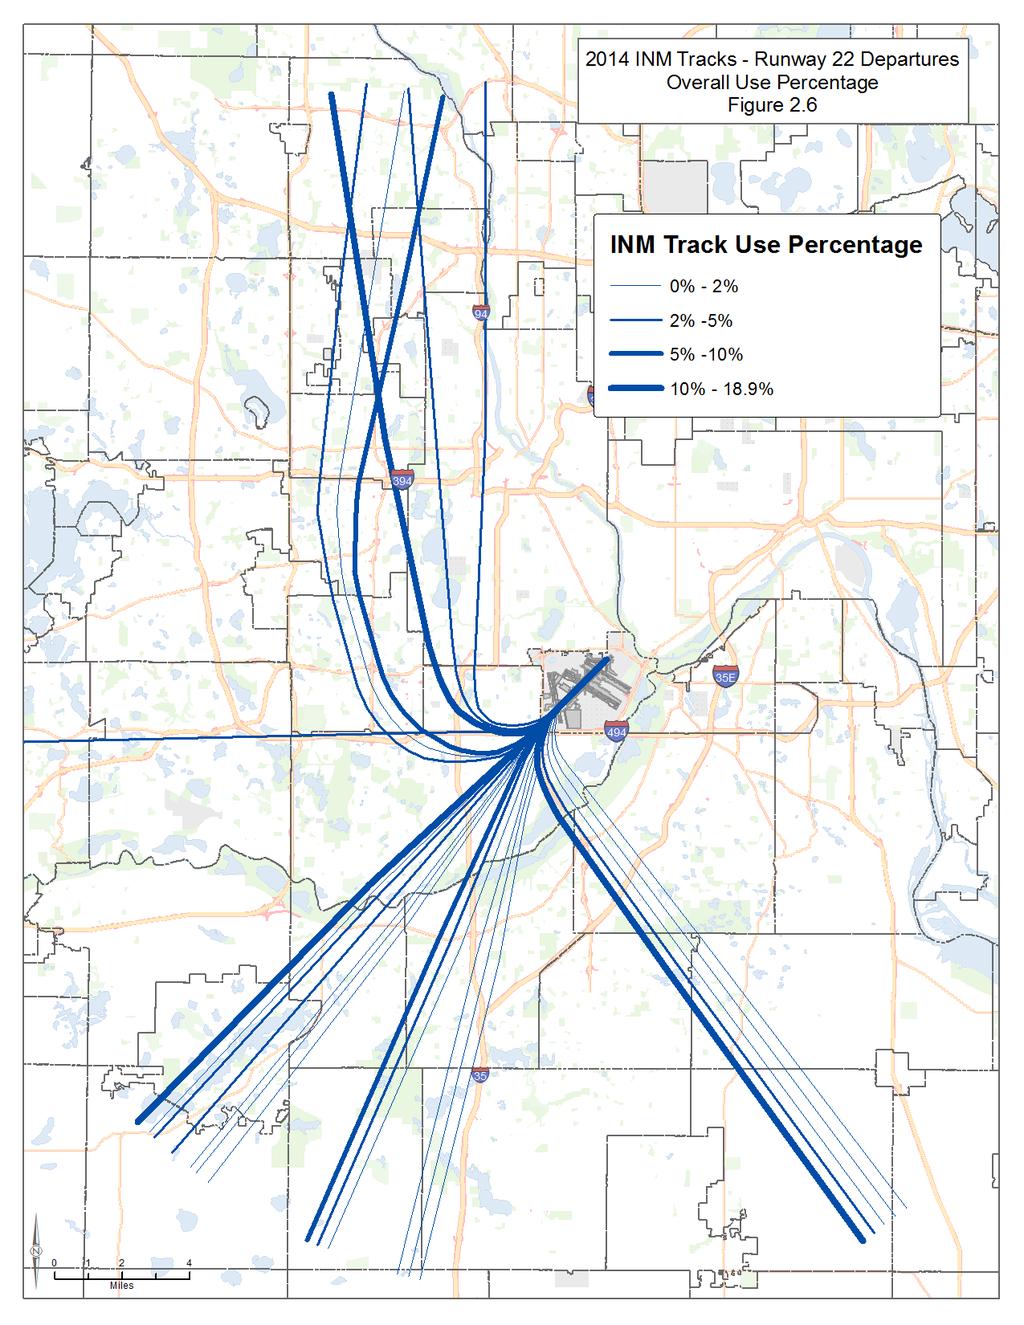
52 22

53 23

54 24

55 25

56 26

57 27

58 28

59 29

60 30

61 31

62 32
63 Modeled Versus Measured DNL Levels As part of the 2014 actual noise contour development process, an analysis was conducted by the MAC to compare the INM-developed 2014 DNL noise contours to actual measured aircraft noise levels at the 39 MAC Noise and Operations Monitoring System (MACNOMS) Remote Monitoring Towers (RMTs) around MSP. An INM grid point analysis determined the model s predicted 2014 DNL noise levels at each of the RMT locations (determined in the INM by the latitude and longitude coordinates of each RMT). Table 2.4 provides a comparison of the INM grid point analysis at each MACNOMS RMT site, based on the 2014 actual noise contour as produced with the INM, and the actual MACNOMS monitored aircraft DNLs at those locations in The average absolute difference between the modeled and measured DNLs was 2.2 db (the 2013 average absolute difference was 2.3 db). The median difference was 1.5 db (the 2013 median difference was 1.7 db). There were 10 MACNOMS RMTs that reported slightly higher DNL levels than the INM model generated. The MAC believes that this is due in part to the inclusive approach MAC staff has taken in tuning MACNOMS noise-to-track matching parameters. This conservative approach, along with the increasing number of quieter jets operating at the airport, results in increased instances of community-driven noise events being attributed to quieter aircraft operating at further distances from the monitoring location. The use of absolute values provides a perspective of total difference between the INM modeled values and the measured DNL values provided by MACNOMS in The median is considered the most reliable indicator of correlation when considering the data variability across modeled and monitored data. Overall, the small variation between the actual MACNOMS monitored aircraft noise levels and the INM modeled noise levels provides additional external system verification that the INM is providing an accurate assessment of the actual aircraft noise impacts around MSP. Table 2.4 MINNEAPOLIS-ST. PAUL INTERNATIONAL AIRPORT 2014 Measured vs. Modeled INM DNL Values at RMT Locations RMT 2014 Annual Measured DNL 2014 Modeled Difference (Modeled minus Measured) Site (a) DNL Sign Absolute Average 2.2 Median 1.5 Notes: All units in db DNL (a) computed from daily DNLs SOURCE: MAC RMT data and HNTB INM,
64 Noise Contour Impacts Based on the 411,760 total operations in 2014, approximately 3,478.9 acres are in the 65 DNL noise contour (a decrease of 25.0 acres from the 2013 actual noise contour) and approximately 8,758.4 acres are in the 60 DNL noise contour (an addition of 14.3 acres from the 2013 actual noise contour). Table 2.5 contains the count of single-family (one to three units per structure) and multi-family (more than three units per structure) dwelling units in the 2014 actual noise contours. The MAC based the counts on the block intersect methodology where all structures on a block that are within or touched by the noise contour are counted. Table 2.5 MINNEAPOLIS-ST.PAUL INTERNATIONAL AIRPORT Summary of 2014 Actual DNL Noise Contour Single-Family and Multi-Family Unit Counts (Block Intersect Implementation Method, Completed Reflect All Units Completed Prior to February 2015) Dwelling Units Within DNL (db) Interval City Count Single-Family Multi-Family Total Total Minneapolis Completed 5,668 1, , Additional Total 5,970 1, , Bloomington Completed Additional Total Richfield Completed Additional Total Eagan Completed Additional Total Mendota Heights Completed Additional Total All Cities Completed 6,414 1, ,445 1, ,356 Additional Total 6,716 1, ,747 1, ,445 *Units that declined mitigation or were determined to be ineligible for participation in the current program are not included in the table. Source: HNTB provided INM contours, MAC analysis, 2015 The 2014 count of residential units within the actual 60 DNL noise contour that have not received noise mitigation around MSP is 391, an increase of 73 percent from the total of 226 based on the 2013 actual noise contours. The increase is due, in large part, to an increase in nighttime operations in 2014, particularly nighttime arrival operations on Runway 12R. All homes within the 2014 actual 65 DNL contour have received the 5 db noise reduction mitigation package. A depiction of the 2014 actual noise contour is provided in Figure The 2007, 2008, 2009, 2010, 2011, 2012, 2013 and 2014 actual noise contours are provided in Figure The 2014 actual 65 DNL noise contour is 0.7 percent smaller than the 2013 actual 65 DNL noise contour and the 2014 actual 60 DNL noise contour is 0.2 percent larger than the 2013 actual 60 DNL noise contour. 34

65 35
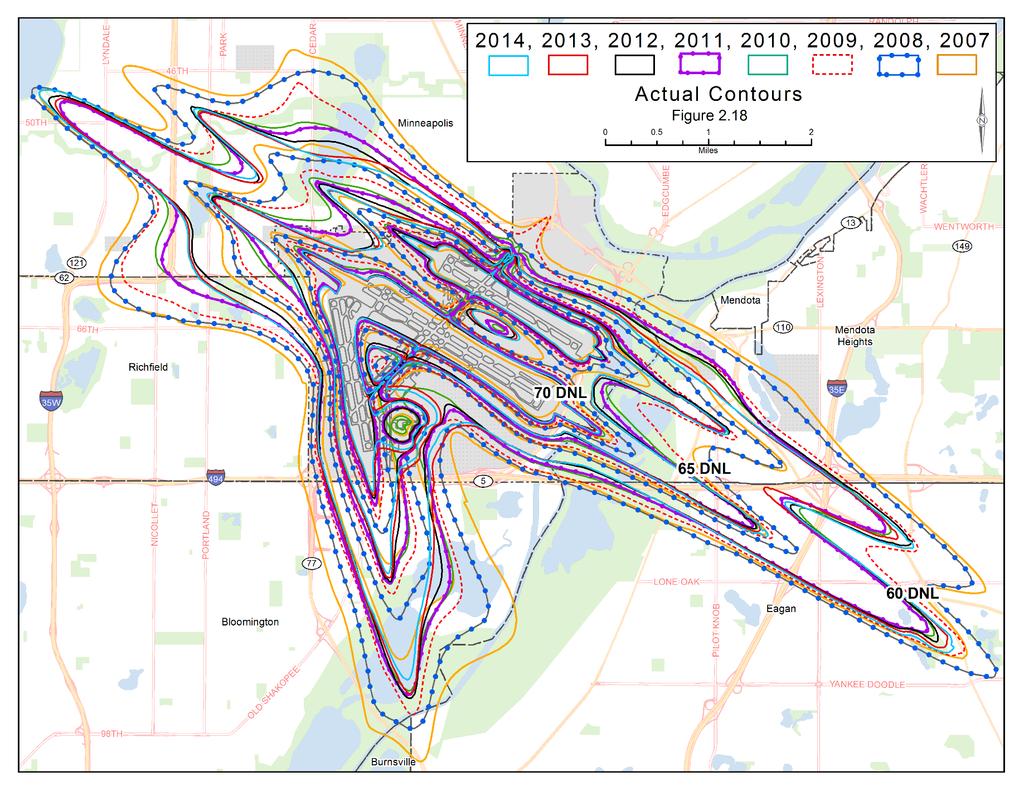
66 36
67 Chapter 3 Comparison of the 2014 Actual Noise Contour and the 2007 Forecast Noise Contour This chapter provides a detailed comparative analysis of the 2014 actual and 2007 forecast mitigated noise contours, focusing on the significant noise modeling variables and noise impacts at MSP. 3.1 Comparison of 2014 Actual and 2007 Forecast Noise Contour Inputs Integrated Noise Model Considerations To develop the actual 2014 contour HNTB used Integrated Noise Model (INM) Version 7.0d, which incorporates lateral attenuation capabilities and updates to noise and performance data for commercial aircraft, updates to substitution aircraft data, and corrections to minor software issues. HNTB developed the 2007 forecast mitigated contour using INM Version 6.1. It is important to note that changes to the model over time can change the size and shape of a noise contour. For example, the improvements to lateral attenuation adjustment algorithms and flight path segmentation in INM 7.0 (versus those used in version 6.1) were found by the FAA to increase the size of a DNL contour for a range of case study airports between 3 and 10 percent over what previous versions of INM would have modeled Aircraft Operations and Fleet Mix Comparison Table 3.1 provides a comparison of total MSP operations by operational category used in the 2007 forecast mitigated noise contour and the 2014 actual noise contour. As indicated in Table 3.1, the 2014 actual total MSP operations number of 411,760 represents a 29.3 percent reduction from the 2007 forecast mitigated total operations number of 582,366. Scheduled passenger air carrier and cargo operations accounted for the majority of the reduction. However, it is notable that charter operations were 96.7 percent below the 2007 forecast mitigated number. Table 3.2 provides a comparison of the 2007 forecast mitigated noise contour fleet mix and the 2014 actual noise Table 3.1 MINNEAPOLIS-ST. PAUL INTERNATIONAL AIRPORT Comparison of 2007 Forecast Mitigated and 2014 Actual Total Operations Operations Category 2014 Actual 2007 Forecast Scheduled Passenger Air Carrier (a) 375, ,472 Cargo 12,199 21,158 Charter 190 5,766 GA (b) 21,862 28,846 Military 2,437 3,124 TOTAL 411, ,366 (a) Includes both air carrier and regional carrier operations (b) Includes both GA and non-scheduled air taxi operations Source: Actual 2014 MACNOMS data adjusted to match FAA OPSNET data (to account for unavailable MACNOMS operations data). 37
68 contour fleet mix 2. An assessment of average daily operations per aircraft type with daytime and nighttime operation statistics is provided. Table 3.2 MINNEAPOLIS-ST. PAUL INTERNATIONAL AIRPORT Comparison of 2007 Mitigated Forecast Fleet Mix and 2014 Actual Fleet Mix Average Daily Operations Group Aircraft Type Day Night Total Difference Forecast Forecast Actual Forecast Actual Forecast Actual and Actual Manufactured /Re-engined Stage 3 Jet B PW RR CF JT LR A R A A A A A A A A A A A AN ASTR BA BD BD BEC CL CL CLREGJ Some INM aircraft types were not available at the time of the preparation of the 2007 forecast noise contour. 38
69 Table 3.2 MINNEAPOLIS-ST. PAUL INTERNATIONAL AIRPORT Comparison of 2007 Mitigated Forecast Fleet Mix and 2014 Actual Fleet Mix Average Daily Operations Group Aircraft Type Day Night Total Difference Forecast Forecast Actual Forecast Actual Forecast Actual and Actual Manufactured CNA /Re-engined CNA Stage 3 Jet CNA (cont d) CNA525C CNA CNA CNA55B CNA CNA560E CNA560U CNA560XL CNA CNA CNA CRJ CRJ D328J DC DC DC DC EMB EMB EMB EMB14L EMB EMB EMB F FAL FAL FAL20A FAL FAL G G GIV GULF GV HK HS HS
70 Table 3.2 MINNEAPOLIS-ST. PAUL INTERNATIONAL AIRPORT Comparison of 2007 Mitigated Forecast Fleet Mix and 2014 Actual Fleet Mix Average Daily Operations Group Aircraft Type Day Night Total Difference Forecast Forecast Actual Forecast Actual Forecast Actual and Actual Manufactured IA /Re-engined IA Stage 3 Jet L (cont d) LEAR LEAR LEAR LEAR LEAR MD11GE MD11PW MD MD MD MD MD MD MD MU R SABR SBR Total , Modified 727EM ( Hushkitted ) 737N Stage 3 Jet 737Q BAC DC93LW DC95HW DC9Q DC9Q Total Microjet CNA ECLIPSE Total Stage 2 Less than 75,000 lb. MTOW FAL GII GULF LEAR LEAR SABR SABR Total
71 Table 3.2 MINNEAPOLIS-ST. PAUL INTERNATIONAL AIRPORT Comparison of 2007 Mitigated Forecast Fleet Mix and 2014 Actual Fleet Mix Average Daily Operations Group Aircraft Type Day Night Total Difference Forecast Forecast Actual Forecast Actual Forecast Actual and Actual Propeller 1900D A AC ATR ATR BAEJ BAEJ BEC BEC BEC BEC BEC BEC30B BEC BEC BEC BEC BEC BEC BEC BEC BEC BEC BEC9F BECM BL CNA CNA CNA CNA CNA CNA CNA CNA CNA CNA CNA CNA CNA CNA CNA CNA
72 Table 3.2 MINNEAPOLIS-ST. PAUL INTERNATIONAL AIRPORT Comparison of 2007 Mitigated Forecast Fleet Mix and 2014 Actual Fleet Mix Average Daily Operations Group Aircraft Type Day Night Total Difference Forecast Forecast Actual Forecast Actual Forecast Actual and Actual Propeller CNA (cont d) CNA CNA CNA CNA CNA DA DHC DHC DO EMB FK GASEPF GASEPV M20J MU P PA23AZ PA PA PA28AR PA28DK PA PA31T PA32LA PA32SG PA PA PA PA PA PC RWCM RWCM SAAB SAMER SAMER SAMER SD SD SF SR
73 Table 3.2 MINNEAPOLIS-ST. PAUL INTERNATIONAL AIRPORT Comparison of 2007 Mitigated Forecast Fleet Mix and 2014 Actual Fleet Mix Average Daily Operations Group Aircraft Type Day Night Total Difference Forecast Forecast Actual Forecast Actual Forecast Actual and Actual Propeller STBM (cont d) TED Total Helicopter A B206L B B B EC R R S S SA355F Total Military C-130E F HAWK KC T C C C9A F16GE T T T T U Total Grand Total 1, , , , Note: Totals may differ due to rounding. Source: MAC-provided INM Input Data, HNTB Average Daily Operations for 2007 forecast were obtained from the November 2004 Part 150 document. In general, many of the aircraft groups operating at MSP showed a reduction in the number of average daily operations from the 2007 forecast mitigated to the 2014 actual operations statistics. Manufactured or re-engined Stage 3 average daily operations in the 2014 actual statistics were down 5.9 percent from the 2007 forecast mitigated number. The Modified ( hushkitted ) Stage 3 average daily operations in the 2014 actual statistics were down 99.9 percent from the 2007 forecast mitigated number. 43
74 In total, the 2014 actual average daily number of operations was 1,128.1, which is a 29.3 percent reduction from the 2007 forecast mitigated number of 1,595.9 operations. Nighttime operations decreased by 28 average daily operations from the 2007 forecast mitigated to the 2014 actual operations statistics Runway Use Comparison Table 3.3 provides a comparison of the 2007 forecast mitigated noise contour and the 2014 actual noise contour runway use percentages. Table 3.3 MINNEAPOLIS-ST. PAUL INTERNATIONAL AIRPORT Comparison of 2007 Forecast Mitigated and 2014 Actual Runway Use Day Night Total Op Type Runway 2007 Fcst Actual 2007 Fcst Actual 2007 Fcst Actual Arrivals 4 0.0% 0.0% 3.8% 0.1% 0.3% 0.0% 12L 21.8% 19.5% 17.2% 14.3% 21.4% 19.0% 12R 14.7% 19.7% 12.4% 26.7% 14.5% 20.4% % 0.0% 0.0% 0.0% 0.0% 0.0% % 0.0% 2.4% 0.0% 0.6% 0.0% 30L 21.1% 19.0% 25.1% 35.5% 21.4% 20.6% 30R 25.1% 22.9% 26.4% 21.6% 25.2% 22.8% % 18.8% 12.7% 1.9% 16.5% 17.2% Total 100.0% 100.0% 100.0% 100.0% 100.0% 100.0% Departures 4 0.2% 0.1% 0.4% 0.3% 0.2% 0.1% 12L 8.9% 13.0% 14.1% 14.4% 9.3% 13.1% 12R 15.9% 4.9% 18.3% 28.3% 16.1% 6.6% % 24.0% 34.6% 15.8% 37.0% 23.4% % 0.0% 0.8% 0.0% 0.1% 0.0% 30L 15.0% 33.2% 12.8% 27.8% 14.8% 32.8% 30R 22.7% 24.7% 19.2% 13.4% 22.4% 23.9% % 0.0% 0.0% 0.0% 0.0% 0.0% Total 100.0% 100.0% 100.0% 100.0% 100.0% 100.0% Overall 4 0.1% 0.1% 2.1% 0.2% 0.3% 0.1% 12L 15.3% 16.2% 15.6% 14.3% 15.4% 16.0% 12R 15.3% 12.2% 15.3% 27.4% 15.3% 13.5% % 12.2% 17.1% 6.7% 18.5% 11.7% % 0.0% 1.6% 0.0% 0.4% 0.0% 30L 18.0% 26.2% 19.0% 32.2% 18.1% 26.7% 30R 23.9% 23.8% 22.8% 18.1% 23.8% 23.3% % 9.3% 6.4% 1.1% 8.3% 8.6% Total 100.0% 100.0% 100.0% 100.0% 100.0% 100.0% Note: Runway use for 2007 forecast reflects Part 150 mitigated 2007 runway use. Totals may not add up to 100% due to rounding. Source: MAC-provided INM Input Data, HNTB Runway use for 2007 forecast was obtained from the November 2004 Part 150 document. A general evaluation of the total runway use percentages in Table 3.3 indicates that use of Runway 17 and Runway 12R for departure operations in 2014 was well below the percentage use numbers forecasted in the 2007 mitigated scenario. The departure percentage on Runway 30L was notably higher than what was forecasted in the 2007 forecast mitigated scenario. The nighttime and overall departure percentages on Runway 17 were significantly lower, and the Runways 30L and 12R nighttime departure percentages were notably higher, than the levels forecasted in the 2007 forecast mitigated scenario. The nighttime arrival percentages on Runways 12R and 30L were notably higher, and significantly lower on Runway 35, than the levels forecasted in the 2007 forecast mitigated scenario. 44
75 3.1.4 Flight Track Considerations The INM departure flight track locations used to develop the 2014 actual noise contour were identical to those used for the 2013 actual noise contour. These flight tracks differ from those used to develop the 2007 forecast mitigated noise contour due to enhanced modeling methods and improved technologies. Sub-tracks were also added to each of the backbone tracks. The INM s standard distribution was used in distributing the flights to the sub-tracks. The same methodology as in previous annual reports was used to assign 2014 radar data with the INM flight tracks. The radar-to-inm flight track correlation process employs a best-fit analysis of the radar flight track data based on linear trends. This approach provides the ability to match each radar flight track directly to the appropriate INM track Atmospheric Conditions Comparison The MAC used an average annual temperature of 47.7 degrees Fahrenheit and an average annual wind speed of 5.3 knots in the 2007 forecast mitigated INM contour modeling process. The MAC also used an average annual pressure of inches and an annual average relative humidity of 64 percent. As stated in Section 2.1.5, the 2014 actual noise contour used a 2014 annual average temperature of 43.6 degrees Fahrenheit and a 2014 average annual wind speed of 8.3 knots in the INM modeling process. In addition, a 2014 average annual pressure of inches of Mercury and a 2014 annual average relative humidity of percent were used. 3.2 Comparative Integrated Noise Model Grid Point Analysis The INM was used to conduct a grid point analysis based on the 2007 forecast mitigated noise contour and 2014 actual noise contour INM input files. The MAC used INM Version 6.2a for the 2007 forecast mitigated noise contour grid point analysis because this was the oldest version of INM available to MAC staff to conduct the analysis in early 2008 when the annual noise contour report process began at MSP. When comparing the DNL values generated for the MACNOMS RMT locations with INM 6.1 in the November 2004 Part 150 Update document to the levels generated for those same locations with INM 6.2a, the differences were insignificant. The INM was used to calculate DNL values for the center points of each city block included in the mitigation programs outlined in the Consent Decree. Figures 3.1 to 3.5 depict the 2014 actual grid point analysis area and the DNL levels calculated for each block by city. Figures 3.6 to 3.10 depict the 2007 forecast mitigated grid point analysis area and the DNL levels calculated for each block by city. Figures 3.11 to 3.15 depict the difference in DNL levels, on a block-by-block basis, between the 2007 forecast mitigated noise contours and the 2014 actual noise contours. 3.3 Contour Comparison Summary The 2014 actual noise contour is smaller than the 2007 forecast mitigated contour by 6,949.9 acres (44.2 percent reduction) in the 60 DNL contour and by 3,755.5 acres (51.9 percent reduction) in the 65 DNL contour. As depicted in Figure 3.16, there is a small area in South Minneapolis where the 2014 actual noise contours extend beyond the 2007 forecast mitigated noise contours. Chapter 4 provides an analysis of mitigation eligibility relative to the 2014 actual contour consistent with the requirements of the First Amendment to the Consent Decree. There is an overall decrease of 4,430 residential units in the 65 DNL contour and 2,567 residential units in the 60 to 64 DNL noise contours around MSP when comparing the 2007 forecast mitigated contour with the 2014 actual contour that was developed under the requirements of the Consent Decree. 45
76 The small extension of the 2014 actual noise contour beyond the 2007 forecast mitigated noise contour can largely be attributed to nighttime runway use variances between what was forecasted for 2007 and what occurred in 2014, particularly an increase of the nighttime arrival operations on Runway 12R. The predominant contraction in the contours from the 2007 forecast mitigated to the 2014 actual noise contour scenarios is driven largely by fleet mix changes (including a significant reduction in Modified ( hushkitted ) Stage 3 aircraft operations), and a significant reduction of total annual operations, including a reduction of 28 average daily nighttime operations. The larger arrival lobe on Runway 12R is largely a function of higher nighttime arrival operations on that runway. In summary, in addition to INM modeling enhancements, the primary factors to consider when comparing the 2007 forecast mitigated noise contours to the 2014 actual noise contours are total operation numbers, fleet mix, nighttime operations, and runway use. 46

77 47
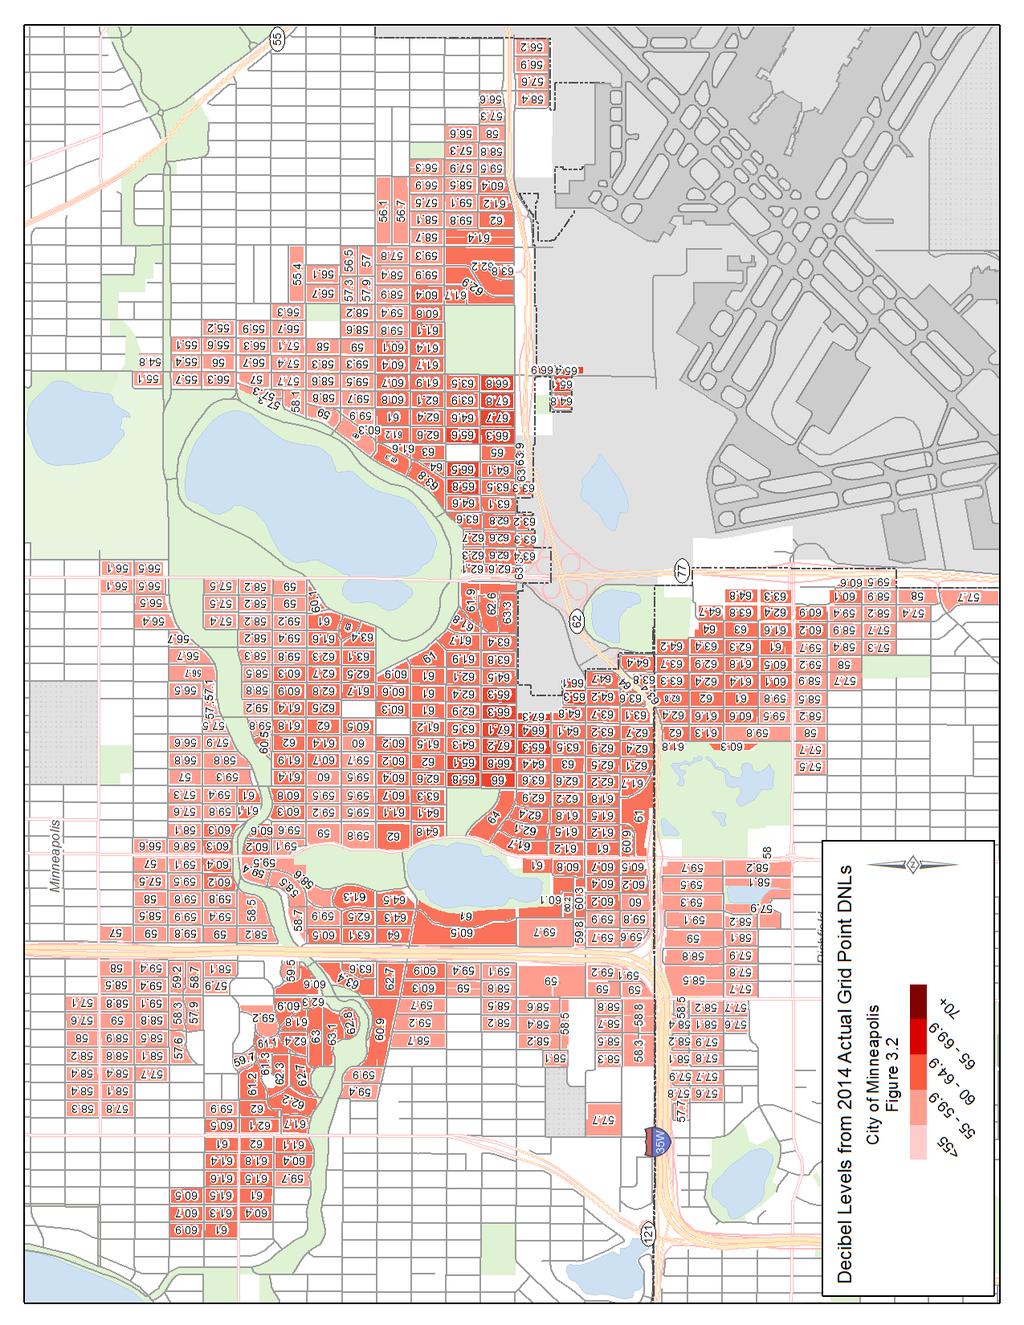
78 48

79 49

80 50

81 51

82 52

83 53

84 54
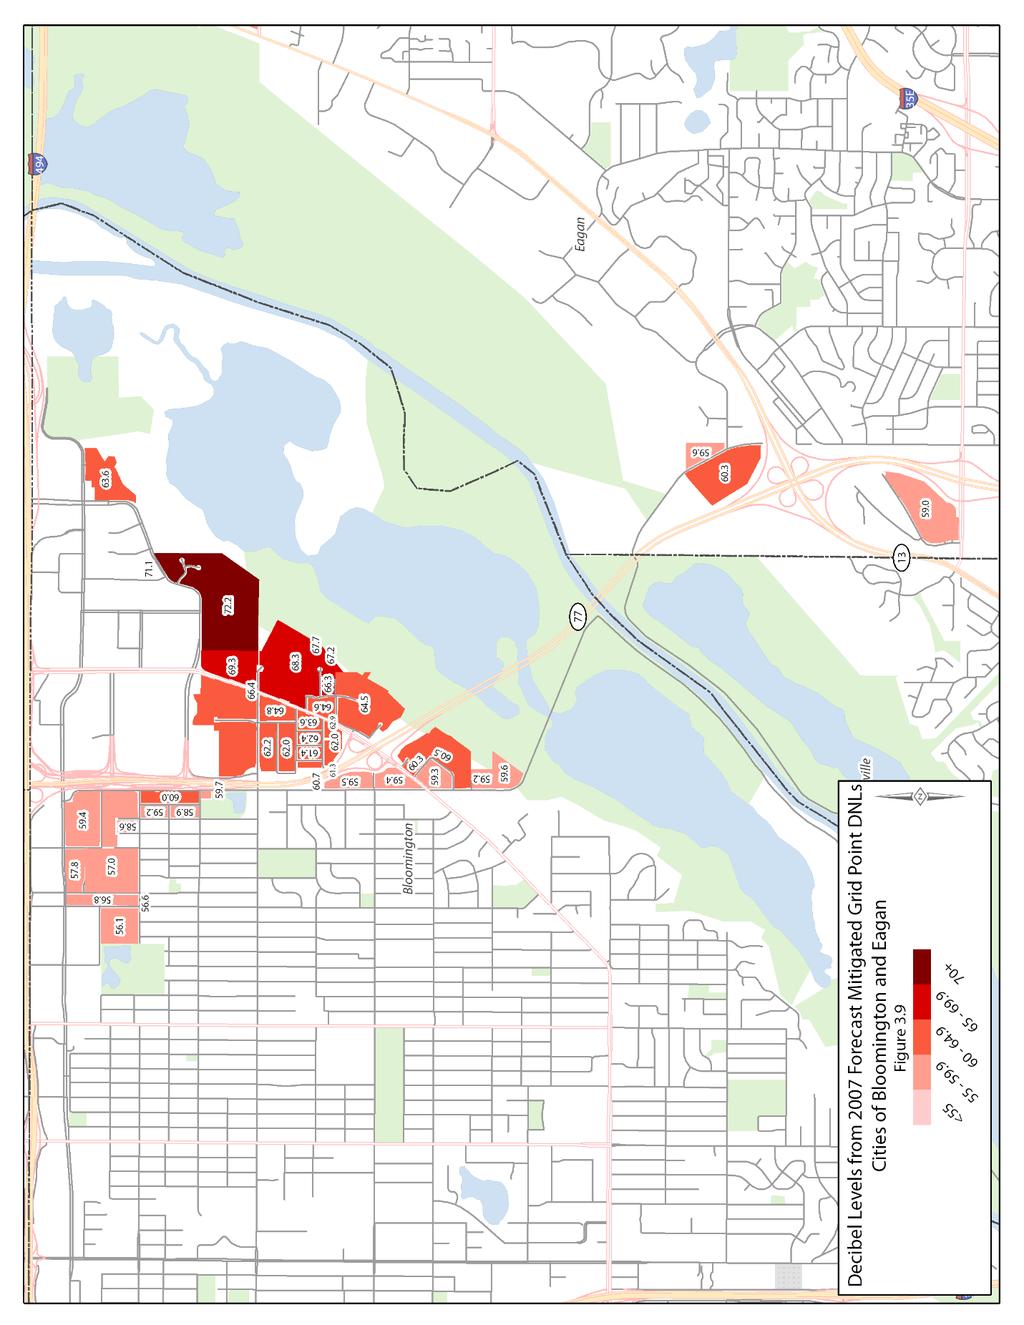
85 55
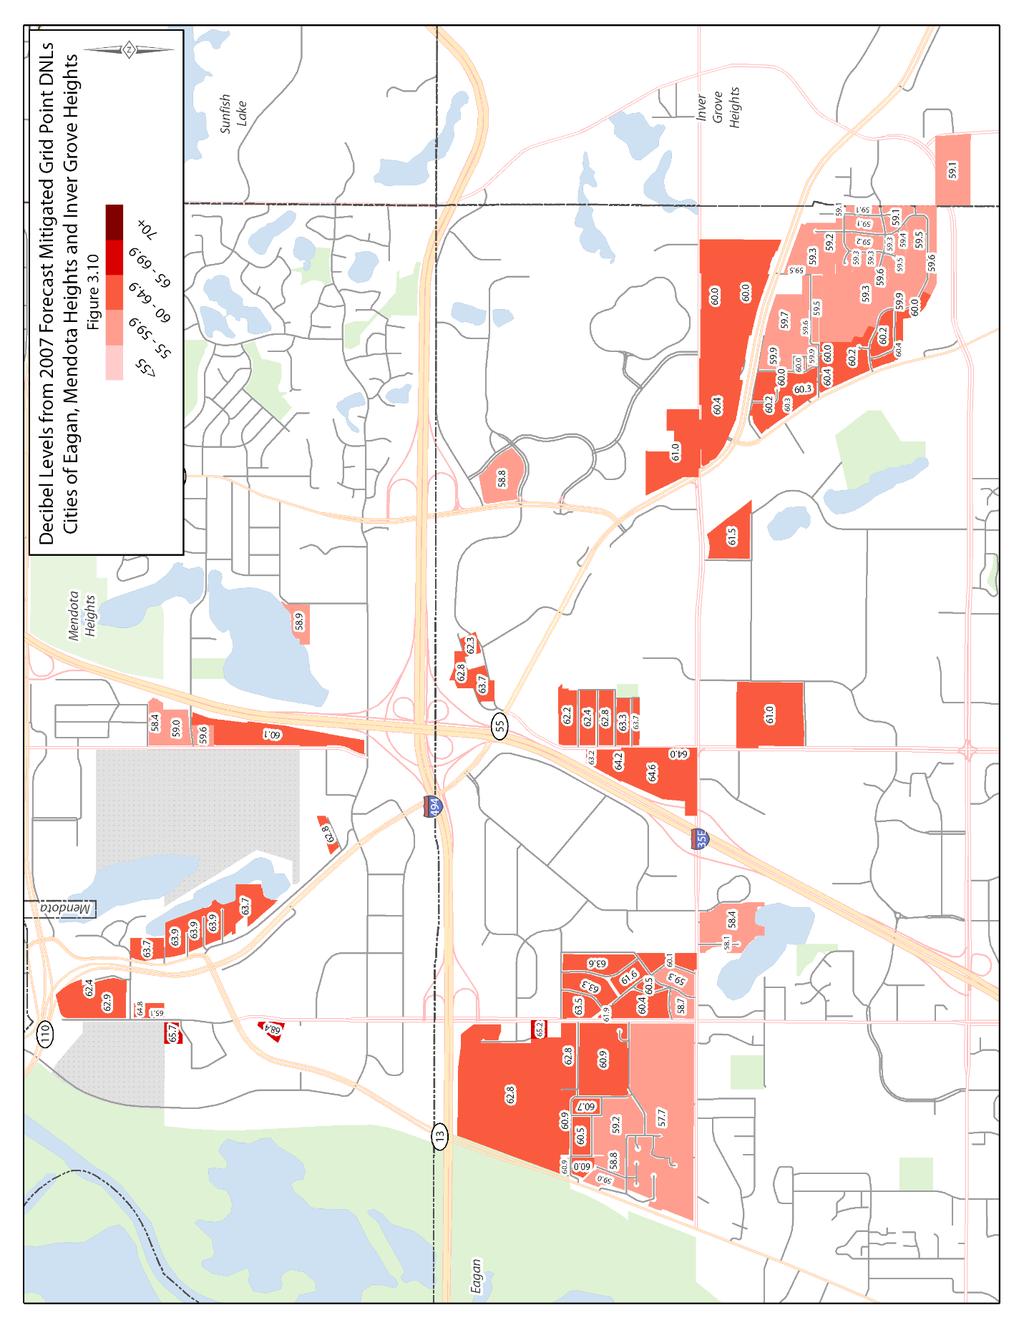
86 56

87 57

88 58

89 59

90 60

91 61
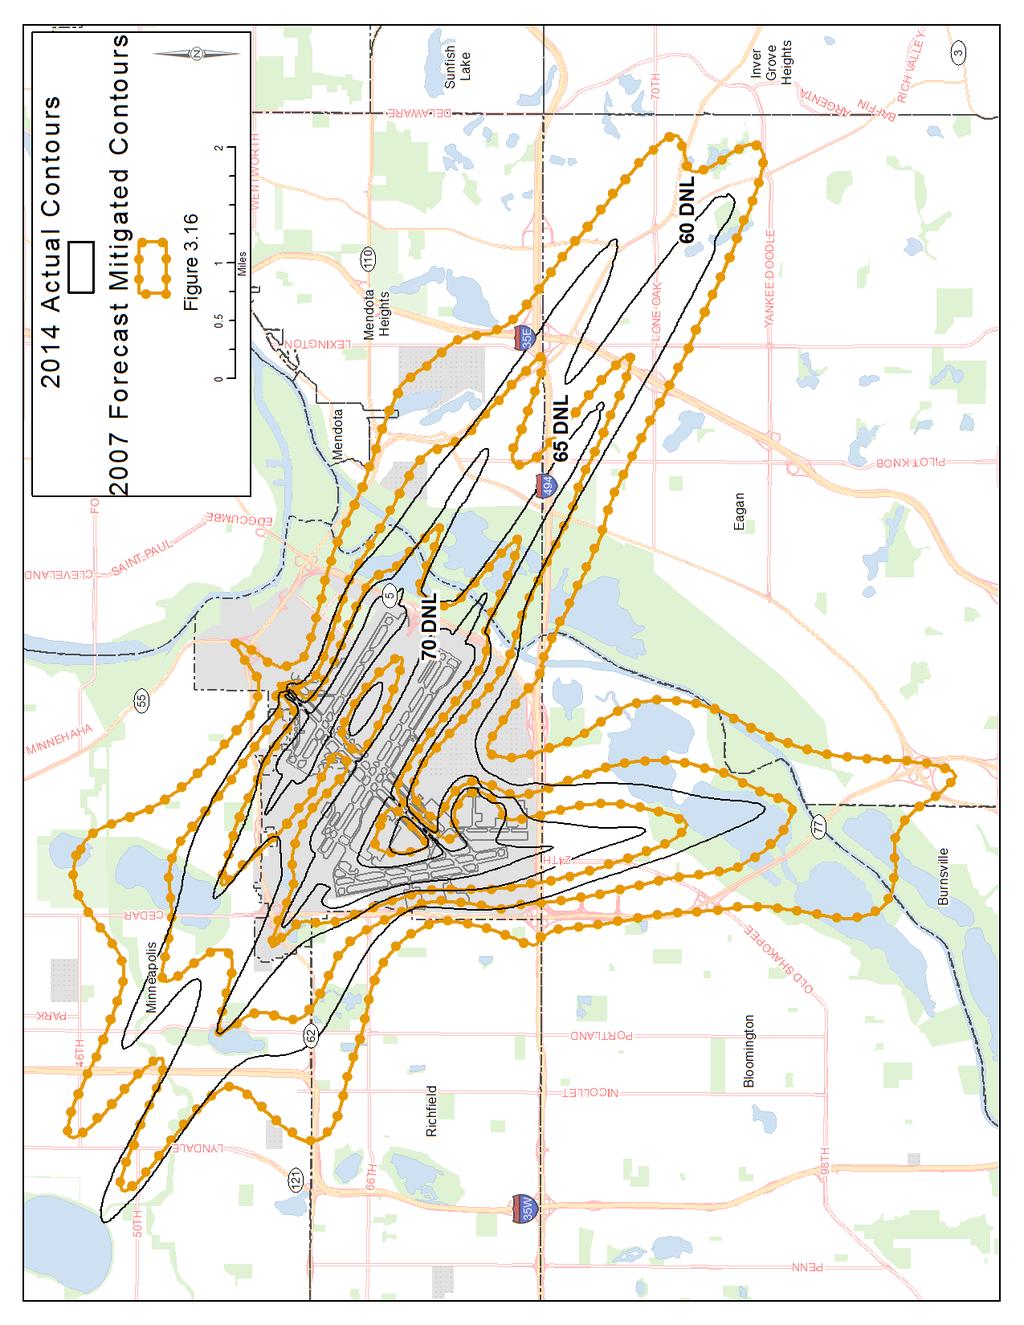
92 62
93 Chapter Actual Noise Contour and the First Amendment to the Consent Decree As discussed previously, the First Amendment to the Consent Decree requires the MAC to determine eligibility for noise mitigation on an annual basis using actual noise contours, developed under Section 8.1(d) of the Consent Decree. This chapter provides detailed information about noise mitigation impacts from the 2014 actual noise contour at MSP. 4.1 First Amendment to the Noise Mitigation Consent Decree On July 31, 2013, the Cities of Minneapolis, Richfield and Eagan, and the Minneapolis Public Housing Authority and the MAC jointly filed the First Amendment to the Consent Decree ( Amendment ) to Hennepin County Court. The Amendment contains language that binds the MAC to provide noise mitigation services consistent with the noise mitigation terms described in the Final MSP 2020 Improvements Environmental Assessment/Environmental Assessment Worksheet (EA/EAW). On September 25, 2013, Hennepin County Court Judge Ivy Bernardson approved the First Amendment to the 2007 Consent Decree. The Amendment incorporates text in the eligibility section and the related mitigation program as defined by the Consent Decree. In 2014 the Annual Noise Contour Report format was updated in consultation and agreement with the parties to the Consent Decree (including the Cities of Minneapolis, Richfield and Eagan) to address the mitigation program requirements detailed in the Amendment. In addition to the background information provided in Chapter 1, Section 1.5, the report was updated to provide maps analyzing changes that occur in noise mitigation eligibility as compared to the 2007 Consent Decree, and associated trends relative to consecutive yearly impacts Actual Contour Noise Mitigation Impact Under the provisions of the Amendment properties must meet certain criteria to be considered eligible for participation in the MAC noise mitigation program. First, as stated in the Amendment: The community in which the home is located has adopted local land use controls and building performance standards applicable to the home for which mitigation is sought that prohibit new residential construction, unless the construction materials and practices are consistent with the local land use controls and heightened building performance standards for homes within the 60 DNL Contour within the community in which the home is located. This criterion has been met by all of the communities contiguous to MSP. 63
94 Second, as stated in the Amendment: The home is located, for a period of three consecutive years, with the first of the three years beginning no later than calendar year 2020 (i) in the actual DNL noise contour prepared by the MAC under Section 8.l(d) of this Consent Decree and (ii) within a higher noise impact mitigation area when compared to the Single-Family home's status under the noise mitigation programs for Single-Family homes provided in Sections 5.1 through 5.3 of this Consent Decree or when compared to the Multi- Family home's status under the noise mitigation programs for Multi-Family homes provided in Section 5.4 of this Consent Decree. The noise contour boundary will be based on the block intersect methodology. The MAC will offer noise mitigation under Section IX of this Consent Decree to owners of eligible Single- Family homes and Multi-Family homes in the year following the MAC's determination that a Single-Family or Multi-Family home is eligible for noise mitigation under this Section. Table 4.1 provides the number of single-family living units that achieved the first year of mitigation eligibility and Table 4.2 provides the number of single-family living units that met the second consecutive year eligibility criteria. The colors in the tables relate to the colored blocks in Figures 4.1 and 4.2 Table 4.1 MINNEAPOLIS-ST. PAUL INTERNATIONAL AIRPORT Summary of 2014 Actual DNL Noise Contour Single-Family Unit Counts by Block with First Year Mitigation Eligibility Status Year of City Mitigation Fig 4.1 & 4.2 DNL Contours Eligibility Key Total Year 1 out of 3 Minneapolis Mitigation Changes After 3 Consecutive Years Bloomington Richfield Eagan Mendota Heights Note: Block Intersect Methodology; Single-Family=1-3 Units. Source: HNTB provided INM contours, MAC analysis, 2015 In 2014 Actual Contours previously mitigated (No mitigation eligibility change) 4,010 1,538 1, ,577 In 2014 Actual 60 DNL previously outside 2005 and DNL (Eligible for mitigation after 3 consecutive years) In 2014 Actual 60 DNL previously between 2005 and DNL (Eligible for additional mitigation, less previous reimbursements after 3 consecutive years) In 2014 Actual 63 DNL previously in DNL (Eligible for the "five decibel package after 3 consecutive years) Minneapolis Total 4,175 1,658 1, ,862 In 2014 Actual Contours previously mitigated (No mitigation eligibility change) In 2014 Actual Contours previously mitigated (No mitigation eligibility change) In 2014 Actual Contours previously mitigated (No mitigation eligibility change) In 2014 Actual Contours previously mitigated (No mitigation eligibility change) Grand Total 4,729 1,850 1, ,610 64
95 Table 4.2 MINNEAPOLIS-ST. PAUL INTERNATIONAL AIRPORT Summary of 2014 Actual DNL Noise Contour Single-Family Unit Counts by Block with Second Consecutive Year Mitigation Eligibility Status Year of City Mitigation Fig 4.1 & 4.2 DNL Contours Eligibility Key Total Year 2 out of 3 Minneapolis Mitigation Changes After 3 Consecutive Years Bloomington Richfield Eagan Mendota Heights In 2014 Actual Contours previously mitigated (No mitigation eligibility change) 4,010 1,538 1, ,577 In 2014 Actual 60 DNL previously outside 2005 and DNL (Eligible for mitigation after 3 consecutive years) In 2014 Actual 60 DNL previously between 2005 and DNL (Eligible for additional mitigation, less previous reimbursements after 3 consecutive years) In 2014 Actual 63 DNL previously in DNL (Eligible for the "five decibel package after 3 consecutive years) Minneapolis Total 4,147 1,538 1, ,714 In 2014 Actual Contours previously mitigated (No mitigation eligibility change) In 2014 Actual Contours previously mitigated (No mitigation eligibility change) In 2014 Actual Contours previously mitigated (No mitigation eligibility change) In 2014 Actual Contours previously mitigated (No mitigation eligibility change) Note: Block Intersect Methodology; Single-Family=1-3 Units. Source: HNTB provided INM contours, MAC analysis, Grand Total 4,701 1,730 1, ,462 Table 4.3 provides the number of multi-family living units that achieved the first year of mitigation eligibility and Table 4.4 provides the number of multi-family living units that met the second consecutive year eligibility criteria. The colors in the tables relate to the colored blocks in Figures 4.1 and 4.2 Table 4.3 MINNEAPOLIS-ST. PAUL INTERNATIONAL AIRPORT Summary of 2014 Actual DNL Noise Contour Multi-Family Unit Counts by Block with First Year Mitigation Eligibility Status Year of Eligibility Year 1 out of 3 City Minneapolis Bloomington Richfield Eagan Mendota Heights Mitigation In 2014 Actual Contours previously mitigated under 2007 Consent Decree (no mitigation eligibility change) In 2014 Actual Contours previously mitigated under 2007 Consent Decree (no mitigation eligibility change) In 2014 Actual Contours previously mitigated under 2007 Consent Decree (no mitigation eligibility change) Note: Block Intersect Methodology; Multi-Family>3 Units. Source: HNTB provided INM contours, MAC analysis, 2015 Fig 4.1 & 4.2 Key DNL Contours Total In 2014 Actual Contours previously mitigated under 2007 Consent Decree (no mitigation eligibility change) In 2014 Actual Contours previously mitigated under 2007 Consent Decree (no mitigation eligibility change) Grand Total 1, ,356 65
96 Table 4.4 MINNEAPOLIS-ST. PAUL INTERNATIONAL AIRPORT Summary of 2014 Actual DNL Noise Contour Multi-Family Unit Counts by Block with Second Consecutive Year Mitigation Eligibility Status Year of Eligibility Year 2out of 3 City Minneapolis Mitigation Changes After 3 Consecutive Years Bloomington Richfield Eagan Mendota Heights Mitigation Note: Block Intersect Methodology; Multi-Family>3 Units. Source: HNTB provided INM contours, MAC analysis, 2015 In 2014 Actual Contours previously mitigated under 2007 Consent Decree (no mitigation eligibility change) In 2014 Actual DNL previously outside 2005 and DNL (eligible for mitigation after 3 consecutive years) Fig 4.1 & 4.2 Key DNL Contours Total Minneapolis Total In 2014 Actual Contours previously mitigated under 2007 Consent Decree (no mitigation eligibility change) In 2014 Actual Contours previously mitigated under 2007 Consent Decree (no mitigation eligibility change) In 2014 Actual Contours previously mitigated under 2007 Consent Decree (no mitigation eligibility change) In 2014 Actual Contours previously mitigated under 2007 Consent Decree (no mitigation eligibility change) Grand Total 1, ,445 In this second year (2014) of actual noise contour mapping as established by the terms of the Amendment, the only residential properties that meet the mitigation eligibility criteria are located within the City of Minneapolis. There are 120 single-family units that meet the first year of eligibility within the 63 DNL contour for the 5 Decibel Reduction Package described in the Consent Decree, as amended. In addition, there are 39 single-family units that were previously eligible for the homeowner reimbursement noise mitigation program and another 126 singlefamily units previously outside of the program that meet the first year of eligibility in 2014 for the DNL noise contour noise mitigation package options described in the Consent Decree, as amended. There are 119 single-family units within the DNL noise contour that were previously eligible for the homeowner reimbursement noise mitigation program and another 18 single-family units previously outside of the program that meet the second consecutive year of eligibility in 2014 for the DNL noise contour noise mitigation package options described in the Consent Decree, as amended. There are 89 multi-family living units within the DNL noise contour that were previously outside the program that meet the second consecutive year of eligibility in 2014 for the Multi-Family Home Mitigation Package described in the Consent Decree, as amended. The blocks meeting the first and second consecutive year(s) of noise mitigation eligibility are shown in Figures 4.1 and 4.2 below. 66
97 67

98 68
99 ITEM 6 MEMORANDUM TO: MSP Noise Oversight Committee (NOC) FROM: Dana Nelson, Manager Noise, Environment and Planning SUBJECT: NIGHTTIME OPERATIONS ASSESSMENT DATE: March 4, 2015 The 2015 NOC Work Plan includes a review of the nighttime operations at Minneapolis-St. Paul International Airport (MSP). MAC staff has prepared the attached Annual Nighttime Operations Assessment comparing 2013 and This report is prepared annually to analyze trends in scheduled and actual nighttime operations at MSP. MAC staff will provide a briefing of the attached analysis at the March 18, 2015 NOC meeting.
100 Annual MSP Nighttime Operations Assessment March 2015 MAC Noise Program Office
101 Average Daily Nighttime Operations 10:30pm - 6:00am Average Daily Operations Source: MACNOMS Flight Track Data 1
102 Average Daily INM Nighttime Operations 10 pm - 7 am Average Daily 2007 Forecast (123.3) Average Daily Hushkits 2007 Forecast Hushkits (21.7) Average Daily Operations Source: MACNOMS Flight Track Data 2
103 2014 MSP Night-time (10:30 pm to 6:00 am) Runway Use All Aircraft Operations MSP Runway Use Average Daily Operations MSP Runway Use Percent RWY Arr/Dep Overflight Area Total Night Ops Average Daily Night Ops % Total Night Ops Average Daily Night Ops 4 Arr So. Richfield/Bloomington % % 12L Arr So. Minneapolis/No. Richfield % % 12R Arr So. Minneapolis/No. Richfield % % 17 Arr So. Minneapolis % % 22 Arr St. Paul/Highland Park % % 30L Arr Eagan/Mendota Heights % % 30R Arr Eagan/Mendota Heights % % 35 Arr Bloomington/Eagan % % Total Nighttime Arrivals % % 4 Dep St. Paul/Highland Park % % 12L Dep Eagan/Mendota Heights % % 12R Dep Eagan/Mendota Heights % % 17 Dep Bloomington/Eagan % % 22 Dep So. Richfield/Bloomington % % 30L Dep So. Minneapolis/No. Richfield % % 30R Dep So. Minneapolis/No. Richfield % % 35 Dep So. Minneapolis % % Total Nighttime Departures Total Nighttime Operations % % (percentages may equal 100% due to rounding) % Source: MACNOMS Flight Track Data 3

104 2014 MSP Night-time (10:30 pm to 6:00 am) Runway Use Carrier Jet Operations Night-time Runway Use Daily Average Night-time Runway Use Percent RWY Arr/Dep Overflight Area Total Night Ops Average Daily Night Ops % Total Night Ops Average Daily Night Ops 4 Arr So. Richfield/Bloomington % % 12L Arr So. Minneapolis/No. Richfield % % 12R Arr So. Minneapolis/No. Richfield % % 17 Arr So. Minneapolis % % 22 Arr St. Paul/Highland Park % % 30L Arr Eagan/Mendota Heights % % 30R Arr Eagan/Mendota Heights % % 35 Arr Bloomington/Eagan % % Total Nighttime Arrivals % % 4 Dep St. Paul/Highland Park % % 12L Dep Eagan/Mendota Heights % % 12R Dep Eagan/Mendota Heights % % 17 Dep Bloomington/Eagan % % 22 Dep So. Richfield/Bloomington % % 30L Dep So. Minneapolis/No. Richfield % % 30R Dep So. Minneapolis/No. Richfield % % 35 Dep So. Minneapolis % % Total Nighttime Departures Total Nighttime Operations % % (percentages may equal 100% due to rounding) % Source: MACNOMS Flight Track Data 4
105 2014 MSP INM Night-time (10:00 pm to 7:00 am) Runway Use Night-time Runway Use Daily Average Night-time Runway Use Percent RWY Arr/Dep Overflight Area Total Night Ops Average Daily Night Ops % Total Night Ops Average Daily Night Ops 4 Arr So. Richfield/Bloomington % % 12L Arr So. Minneapolis/No. Richfield % % 12R Arr So. Minneapolis/No. Richfield % % 17 Arr So. Minneapolis % % 22 Arr St. Paul/Highland Park % % 30L Arr Eagan/Mendota Heights % % 30R Arr Eagan/Mendota Heights % % 35 Arr Bloomington/Eagan % % Total Nighttime Arrivals % % 4 Dep St. Paul/Highland Park % % 12L Dep Eagan/Mendota Heights % % 12R Dep Eagan/Mendota Heights % % 17 Dep Bloomington/Eagan % % 22 Dep So. Richfield/Bloomington % % 30L Dep So. Minneapolis/No. Richfield % % 30R Dep So. Minneapolis/No. Richfield % % 35 Dep So. Minneapolis % % Total Nighttime Departures % % Total Nighttime Operations (percentages may equal 100% due to rounding) % Source: MACNOMS Flight Track Data 5
106 2014 Carrier Jet Operations by Nighttime Hours Hour Total Total Top 15 Night time Carrier Jet Operators by Type 10:30 pm to 6:00 am Airline ID Stage Type Count American AAL 3 B American AAL 3 B757 1 American AAL 3 B763 2 American AAL 3 MD Atlantic Southeast ASQ 3 CRJ7 151 Atlantic Southeast ASQ 3 CRJ9 21 Atlantic Southeast ASQ 3 E Compass CPZ 3 E Delta DAL 3 A Delta DAL 3 A Delta DAL 3 A Delta DAL 3 B717 1 Delta DAL 3 B Delta DAL 3 B Delta DAL 3 B744 1 Delta DAL 3 B Delta DAL 3 B Delta DAL 3 B Delta DAL 3 B777 1 Delta DAL 3 MD Delta DAL 3 MD Endeavor Air FLG 3 CRJ2 289 Endeavor Air FLG 3 CRJ9 290 Fedex FDX 3 A Fedex FDX 3 A310 2 Fedex FDX 3 B Fedex FDX 3 DC10 44 Fedex FDX 3 MD Frontier Airlines FFT 3 A Frontier Airlines FFT 3 A Republic Airlines RPA 3 E Skywest Airlines SKW 3 CRJ2 483 Skywest Airlines SKW 3 CRJ7 478 Skywest Airlines SKW 3 CRJ9 57 Skywest Airlines SKW 3 E Southwest SWA 3 B Southwest SWA 3 B735 1 Southwest SWA 3 B Southwest SWA 3 B Spirit NKS 3 A Spirit NKS 3 A Sun Country SCX 3 B Sun Country SCX 3 B United UAL 3 A United UAL 3 A United UAL 3 B United UAL 3 B United UAL 3 B United UAL 3 B744 1 UPS UPS 3 A UPS UPS 3 B744 1 UPS UPS 3 B UPS UPS 3 B UPS UPS 3 MD US Airways AWE 3 A US Airways AWE 3 A US Airways AWE 3 A US Airways AWE 3 B762 1 US Airways AWE 3 E190 1 Total Carrier Jet Operations by Nighttime Hours Hour Total Total Top 15 Night time Carrier Jet Operators by Type 10:30 pm to 6:00 am Airline ID Stage Type Count Airtran TRS 3 B Airtran TRS 3 B America West AWE 3 A America West AWE 3 A America West AWE 3 A American AAL 3 B American AAL 3 MD Atlantic Southeast ASQ 3 CRJ 1 Atlantic Southeast ASQ 3 CRJ7 68 Atlantic Southeast ASQ 3 CRJ9 15 Atlantic Southeast ASQ 3 E Atlantic Southeast ASQ 3 E Compass CPZ 3 E Delta DAL 3 A Delta DAL 3 A Delta DAL 3 A Delta DAL 3 B Delta DAL 3 B Delta DAL 3 B Delta DAL 3 B Delta DAL 3 MD Delta DAL 3 MD Fedex FDX 3 A Fedex FDX 3 A310 9 Fedex FDX 3 B72Q 2 Fedex FDX 3 B Fedex FDX 3 DC Fedex FDX 3 MD Pinnacle FLG 3 B738 1 Pinnacle FLG 3 CRJ 263 Pinnacle FLG 3 CRJ2 104 Pinnacle FLG 3 CRJ7 1 Pinnacle FLG 3 CRJ9 223 Republic Airlines RPA 3 E Skywest Airlines SKW 3 CRJ 167 Skywest Airlines SKW 3 CRJ2 129 Skywest Airlines SKW 3 CRJ7 140 Skywest Airlines SKW 3 CRJ9 154 Southwest SWA 3 B Southwest SWA 3 B Southwest SWA 3 B Spirit NKS 3 A Spirit NKS 3 A Sun Country SCX 3 B Sun Country SCX 3 B UPS UPS 3 A UPS UPS 3 B UPS UPS 3 B762 1 UPS UPS 3 B763 3 UPS UPS 3 MD United UAL 3 A United UAL 3 A United UAL 3 B735 2 United UAL 3 B United UAL 3 B United UAL 3 B United UAL 3 B757 2 United UAL 3 CRJ7 1 Total Total Source: MACNOMS Flight Track Data 6
107 Night-time Fleet Stage Mix for Top 15 Airlines :30 pm 6:00 am Night-time Fleet Stage Mix for Top 15 Airlines :30 pm 6:00 am 5000 Stage 3 Stage 3 Manufactured 5000 Stage 3 Stage 3 Manufactured AAL ASQ AWE CPZ DAL FDX FFT FLG NKS RPA SCX SKW SWA UAL UPS AAL ASQ AWE CPZ DAL FDX FLG NKS RPA SCX SKW SWA TRS UAL UPS Airline Stage 3 Stage 3 Manufactured Total AAL ASQ AWE CPZ DAL FDX FFT FLG NKS RPA SCX SKW SWA UAL UPS Total Airline Stage 3 Stage 3 Manufactured Total AAL ASQ AWE CPZ DAL FDX FLG NKS RPA SCX SKW SWA TRS UAL UPS Total Source: MACNOMS Flight Track Data 7
108 MSP Night-Time Operations Average Daily Operations by Hour 2013 Arrivals 2013 Departures 2014 Arrivals 2014 Departures Hour MSP Night-Time Operations 2014 Average Daily Operations by Hour MSP Night-Time Operations 2013 Average Daily Operations by Hour 0500: 25.2% 2230: 22.9% 0500: 25.2% 2230: 22.9% 0400: 5.4% 0300: 1.9% 0200: 2.1% 0100: 3.2% 0000: 9.6% 2300: 29.8% 0400: 5.4% 0300: 1.9% 0200: 2.1% 0100: 3.2% 0000: 9.6% 2300: 29.8% (Percentages may equal 100% due to rounding) Source: MACNOMS Flight Track Data 8
109 2014 Night-time Scheduled Carrier Jet Operations 2013 Night-time Scheduled Carrier Jet Operations AAL ACA AFR ASA AWE CFG DAL FDX FFT NKS SCX SWA TRS UAL UPS AAL AAR ACA AFR BKA DAL FDX FFT NKS SCX SWA TRS UAL UPS USA Evening Hours (8:00 pm to 10:30pm) 20,157 Operations Night time Hours (10:30 pm to 6:00 am) 9,595 Scheduled Operations Evening Hours (8:00 pm to 10:30pm) 25,784 Operations Night time Hours (10:30 pm to 6:00 am) 7,466 Scheduled Operations :00:00 20:15:00 20:30:00 20:45:00 21:00:00 21:15:00 21:30:00 21:45:00 22:00:00 22:15:00 22:30:00 22:45:00 23:00:00 23:15:00 23:30:00 23:45:00 0:00:00 0:15:00 0:45:00 1:15:00 1:30:00 1:45:00 2:00:00 2:45:00 3:30:00 3:45:00 4:00:00 4:15:00 4:30:00 4:45:00 5:00:00 5:15:00 5:30:00 5:45: :00:00 20:15:00 20:30:00 20:45:00 21:00:00 21:15:00 21:30:00 21:45:00 22:00:00 22:15:00 22:30:00 22:45:00 23:00:00 23:15:00 23:30:00 23:45:00 0:00:00 0:15:00 0:30:00 0:45:00 1:15:00 2:45:00 3:15:00 3:30:00 3:45:00 4:00:00 4:15:00 4:30:00 4:45:00 5:00:00 5:15:00 5:30:00 5:45: Scheduled Operations During Night-time Hours 10:30 pm to 6:00 am 2013 Scheduled Operations During Night-time Hours 10:30 pm to 6:00 am Airline Stage 2 Stage 3 Stage 3 Manufactured Total Delta (DAL) Sun Country (SCX) United (UAL) US Airways (AWE) Spirit (NKS) UPS (UPS) American (AAL) Southwest (SWA) Fedex (FDX) Frontier Airlines (FFT) Airtran (TRS) Air Canada (ACA) Alaska (ASA) Condor (CFG) Total Airline Stage 2 Stage 3 Stage 3 Manufactured Total Sun Country (SCX) Delta (DAL) Us Airways (USA) UPS (UPS) United (UAL) Spirit (NKS) American (AAL) Fedex (FDX) Southwest (SWA) Airtran (TRS) Frontier Airlines (FFT) Asiana Airlines (AAR) Total Source: Official Airline Guide (OAG), UPS and FedEx reporting. 9

110 2014 Night-Time Scheduled vs. Actual Carrier Jet Operations 10:30 pm 6:00 am Airline Scheduled Stage 3 Actual Stage 3 Scheduled Manufactured Stage 3 Airlines in the Other category do not report schedules to the Official Airline Guide (OAG). Source: MACNOMS flight tracking data for actual counts; Official Airline Guide (OAG), UPS and FedEx reporting for scheduled counts. 10 Actual Manufactured Stage 3 Scheduled Total Actual Total Delta (DAL) Sun Country (SCX) Spirit Airlines (NKS) Southwest (SWA) UPS (UPS) American (AAL) FedEx (FDX) United (UAL) Frontier Airlines (FFT) Airtran (TRS) Air Canada (ACA) US Airways (USA) America West (AWE) Condor (CFG) Other Total
 0 0 1259")
111 2013 Night-Time Scheduled vs. Actual Carrier Jet Operations 10:30 pm 6:00 am Airline Scheduled Stage 3 Actual Stage 3 Scheduled Manufactured Stage 3 Actual Manufactured Stage 3 Scheduled Total Actual Total Delta (DAL) Sun Country (SCX) Spirit Airlines (NKS) UPS (UPS) Southwest (SWA) American (AAL) FedEx (FDX) Airtran (TRS) United (UAL) Frontier Airlines (FFT) Continental (COA) Asiana Airlines (AAR) US Airways (USA) Other Total Airlines in the Other category do not report schedules to the Official Airline Guide (OAG). Source: MACNOMS flight tracking data for actual counts; Official Airline Guide (OAG), UPS and FedEx reporting for scheduled counts. 11
3rd Quarter 2015 Minneapolis-St. Paul International Airport (MSP) Public Input Meeting
 Public Input Meeting") 3rd Quarter 2015 Minneapolis-St. Paul International Airport (MSP) Public Input Meeting Metropolitan Airports Commission Noise Program Office July 28, 2015 Meeting Goals To hear the views and concerns of
3rd Quarter 2015 Minneapolis-St. Paul International Airport (MSP) Public Input Meeting Metropolitan Airports Commission Noise Program Office July 28, 2015 Meeting Goals To hear the views and concerns of
Minneapolis-St. Paul International Airport (MSP)
") 2 nd Quarter 2016 Minneapolis-St. Paul International Airport (MSP) Public Input Meeting Metropolitan Airports Commission Noise Program Office April 27, 2016 PUBLIC INPUT MEETING Meeting Goals To hear the
2 nd Quarter 2016 Minneapolis-St. Paul International Airport (MSP) Public Input Meeting Metropolitan Airports Commission Noise Program Office April 27, 2016 PUBLIC INPUT MEETING Meeting Goals To hear the
MINNEAPOLIS-ST. PAUL PUBLIC INPUT MEETING 3 RD QUARTER 2016 INTERNATIONAL AIRPORT (MSP)
") 3 RD QUARTER 2016 MINNEAPOLIS-ST. PAUL INTERNATIONAL AIRPORT (MSP) PUBLIC INPUT MEETING Metropolitan Airports Commission Noise Program Office July 27, 2016 PUBLIC INPUT MEETING Meeting Goals To hear the
3 RD QUARTER 2016 MINNEAPOLIS-ST. PAUL INTERNATIONAL AIRPORT (MSP) PUBLIC INPUT MEETING Metropolitan Airports Commission Noise Program Office July 27, 2016 PUBLIC INPUT MEETING Meeting Goals To hear the
msp macnoise.com MSP Noise Oversight Committee (NOC) November 17, 2010
 November 17, 2010") MSP Noise Oversight Committee (NOC) November 17, 2010 Operations Update Technical Advisor s Report Summary MSP Complaints September October 2010 3,025 3,567 2009 6,350 6,001 Total Operations September
MSP Noise Oversight Committee (NOC) November 17, 2010 Operations Update Technical Advisor s Report Summary MSP Complaints September October 2010 3,025 3,567 2009 6,350 6,001 Total Operations September
Metropolitan Airports Commission (MAC)
") Metropolitan Airports Commission (MAC) Minneapolis-St. Paul International Airport (MSP) Noise Oversight Committee (NOC) MAC General Office Building Lindbergh Conference Room 6040 28 th Avenue South Minneapolis,
Metropolitan Airports Commission (MAC) Minneapolis-St. Paul International Airport (MSP) Noise Oversight Committee (NOC) MAC General Office Building Lindbergh Conference Room 6040 28 th Avenue South Minneapolis,
Staff: C. Leqve, S. Skramstad, J. Lewis, D. Bitner, A. Nyren, J. Felger, J. Nelson
 METROPOLITAN AIRPORTS COMMISSION MSP NOISE OVERSIGHT COMMITTEE MEETING MINUTES Wednesday,, 1:30 p.m. General Offices, Lindbergh Conference Room Call to Order A regularly scheduled meeting of the MSP Noise
Recommendations for Northbound Aircraft Departure Concerns over South Minneapolis
 Recommendations for Northbound Aircraft Departure Concerns over South Minneapolis March 21, 2012 Noise Oversight Committee Agenda Item #4 Minneapolis Council Member John Quincy Background Summer of 2011
National Transportation Safety Board Recommendation and FAA Air Traffic Orders
 Page 1 of 8 MEMORANDUM TO: Planning, Development and Environment Committee FROM: Chad E. Leqve, Director Environment (725.6326) SUBJECT: NOISE OVERSIGHT COMMITTEE (NOC) CONVERGING RUNWAY OPERATION (CRO)
MSP NOISE OVERSIGHT COMMITTEE MEETING MINUTES Wednesday, 22 July 2015, 1:30pm MAC General Offices Building Lindbergh Conference Room
 MSP NOISE OVERSIGHT COMMITTEE MEETING MINUTES Wednesday,, 1:30pm MAC General Offices Building Lindbergh Conference Room Call to Order A regularly-scheduled meeting of the, having been duly called, was
Noise Oversight Committee
 Noise Oversight Committee March 18, 2015 Audio recordings are made of this meeting Noise Oversight Committee March 18, 2015 Item 1 Review and Approve Draft Meeting Minutes Minutes from January 21, 2015
Minneapolis St. Paul International Airport (MSP) 2018 Annual Noise Contour Report
 2018 Annual Noise Contour Report") Minneapolis St. Paul International Airport (MSP) 2018 Annual Noise Contour Report Comparison of the 2018 Actual and the 2007 Forecast Noise Contours February 2018 MAC Noise Program Office and HNTB Corporation
Minneapolis St. Paul International Airport (MSP) 2018 Annual Noise Contour Report Comparison of the 2018 Actual and the 2007 Forecast Noise Contours February 2018 MAC Noise Program Office and HNTB Corporation
Noise Oversight Committee
 Noise Oversight Committee July 22, 2015 Audio recordings are made of this meeting 1 Noise Oversight Committee July 22, 2015 Item 1 Review and Approve Draft Meeting Minutes Minutes from May 20, 2015 Noise
Noise Oversight Committee
 Noise Oversight Committee May 8, 2014 Audio/Video recordings are made of this meeting 1 Item 1 Review and Approve Draft Meeting Minutes Minutes from March 19, 2014 2 Item 2 Review of Operations Report
S p NA, illil MINNEAPOLIS- ST. PAUL INTERNATIONAL AIRPORT ( MSP) NOISE OVERSIGHT COMMITTEE ( NOC) RESOLUTION #
 NOISE OVERSIGHT COMMITTEE ( NOC) RESOLUTION #") NA, S p illil r, MINNEAPOLIS- ST. PAUL INTERNATIONAL AIRPORT ( MSP) NOISE OVERSIGHT COMMITTEE ( NOC) RESOLUTION # 01-2014 REGARDING FUTURE FAA PERFORMANCE- BASED NAVIGATION ( PBN)/ AREA NAVIGATION ( RNAV)
NA, S p illil r, MINNEAPOLIS- ST. PAUL INTERNATIONAL AIRPORT ( MSP) NOISE OVERSIGHT COMMITTEE ( NOC) RESOLUTION # 01-2014 REGARDING FUTURE FAA PERFORMANCE- BASED NAVIGATION ( PBN)/ AREA NAVIGATION ( RNAV)
2. 1:45 to 1:50 Review and Approval of November 18, 2009 NOC Meeting Minutes
 Minneapolis/St. Paul International Airport (MSP) Noise Oversight Committee (NOC) Meeting Agenda January 2, 21 1:3 P.M. Lindbergh Conference Room MAC General Office Building 64 28 th Avenue South Minneapolis,
Minneapolis-St. Paul International Airport Monthly Runway Use System Report. June 2015
 Minneapolis-St. Paul International Airport Monthly Runway Use System Report June 2015 Environment Department, Noise Program Office Metropolitan Airports Commission 6040 28th Avenue South, Minneapolis,
Minneapolis-St. Paul International Airport Monthly Runway Use System Report. June 2016
 Minneapolis-St. Paul International Airport Monthly Runway Use System Report June 2016 Environment Department, Noise Program Office Metropolitan Airports Commission 6040 28th Avenue South, Minneapolis,
Washington Dulles International Airport (IAD) Aircraft Noise Contour Map Update
 Aircraft Noise Contour Map Update") Washington Dulles International Airport (IAD) Aircraft Noise Contour Map Update Ultimate ASV, Runway Use and Flight Tracks 4th Working Group Briefing 8/13/18 Meeting Purpose Discuss Public Workshop input
Washington Dulles International Airport (IAD) Aircraft Noise Contour Map Update Ultimate ASV, Runway Use and Flight Tracks 4th Working Group Briefing 8/13/18 Meeting Purpose Discuss Public Workshop input
NOISE OVERSIGHT COMMITTEE January 16, Audio recordings are made of this meeting
 January 16, 2019 Audio recordings are made of this meeting ITEM 1 REVIEW AND APPROVAL OF NOVEMBER 28 TH MEETING MINUTES ITEM 2 REVIEW OF MONTHLY OPERATIONS REPORTS MSP OPERATIONS 31,371 JAN-15 29,038 35,119
Metropolitan Airports Commission (MAC)
") Metropolitan Airports Commission (MAC) Minneapolis-St. Paul International Airport (MSP) Noise Oversight Committee (NOC) MAC General Office Building Lindbergh Conference Room 6040 28 th Avenue South Minneapolis,
Metropolitan Airports Commission (MAC) Minneapolis-St. Paul International Airport (MSP) Noise Oversight Committee (NOC) MAC General Office Building Lindbergh Conference Room 6040 28 th Avenue South Minneapolis,
MSP NOISE OVERSIGHT COMMITTEE MEETING MINUTES Wednesday, 18 th of July 2018 at 1:30pm MAC General Office Lindbergh Conference Room
 Item 1 MSP NOISE OVERSIGHT COMMITTEE MEETING MINUTES Wednesday, 18 th of July 2018 at 1:30pm MAC General Office Lindbergh Conference Room Call to Order A regularly-scheduled meeting of the, having been
ACTION TRANSMITTAL
 Transportation Advisory Board of the Metropolitan Council of the Twin Cities ACTION TRANSMITTAL 2018-16 DATE: February 9, 2018 TO: Transportation Advisory Board FROM: Technical Advisory Committee PREPARED
Forecast of Aviation Activity
 DETROIT METROPOLITAN WAYNE COUNTY AIRPORT FAR PART 150 NOISE COMPATIBILITY STUDY UPDATE CHAPTER B FORECAST OF AVIATION ACTIVITY Forecast of Aviation Activity Introduction This chapter summarizes past aviation
Turn before Runway End
 Metropol litan Air rports Commission Runw way 12L Dep parture Turn before Runway End Runway 12L Departure Turn before Runway End Table of Contents Executive Summary... 2 Introduction... 3 Background...
2013 Airport Noise Plan of Action
 2013 Airport Noise Plan of Action Mendota Heights Airport Relations Commission Mendota Heights City Code (2-4-6) establishes the following powers and duties for the Mendota Heights Airport Relations Commission:
Massport and FAA RNAV Pilot Study Overview Briefing to Massport CAC. December 8, 2016
 Massport and FAA RNAV Pilot Study Overview Briefing to Massport CAC December 8, 2016 Contents FAA/Massport RNAV MOU Context Boston Logan Context FAA RNAV MOU, Overview Q&A 12/8/2016 2 FAA/Massport RNAV
PUBLIC INPUT MEETING COMMENTS/RESPONSES LOCATION: METROPOLITAN AIRPORTS COMMISSION GENERAL OFFICES 28 JULY 2015
 1. I am Bob Friedman. Thank you for the opportunity to speak before the MAC this evening. I live at 4237-22 Ave. So., on the north boarder of the Hiawatha Golf Course. My house is located "heading 360"
Federal Aviation Administration DCA. By: Terry Biggio, Vice President Air Traffic Services Date: June 18, Federal Aviation Administration
 DCA Presented to: Arlington County By: Terry Biggio, Vice President Air Traffic Services Date: June 18, 2015 Air Traffic Roles and Responsibilities As aviation technology advances, the FAA is putting in
Metropolitan Airports Commission (MAC)
") Metropolitan Airports Commission (MAC) Minneapolis-St. Paul International Airport (MSP) Noise Oversight Committee (NOC) MAC General Office Building Lindbergh Conference Room 6040 28 th Avenue South Minneapolis,
Metropolitan Airports Commission (MAC) Minneapolis-St. Paul International Airport (MSP) Noise Oversight Committee (NOC) MAC General Office Building Lindbergh Conference Room 6040 28 th Avenue South Minneapolis,
STUDY OF RUNWAY 12L AND 12R ARRIVAL OPERATIONS. September 2016
 STUDY OF RUNWAY 12L AND 12R ARRIVAL OPERATIONS September 2016 Environment Department, Noise Program Office Metropolitan Airports Commission 6040 28th Avenue South, Minneapolis, MN 55450 MetroAirports.org
WELCOME! FORT LAUDERDALE-HOLLYWOOD INTERNATIONAL AIRPORT 14 CFR PART 150 NOISE AND LAND USE COMPATIBILITY STUDY
 WELCOME! FORT LAUDERDALE-HOLLYWOOD INTERNATIONAL AIRPORT 14 CFR PART 150 NOISE AND LAND USE COMPATIBILITY STUDY Public Information Workshop November 2017 1 14 CFR Part 150 Overview Establishes the methodology
Portable Noise Monitor Report
 Portable Noise Monitor Report Chicago O Hare International Airport Site 2117 5843 N. Christiana Avenue, Chicago July 14, 217 through August 2, 217 USH5-ILH15-ILS8-CHI39 Visit the O Hare Noise webpage on
Portable Noise Monitor Report
 Portable Noise Monitor Report Chicago O Hare International Airport Site 299 93 Wilshire Avenue, Elk Grove Village June 27, 217 through July 1, 217 USH8-ILH55-ILS28 Visit the O Hare Noise webpage on the
CHAPTER 6 NOISE EXPOSURE
 CHAPTER 6 NOISE EXPOSURE FAA requires that the NEM submitted for review represent the aircraft noise exposure for the year of submittal (in this case 2008) and for a future year (2013 for OSUA). However,
POST-IMPLEMENTATION COMMUNITY IMPACT REVIEW
 POST-IMPLEMENTATION COMMUNITY IMPACT REVIEW RNAV STAR updates and RNP AR approaches at Edmonton International Airport NAV CANADA 77 Metcalfe Street Ottawa, Ontario K1P 5L6 January 2018 The information
Portable Noise Monitor Report
 Portable Noise Monitor Report Chicago O Hare International Airport Site 2198 5N67 Rochefort Lane, Wayne May 9, 218 through June 3, 218 USH6-ILH49-ILS25 Visit the O Hare Noise webpage on the Internet at
Planning, Development and Environment Committee
 Page 1 of 7 MEMORANDUM TO: Planning, Development and Environment Committee FROM: Neil Ralston, Airport Planner Airport Development (726-8129) SUBJECT: 2035 MSP LONG TERM COMPREHENSIVE PLAN FORECAST, FACILITY
Master Plan & Noise Compatibility Study Update
 Working Document-Subject to Change, March 2010 Master Plan & Noise Compatibility Study Update (14 CFR Part 150) TECHNICAL ADVISORY COMMITTEE March 24, 2010 Working Document-Subject to Change, March 2010
POST-IMPLEMENTATION COMMUNITY IMPACT REVIEW
 POST-IMPLEMENTATION COMMUNITY IMPACT REVIEW RNAV STAR updates and RNP AR approaches at Winnipeg James Armstrong Richardson International Airport NAV CANADA 77 Metcalfe Street Ottawa, Ontario K1P 5L6 November
PUBLIC INFORMATION WORKSHOP #4 / PUBLIC HEARING November 8 / 9, 2006
 PUBLIC INFORMATION WORKSHOP #4 / PUBLIC HEARING November 8 / 9, 2006 A Noise Compatibility Study, prepared under Part 150 of the Federal Aviation Regulations (FAR), is a voluntary program aimed at balancing
DCA Airport Noise. MWAA WG Dec 15, 2016
 DCA Airport Noise MWAA WG Dec 15, 2016 BACKGROUND FAA Next Gen noise Analyzed on macro level Data below 3K Ft under estimated community level impacts Primary focus has been on departure procedures 1 part
THE BURBANK-GLENDALE-PASADENA AIRPORT AUTHORITY S UPDATE REGARDING ITS NOISE IMPACT AREA REDUCTION PLAN AND ITS PART 161 STUDY FIRST QUARTER 2015
 THE BURBANK-GLENDALE-PASADENA AIRPORT AUTHORITY S UPDATE REGARDING ITS NOISE IMPACT AREA REDUCTION PLAN AND ITS PART 161 STUDY FIRST QUARTER 2015 Pursuant to the California Department of Transportation
Metropolitan Airports Commission (MAC)
") NOC Committee Members Metropolitan Airports Commission (MAC) Minneapolis-St. Paul International Airport (MSP) Noise Oversight Committee (NOC) MAC General Office Building Lindbergh Conference Room 6040
NOC Committee Members Metropolitan Airports Commission (MAC) Minneapolis-St. Paul International Airport (MSP) Noise Oversight Committee (NOC) MAC General Office Building Lindbergh Conference Room 6040
STAFF REPORT. Airport Land Use Plan Consistency Review: Santa Barbara Airport Master Plan. MEETING DATE: November 19, 2015 AGENDA ITEM: 7D
 STAFF REPORT SUBJECT: Airport Land Use Plan Consistency Review: Santa Barbara Airport Master Plan MEETING DATE: AGENDA ITEM: 7D STAFF CONTACT: Peter Imhof, Andrew Orfila RECOMMENDATION: Adopt findings
MSP NOISE OVERSIGHT COMMITTEE DRAFT MEETING MINUTES Wednesday, 19 th of September 2018 at 1:30pm MAC General Office Lindbergh Conference Room
 Item 1 MSP NOISE OVERSIGHT COMMITTEE DRAFT MEETING MINUTES Wednesday, 19 th of September 2018 at 1:30pm MAC General Office Lindbergh Conference Room Call to Order A regularly-scheduled meeting of the MSP
THE BURBANK-GLENDALE-PASADENA AIRPORT AUTHORITY S UPDATE REGARDING ITS NOISE IMPACT AREA REDUCTION PLAN AND ITS PART 161 STUDY SECOND QUARTER 2015
 THE BURBANK-GLENDALE-PASADENA AIRPORT AUTHORITY S UPDATE REGARDING ITS NOISE IMPACT AREA REDUCTION PLAN AND ITS PART 161 STUDY SECOND QUARTER 2015 Pursuant to the California Department of Transportation
Portable Noise Monitor Report
 Portable Noise Monitor Report Chicago O Hare International Airport Site 241 61 Grange Road, Elk Grove Village October 3, 215 through October 19, 215 USH8-ILH55-ILS28 Visit the O Hare Noise webpage on the
Study of Airport Winds and Aircraft Noise Complaints. January 2016
 Study of Airport Winds and Aircraft Noise Complaints January 216 Environment Department, Noise Program Office Metropolitan Airports Commission 64 28th Avenue South, Minneapolis, MN 5545 MetroAirports.org
Appendix B Ultimate Airport Capacity and Delay Simulation Modeling Analysis
 Appendix B ULTIMATE AIRPORT CAPACITY & DELAY SIMULATION MODELING ANALYSIS B TABLE OF CONTENTS EXHIBITS TABLES B.1 Introduction... 1 B.2 Simulation Modeling Assumption and Methodology... 4 B.2.1 Runway
THE BURBANK-GLENDALE-PASADENA AIRPORT AUTHORITY S UPDATE REGARDING ITS NOISE IMPACT AREA REDUCTION PLAN AND ITS PART 161 STUDY SECOND QUARTER 2017
 THE BURBANK-GLENDALE-PASADENA AIRPORT AUTHORITY S UPDATE REGARDING ITS NOISE IMPACT AREA REDUCTION PLAN AND ITS PART 161 STUDY SECOND QUARTER 2017 Pursuant to the California Department of Transportation
Portable Noise Monitor Report
 Portable Noise Monitor Report Chicago O Hare International Airport Site 2114 5516 N. Neenah Avenue, Chicago July 12, 217 through August 9, 217 USH5-ILH19-ILS1-CHI45 Visit the O Hare Noise webpage on the
Appendix A. Meeting Coordination. Appendix A
 Appendix A Meeting Coordination Appendix A Philadelphia International Airport Noise Compatibility Program Update FAR Part 150 Noise Compatibility Program Update Report Prepared by: DMJM Aviation AECOM
Summary of Committee Discussion/Questions Metropolitan Transportation Services Senior Planner Russ Owen presented this item.
 Committee Report Business Item No. 2017-191 Transportation Committee For the Metropolitan Council meeting of September 13, 2017 Subject: Final Crystal Airport 2035 Long Term Comprehensive Plan (LTCP) Proposed
Noise Programs & NextGen Briefing. Stan Shepherd, Manager Airport Noise Programs
 Noise Programs & NextGen Briefing Stan Shepherd, Manager Airport Noise Programs 1 Presentation Overview Noise Information Hotline Increased Operations Economic Impacts Noise Contours Noise Mitigation Programs
Minneapolis-St. Paul International Airport Noise Oversight Committee (NOC)
") Minneapolis-St. Paul International Airport Noise Oversight Committee (NOC) NOC Committee Members Jeffrey Hart Co-Chair (Delta Air Lines) Dianne Miller Co-Chair, City of Eagan Representative (City of Eagan)
Minneapolis-St. Paul International Airport Noise Oversight Committee (NOC) NOC Committee Members Jeffrey Hart Co-Chair (Delta Air Lines) Dianne Miller Co-Chair, City of Eagan Representative (City of Eagan)
Executive Summary. MASTER PLAN UPDATE Fort Collins-Loveland Municipal Airport
 Executive Summary MASTER PLAN UPDATE Fort Collins-Loveland Municipal Airport As a general aviation and commercial service airport, Fort Collins- Loveland Municipal Airport serves as an important niche
2. 1:35 to 1:50 MSP Long-Term Comprehensive Plan Update. 3. 1:50 to 2:05 Update on Runway 17 RNAV Departure Procedure 24-Hour Trial
 Minneapolis/St. Paul International Airport (MSP) Noise Oversight Committee (NOC) Meeting Agenda May 20, 2009 1:30 P.M. Lindbergh Conference Room MAC General Office Building 6040 28 th Avenue South Minneapolis,
1.0 Project Background Mission Statement and Goals Objectives of this Sustainable Master Plan
 TABLE OF CONTENTS CHAPTER 1 INTRODUCTION 10 Project Background 1-1 11 Mission Statement and Goals 1-1 12 Objectives of this Sustainable Master Plan 1-2 CHAPTER 2 INVENTORY 20 Airport Background 2-1 201
Draft Concept Alternatives Analysis for the Inaugural Airport Program September 2005
 Draft Concept Alternatives Analysis for the Inaugural Airport Program September 2005 Section 3 - Refinement of the Ultimate Airfield Concept Using the Base Concept identified in Section 2, IDOT re-examined
APPENDIX D MSP Airfield Simulation Analysis
 APPENDIX D MSP Airfield Simulation Analysis This page is left intentionally blank. MSP Airfield Simulation Analysis Technical Report Prepared by: HNTB November 2011 2020 Improvements Environmental Assessment/
Buchanan Field. Airport Planning Program. FAR Part 150 Meeting. September 28, Master Plan FAR Part 150 Noise Study Strategic Business Plan
 Airport Planning Program Master Plan FAR Part 150 ise Study Strategic Business Plan FAR Part 150 Meeting September 28, 2006 Agenda Introduction Part 150 Study Working Paper Two Operational Alternatives
Technical Report. Aircraft Noise Analysis. Portola Valley and Woodside, California. July Prepared by: Aircraft Noise Abatement Office
 Technical Report Aircraft Noise Analysis Portola Valley and Woodside, California Prepared by: San Francisco International Airport P.O. Box 8097 San Francisco, California 94128 (650) 821-5100 Introduction
14 CFR PART 150 NOISE AND LAND USE COMPATIBILITY STUDY. Technical Committee Meeting #2 August 23, 2017
 14 CFR PART 150 NOISE AND LAND USE COMPATIBILITY STUDY Technical Committee Meeting #2 August 23, 2017 1 Agenda Introductions Review of the Role of the TC Meeting Facilitator Review of TC Meeting No.1 Data
FRENCH VALLEY AIRPORT (F70) Sky Canyon Dr. Murrieta, CA. Phone: Riverside FAA FSDO Complaint Line: (951)
 Sky Canyon Dr. Murrieta, CA. Phone: Riverside FAA FSDO Complaint Line: (951)") FRENCH VALLEY AIRPORT (F70) 37600 Sky Canyon Dr. Murrieta, CA Phone: 951-600-7297 Riverside FAA FSDO Complaint Line: (951) 276-6701 Visit the F70 website for additional information regarding the airport
FRENCH VALLEY AIRPORT (F70) 37600 Sky Canyon Dr. Murrieta, CA Phone: 951-600-7297 Riverside FAA FSDO Complaint Line: (951) 276-6701 Visit the F70 website for additional information regarding the airport
STAFF REPORT. Airport Land Use Consistency Determination Betteravia Plaza. MEETING DATE: January 21, 2016 AGENDA ITEM: 8D
 STAFF REPORT SUBJECT: Airport Land Use Consistency Determination Betteravia Plaza MEETING DATE: AGENDA ITEM: 8D STAFF CONTACT: Andrew Orfila RECOMMENDATION: Adopt findings for the Betteravia Plaza project
POST-IMPLEMENTATION COMMUNITY IMPACT REVIEW
 POST-IMPLEMENTATION COMMUNITY IMPACT REVIEW RNAV STAR updates and RNP AR approaches at Halifax Stanfield International Airport NAV CANADA 77 Metcalfe Street Ottawa, Ontario K1P 5L6 November 2017 The information
NextGen: New Technology for Improved Noise Mitigation Efforts: DFW RNAV Departure Procedures
 NextGen: New Technology for Improved Noise Mitigation Efforts: DFW RNAV Departure Procedures DFW International Airport Sandy Lancaster, Manager Noise Compatibility October 13, 2008 OUTLINE About DFW Airport
Memorandum. Federal Aviation Administration. Date: June 19, Richard Doucette, Environmental Protection Specialist. From: To:
 Federal Aviation Administration Memorandum Date: June 19, 2008 From: To: Subject: Richard Doucette, Environmental Protection Specialist LaVerne Reid, Airports Division Manager John Donnelly, Regional Counsel
CHAPTER 1 EXECUTIVE SUMMARY
 CHAPTER 1 EXECUTIVE SUMMARY 1 1 EXECUTIVE SUMMARY INTRODUCTION William R. Fairchild International Airport (CLM) is located approximately three miles west of the city of Port Angeles, Washington. The airport
Martin County Airport / Witham Field Noise Abatement Departure Profile (NADP) Demonstration Technical Report March 2010
 Demonstration Technical Report March 2010") Martin County Airport / Witham Field Noise Abatement Departure Profile (NADP) Demonstration Technical Report March 2010 Prepared for: Federal Aviation Administration (FAA) Orlando Airport District Office
Martin County Airport / Witham Field Noise Abatement Departure Profile (NADP) Demonstration Technical Report March 2010 Prepared for: Federal Aviation Administration (FAA) Orlando Airport District Office
TWENTY-SECOND MEETING OF THE ASIA/PACIFIC AIR NAVIGATION PLANNING AND IMPLEMENTATION REGIONAL GROUP (APANPIRG/22)
") INTERNATIONAL CIVIL AVIATION ORGANIZATION TWENTY-SECOND MEETING OF THE ASIA/PACIFIC AIR NAVIGATION PLANNING AND IMPLEMENTATION REGIONAL GROUP (APANPIRG/22) Bangkok, Thailand, 5-9 September 2011 Agenda
INTERNATIONAL CIVIL AVIATION ORGANIZATION TWENTY-SECOND MEETING OF THE ASIA/PACIFIC AIR NAVIGATION PLANNING AND IMPLEMENTATION REGIONAL GROUP (APANPIRG/22) Bangkok, Thailand, 5-9 September 2011 Agenda
APPROVED MINUTES FLYING CLOUD AIRPORT ADVISORY COMMISSION
 APPROVED MINUTES FLYING CLOUD AIRPORT ADVISORY COMMISSION THURSDAY, SEPTEMBER 13, 2012 COMMISSION MEMBERS PRESENT: COMMISSION MEMBERS ABSENT: STUDENT REPRESENTATIVES: COMMISSION STAFF PRESENT: VISITORS:
Draft Concept Alternatives Analysis for the Inaugural Airport Program September 2005
 Draft Concept Alternatives Analysis for the Inaugural Airport Program September 2005 Section 1 - Introduction This report describes the development and analysis of concept alternatives that would accommodate
Airlake Airport 2035 Long Term Comprehensive Plan (LTCP)
") Airlake Airport 2035 Long Term Comprehensive Plan (LTCP) Public Informational Meetings August 9 & 10, 2017 Draft LTCP Overview Briefing Agenda Airport Role & Context Existing Conditions & Previous Plan
Airlake Airport 2035 Long Term Comprehensive Plan (LTCP) Public Informational Meetings August 9 & 10, 2017 Draft LTCP Overview Briefing Agenda Airport Role & Context Existing Conditions & Previous Plan
Table of Contents. Master Plan March 2014 TOC i Spokane International Airport
 Table of Contents Page Chapter 1 Inventory 1. Introduction... 1 1 1.1 Community Profile... 1 2 1.1.1 Location and Setting... 1 1 1.1.2 Climate... 1 2 1.1.3 Socioeconomic Conditions... 1 5 1.1.4 Area Land
Portable Noise Monitor Report
 Portable Noise Monitor Report Chicago O Hare International Airport Site 213 475 W. Hutchinson Street, Chicago April 8, 217 through May 3, 217 USH5-ILH19-ILS1-CHI45 Visit the O Hare Noise webpage on the
Airport Noise Management System
 4 th Quarter 2009 Quarterly Report Airport Noise Management System City of Chicago Department of Aviation Visit the Community Noise Resource Center on the Internet at www.flychicago.com Airport Noise Management
According to FAA Advisory Circular 150/5060-5, Airport Capacity and Delay, the elements that affect airfield capacity include:
 4.1 INTRODUCTION The previous chapters have described the existing facilities and provided planning guidelines as well as a forecast of demand for aviation activity at North Perry Airport. The demand/capacity
Overview of Boston Logan Operations and Noise from Overflights. Presentation to Massport Board March 19, 2015
 Overview of Boston Logan Operations and Noise from Overflights Presentation to Massport Board March 19, 2015 Contents How the Airport Operates Massport s Noise Abatement Program for Logan Recent Trends
October 2014 BELLINGHAM INTERNATIONAL AIRPORT MASTER PLAN PRESENTATION
 October 2014 BELLINGHAM INTERNATIONAL AIRPORT MASTER PLAN PRESENTATION The Master Plan Process Inventory Of Existing Conditions Complete. Forecasts Of Aviation Demand Complete. Facility Requirements Complete.
LAX Community Noise Roundtable. Aircraft Noise 101. November 12, 2014
 LAX Community Noise Roundtable Aircraft Noise 101 November 12, 2014 Overview Roles and Responsibilities for Aircraft Noise Relevant Federal Regulations Relevant California Regulations Aircraft Noise Metrics
Reliever Airports: NOISE ABATEMENT PLAN Flying Cloud Airport (FCM)
") Reliever Airports: NOISE ABATEMENT PLAN Flying Cloud Airport (FCM) INTRODUCTION The Noise Abatement Plan (FCM Plan) for the Flying Cloud Airport has been prepared in recognition of the need to make the
Reliever Airports: NOISE ABATEMENT PLAN Flying Cloud Airport (FCM) INTRODUCTION The Noise Abatement Plan (FCM Plan) for the Flying Cloud Airport has been prepared in recognition of the need to make the
Technical Report. Aircraft Overflight and Noise Analysis. Brisbane, California. December Prepared by:
 Aircraft Noise Abatement Office Technical Report Aircraft Overflight and Noise Analysis Brisbane, California Prepared by: P.O. Box 8097 San Francisco, California 94128 (650) 821-5100 Introduction In response
STAFF REPORT. Airport Land Use Plan Consistency Review: Old Town Village Mixed Use Project City of Goleta. MEETING DATE: June 18, 2015 AGENDA ITEM: 5M
 STAFF REPORT SUBJECT: Airport Land Use Plan Consistency Review: Old Town Village Mixed Use Project City of Goleta MEETING DATE: AGENDA ITEM: 5M STAFF CONTACT: Peter Imhof, Andrew Orfila RECOMMENDATION:
Noise Oversight Committee
 Noise Oversight Committee May 20, 2015 Audio recordings are made of this meeting Noise Oversight Committee May 20, 2015 Item 1 Review and Approve Draft Meeting Minutes Minutes from January 21 Noise Oversight
Runway Length Analysis Prescott Municipal Airport
 APPENDIX 2 Runway Length Analysis Prescott Municipal Airport May 11, 2009 Version 2 (draft) Table of Contents Introduction... 1-1 Section 1 Purpose & Need... 1-2 Section 2 Design Standards...1-3 Section
STUDY OVERVIEW MASTER PLAN GOALS AND OBJECTIVES
 INTRODUCTION An Airport Master Plan provides an evalua on of the airport s avia on demand and an overview of the systema c airport development that will best meet those demands. The Master Plan establishes
CHAPTER 1: INTRODUCTION
 CHAPTER 1: INTRODUCTION Purpose and Scope The information presented in this report represents the study findings for the 2016 Ronan Airport Master Plan prepared for the City of Ronan and Lake County, the
St. Paul Downtown Airport (STP)
") Reliever Airports: NOISE ABATEMENT PLAN St. Paul Downtown Airport (STP) 1 INTRODUCTION The noise abatement plan for the St. Paul Downtown Airport (STP) was prepared in recognition of the need to make the
Reliever Airports: NOISE ABATEMENT PLAN St. Paul Downtown Airport (STP) 1 INTRODUCTION The noise abatement plan for the St. Paul Downtown Airport (STP) was prepared in recognition of the need to make the
APPENDIX H 2022 BASELINE NOISE EXPOSURE CONTOUR
 APPENDIX H 2022 BASELINE NOISE EXPOSURE CONTOUR This appendix sets forth the detailed input data that was used to prepare noise exposure contours for 2022 Baseline conditions. H.1 DATA SOURCES AND ASSUMPTIONS
Alternatives. Introduction. Range of Alternatives
 Alternatives Introduction Federal environmental regulations concerning the environmental review process require that all reasonable alternatives, which might accomplish the objectives of a proposed project,
FIRST PUBLIC WORKSHOP
 Lambert-St. Louis International Airport Master Plan & 14 CFR Part 150 Noise Compatibility Plan Update FIRST PUBLIC WORKSHOP February 12 th 2009 Why prepare a Master Plan Update Now? Last full Master Plan
1.0 OUTLINE OF NOISE ANALYSIS...3
 Table of Contents 1.0 OUTLINE OF NOISE ANALYSIS...3 2.0 METHODOLOGY...3 2.1 BACKGROUND...3 2.2 COMPUTER MODELING...3 3.0 EXISTING NOISE ENVIRONMENT...4 3.1 EXISTING SANTA MONICA MUNICIPAL AIRPORT NOISE...4
Norman Y. Mineta San José International Airport 2017 Annual Noise Report
 Norman Y. Mineta San José International Airport 2017 Annual Noise Report Annual Noise Report for Norman Y. Mineta San José International Airport Introduction and Purpose The purpose of this annual report
Massport and FAA RNAV Pilot Study Overview Public Briefing. February 22, 2017 State Transportation Bld. Boston, MA
 Massport and FAA RNAV Pilot Study Overview Public Briefing February 22, 2017 State Transportation Bld. Boston, MA As of 02/10/2017 Agenda Welcoming Remarks Tom Glynn (Massport CEO) David Carlon (Massport
Portland International Jetport FAR Part 150 Update
 Portland International Jetport FAR Part 150 Update Part 150 Noise Advisory Committee Meeting 5 February 2003 Harris Miller Miller & Hanson Inc. In association with: Vanasse Hangen Brustlin, Inc. Simat,
JOSLIN FIELD, MAGIC VALLEY REGIONAL AIRPORT DECEMBER 2012
 1. Introduction The Federal Aviation Administration (FAA) recommends that airport master plans be updated every 5 years or as necessary to keep them current. The Master Plan for Joslin Field, Magic Valley
TRB and ACRP Research Updates: Practical Application
 TRB and ACRP Research Updates: Practical Application 2014 ACI Environmental Affairs Conference Danielle J. Rinsler, AICP FAA Office Airports, Airport Planning and Environmental Division Baltimore, MD Advisory
TORONTO PEARSON INTERNATIONAL AIRPORT NOISE MANAGEMENT
 TORONTO PEARSON INTERNATIONAL AIRPORT NOISE MANAGEMENT Noise and the GTAA The GTAA is sensitive to the issue of aircraft noise and how it affects our neighbours. Since assuming responsibility for Toronto
Chapter 1 Introduction and Project Overview
 Chapter 1 Introduction and Project Overview Kittitas County in cooperation with the Federal Aviation Administration (FAA) is updating the Airport Master Plan for Bowers Field Airport (FAA airport identifier