Merge or Perish: Irish Aviation in a Rapidly Changing Global Market
|
|
|
- Andra Gardner
- 5 years ago
- Views:
Transcription

1 Merge or Perish: Irish Aviation in a Rapidly Changing Global Market Professor Aisling Reynolds-Feighan UCD School of Economics UL Kemmy Business School Third Annual Tourism Policy Workshop, November 2-4, 2012
2 Presentation Overview Global trends in air transport Airline networks Competition Industry Consolidation & Spatial Concentration European mergers Aer Lingus & Ryanair Prospects for the Irish Market Funding provided by UCD Centre for Regulation & Governance & UCD School of Economics
3 Global trends in air transport Air Traffic Growth key drivers Economic Growth Rapid urbanisation of global population (67% by 2050) Concentration of population and of economic activities in space has driven economic growth and development Acted as the focal points for the developing global air transport network Industry forecasts average case: long run growth rate of 4-5% to 2030
4
5 Air Traffic Growth in 2000s Rapid Growth in European and Asian Markets Focused on intra-continental traffic Still relatively small inter-continental traffic

6
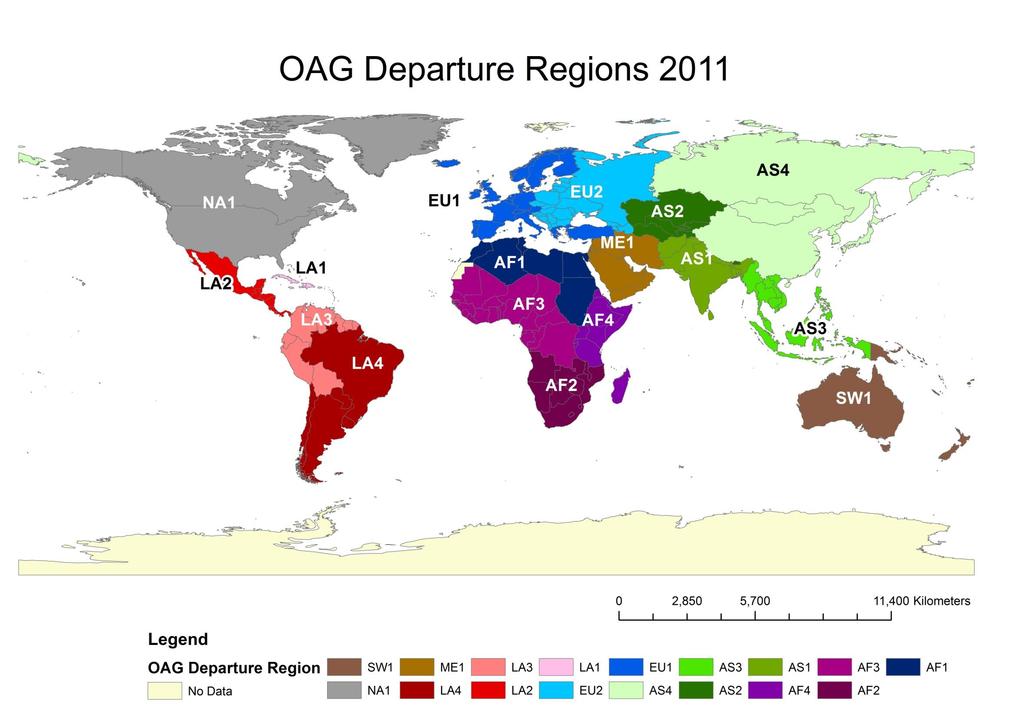
7 Arrival Region Millions Global Distribution of Departure Passenger Air Traffic Movements, SW NA ME LA EU AF AS EU LA ME NA SW AS AF Departure Region AF AS EU LA ME NA SW

8 Arrival Region Millions Global Distribution of Departure Passenger Air Traffic Movements, SW NA ME LA EU AF AS EU LA ME NA SW AS AF Departure Region AF AS EU LA ME NA SW
9 How important is air transport to Ireland?
10 PASSENGER-KILOMETRES PERFORMED (millions), Very Important! Passenger-kilometres performed (millions) Total Operations (Dom & Int'l) Rank ICAO Annual Report of the Council, 2011
 Total")
11 PASSENGER-KILOMETRES PERFORMED (millions), Very Important! Ranking based on traffic from carrier s country of registration Passenger-kilometres performed (millions) Total Operations (Dom & Int'l) Rank ICAO Annual Report of the Council, 2011
12 ICAO Annual Report of the Council, 2011 PASSENGER-KILOMETRES PERFORMED (millions) Total Operations (international and domestic) Country or group Rank % Change International Operations Only Rank % Change Pop Rank United States China United Kingdom Germany United Arab Emirates France Russian Federation Canada Japan Ireland India Singapore Brazil
13 ICAO Annual Report of the Council, 2011 Total Operations (international and domestic) Country or group Rank % Change PASSENGER-KILOMETRES PERFORMED (millions) International Operations Only Rank % Change Pop Rank United States China United Kingdom Germany United Arab Emirates France Russian Federation Canada Japan Ireland India Singapore Brazil Australia Republic of Korea Spain Netherlands Turkey Indonesia Thailand Qatar
14 BRICs: Rapidly growing air transport markets domestic & intra-regional focus
15 ICAO Annual Report of the Council, 2011 Total Operations (international and domestic) Country or group Rank % Change PASSENGER-KILOMETRES PERFORMED (millions) International Operations Only Rank % Change Pop Rank United States China United Kingdom Germany United Arab Emirates France Russian Federation Canada Japan Ireland India Singapore Brazil Australia Republic of Korea Spain Netherlands Turkey Indonesia Thailand Qatar
16 Seats Available Number of Routes Millions Top 10 European Carriers, 2010 Low Cost Carriers Ryanair Lufthansa Air France Easyjet British Airways Turkish Airlines Air Berlin Iberia SAS Airlines KLM 0 Total Seats Available Number of Routes
17 Number of Non-Stop Routes by Major Region, Growth in European Routes Driven by LCCs AF AS EU LA ME NA SW
18 600 Number of Airports with Jet Services by Major Global Regions, AF AS EU LA ME NA SW
19
20 Large number of routes from European airports

21 Dominance of Many of Largest Airports by Single Carrier
22 Thousands Departure Movements for Top 10 Carriers in Each Major Region, 2010 Huge scale of US Carriers Ryanair Airline Code Carrier Region: AF AS EU LA ME NA SW
23 Total Available Seats Number of Carriers Millions US & EU27 Number of Carriers and Seating Capacity US Market: Rationalisation of capacity Merger activity Total Available EU27 Seats Total Available US Seats Number of EU Carriers Number of US Carriers 23
24 Total Available Seats Number of Carriers Millions US & EU27 Number of Carriers and Seating Capacity European Market consolidating Total Available EU27 Seats Total Available US Seats Number of EU Carriers Number of US Carriers 24
25 Airline networks Academic literature dominated by US view: Huband-Spoke networks with transferring passengers Airline networks: production plan and products Easily change networks by adding or cutting links and nodes Airport fortunes dependent on decisions of carriers investments riskier in liberalised market environments Dramatic increases or decreases in air traffic because of carrier decisions
26 Ratio of All Route Offerings to Non-Stop Segments Operated Year AF AS EU LA ME NA SW
27 Ratio of All Route Offerings to Non-Stop Segments Operated Year AF AS EU LA ME NA SW European carriers offering largely direct routings


28 Middle Eastern Carrier Networks Emirates Ethihad Dubai Abu Dhabi Saudi Arabian Doha Qatar


29 Asian Carrier Networks Air China China Southern China Eastern Japan Airlines


30 North American Carriers Delta Air Lines Southwest American Airlines JetBlue


31 European Carrier Networks Air France Lufthansa BA Ryanair Turkish Airlines
32 European carriers nationally focused: small distance between top airports
33 Top 5 airports served by selected European Carriers North American Regional Science Association Meetings, San Francisco, Nov 18-21,
34 Top 5 airports served by selected European Carriers North American Regional Science Association Meetings, San Francisco, Nov 18-21,
35 Competition Liberalisation rapid expansion of services; Rationalisation and merger activity: reducing capacity and number of carriers in markets Europe: further consolidation expected; ownership issues & external traffic rights prevented consolidation in 1990s Reality is that most airline routes have one carrier
36 Competition on European & North American Air Routes, 2010 Number of Carriers* Operating on Routes Region EU EU NA USA * Includes all international carriers 36
37 Mergers: the big trend
38 Merger Candidates Merger Completed Resulting Entity Southwest Airlines / AirTran Airways 2/5/2011 Southwest Airlines SkyWest / Atlantic Southeast Airlines / ExpressJet Airlines 11/15/2010 SkyWest / ASA United Airlines / Continental Airlines 1/10/2010 United Airlines Pinnacle Airlines / Mesaba Airlines 1/7/2010 Pinnacle Airlines / Mesaba Airlines Delta Air Lines / Northwest Airlines 12/31/2009 Delta Air Lines Republic Airways / Frontier Airlines 1/10/2009 Republic Airways Republic Airways / Midwest Airlines 7/31/2009 Republic Airways Pinnacle Airlines / Colgan Air 1/18/2007 Pinnacle Airlines / Colgan Air US Airways / America West Airlines 9/27/2005 US Airways SkyWest / Atlantic Southeast Airlines 8/9/2005 SkyWest / ASA Republic Airways / Shuttle America 9/5/2005 Republic Airways American Airlines / TWA 9/4/2001 American Airlines Delta Air Lines / Comair 10/22/1999 Delta Air Lines Delta Air Lines / Atlantic Southeast Airlines 3/22/1999 Delta Air Lines American Airlines / Reno Air 1/2/1999 American Airlines AirTran Airways / Valujet 11/17/1997 AirTran Airways 38
39 European Mergers Cross-border mergers permitted among the largest carriers Only 2 blocked: Irish & Greek carriers: concerns about dominance in the market
40 Date Merger Event 26 January 2011 Commission blocks proposed merger between Aegean Airlines and Olympic Air 27 July 2010 Commission approves merger between United Air Lines and Continental Airlines 14 July 2010 Commission approves merger between British Airways and Iberia 28 August 2009 Commission clears proposed takeover of Austrian Airlines by Lufthansa, subject to conditions 22 June 2009 Commission clears proposed takeover of SN Brussels Airlines by Lufthansa, subject to conditions 14 May 2009 Commission approves acquisition of British Midland by Lufthansa 09 January 2009 Commission clears Iberia's proposed acquisition of Vueling and Clickair, subject to conditions 17 December 2008 Commission clears proposed take-over of Martinair by KLM 06 August 2008 Commission approves acquisition of Northwest Airlines by Delta Airlines 27 June 2007 Commission prohibits Ryanair s proposed takeover of Aer Lingus 22 December 2005 Commission clears planned acquisition of control over Eurowings by Lufthansa, subject to conditions 05 July 2005 Commission clears planned acquisition of Swiss by Lufthansa, subject to conditions 11 February 2004 Commission clears merger between Air France and KLM subject to conditions 40


41 Dublin Airport: All European Routes by One carrier 2 Carriers 3 Carriers 3% 20% Number of Competitors % 2% 8% 12% One carrier 2 Carriers 3 Carriers 4 Carriers 5 Carriers 6 Carriers 0% 5% %
42 % Routes with One Carrier Cork Paris-Orly Dublin Amsterdam Paris-CDG Madrid , , , , European Departure Movements European Airports DUB ORK SNN

43 Number of Routes 120 Number of Routes at European Airports by Number of Carriers, AMS CDG DUB FRA MAD LHR ORK One carrier 2 Carriers 3 Carriers 4 Carriers 5 Carriers 6 Carriers


44 Aer Lingus 2010, European Routes 13% 3% 2% 1% 50% 31% Aer Lingus 2010 Dublin Routes One carrier 2 Carriers 3 Carriers 4 Carriers 5 Carriers 6 Carriers 15% 2% 46% 37% One carrier 2 Carriers 3 Carriers 4 Carriers

45 Ryanair 2010, European Routes 11% 6% 2% 1% 0% 80% One carrier 2 Carriers 3 Carriers 4 Carriers 5 Carriers 6 Carriers 68% 23% Ryanair 2010 Dublin Routes 9% One carrier 2 Carriers 3 Carriers


46 Lufthansa Air France 12% 6% 1% 1% 10% 6% 1% 1% 54% 24% 58% 26% One carrier 2 Carriers 3 Carriers 4 Carriers 5 Carriers 6 Carriers Iberia One carrier 2 Carriers 3 Carriers 4 Carriers 5 Carriers 6 Carriers BA 5% 3% 2% 9% 3% 2% 27% 16% 21% 52% 22% One carrier 2 Carriers 3 Carriers 4 Carriers 5 Carriers 6 Carriers 38% One carrier 2 Carriers 3 Carriers 4 Carriers 5 Carriers 6 Carriers
47 Ryanair-Aer Lingus Merger Cons Merged company dominant carrier at Dublin Airport Competition eliminated from routes
48 Ryanair-Aer Lingus Merger Pros Strong Irish Carrier Major player in European Market vital for accessibility Access to secondary airports but also capital city primary airports network for long haul route development Management, fleet ownership & expertise likely to continue to be based in Ireland ME or EU Carrier takeover of Aer Lingus could result in downgrading to feeder services to another European hub - End up with just one Irish carrier anyway, but with reduced access to primary EU airports
49 Prospects for the Irish Market Difficult economic circumstances will affect air traffic prospects Completion of the IUM network has changed the geography of Ireland Regional airports played an important role in 1990s & 2000s: difficult to survive without subvention hard to justify now Shannon, Cork & Kerry: significantly overlapping hinterland & now closer to Dublin
50 Conclusion Air accessibility is vital for an export-oriented Island economy Demonstrated advantages to having a strong European-focused Irish airline European consolidation will continue & give rise to further spatial concentration of air traffic Ireland must think of long term strategic needs!
Introduction: Airline Industry Overview Dr. Peter Belobaba Presented by: Alex Heiter & Ali Hajiyev
 Introduction: Airline Industry Overview Dr. Peter Belobaba Presented by: Alex Heiter & Ali Hajiyev Istanbul Technical University Air Transportation Management M.Sc. Program Network, Fleet and Schedule
Athens International Airport. The 2007 market performance
 Athens International Airport The 2007 market performance Great overall performance 70 Airlines 15 New Aer Lingus Air Baltic Air China Carpatair Centralwings Clickair Continental Airlines Finnair Ilyich-Avia
Punctuality for november 2018 per airline
 for november 2018 per airline Departures scheduled Aegean s S.A. Aeroflot Russian s 21 21 0 100% 4 81% 31 60 60 0 100% 5 92% 24 Air Baltic 86 86 0 100% 3 97% 58 Air Canada 14 14 0 100% 8 43% 49 Air China
Statistical Report Calendar Year 2013
 Statistical Report Year 213 Houston Airports P.O. Box 616 Houston, TX 7725-16 Request for User Input The intent of the monthly and annual statistical reports is to provide data that is both relevant and
Airline Performance and Capacity Strategies Dr. Peter Belobaba
 Airline Performance and Capacity Strategies Dr. Peter Belobaba Istanbul Technical University Air Transportation Management M.Sc. Program Network, Fleet and Schedule Strategic Planning Module 18 : 13 March
THE IMPACT OF OPEN SKIES FOR IB. Strategy and Corporate Development Direction
 THE IMPACT OF OPEN SKIES FOR IB Strategy and Corporate Development Direction April 17th, 2008 Index OPEN SKIES 1. Brief historic analysis of Open Skies First steps and negotiations Major constraints and
Punctuality for june 2015 per airline
 for june 2015 per airline Departures scheduled Adria Airways 16 16 0 100% 6 63% 28 Aegean s S.A. 23 23 0 100% 3 87% 24 Aer Lingus 30 30 0 100% 13 57% 45 Aeroflot Russian s 60 60 0 100% 10 83% 43 Air Baltic
Permitting foreign ownership and control. Potential effects of a further deregulation of air transport markets in Europe
 Permitting foreign ownership and control Potential effects of a further deregulation of air transport markets in Europe Konferenz Verkehrsökonomik und Verkehrspolitik Berlin, 2. Juni 2016 Prof. Dr. Frank
OAG FACTS January 2013
 OAG FACTS January 2013 OAG s latest airline capacity data shows that total scheduled airline capacity data is expected to increase by 3% in January 2013. Carriers globally will add 8.5 million extra seats
Punctuality for april 2018 per airline
 for april 2018 per airline Departures scheduled **) having less than 10 operations. Adria Airways 29 29 0 100% 10 66% 47 Aegean S.A. Aeroflot Russian 16 16 0 100% 0 100% 0 60 60 0 100% 2 97% 24 Air Baltic
Punctuality for september 2018 per airline
 for september 2018 per airline Departures scheduled Adria Airways 31 29 2 94% 12 61% 57 Aegean s S.A. Aeroflot Russian s 24 24 0 100% 6 75% 28 60 60 0 100% 2 97% 24 Air Baltic 90 90 0 100% 6 93% 25 Air
Punctuality for october 2017 per airline
 for october 2017 per airline Departures scheduled **) having less than 10 operations. Adria Airways 22 22 0 100% 5 77% 33 Aegean S.A. Aeroflot Russian 29 29 0 100% 7 76% 26 62 62 0 100% 9 85% 24 Air Baltic
Malaysia s s 2020 Vision
 Kuala Lumpur International Airport: The New Southeast Asia Airline Hub? Lev Pinelis, M.S. Transportation December 7 th, 2004 1.231 Airport Systems Planning, Design, and Management Malaysia s s 2020 Vision
Punctuality for june 2014 per airline
 for june 2014 per airline Departures scheduled **) having less than 10 operations. Adria Airways 17 17 0 100% 4 76% 32 Aegean S.A. 12 12 0 100% 9 25% 39 Aer Lingus 30 30 0 100% 10 67% 34 Aeroflot Russian
Punctuality for may 2018 per airline
 for may 2018 per airline Departures scheduled **) having less than 10 operations. Adria Airways 33 28 5 85% 9 73% 49 Aegean S.A. Aeroflot Russian 23 23 0 100% 5 78% 25 66 63 3 95% 10 85% 53 Air Baltic
Advisory Committee For Aviation Consumer Protection Washington, DC
 The Impact Of Airline Mergers And Consolidation On Consumers And The Aviation Industry Advisory Committee For Aviation Consumer Protection Washington, DC October 29, 2014 Deborah McElroy Executive Vice
Punctuality for july 2015 per airline
 for july 2015 per airline Departures scheduled **) having less than 10 operations. Acd/Ad Hoc 10 0 10 0% 0 100% 0 Adria Airways 18 18 0 100% 5 72% 25 Aegean S.A. 27 27 0 100% 12 56% 30 Aer Lingus 34 31
AVOIDING TURBULENCE. The risks and opportunities of airline consolidation for corporate travel programs
 AVOIDING TURBULENCE The risks and opportunities of airline consolidation for corporate travel programs Introduction Whatever role you play in your corporate travel organisation, offering the best experience
air traffic statistics
 July 23 air traffic statistics Prepared by the Office of Finance Department of Internal Controls, Compliance and Financial Strategy Air Traffic Summary July 23 Below is a summary of the July 23 Air Traffic
Punctuality for february 2018 per airline
 for february 2018 per airline Departures scheduled **) having less than 10 operations. Adria Airways 20 19 1 95% 0 100% 0 Aegean S.A. Aeroflot Russian 12 12 0 100% 4 67% 21 57 56 1 98% 8 86% 49 Air Baltic
Global Aviation Monitor (GAM)
") Global Aviation Monitor (GAM) Analysis and Short Term Outlook of Global, European and German Air Transport Main Results of Global Air Transport Supply Analysis and Outlook Background: Covers about 3,500
Global Aviation Monitor (GAM) Analysis and Short Term Outlook of Global, European and German Air Transport Main Results of Global Air Transport Supply Analysis and Outlook Background: Covers about 3,500
THE STATE OF EUROPEAN AIRLINE COMPETITION IN THE ERA OF CONSOLIDATION
 THE STATE OF EUROPEAN AIRLINE COMPETITION IN THE ERA OF CONSOLIDATION Dr Nigel Dennis Senior Research Fellow Transport Studies Group University of Westminster 1 Ryanair, easyjet, Air Berlin and Emirates
Punctuality for june 2018 per airline
 Punctuality for june 2018 per airline Departures scheduled *) Delayed more than 15 minutes. **) s having less than 10 operations. Planned Cancelled Delayed *) Punctuality Avg. delay (min) Adria Airways
Half Year Traffic Highlights
 Half Year Traffic Highlights Presented by CEO, ALAN BORG 1 Presentation Contents 1. Traffic Highlights 2015 2. Route Development 2015 3. Industry Indicators 2015 4. Forecast 2015 5. Airport Investments
Mergers and Alliances
 Mergers and Alliances Istanbul Technical University Air Transportation Management, M.Sc. Program Aviation Economics and Financial Analysis Module 12 Outline A. Trends in M&A Activity B. Factors Affecting
Punctuality for july 2018 per airline
 Punctuality for july 2018 per airline Departures scheduled *) Delayed more than 15 minutes. **) having less than 10 operations. Planned Cancelled Delayed *) Punctuality Avg. delay (min) Adria Airways 31
air traffic statistics
 June 23 air traffic statistics Prepared by the Office of Finance Department of Internal Controls, Compliance and Financial Strategy Metropolitan Washington Airports Authority Air Traffic Statistics Table
Global Aviation Monitor (GAM)
") Global Aviation Monitor (GAM) Analysis and Short Term Outlook of Global, European and German Air Transport Main Results of Global Air Transport Supply Analysis and Outlook Background: Covers about 3,500
Global Aviation Monitor (GAM) Analysis and Short Term Outlook of Global, European and German Air Transport Main Results of Global Air Transport Supply Analysis and Outlook Background: Covers about 3,500
Intra-European Seat Capacity. January February March April May June July August September October November December. Intra-European Sectors Flown
 ASK's (Million) Sectors Departing Seats 80,000,000 Intra-European Seat Capacity 70,000,000 60,000,000 50,000,000 40,000,000 30,000,000 20,000,000 10,000,000 0 January February March April May June July
air traffic statistics
 September 213 air traffic statistics Prepared by the Office of Finance Department of Internal Controls, Compliance and Financial Strategy Commercial Total Int'l Dom Passengers % Change Air Traffic Summary
Punctuality for march 2014 per airline
 for march 2014 per airline Departures scheduled **) having less than 10 operations. Aer Lingus 30 30 0 100% 2 93% 68 Aeroflot Russian 63 62 1 98% 1 98% 19 Air Baltic 73 72 1 99% 1 99% 19 Air Berlin 167
Global Aviation Monitor (GAM)
") Global Aviation Monitor (GAM) Analysis and Short Term Outlook of Global, European and German Air Transport Main Results of Global Air Transport Supply Analysis and Outlook Background: Covers about 3,500
Global Aviation Monitor (GAM) Analysis and Short Term Outlook of Global, European and German Air Transport Main Results of Global Air Transport Supply Analysis and Outlook Background: Covers about 3,500
THE FUNDAMENTALS OF ROUTE DEVELOPMENT SETTING THE SCENE MODULE 1
 THE FUNDAMENTALS OF ROUTE DEVELOPMENT SETTING THE SCENE THE FUNDAMENTALS OF ROUTE DEVELOPMENT Mike St Laurent Vice President, Consulting - ASM ASM BACKGROUND Global consultancy founded in 1993 to provide
FLY AMERICA ACT WAIVER CHECKLIST
 FLY AMERICA ACT WAIVER CHECKLIST (To assist in determining qualification for a waiver of the restrictions of the Fly America Act under 41 CFR Part 301-10, check the applicable statement(s) below.) Use
Punctuality for february 2017 per airline
 for february 2017 per airline Departures scheduled **) having less than 10 operations. Aegean S.A. Aeroflot Russian 12 12 0 100% 1 92% 32 59 56 3 95% 8 86% 105 Air Baltic 84 83 1 99% 6 93% 76 Air Berlin
Number of complaints decided where a financial remedy awarded. Number of complaints received others
 Quarterly data for Q4 2017 from the CAA Approved entities and the CAA s Passenger Advice and Complaints Team Airline / Airport name of Aegean Airlines PACT 2 0 0 1 3 17 - - 25% Aer Lingus PACT 12 0 7 17
MONTHLY AIRPORT TRAFFIC REPORT. April 2014
 MONTHLY AIRPORT TRAFFIC REPORT AIRCRAFT OPERATIONS 2014 2013 Change Domestic Air Carrier 55,529 55,119 0.74% Air Taxi 11,149 15,077-26.05% General Aviation 639 723-11.62% Military 13 14-7.14% Subtotal
MONTHLY AIRPORT TRAFFIC REPORT January 2018
 MONTHLY AIRPORT TRAFFIC REPORT AIRCRAFT OPERATIONS 2018 2017 Change Domestic Air Carrier 55,461 55,980-0.93% Air Taxi 7,166 7,330-2.24% General Aviation 690 625 10.40% Military 6 11-45.45% Subtotal 63,323
Punctuality for august 2017 per airline
 for august 2017 per airline Departures scheduled **) having less than 10 operations. Acd/Ad Hoc 12 0 12 0% 0 100% 0 Adria Airways 21 21 0 100% 4 81% 26 Aegean S.A. Aeroflot Russian 19 19 0 100% 9 53% 22
Global Aviation Monitor (GAM)
") Global Aviation Monitor (GAM) Analysis and Short Term Outlook of Global, European and German Air Transport Main Results of Global Air Transport Supply Analysis and Outlook Background: Covers about 3,500
Global Aviation Monitor (GAM) Analysis and Short Term Outlook of Global, European and German Air Transport Main Results of Global Air Transport Supply Analysis and Outlook Background: Covers about 3,500
Low Fares The Engine For Passenger Growth 3 rd April 2003
 Low Fares The Engine For Passenger Growth 3 rd April 2003 Europe s No 1. Low Fares Airline No. 1 Established 1990 No 1 for traffic 24m passengers this year No 1 for On-Times No 1 for Lowest Fares No 1
Competition from the Gulf and Turkey
 Competition from the Gulf and Turkey The way it affects the Dutch aviation sector Rogier Lieshout Airneth 17 October 2012 Outline Growth of the aviation networks in the Gulf and Turkey Competition from
Global Aviation Monitor (GAM)
") Global Aviation Monitor (GAM) Analysis and Short Term Outlook of Global, European and German Air Transport Main Results of Global Air Transport Supply Analysis and Outlook Background: Covers about 3,500
Global Aviation Monitor (GAM) Analysis and Short Term Outlook of Global, European and German Air Transport Main Results of Global Air Transport Supply Analysis and Outlook Background: Covers about 3,500
Punctuality for may 2014 per airline
 for may 2014 per airline Departures scheduled **) having less than 10 operations. Adria Airways 18 18 0 100% 3 83% 118 Aer Lingus 30 30 0 100% 7 77% 36 Aeroflot Russian 62 62 0 100% 4 94% 58 Air Baltic
Departure Punctuality - Dec-17. Departure Punctuality - Last 12 Months
 Departure - Dec-17 Last Month Last Year % Change Target Var to Target First Wave 74.0% 84.1% -10.1% 85.0% -11.0% Not First Wave 55.4% 72.0% -16.6% 85.0% -29.6% Grand Total 59.4% 74.9% -15.5% 85.0% -25.6%
Global Airline Capacity Winter 2013/14 Boeing Commercial Airplanes
 Global Airline Capacity Winter 2013/14 Boeing Commercial Airplanes Istanbul Technical University Air Transportation Management M.Sc. Program BOEING is a trademark of Boeing Management Company. Network,
CHAPTER 2 Aviation Activity Forecasts
 CHAPTER 2 Aviation Activity Forecasts 2.1 Introduction 14 CFR Part 150 requires that noise exposure maps (NEMs) be prepared for two scenarios existing conditions and conditions 5 years into the future.
MONTHLY AIRPORT TRAFFIC REPORT April 2017
 MONTHLY AIRPORT TRAFFIC REPORT AIRCRAFT OPERATIONS 2017 2016 Change Domestic Air Carrier 56,570 60,697-6.80% Air Taxi 7,771 7,806-0.45% General Aviation 833 699 19.17% Military 23 14 64.29% Subtotal 65,197
Maximizing Economic Benefits of Aviation in the Region
 Maximizing Economic Benefits of Aviation in the Region Boubacar Djibo Director, Air Transport Bureau, ICAO Georgetown, Guyana 21 November 2018 Preamble. THEREFORE, the undersigned governments having agreed
The Changing Trends in the International Airline Industry. Dr John Frankie O Connell First Annual Tourism Policy Workshop Dromoland, 2010
 The Changing Trends in the International Airline Industry How is Ireland being affected by Changes in the Marketplace? Dr John Frankie O Connell First Annual Tourism Policy Workshop Dromoland, 2010 Agenda
MONTHLY AIRPORT TRAFFIC REPORT June 2017
 MONTHLY AIRPORT TRAFFIC REPORT AIRCRAFT OPERATIONS 2017 2016 Change Domestic Air Carrier 61,445 62,662-1.94% Air Taxi 8,267 7,656 7.98% General Aviation 644 685-5.99% Military 8 18-55.56% Subtotal 70,364
Airline financial performance
 Airline financial performance 30 March 2017 Brian Pearce Chief Economist, IATA www.iata.org/economics Airline Industry Economics Advisory Workshop 2016 1 The air transport paradox Source: McKinsey presentation
Departure Punctuality - Apr-17. Departure Punctuality - Last 12 Months
 Departure - Apr-17 Last Month Last Year % Change Target Var to Target First Wave 87.6% 91.3% -3.8% 85.0% 2.6% Not First Wave 77.5% 81.5% -4.0% 85.0% -7.5% Grand Total 79.7% 83.6% -3.9% 85.0% -5.3% Departure
MONTHLY AIRPORT TRAFFIC REPORT September 2016
 MONTHLY AIRPORT TRAFFIC REPORT AIRCRAFT OPERATIONS 2016 2015 Change Domestic Air Carrier 59,030 59,038-0.01% Air Taxi 7,779 7,201 8.03% General Aviation 704 571 23.29% Military 21 12 75.00% Subtotal 67,534
MONTHLY AIRPORT TRAFFIC REPORT July 2017
 MONTHLY AIRPORT TRAFFIC REPORT AIRCRAFT OPERATIONS 2017 2016 Change Domestic Air Carrier 63,535 63,680-0.23% Air Taxi 7,291 7,548-3.40% General Aviation 630 717-12.13% Military 15 11 36.36% Subtotal 71,471
Punctuality for september 2013 per airline
 for september 2013 per airline Departures scheduled Adria Airways 17 17 0 100% 3 82% 20 Aer Lingus 26 26 0 100% 4 85% 22 Aeroflot Russian s 60 60 0 100% 9 85% 29 Air Baltic 85 84 1 99% 9 89% 32 Air Berlin
air traffic statistics
 October 213 air traffic statistics Prepared by the Office of Finance Department of Internal Controls, Compliance and Financial Strategy Metropolitan Washington Airports Authority Air Traffic Statistics
MONTHLY AIRPORT TRAFFIC REPORT February 2014
 MONTHLY AIRPORT TRAFFIC REPORT AIRCRAFT OPERATIONS 2014 2013 Change Domestic Air Carrier 44,741 48,627-7.99% Air Taxi 11,144 13,003-14.30% General Aviation 569 543 4.79% Military 17 15 13.33% Subtotal
Global Aviation Monitor (GAM)
") Global Aviation Monitor (GAM) Analysis and Short Term Outlook of Global, European and German Air Transport Main Results of Global Air Transport Supply Analysis and Outlook Background: Covers about 3,500
Global Aviation Monitor (GAM) Analysis and Short Term Outlook of Global, European and German Air Transport Main Results of Global Air Transport Supply Analysis and Outlook Background: Covers about 3,500
MONTHLY AIRPORT TRAFFIC REPORT August 2018
 MONTHLY AIRPORT TRAFFIC REPORT AIRCRAFT OPERATIONS 2018 2017 Change Domestic Air Carrier 65,465 63,201 3.58% Air Taxi 7,607 7,533 0.98% General Aviation 594 609-2.46% Military 15 3 400.00% Subtotal 73,681
MONTHLY AIRPORT TRAFFIC REPORT February 2018
 MONTHLY AIRPORT TRAFFIC REPORT AIRCRAFT OPERATIONS 2018 2017 Change Domestic Air Carrier 51,809 51,854-0.09% Air Taxi 6,659 6,988-4.71% General Aviation 651 540 20.56% Military 6 9-33.33% Subtotal 59,125
Departure Punctuality - Sep-17. Departure Punctuality - Last 12 Months
 Departure Punctuality - Sep-17 Last Month Last Year % Change Target Var to Target First Wave 73.0% 82.7% -9.7% 85.0% -12.0% Not First Wave 60.9% 73.4% -12.5% 85.0% -24.1% Grand Total 63.5% 75.5% -12.1%
MONTHLY AIRPORT TRAFFIC REPORT July 2018-(Revised)
") MONTHLY AIRPORT TRAFFIC REPORT AIRCRAFT OPERATIONS 2018 2017 Change Domestic Air Carrier 64,066 63,535 0.84% Air Taxi 7,468 7,291 2.43% General Aviation 550 630-12.70% Military 5 15-66.67% Subtotal 72,089
MONTHLY AIRPORT TRAFFIC REPORT AIRCRAFT OPERATIONS 2018 2017 Change Domestic Air Carrier 64,066 63,535 0.84% Air Taxi 7,468 7,291 2.43% General Aviation 550 630-12.70% Military 5 15-66.67% Subtotal 72,089
MONTHLY AIRPORT TRAFFIC REPORT September 2018
 MONTHLY AIRPORT TRAFFIC REPORT AIRCRAFT OPERATIONS 2018 2017 Change Domestic Air Carrier 58,763 55,902 5.12% Air Taxi 6,537 6,689-2.27% General Aviation 605 658-8.05% Military 14 17-17.65% Subtotal 65,919
MONTHLY AIRPORT TRAFFIC REPORT July 2016
 MONTHLY AIRPORT TRAFFIC REPORT AIRCRAFT OPERATIONS 2016 2015 Change Domestic Air Carrier 63,680 62,789 1.42% Air Taxi 7,548 8,007-5.73% General Aviation 717 558 28.49% Military 11 146-92.47% Subtotal 71,956
Los Angeles World Airports (LAWA) Traffic Comparison (TCOM) Los Angeles International Airport Calendar YTD January to December
 Traffic Comparison (TCOM) Los Angeles International Airport Calendar YTD January to December") Los Angeles World Airports (LAWA) Traffic Comparison (TCOM) Los Angeles Airport Calendar YTD January to December Jan-214 Jan-213 to to Dec-214 Dec-213 % Change Dec-214 Dec-213 % Change Passenger Traffic
Los Angeles World Airports (LAWA) Traffic Comparison (TCOM) Los Angeles Airport Calendar YTD January to December Jan-214 Jan-213 to to Dec-214 Dec-213 % Change Dec-214 Dec-213 % Change Passenger Traffic
Operational Performance Reporting Manchester Airport January 2018
 Operational Performance Reporting Manchester Airport January 2018 Departure - Jan-18 Last Month Last Year % Change Target Var to Target First Wave 89.7% 85.2% 4.5% 85.0% 4.7% Not First Wave 77.7% 76.3%
MONTHLY AIRPORT TRAFFIC REPORT December 2018
 MONTHLY AIRPORT TRAFFIC REPORT AIRCRAFT OPERATIONS 2018 2017 Change Domestic Air Carrier 58,905 55,828 5.51% Air Taxi 6,948 6,810 2.03% General Aviation 499 565-11.68% Military 24 25-4.00% Subtotal 66,376
MONTHLY AIRPORT TRAFFIC REPORT May 2015
 MONTHLY AIRPORT TRAFFIC REPORT AIRCRAFT OPERATIONS 2015 2014 Change Domestic Air Carrier 60,427 57,339 5.39% Air Taxi 7,825 10,967-28.65% General Aviation 547 635-13.86% Military 135 27 400.00% Subtotal
6 Dec 2009 version Developments in Air Transport Industry, and Implications for the proposed LCC- Focused Airport in SE Korea. Prof.
 6 Dec 2009 version Developments in Air Transport Industry, and Implications for the proposed LCC- Focused Airport in SE Korea Prof. Tae Hoon Oum The Air Transport Research Society (ATRS) www.atrsworld.org
MONTHLY AIRPORT TRAFFIC REPORT March 2017
 MONTHLY AIRPORT TRAFFIC REPORT AIRCRAFT OPERATIONS 2017 2016 Change Domestic Air Carrier 60,360 61,951-2.57% Air Taxi 8,591 8,270 3.88% General Aviation 717 615 16.59% Military 14 27-48.15% Subtotal 69,682
MONTHLY AIRPORT TRAFFIC REPORT April 2018
 MONTHLY AIRPORT TRAFFIC REPORT AIRCRAFT OPERATIONS 2018 2017 Change Domestic Air Carrier 60,928 56,570 7.70% Air Taxi 6,995 7,771-9.99% General Aviation 654 833-21.49% Military 9 23-60.87% Subtotal 68,586
MONTHLY AIRPORT TRAFFIC REPORT December 2017
 MONTHLY AIRPORT TRAFFIC REPORT AIRCRAFT OPERATIONS 2017 2016 Change Domestic Air Carrier 55,828 57,943-3.65% Air Taxi 6,810 7,642-10.89% General Aviation 565 569-0.70% Military 25 32-21.88% Subtotal 63,228
Departure Punctuality - Jun-17. Departure Punctuality - Last 12 Months
 Departure - Jun-17 Last Month Last Year % Change Target Var to Target First Wave 79.3% 79.8% -0.5% 85.0% -5.7% Not First Wave 68.3% 66.8% 1.5% 85.0% -16.7% Grand Total 70.7% 69.8% 0.8% 85.0% -14.3% Departure
Outlook for air travel markets
 Outlook for air travel markets June 2016 Brian Pearce Chief Economist International Air Transport Association Extended period of strong air travel market growth 30% 25% 20% 15% 10% 5% 0% -5% -10% -15%
Global Airline Trends and Impacts International Aviation Issues Seminar
 Global Airline Trends and Impacts International Aviation Issues Seminar December 2017, Washington D.C. Oliver Lamb Managing Director 1 Around the world in 45 minutes Financial Performance Canada Mexico
Global Aviation Monitor (GAM)
") Global Aviation Monitor (GAM) Analysis and Short Term Outlook of Global, European and German Air Transport Main Results of Global Air Transport Supply Analysis and Outlook Background: Covers about 3,500
Global Aviation Monitor (GAM) Analysis and Short Term Outlook of Global, European and German Air Transport Main Results of Global Air Transport Supply Analysis and Outlook Background: Covers about 3,500
Remedy awarded (complaints decided in qtr)
") Quarterly complaints data for Q2 2018 from the CAA Approved ADR entities and the CAA s Passenger Advice and Team ADR entity No remedy per million pax Total Average award consumers Air Canada/Canada Rouge
Quarterly complaints data for Q2 2018 from the CAA Approved ADR entities and the CAA s Passenger Advice and Team ADR entity No remedy per million pax Total Average award consumers Air Canada/Canada Rouge
MONTHLY AIRPORT TRAFFIC REPORT November 2013
 MONTHLY AIRPORT TRAFFIC REPORT AIRCRAFT OPERATIONS 2013 2012 Change Domestic Air Carrier 52,937 54,739-3.29% Air Taxi 13,964 13,566 2.93% General Aviation 504 515-2.14% Military 25 28-10.71% Subtotal 67,430
Customer Relations Programme
 Customer Relations Programme 2018 2 Customer Relations Thank you for taking time to meet with us today We would like to give you an update on IAA We hope to gain a better understanding of how we can improve
Departure Punctuality - May-17. Departure Punctuality - Last 12 Months
 MAG Airport Name Manchester Scheduled Date Between 2017-05-01 00:00:00 and 2017-05-31 00:00:00 Operator IATA Code (Report Defaults) Departure - May-17 Last Month Last Year % Change Target Var to Target
Operational Performance Reporting Manchester Airport August 2018
 Operational Performance Reporting Manchester Airport August 2018 Departure Punctuality - Aug-18 Last Month Last Year % Change Target Var to Target First Wave 83.4% 80.2% 3.2% 85.0% -1.6% Not First Wave
Operational Performance Reporting Manchester Airport March 2018
 Operational Performance Reporting Manchester Airport March 2018 Departure Punctuality - Mar-18 Last Month Last Year % Change Target Var to Target First Wave 79.8% 88.1% -8.3% 85.0% -5.2% Not First Wave
Departure Punctuality - Feb-17. Departure Punctuality - Last 12 Months
 Operational Performance Reporting Manchester Airport February 2017 Departure - Feb-17 Last Month Last Year % Change Target Var to Target First Wave 85.2% 84.3% 0.8% 85.0% 0.2% Not First Wave 77.8% 80.5%
Global Aviation Monitor (GAM)
") Global Aviation Monitor (GAM) Analysis and Short Term Outlook of Global, European and German Air Transport Main Results of Global Air Transport Supply Analyses and Outlook Background: Covers about 3.5
Global Aviation Monitor (GAM) Analysis and Short Term Outlook of Global, European and German Air Transport Main Results of Global Air Transport Supply Analyses and Outlook Background: Covers about 3.5
Global Seat Capacity July. May. June. Global Sectors Flown July. May. June %
 Jan-14 Feb-14 Mar-14 Apr-14 May-14 Jun-14 Jul-14 Aug-14 Sep-14 Oct-14 Nov-14 Dec-14 Jan-15 Feb-15 Mar-15 Apr-15 May-15 Low cost Oneworld Skyteam Star Alliance Other Billion ASKs - YTD January February
TABLE OF CONTENTS. Scheduling Limits 2. Air Transport Movements 3. Total Seats and Seats per Movement 4. Airline Analysis 5.
 HEATHROW WINTER 211/12 Start of Season Report KEY STATISTICS Air Transport Movements -.4% Total Seats -1.1% Seats per Air Transport Movement -.7% TABLE OF CONTENTS Page Scheduling Limits 2 Air Transport
Departure Punctuality - Aug-17. Departure Punctuality - Last 12 Months
 Departure - Aug-17 Last Month Last Year % Change Target Var to Target First Wave 80.2% 83.9% -3.8% 85.0% -4.8% Not First Wave 65.0% 71.0% -6.0% 85.0% -20.0% Grand Total 68.3% 73.9% -5.7% 85.0% -16.7% Departure
EUROPEAN AIR TRANSPORT MARKET UNDER INFLUENCE OF COOPERATIVE ARRANGEMENTS
 EUROPEAN AIR TRANSPORT MARKET UNDER INFLUENCE OF COOPERATIVE ARRANGEMENTS Maja Ozmec-Ban 1, Ružica Škurla Babić 2 1,2 Faculty of transportation and traffic sciences, University of Zagreb, Croatia Abstract:
World & Regional Capacity Analysis Ali Hajiyev
 World & Regional Capacity Analysis Ali Hajiyev Istanbul Technical University Air Transportation Management M.Sc. Program Network, Fleet and Schedule Strategic Planning Module 3: 28 March 2016 Global Copyright
Future Challenges For the Indian. Market. CEO Centre for Asia Pacific Aviation. Andrew Miller. April 2006
 Future Challenges For the Indian Market Andrew Miller CEO Centre for Asia Pacific Aviation April 2006 Environmental Drivers Governments focus on tourism growth and regional dispersal stimulate economy
Global Aviation Monitor (GAM)
") Global Aviation Monitor (GAM) Analysis and Short Term Outlook of Global, European and German Air Transport Main Results of Global Air Transport Supply Analysis and Outlook Background: Covers about 3,500
Global Aviation Monitor (GAM) Analysis and Short Term Outlook of Global, European and German Air Transport Main Results of Global Air Transport Supply Analysis and Outlook Background: Covers about 3,500
Moderate growth for passenger traffic in April; air freight volumes inch up slightly
 Moderate growth for passenger traffic in April; air freight volumes inch up slightly Montréal, 15 June 2016 According to the latest statistics from Airports Council International, global airport passenger
Global Seat Capacity May. June. July. Global Sectors Flown May. June. July
 Global Departing Seats (Millions) 5 45 4 35 3 25 2 15 5 4.6% 5.4% 6.3% 5.6% 5.4% 6.2% 6.8% 6.1% Global Seat Capacity 214 215 January February March April May June July August September October November
Punctuality for july 2012 per airline
 for july 2012 per airline Departures scheduled **) having less than 10 operations. Adria Airways 32 31 1 97% 3 91% 46 Aeroflot Russian Aerosvit 62 61 1 98% 8 87% 25 31 30 1 97% 13 58% 78 Air Baltic 93
Airline Marketing Brussels Airport Léon Verhallen, Head of Airline Business Development
 Airline Marketing Brussels Airport Léon Verhallen, Head of Airline Business Development MAp Reverse Roadshow, June 2007 Top 25 European Passenger Airports Primary gateways O&D leisure & LCC Secondary gateways
Prediction of Skytrax airline rankings, short formula (2e)
") Site: Wiki of Science at http://wikiofscience.wikidot.com Source page: 20120725 - Prediction of Skytrax airline rankings, short formula (2e) - 2010 at http://wikiofscience.wikidot.com/print:20120725-skytrax-al-short-perezgonzalez2010
Site: Wiki of Science at http://wikiofscience.wikidot.com Source page: 20120725 - Prediction of Skytrax airline rankings, short formula (2e) - 2010 at http://wikiofscience.wikidot.com/print:20120725-skytrax-al-short-perezgonzalez2010
THE GROWTH OF THE HOSPITALITY INDUSTRY IN DUBAI
 THE GROWTH OF THE HOSPITALITY INDUSTRY IN DUBAI THE DEFINITION OF TOURISM Tourism is travel for recreational, leisure or business purposes. The World Tourism Organization defines tourists as people "traveling
Global Seat Capacity July. May. June. Global Sectors Flown July. May. June %
 Jan-14 Feb-14 Mar-14 Apr-14 May-14 Jun-14 Jul-14 Aug-14 Sep-14 Oct-14 Nov-14 Dec-14 Jan-15 Low cost Oneworld Skyteam Star Alliance Other Billion ASKs - YTD January February March April May June July August