Interim results. for the six months ended 31 August November 2018
|
|
|
- Denis Gregory
- 5 years ago
- Views:
Transcription


1 Interim results for the six months ended 31 August November 2018

2 Core message Strategically diversified to prosper in a tough environment Afrimat Limited Interim results for the six months ended 31 August
3 Summary of the period Diversification, into bulk commodities (iron ore) started to deliver excellent results Industrial minerals continue to show resilience due to exceptional product quality Construction materials and aggregates businesses under pressure due to economy US$ Rand hedge from iron ore and Mozambique Importance of a balanced portfolio


4 Group overview A supplier of quality materials sourced from our open pit mines and quarries Strategically diversified through product range, target market and location Afrimat Limited Interim results for the six months ended 31 August
5 Operational overview What we do


6 What we do BULK COMMODITIES CONSTRUCTION MATERIALS INDUSTRIAL MINERALS Aggregates and Concrete Based Products - combined into a single operating segment, named Construction Materials Industrial Minerals - reflected as a separate segment Afrimat Limited Interim results for the six months ended 31 August

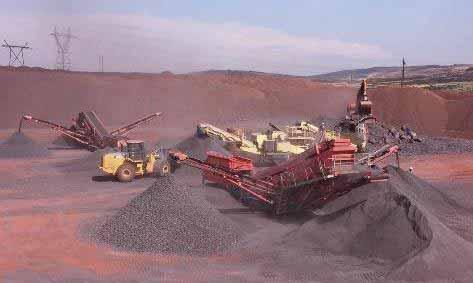
7 Bulk commodities Iron ore

8 Industrial minerals Lime Metallurgical dolomite Silica Afrimat Limited Interim results for the six months ended 31 August

9 Construction materials: aggregates Quarrying products Concrete stone Road stone Other aggregates

10 Construction materials: concrete products Bricks Blocks Paving blocks Readymix concrete Afrimat Limited Interim results for the six months ended 31 August

11 Diversified portfolio and footprint which generates a balanced, consistent income stream Construction Materials 24 Commercial quarries 6 Sand & gravel mines 4 Clinker sources Mobile crushing & screening Drilling & blasting 7 Concrete brick & block factories 18 Readymix batching sites Limpopo 1 2 Mozambique Gauteng Industrial Minerals Mpumalanga Limestone mines 4 Dolomite mines 1 Silica mine Northern Cape 1 1 Free State 7 South Africa KwaZulu-Natal 16 Commodities Eastern Cape 1 1 Iron ore and manganese mine Western Cape 3 24

12 What makes Afrimat different? Company positioning Company culture Strategic management Afrimat Limited Interim results for the six months ended 31 August
13 Company positioning Primarily focused on mid-tier open pit mining Unique competitive advantage Geographic location Unique metallurgy Structural cost advantage Highly entrepreneurial culture Hedged against economic volatility through wide diversification
14 Company culture Consistently delivering Strong operational efficiency The right people in the right positions Synergistic teamwork Customer advocacy through service, reliability and quality of supply Values based entrepreneurial culture Afrimat Limited Interim results for the six months ended 31 August
15 Strategic management Companywide understanding of desired future Fundamental understanding of market Good understanding of own abilities Continuous research of business environment Facing the brutal facts Meticulous strategy execution Financial discipline: making the returns
16 Our performance What the diversification strategy is delivering Afrimat Limited Interim results for the six months ended 31 August
17 Headline earnings per share (HEPS) comparison 5,00 4,00 -- Afrimat 3,00 2,00 1,00 0,00-1,00 -- Raubex -- Sephaku -- PPC -- CIL -2,
18 Growth through diversification Profit history with and without acquisitions Positive value gap Glen Douglas Clinker Infrasors Cape Lime Demaneng Headline earnings per share Reality without strategic acquisitions Afrimat Limited Interim results for the six months ended 31 August
19 Financial overview 28.6% 4.3% 93.6 cents Group revenue increased to R1.5bn Operating profit up to R207.7m Headline earnings per share 943 cents 19.0 cents 20.1% NAV per share Interim dividend per share held Return on net operating assets
20 Financial overview Revenue and contribution Revenue (R 000) Contribution from operations (R 000) Contribution from operations margin 13,3% ,6% ,2% st half 2nd half 1st half 2nd half Afrimat Limited Interim results for the six months ended 31 August
21 Headline earnings per share interim 120,0 100,0 80,0 Cents per share 60,0 40,0 61,1 76,0 95,2 102,2 93,6 20,0 0,
22 Financial overview Contribution from operations split (%) HY2018 HY2017 Construction materials 56.6% 76.1% Bulk commodities 24.7% (2.8%) Industrial minerals 20.5% 28.0% Services (1.8%) (1.3%) Contribution from operations margin (%) HY2018 HY2017 Construction materials 13.2% 16.9% Bulk commodities 13.6% (18.9%) Industrial minerals 14.6% 19.4% Services 13.3% 16.4% Afrimat Limited Interim results for the six months ended 31 August
23 Net cash from operating activities CAGR of 18.27% Cents per share
24 Statement of financial position - assets R 000 Unaudited Aug 2018 Unaudited Aug 2017 Audited Feb 2018 Property, plant and equipment Mining rights and goodwill Inventories Trade and other receivables Cash Other assets / BEE funding Demaneng accounts for R316.8 million Afrimat Limited Interim results for the six months ended 31 August
25 Statement of financial position - equities & liabilities R 000 Unaudited Aug 2018 Unaudited Aug 2017 Audited Feb 2018 Total equity Borrowings Provisions Overdraft Trade and other payables Other liabilities / deferred tax Net debt less cash:equity 35.4%
26 Capital expenditure F2018 Planned F2019 H1: R115.8 m H2: R 67.0 m R182.8 m H1: R115.8 m H2: R 88.3 m R204.1 m Demaneng ramp-up Includes R43.5 million for rental replacement capital General maintenance Afrimat Limited Interim results for the six months ended 31 August
27 Dividend payment Interim dividend 2.7x cover CAGR of 9,95% Record date: Fri 30 Nov 2018 Dividend payable: Mon 3 Dec 2018 Cents per share
28 Segmental makeup Better reflects overall business INDUSTRIAL MINERALS CONSTRUCTION MATERIALS BULK COMMODITIES Industrial minerals Aggregates Iron Ore (Demaneng) Bricks and blocks Readymix concrete Afrimat Limited Interim results for the six months ended 31 August
29 Segmental revenue 57,1% + 24,2% + 18,7% = 100% R R 000 R R R Construction Materials Bulk Commodities Industrial Minerals Total
30 Operational overview Well diversified contribution from operations August 2018 August 2017* Cape Lime 9% Traditional business 25% Cape Lime 11% Traditional business 29% Clinker Group 16% Clinker Group 23% Infrasors 12% Glen Douglas 13% Demaneng; 25% Infrasors 21% Glen Douglas 16% * Excluding Demaneng loss of R5.5 million Afrimat Limited Interim results for the six months ended 31 August

31 Our market Purposeful exposure to sectors with economic fundamentals that suit the Afrimat business model
32 Contribution to revenue 24,2% Iron ore Why we are excited Afrimat Limited Interim results for the six months ended 31 August

33 Afrimat acquisition of Demaneng Iron ore market
34 Pricing trends 0 Historical Index Pricing Afrimat Limited Interim results for the six months ended 31 August Mar Apr May Jun Jul Aug Sep Oct Nov Dec Jan Feb Mar Apr May Jun Jul Aug Sep Oct Nov Dec Jan Feb Mar Apr May Jun Jul Aug Sep Oct Nov Dec Jan Feb Mar Apr May Jun Jul Aug-18 58% 62% 65%
35 Preference for quality 01-Mar Apr May Jun Jul Aug Sep Oct Nov Dec Jan Feb Mar Apr May Jun Jul Aug Sep Oct Nov Dec Jan Feb Mar Apr May Jun Jul Aug Sep Oct Nov Dec Jan Feb Mar Apr May Jun Jul Aug-18 58% Discount 62% 65% Premium
36 0,45 0,4 0,35 0,3 0,25 0,2 0,15 0,1 0,05 Lump premium 0 Afrimat Limited Interim results for the six months ended 31 August Mar Apr May Jun Jul Aug Sep Oct Nov Dec Jan Feb Mar Apr May Jun Jul Aug Sep Oct Nov Dec Jan Feb Mar Apr May Jun Jul Aug Sep Oct Nov Dec Jan Feb Mar Apr May Jun Jul Aug Sep Oct-18 Lump Premium
37 Iron Ore Average Production Cost FOR (Free on Rail): R /ton Transnet rail quota on line t/pa Original total Transnet cut back to Negotiated (export line) Current total through Saldanha
38 Iron ore story line 1. Rationale $ exposure Much higher margins through the cycle Excellent operational fit Accessible opportunities Afrimat Limited Interim results for the six months ended 31 August
39 Iron ore story line (continued) 2. Competitive advantage Quality Fe content Low silica content Low alumina High lump ratio 70/30 Cost Low strip ratio 1:1 Own load-out station Close to load-out station 3.3 km Operate mine as a quarry (cost conscious and scalability) Logistics Export rail capacity (870 ktpa) Own load-out station Good relationships with Transnet Access to domestic rail lines Management expertise
40 Iron ore sales by rail Planned Transnet maintenance shut down Sales Afrimat Limited Interim results for the six months ended 31 August
41 Contribution to revenue 18,7% Industrial minerals Stable market
42 Industrial minerals: rationale Good margins Constant off-take: long term agreements High entry barriers Alternatives are scarce Good market: high volumes Reputable customers Afrimat Limited Interim results for the six months ended 31 August
43 Industrial minerals: the market Glass - Bottles - Windscreens - Plate glass Metallurgical - Alloys - Chrome - Steel - Foundries Chemical Water treatment - Drinking water - Acid mine drainage Agriculture - Soil ph stabilisation - Animal hygiene Industrial powders and fillers - Fire retardants - Paints - Tiles and tile adhesives - Grout fillers
44 Industrial minerals: our positioning Portfolio of products - Customised offering Geographic spread Innovative product development Partnering with customers Solving the customer s pain points Afrimat Limited Interim results for the six months ended 31 August
45 Contribution to revenue 57,1% Construction materials A good cash cow
46 Construction materials: period under review Felt brunt of economic slow-down KwaZulu-Natal and Gauteng businesses impacted the most Solid performance from Western Cape aggregates business Mozambique business ramped up through supply contract for re-settlement village Emfuleni Clinker dump acquisition adds 3 4 years LOM Afrimat Limited Interim results for the six months ended 31 August
47 Afrimat Construction Index 2 nd quarter Index; Q1 2011=

48 Building plans passed Real value of recorded building plans passed by larger municipalities Constant 2015 prices (Source: Stas SA, July 2018, P504.1) Afrimat Limited Interim results for the six months ended 31 August
49 SANRAL: Road condition ( km) (41.6%) (35.5%) Km (17.2%) (5.3%) 86 (0.4%) 0 Very good Good Fair Poor Very poor (Data from BIFSA, 20 September 2018, p.19)
50 Provincial: Road condition ( km) (28.6%) Km (16.9%) (22.3%) (20.7%) 5629 (11.5%) Very good Good Fair Poor Very poor (Data from BIFSA, 20 September 2018, p.19) Afrimat Limited Interim results for the six months ended 31 August
51 Provincial and national road expenditure and estimates Road Expenditures (R million) (Source: Data from: BIFSA, Roads Review 2018, p.26) f 2019f 2020f 2021f Total Provincial SANRAL Total Provincial and SANRAL
52 Estimated provincial expenditure on construction and maintenance of roads R mill KZN WC GP MP EC LMP NWP FS NC MTEF (Source: Data from BIFSA, 20 September 2018, p.33). Medium Term Expenditure Framework ( MTEF ) Afrimat Limited Interim results for the six months ended 31 August
53 Looking ahead Why are we excited on how we approach the environment
 - 75 learners in total - Of the 19 that has passed, 12 were employed) History of Afrimat Learnerships 50 45 40 35 NUMBER")
54 Human Resources Development 1. Learnerships (Based on figures from 2014) - 75 learners in total - Of the 19 that has passed, 12 were employed) History of Afrimat Learnerships NUMBER In Progress Dropped Out Passed 54 Afrimat Limited Interim results for the six months ended 31 August
55 Human Resources Development 2. Afrimat Graduate Development Program - Consists of interns, Graduates in Training, Practical training 1/2 Afrimat Graduate Development Program TOTAL YEAR Male Female 55

56 Human Resources Development 2. Strategic Development Study Assistance - Includes Certificates, Diplomas, Degrees, Honours and MBA s Study Assistance TOTAL YEAR Male Female 56 Afrimat Limited Interim results for the six months ended 31 August
57 Snapshot of Local Economic Development projects through the years Youth skills development/ Job creation Trackless Mobile Machines (TMM) training for over 80 unemployed youth Funding for retail/chain store training for over 100 unemployed youth - in partnership with 68 retail/chain stores Over 200 unemployed youth trained - Code 10/14 drivers license Over 40 jobs created through Local SMMEs in local communities Education Funding for a Maths teacher (10 years) Top student awards programme (10years) Maths & Science programmes in 6 schools across the country (5 years) School/Toy Libraries (1) Infrastructure Early Childhood Development Centres ( 3) Multi Purpose Centres (1) Centre for Disabled children (1) Over 40 Classrooms built 10 Market Stalls for local SMMEs 1 Economic Hub for local SMMEs Supplying water to several communities


58 Looking ahead Iron ore business to perform well Industrial Minerals to grow Construction materials to remain at present levels Good cash flow Afrimat Limited Interim results for the six months ended 31 August
59 How to assess Afrimat Efficient hedge (against volatile local business conditions) Cash generative / free cash flow focus Moat (geographic locations, unique metallurgy & structural cost advantage) Strength of management Rand hedge (Iron ore & Mozambique) Operational diversification Scalability reduces cyclicality (protects against commodity price fluctuations) Dividend payer (2,7x cover)
60 Risk mitigation SA country risk Volatile commodity markets Construction industry pressure Macro economic threats Afrimat Limited Interim results for the six months ended 31 August
61 Core message Strategically diversified to prosper in a tough environment
62 Q & A Thank you for your attendance and participation For any further Investor Relations questions please contact: Andries van Heerden (CEO) Vanessa Rech (Keyter Rech Investor Solutions) Afrimat Limited Interim results for the six months ended 31 August
Tourism in South Africa A statistical overview
 Tourism in South Africa A statistical overview Purpose of presentation Purpose of the presentation is to present different tourism statistics produced by Stats SA People like to travel we are a country
2007/08 Full Year Results Investor Briefing
 2007/08 Full Year Results Investor Briefing Highlights of Result Profit before tax up 46% to $1,408 million Up 36% on the reported result Margin improvement $3 billion of Sustainable Future Benefits achieved
Presentation on Results for the 2nd Quarter FY Idemitsu Kosan Co.,Ltd. November 14, 2018
 Presentation on Results for the 2nd Quarter FY 2018 Idemitsu Kosan Co.,Ltd. November 14, 2018 Table of Contents 1. FY 2018 2nd Quarter Financials (1) Overview (2) Segment Information 2. Reference Materials
January 2018 Air Traffic Activity Summary
 January 2018 Air Traffic Activity Summary Jan-2018 Jan-2017 CY-2018 CY-2017 Passengers 528,947 505,421 4.7% 528,947 505,421 4.7% Passengers 537,332 515,787 4.2% 537,332 515,787 4.2% Passengers 1,066,279
SAS Group Presentation Carnegie, May 22, 2012 Sture Stölen, Head of IR
 SAS Group Presentation Carnegie, May 22, 2012 Sture Stölen, Head of IR 1 This is the SAS Group 128 destinations 27,2 million passengers 28 new routes to be launched 2012 1,085 daily flights Revenues 2011,
Investor Briefings First-Half FY2016 Financial Results
 Cedar Woods Properties Limited Investor Briefings First-Half FY2016 Financial Results 26 February 2016 Cedar Woods Presentation 2 Snapshot of Achievements in FY2016 Extensive portfolio of residential estates
Investor update presentation. November 2016
 Investor update presentation November 2016 Content Update on Q3 2016 financial performance 3-8 Recap on ATG Evolution 9-10 Update on hospitality strategic business unit 11-14 Update on online travel and
Presentation on Results for the 3rd Quarter FY Idemitsu Kosan Co.,Ltd. February 2, 2016
 Presentation on Results for the 3rd Quarter FY 2015 Idemitsu Kosan Co.,Ltd. February 2, 2016 Table of Contents 1. 3 rd Quarter FY 2015 Financials (1) Overview (2) Segment Information 2. Forecast for FY
Analysts and Investors conference call. Q results. 15 May 2013
 Analysts and Investors conference call Q1 2013 results 15 May 2013 Management summary Key messages of Q1 2013 +6% +9% +3.3%p. Q1 2013 operational KPIs are in line with 109.7 116.2 6.5 7.1 82.3 85.6 expectations,
The Property Franchise Group
 The Property Franchise Group Capital Markets Event 22 October 2015 This afternoon s agenda 2 15:15 Welcome Richard Martin, Chairman 15:20 Introduction to MartinCo PLC Ian Wilson, Chief Executive Officer
Presentation on Results for the 1st Quarter FY Idemitsu Kosan Co.,Ltd. August 14, 2017
 Presentation on Results for the 1st Quarter FY 2017 Idemitsu Kosan Co.,Ltd. August 14, 2017 Table of Contents 1. FY 2017 1st Quarter Financials (1) Overview (2) Segment Information 2. Reference Materials
GRINDROD LIMITED AUDITED RESULTS AND DIVIDEND ANNOUNCEMENT for the year ended 31 December 2016
 www.grindrod.com GRINDROD LIMITED AUDITED RESULTS AND DIVIDEND ANNOUNCEMENT for the year ended 31 December 2016 Wifi access guest@sun Presentation and Announcement download www.grindrod.com > Investor
INTERIM FINANCIAL RESULTS
 INTERIM FINANCIAL RESULTS for the six months ended 30 June 2016 Accelerated growth ACADEMIC EXCELLENCE INTERIM RESULTS FOR THE SIX MONTHS ENDED 30 JUNE 2016 1 Financials Strategy Acquisitions - Oxbridge
Presentation on Results for the 3rd Quarter FY Idemitsu Kosan Co.,Ltd. February 14, 2019
 Presentation on Results for the 3rd Quarter FY 2018 Idemitsu Kosan Co.,Ltd. February 14, 2019 Table of Contents 1. FY 2018 3rd Quarter Results (1) Overview (2) Segment Information 2. Forecast for FY 2018
Presentation on Results for the 2nd Quarter FY Idemitsu Kosan Co.,Ltd. November 1, 2016
 Presentation on Results for the 2nd Quarter FY 2016 Idemitsu Kosan Co.,Ltd. November 1, 2016 Table of Contents 1. 2nd Quarter FY 2016 Financials (1) Overview (2) Segment Information 2. Reference Materials
Press Release. Bilfinger 2017: Stable foundation laid for the future
 Press Release February 14, 2018 Bilfinger 2017: Stable foundation laid for the future Organic growth in orders received after three years of decline Trend reversal: Output volume better than expected Growth
Land area 1.73 million km 2 Queensland population (as at 31 December 2017) Brisbane population* (preliminary estimate as at 30 June 2017)
 Brisbane population* (preliminary estimate as at 30 June 2017)") Queensland - 11 Queensland OVERVIEW Queensland is nearly five times the size of Japan, seven times the size of Great Britain, and two and a half times the size of Texas. Queensland is Australia s second
Queensland - 11 Queensland OVERVIEW Queensland is nearly five times the size of Japan, seven times the size of Great Britain, and two and a half times the size of Texas. Queensland is Australia s second
December 2018 Quarterly Production Report
 31 January 2019 December 2018 Quarterly Production Report Fortescue Metals Group Limited (ASX: FMG, Fortescue) Fortescue has released its December 2018 quarterly production results, reporting total shipments
TUI GROUP INVESTOR PRESENTATION
 TUI GROUP INVESTOR PRESENTATION German Investment Conference UniCredit / Kepler Munich, 26-27 September 2012 Future-related statements This presentation contains a number of statements related to the future
Air China Limited Annual Results. March Under IFRS
 Air China Limited 21 Annual Results Under IFRS March 211 Agenda Part 1 Highlights Part 2 Business Overview Part 3 Financial Overview Part 4 Outlook 2 Part 1 Highlights Steady Economic Growth; Asia Pacific
23 February The Manager Market Announcements Australian Securities Exchange Limited 20 Bridge Street SYDNEY NSW 2000.
 Level 1 157 Grenfell Street Adelaide SA 5000 GPO Box 2155 Adelaide SA 5001 Adelaide Brighton Ltd ACN 007 596 018 Telephone (08) 8223 8000 International +618 8223 8000 Facsimile (08) 8215 0030 www.adbri.com.au
Singapore Airlines Group Analyst/Media Briefing HALF YEAR FY RESULTS 5 NOVEMBER 2012 THE PARENT AIRLINE 1H FY2012/13 RESULTS
 Singapore Airlines Group Analyst/Media Briefing HALF YEAR FY2012-13 13 RESULTS 5 NOVEMBER 2012 THE PARENT AIRLINE 1H FY2012/13 RESULTS THE PARENT AIRLINE COMPANY RESULTS 2Q & 1H FY12/13 2Q/12 $million
Presentation on Results for the 3rd Quarter FY Idemitsu Kosan Co.,Ltd. February 14, 2018
 Presentation on Results for the 3rd Quarter FY 2017 Idemitsu Kosan Co.,Ltd. February 14, 2018 Table of Contents 1. FY 2017 3rd Quarter Results (1) Overview (2) Segment Information 2. Forecast for FY2017
AGENDA. The Marketing Tourism Growth Strategy of South Africa. Overview of the Domestic Tourism Market. The Domestic Marketing Strategy
 AGENDA The Marketing Tourism Growth Strategy of South Africa Overview of the Domestic Tourism Market Domestic Market Challenges The Domestic Marketing Strategy 2 Copyright 28 South African Tourism The
Singapore Airlines Group Analyst/Media Briefing HALF YEAR FY RESULTS. 13 November 2013 THE PARENT AIRLINE 1H FY2013/14 RESULTS
 Singapore Airlines Group Analyst/Media Briefing HALF YEAR FY2013-14 14 RESULTS 13 November 2013 THE PARENT AIRLINE 1H FY2013/14 RESULTS THE PARENT AIRLINE COMPANY RESULTS 2Q & 1H FY13/14 2Q/13 $million
Third Quarter 2014 Results. 29 October 2014
 Third Quarter 2014 Results 29 October 2014 Highlights of the Third Quarter Operating environment Air France-KLM Economic environment remains weak Further currency volatility affecting revenues and results
PETROSEA RESULTS FOR THE PERIOD ENDED 30 SEPTEMBER 2017
 PETROSEA RESULTS FOR THE PERIOD ENDED 30 SEPTEMBER 2017 PT Petrosea Tbk., a multi-disciplinary mining, infrastructure and oil & gas services company, reported its unaudited consolidated financial statements
Euroz Rottnest Investor Briefing
 Cedar Woods Properties Limited Euroz Rottnest Investor Briefing 15 March 2016 Cedar Woods Presentation 2 Snapshot of Achievements in FY2016 Extensive portfolio of residential estates in Perth and WA regions,
Golden Ocean Group Limited Q results March 1, 2007
 Golden Ocean Group Limited Q4 2006 results March 1, 2007 PROFIT & LOSS 2005 2006 (in thousands of $) 2006 2005 Oct-Dec Oct-Dec Jan - Dec Jan - Dec Operating Revenues 37 292 91 253 Time charter revenues
Indiabulls Real Estate Limited (CIN : L45101DL2006PLC148314)
") Indiabulls Real Estate Limited (CIN : L45101DL2006PLC148314) Earnings Update Audited Financial Results FY 2013-14 April 23, 2014 Safe Harbor Statement This document contains certain forward looking statements
Indiabulls Real Estate Limited (CIN : L45101DL2006PLC148314) Earnings Update Audited Financial Results FY 2013-14 April 23, 2014 Safe Harbor Statement This document contains certain forward looking statements
JUNE 2017 QUARTERLY ACTIVITIES REPORT
 ASX RELEASE 25 JULY 2017 JUNE 2017 QUARTERLY ACTIVITIES REPORT Cash flow positive result for the quarter even after significant development activities and repayment of Nullagine deferred royalties to the
BHP Billiton Limited (BHP) - Financial and Strategic SWOT Analysis Review
 - Financial and Strategic SWOT Analysis Review") BHP Billiton Limited (BHP) - Financial and Strategic SWOT Analysis Review BHP Billiton Limited (BHP) - Financial and Strategic SWOT Analysis Review Sector Publishing Intelligence Limited (SPi) has been
BHP Billiton Limited (BHP) - Financial and Strategic SWOT Analysis Review BHP Billiton Limited (BHP) - Financial and Strategic SWOT Analysis Review Sector Publishing Intelligence Limited (SPi) has been
For personal use only HILLS HOLDINGS HALF YEAR RESULTS FY2013
 HILLS HOLDINGS HALF YEAR RESULTS FY2013 TODAY KEY HIGHLIGHTS OUR FY13 FIRST HALF RESULTS GROUP PERFORMANACE FIRST HALF NPAT 1 $8.2M IN LINE WITH NOVEMBER AGM GUIDANCE. STRONG MANAGEMENT OF WORKING CAPITAL
P esent n atio i n o n f or o H alf l Y e Y ar E n E d n e d d d 31 D ecemb m e b r 2 008
 Queensland WA & QLD Report Summary Strong revenue growth of 61.8% to $234.5m Strong cash flow from operations of $20.9m Net debt to equity 23.2% Underlying net profit of $8.2m (before goodwill impairment
BHP Billiton: A Strategy of Diversification
 Olympic Dam, Australia BHP Billiton: A Strategy of Diversification Andrew Mackenzie Chief Executive Non-Ferrous 9 June 2010 Disclaimer Reliance on Third Party Information The views expressed here contain
CONTINENTAL OUTDOOR MEDIA ROMItrack
 CONTINENTAL OUTDOOR MEDIA ROMItrack CADBURY EVENT EVALUATION ANALYSIS Nielsen Analytics Team AGENDA 1 Business Question & Solution 2 Scope 4 Volume drivers 5 Results & Insights 6 Summary of findings 2
Corporate presentation CIBC Whistler Institutional Investor Conference January 21, 2010
 Corporate presentation CIBC Whistler Institutional Investor Conference January 21, 2010 Forwardlooking statement Certain information in this presentation and statements made during this presentation, including
Land area 1.73 million km 2 Queensland population (December 2015) Brisbane population* (June 2015)
 Brisbane population* (June 2015)") Queensland - 18 Queensland OVERVIEW Queensland is nearly five times the size of Japan, seven times the size of Great Britain, and two and a half times the size of Texas. Queensland is Australia s second
Queensland - 18 Queensland OVERVIEW Queensland is nearly five times the size of Japan, seven times the size of Great Britain, and two and a half times the size of Texas. Queensland is Australia s second
FIRST QUARTER 2017 RESULTS. 4 May 2017
 FIRST QUARTER 2017 RESULTS 4 May 2017 A resilient start of the year, traffic up 4.2% 20.9 million passengers carried, up 5.2%, traffic (RPK) up 4.2%, capacity (ASK) up 3.3% and load factor up 0.7pts Confirmation
Montie Brewer, President and CEO Joshua Koshy, Executive VP and CFO UBS Transport Conference
 Montie Brewer, President and CEO Joshua Koshy, Executive VP and CFO UBS Transport Conference 1 London, England September 17, 2007 Agenda Strongly positioned international airline Investment proposition
Provincial Review 2016: Limpopo
 Provincial Review 2016: Limpopo Limpopo s growth since 2003 has been dominated by the mining sector, especially platinum, and by national construction projects. As a result, the provincial economy grew
For personal use only. Merrill Lynch Emerging Stars Conference
 Merrill Lynch Emerging Stars Conference October 2013 Performance History Share Price Performance 12 Months 150 100 18.8% (3.6%) 14 Oct 2013 AHE ASX Small Ords Share price $3.72 2193.21 50 0 Oct-12 Dec-12
2006 Preliminary Results. 7 March 2007
 2006 Preliminary Results 7 March 2007 Anthony Rabin 16 Headline numbers 2005 2006 Revenue 4,938m 5,852m +19% Pre-tax profit* 134m 152m +13% Adjusted eps* 24.1p 27.3p +13% Full-year proposed dividend 8.1p
THE BUSINESS CASE FOR BIODIVERSITY STEWARDSHIP
 THE BUSINESS CASE FOR BIODIVERSITY STEWARDSHIP Primary Authors - Tracey Cumming (SANBI / DEA), Amanda Driver (SANBI) Secondary Authors Pravin Pillay (Ezemvelo KZN Wildlife), Greg Martindale (Ezemvelo KZN
26 October 2017 Icelandair Group Interim Report NET PROFIT USD 101 MILLION IN THIRD QUARTER
 NET PROFIT USD 101 MILLION IN THIRD QUARTER Total income in Q3 up by 10% between years, to USD 536.0 million Passenger revenue higher than expected EBITDA unchanged year on year, at USD 161.1 million Passenger
2018 full-year results
 2018 full-year results 01 Message from Chairman & CEO 02 FY 2018 Results 03 Business drivers 04 Outlook 02 FY 2018 financial results Key figures Revenue 2.85 Bn ROP 115 M Net debt 252 M Free cash flow
ABX HOLDINGS, INC. Shareholders Meeting. May 13, 2008
 Shareholders Meeting May 13, 2008 1 1 1 Safe Harbor Statement Except for historical information contained herein, the matters discussed in this presentation contain forward-looking statements that involve
Management Presentation. May 2013
 Management Presentation May 2013 Forward looking statements This presentation as well as oral statements made by officers or directors of Allegiant Travel Company, its advisors and affiliates (collectively
Thank you for participating in the financial results for fiscal 2014.
 Thank you for participating in the financial results for fiscal 2014. ANA HOLDINGS strongly believes that safety is the most important principle of our air transportation business. The expansion of slots
Management Presentation. March 2016
 Management Presentation March 2016 Forward looking statements This presentation as well as oral statements made by officers or directors of Allegiant Travel Company, its advisors and affiliates (collectively
September 2010 Brian Pearce To represent, lead and serve the airline industry
 Cycle turns up but risks and structural challenges remain September 2010 Brian Pearce www.iata.org/economics To represent, lead and serve the airline industry Confidence was still high in July survey Airline
PRELIMINARY ACCOUNTS FOR 2012
 INTERIM REPORT FOR Q4 2012 AND INTERIM REPORT FOR Q4 2012 AND PRELIMINARY ACCOUNTS FOR 2012 HIGHLIGHTS Q4 with growth in volume and improved normalized EBITDA MNOK 261 improvement in normalized EBITDA
Jet Airways (India) Ltd. Presentation on Annual Results FY06. May 2006
 Ltd. Presentation on Annual Results FY06. May 2006") Jet Airways (India) Ltd. Presentation on Annual Results FY06 May 2006 1 Agenda 1. Performance Highlights 2. Sahara Acquisition Update 3. Outlook 2 Performance Highlights 3 Domestic landscape capacity growth
Jet Airways (India) Ltd. Presentation on Annual Results FY06 May 2006 1 Agenda 1. Performance Highlights 2. Sahara Acquisition Update 3. Outlook 2 Performance Highlights 3 Domestic landscape capacity growth
STAYING TRUE. Scotia Capital Transportation & Aerospace Conference. November 15, 2011
 STAYING TRUE Scotia Capital Transportation & Aerospace Conference November 15, 2011 FORWARD-LOOKING STATEMENT Certain information in this presentation and statements made during this presentation, including
Land area 1.73 million km 2 Queensland population (as at December 2016) Brisbane population* (preliminary estimate as at 30 June 2016)
 Brisbane population* (preliminary estimate as at 30 June 2016)") Queensland - 11 Queensland OVERVIEW Queensland is nearly five times the size of Japan, seven times the size of Great Britain, and two and a half times the size of Texas. Queensland is Australia s second
Queensland - 11 Queensland OVERVIEW Queensland is nearly five times the size of Japan, seven times the size of Great Britain, and two and a half times the size of Texas. Queensland is Australia s second
Results presentation. 21 & 22 February for the half-year ended 31 December 2017 *
 Results presentation for the half-year ended 31 December 2017 * 21 & 22 February 2018 * released on SENS on 21 February 2018 EXECUTIVE MANAGEMENT TEAM 2 Charles Walters Chief Executive Officer Ross Davies
The Outlook for the Residential Construction Industry Hunter and the Central Coast
 The Outlook for the Residential Construction Industry Hunter and the Central Coast Graham Wolfe HIA Chief Executive Industry Policy and Media HIA Industry Outlook Breakfast Newcastle February 2013 Backdrop:
Investment Highlights
 Third Quarter 2014 Investment Highlights 1 Mexican airport portfolio positioned to take full advantage of global growth. 2 Diversified business model contributing to earnings resilience. 3 Well-defined
AGENDA. Group overview. Financial highlights. Operational highlights. Expansion plans
 1 AGENDA Group overview Financial highlights Operational highlights Expansion plans 2 3 CURRENT FOOTPRINT Kenya 12 stores 2 DCs Tanzania 2 stores Number of stores 31-Dec-16 31-Dec-17 Increase: Dec-16 to
South Africa National Convention Bureau
 South Africa National Convention Bureau Panel Session: Accelerating the City of Tshwane s Stature as a Business and Leisure Tourism Destination of Choice Amanda Kotze-Nhlapo Chief Convention Bureau Officer
Ramsay Health Care Limited Results Briefing Half Year ended 31 December 2018
 Ramsay Health Care Limited Results Briefing Half Year ended 31 December 2018 Craig McNally, Group Managing Director & Bruce Soden, Group Finance Director 28 February 2019 ramsayhealth.com Agenda Group
Bank of America Merrill Lynch 2018 Emerging Markets Corporate Credit Conference. Miami, May 2018
 Bank of America Merrill Lynch 2018 Emerging Markets Corporate Credit Conference Miami, May 2018 This presentation may include forward-looking comments regarding the Company s business outlook and anticipated
01 Amadeus at a glance
 01 Amadeus at a glance 7 Amadeus Annual Report 2011 1.1 Company s origins and development Most people associate the birth of electronic commerce distribution with the arrival of the internet. In fact,
Press Release. Bilfinger with dynamic start to financial year 2018
 Press Release May 15, 2018 Bilfinger with dynamic start to financial year 2018 Book-to-bill ratio reaches 1.2 in the first quarter Fourth consecutive growth quarter in orders received Adjusted EBITA above
Finnair Q Result
 Finnair Q1 2015 Result 7 May 2015 CEO Pekka Vauramo, Interim CFO Mika Stirkkinen 1 Turbulent market environment The weakness of the Finnish economy continued to be reflected in the demand in the first
JAPAN AIRLINES Co., Ltd. Financial Results 1 st Quarter Mar/2017(FY2016) July 29, 2016
 July 29, 2016") JAPAN AIRLINES Co., Ltd. Financial Results Mar/2017(FY2016) July 29, 2016 Today s Topics P.1 P.2 P.13 From the first quarter of this fiscal year, figures for Revenue Passengers Carried, ASK, RPK and Load
JAPAN AIRLINES Co., Ltd. Financial Results Mar/2017(FY2016) July 29, 2016 Today s Topics P.1 P.2 P.13 From the first quarter of this fiscal year, figures for Revenue Passengers Carried, ASK, RPK and Load
INVESTOR MEETING. CEO Airbus Group CEO Airbus CFO Airbus Group & Airbus. Tom Enders Fabrice Bregier Harald Wilhelm PARIS AIRSHOW 2015
 1 INVESTOR MEETING PARIS AIRSHOW 2015 Tom Enders Fabrice Bregier Harald Wilhelm CEO Airbus Group CEO Airbus CFO Airbus Group & Airbus PATH TO ENHANCED VALUE 2 Healthy commercial aircraft market Transformation
Financial Results 3 rd Quarter MAR/2016 (FY2015)
") Financial Results MAR/2016 (FY2015) January 29 th, 2016 CONTENTS P.1 P.2 P.3 P.4~ Overview of FY MAR/16 Results Operating Revenue Operating Profit 1,030 1,020 1,010 +1.0Bn 1,022.3 1,023.4 (+0.1%) 180 160
Financial Results MAR/2016 (FY2015) January 29 th, 2016 CONTENTS P.1 P.2 P.3 P.4~ Overview of FY MAR/16 Results Operating Revenue Operating Profit 1,030 1,020 1,010 +1.0Bn 1,022.3 1,023.4 (+0.1%) 180 160
SIA ANALYST/MEDIA BRIEFING Q2 and 1H FY17/18 Results 8 November 2017
 SIA ANALYST/MEDIA BRIEFING Q2 and 1H FY17/18 Results 8 November 2017 THE PARENT AIRLINE Q2 AND 1H FY17/18 RESULTS THE PARENT AIRLINE COMPANY OPERATING PERFORMANCE Q2 % 1H % FY17/18 Change FY17/18 Change
The Residential Outlook for South Australia
 The Residential Outlook for South Australia Matthew King Economist HOUSING INDUSTRY ASSOCIATION February 2011 Overview Economic backdrop Other important matters Interest rates & bank lending Renovations
Shifting Perspectives
 Shifting Perspectives Disclaimer Certain statements in this document may constitute forward looking statements. Such forward looking statements involve known and unknown risks, uncertainties and other
Interim Management Report First Half Results 2010/11. October 29, 2010
 Interim Management Report First Half Results 2010/11 October 29, 2010 Disclaimer Certain information included in these statements is forward-looking and involves risks and uncertainties that could cause
OPERATING AND FINANCIAL HIGHLIGHTS. Subsequent Events
 Copa Holdings Reports Financial Results for the First Quarter of 2016 Excluding special items, adjusted net income came in at US$69.9 million, or EPS of US$1.66 per share Panama City, Panama --- May 5,
BHP Billiton Iron Ore Western Australia. Iron Ore. Presentation to Analysts June Ian Ashby, President and COO BHP Billiton Iron Ore
 BHP Billiton Western Australia Presentation to Analysts June 2005 Ian Ashby, President and COO BHP Billiton BHP Billiton Overview Record 53.6Mt of iron ore produced in the first half of FY2005 On target
USA Acquisition Summary. December 2010
 USA Acquisition Summary December 2010 www.roadbearrv.com Strategic Intent 1. To leverage the existing business capabilities in a significant sized and growing tourism market with a similar customer base.
OPERATING AND FINANCIAL HIGHLIGHTS. Subsequent Events
 Copa Holdings Reports Net Income of $103.8 million and EPS of $2.45 for the Third Quarter of 2017 Excluding special items, adjusted net income came in at $100.8 million, or EPS of $2.38 per share Panama
JAPAN AIRLINES Co., Ltd. Financial Results 1 st Quarter Mar/2018(FY2017)
") JAPAN AIRLINES Co., Ltd. Financial Results Mar/2018(FY2017) July 31, 2017 Today s Topics P.1 P.2 P.3 P.4 P.6 P.15 Overview of Financial Results for (FY2017) 1 st quarter resulted in an increase in both
JAPAN AIRLINES Co., Ltd. Financial Results Mar/2018(FY2017) July 31, 2017 Today s Topics P.1 P.2 P.3 P.4 P.6 P.15 Overview of Financial Results for (FY2017) 1 st quarter resulted in an increase in both
OPERATING AND FINANCIAL HIGHLIGHTS
 Copa Holdings Reports Net Income of US$32.0 Million and EPS of US$0.72 for the Second Quarter of 2012 Excluding special items, adjusted net income came in at $58.6 million, or EPS of $1.32 per share Panama
STAYING TRUE. BofAML Global Transportation Conference. May
 STAYING TRUE BofAML Global Transportation Conference May 19 2011 FORWARD-LOOKING STATEMENT Certain information in this presentation and statements made during this presentation, including any question
Volaris Reports Strong First Quarter 2015: 32% Adjusted EBITDAR Margin, 9% Operating Margin
 Volaris Reports Strong First Quarter 2015: 32% Adjusted EBITDAR Margin, 9% Operating Margin Mexico City, Mexico, April 22, 2015 Volaris* (NYSE: VLRS and BMV: VOLAR), the ultra-low-cost airline serving
AIR NEW ZEALAND ANNUAL RESULTS ANNUAL RESULTS
 AIR NEW ZEALAND ANNUAL RESULTS 2008 1 HIGHLIGHTS Record operating revenue, up 9% Normalised earnings* $197m Net cash position of $1.3bn Launched direct service to Vancouver and Beijing Award winning product
FIRST QUARTER RESULTS 2017
 FIRST QUARTER RESULTS 2017 KEY RESULTS In the 1Q17 Interjet total revenues added $4,421.5 million pesos that represented an increase of 14.8% over the income generated in the 1Q16. In the 1Q17, operating
SET Opportunity Day #3/2011
 SET Opportunity Day #3/2011 2Q11 & 1H11 Performance & Outlook 18 August 2011 The views expressed here contain some information derived from publicly available sources that have not been independently verified.
Final Dividend 7.0 cents per share, full year payout of 10.0
 KATHMANDU HOLDINGS LIMITED ASX/NZX/Media Announcement 21 September 2011 Kathmandu Holdings Ltd announces record sales and earnings result for FY2011: NZ$ Denominated Result Sales up 24.5% to $306.1m, EBIT
Management Presentation. November 2011
 Management Presentation November 2011 Forward looking statements This presentation as well as oral statements made by officers or directors of Allegiant Travel Company, its advisors and affiliates (collectively
Leaving the Competition Behind. Second Quarter (Apr-Jun) 2009 Results
 2009 Results") Leaving the Competition Behind Second Quarter (Apr-Jun) 2009 Results 12 Aug 2009 1 Disclaimer Information contained in our presentation is intended solely for your reference. Such information is subject
Leaving the Competition Behind Second Quarter (Apr-Jun) 2009 Results 12 Aug 2009 1 Disclaimer Information contained in our presentation is intended solely for your reference. Such information is subject
Final Results 31 December 2013
 Final Results 31 December 2013 Clarkson PLC 10 March 2014 www.clarksons.com Agenda Headline results Divisional performance Business Model & Strategy The market Outlook 10 March 2014 Final Results www.clarksons.com
ANNUAL GENERAL MEETING 22 November 2005
 ANNUAL GENERAL MEETING 22 November 2005 CHAIRMAN S OVERVIEW FY 2005 Year of transition, Affinity acquisition doubles size of company Affinity acquisition most exciting development in Ramsay history welcomed
For personal use only
 THE GPT GROUP ANNOUNCES 29 October 2014 September Quarter Operational Update Key Highlights 2014 earnings guidance upgraded to at least 4 per cent earnings per security (EPS) growth Strong leasing momentum
PARENT AIRLINE OPERATIONS LIFT GROUP PROFIT
 PARENT AIRLINE OPERATIONS LIFT GROUP PROFIT HIGHLIGHTS OF THE GROUP S PERFORMANCE Financial Year 2006-07 4th Quarter 2006-07 Apr 2006 Mar 2007 Year-on-Year % Change Jan-Mar 2007 Year-on-Year % Change Operating
INVESTOR PRESENTATION: APPENDICES 26 FEBRUARY 2018 RESULTS FOR THE SIX MONTHS ENDED DECEMBER 2017
 INVESTOR PRESENTATION: APPENDICES 26 FEBRUARY 2018 RESULTS FOR THE SIX MONTHS ENDED DECEMBER 2017 RCL FOODS IN CONTEXT FOOD, LIQUOR & HOME CARE BANKING HEALTHCARE INSURANCE INDUSTRIAL INFRASTRUCTURE MEDIA
Interim Results 2010/ October 2010
 Interim Results 2010/11 19 October 2010 1 Anthony Habgood Chairman 2 Christopher Rogers Group Finance Director 3 Summary H1 2010/11 H1 2010/11 H1 2009/10 Change Underlying profit before tax 151.8m 118.2m
AEROFLOT ANNOUNCES FY 2017 IFRS FINANCIAL RESULTS
 AEROFLOT ANNOUNCES FY 2017 IFRS FINANCIAL RESULTS Moscow, 1 March 2018 Aeroflot Group ( the Group, Moscow Exchange ticker: AFLT) today publishes its audited financial statements in accordance with International
Investment Highlights
 Second Quarter 2014 Investment Highlights 1 Mexican airport portfolio positioned to take full advantage of global growth. 2 Diversified business model contributing to earnings resilience. 3 Well-defined
FY2015 2nd Quarter Business Results
 FY2015 2nd Quarter Business Results Project AH A MAY products Yamaha Corporation and Yamaha Motor Co., Ltd. make products by exchanging the design divisions and their design fields, and present a joint
ABX. Holdings, Inc. BB&T Transportation Conference. February 2008
 ABX Holdings, Inc. BB&T Transportation Conference February 2008 1 Safe Harbor Statement Except for historical information contained herein, the matters discussed in this presentation contain forward-looking
SAS Group Asia Tour Financial Hearing Presentation May 14, 2012
 SAS Group Asia Tour Financial Hearing Presentation May 14, 2012 1 This is the SAS Group 128 destinations 27,2 million passengers 28 new routes to be launched 2012 1,085 daily flights Revenues 2011, MSEK
Crown Corporation Business Plans. Trade Centre Limited
 Crown Corporation Business Plans Trade Centre Limited Contents Message from the CEO and the Chair... 5 Mandate... 7 Alignment with Government s Priorities... 7 Core Responsibilities... 9 Budget Context...
2016 Full-year Results Supplementary Information
 206 Full-year Results Supplementary Information Wednesday, 24 August 206 (to be read in conjunction with the 206 Full-year Results Briefing Presentation) Presentation outline Item Presenter Page Group
METRO OPERATIONS COMMITTEE
 Los Angeles County Metropolitan Transportation Authority Item 1 CHIEF OPERATIONS OFFICER S S REPORT METRO OPERATIONS COMMITTEE Lonnie Mitchell Chief Operations Officer May 19, 20 1 Employee Recognition