Interim Management Report First Half Results 2010/11. October 29, 2010
|
|
|
- Andrew Sherman
- 5 years ago
- Views:
Transcription

1 Interim Management Report First Half Results 2010/11 October 29, 2010
2 Disclaimer Certain information included in these statements is forward-looking and involves risks and uncertainties that could cause actual results to differ materially from those expressed or implied by the forward looking statements. Forward-looking statements include, without limitation, projections relating to results of operations and financial conditions and the Company's plans and objectives for future operations, including, without limitation, discussions of the Company's Business Plan programs, expected future revenues, financing plans and expected expenditures and divestments. All forward-looking statements in this report are based upon information known to the Company on the date of this report. The Company undertakes no obligation to publicly update or revise any forward-looking statement, whether as a result of new information, future events or otherwise. It is not reasonably possible to itemise all of the many factors and specific events that could cause the Company's forward looking statements to be incorrect or that could otherwise have a material adverse effect on the future operations or results of an airline operating in the global economy.
3 Martin Broughton Chairman
4 Keith Williams Chief Financial Officer
5 First quarter Cost driven recovery Hit by volcanic ash and disruption Second quarter Revenue improvement Driven by yield recovery Continuing cost control Back to profitability
6 m 400 Operating Profit + 387m 300 m vly Q2 Revenue Net costs +4 Op Profit m vly Q1 0 Revenue m Q1 2009/ /11 Q2 Net costs -68 Op Profit +22
7 ...built on strong second quarter yields % change VLY PASSENGER BUSINESS RPKs ASKs Seat Factor (pts) Yield/RPK constant exchange 3 months ended September 30, 2010 Yield/RPK
8 Looking at passenger yield performance in detail. Yield/RPK % vly Q1 09/10 Q2 09/10 Q1 10/11 Q2 10/11 Reported yield Underlying yield
9 Longhaul Premium Volume by Fare Type Volume (PSJs) Q Q Q Q Q Q Q Q Q Q Q Q Q Flexible Fares Leisure / Redemption
10 Shorthaul Premium Volume by Fare Type Volume (PSJs) Q Q Q Q Q Q Q Q Q Q Q Q Q Flexible Fares Leisure / Redemption
11 A similar yield story in Cargo % change VLY CARGO BUSINESS CTKS ATKS Yield/CTK constant exchange 3 months ended September 30, Yield/CTK
12 Headline numbers second quarter Jul - Sep m Better/ (worse) vly Turnover 2, % Fuel costs 665 (5.2)% Non fuel costs 1, % Operating profit 370 nm Operating margin 14.7% 15.5pts EBITDAR % Pre-tax profit 322 nm Period ended September 30, 2010
13 Headline numbers first half Apr - Sep m Better/ (worse) vly Turnover 4, % Fuel costs 1,257 (2.4)% Non fuel costs 2, % Operating profit 298 nm Operating margin 6.7% 9.4pts EBITDAR % Pre-tax profit 158 nm Period ended September 30, 2010
14 Revenue continues to grow m Apr-Sep vly Jul-Sep vly Passenger 3, % 2, % Cargo % % Other 219 (15.1)% % 4, % 2, % Period ended September 30, 2010
15 Q2 Costs held despite exchange. 3 months July to September 2010 m % vly Employee costs up Restructuring 0 nm Engineering & other aircraft up Landing & en route charges up Handling, catering etc flat Selling costs down Other costs (inc. retranslation) down TOTAL COSTS (excl. fuel) 1, down Fuel & oil up REPORTED TOTAL COSTS 2, up Period ended September 30, 2010
16 First Half Costs down 6 months April to September 2010 m % vly Employee costs 1, down Restructuring 0 nm Engineering & other aircraft up Landing & en route charges down Handling, catering etc down Selling costs up Other costs (inc. retranslation) down TOTAL COSTS (excl. fuel) 2, down Fuel & oil 1, up REPORTED TOTAL COSTS 4, down Period ended September 30, 2010
17 A solid hedging position for the year. Hedging Q1 Q2 Q3 Q4 11/12 $/bbl Price Paid by BA % Cover FY 1011 BA Price Market Price $1 oil = +/- 5m cost (approx) $/bbl Crude Price
18 With fuel cost increase as anticipated. m First Half: + 29m vly m H2 Volume +80 Price (net of hedging) +70 Exchange +20 Total Q1 Q2 Q3 Q4 2009/ /11
19 A reminder of winter capacity ASK VLY% 10 Tactical cancellations and disruption in winter base 5 0 3% underlying (5) (10) Winter 09/10 Full Year 09/10 Winter 10/11 Full Year 10/11
20 Capacity outlook for summer 2011 ASKs VLY% ER th JFK service Tokyo (Haneda) San Diego & Buenos Aires direct increased flying to Caribbean 5 Underlying increase 4-5% 0 (5) LHR longhaul LGW longhaul Shorthaul Total Underlying increase Disruption in base
21 Cash and net debt continuing to improve. Cash generated from operations 554m (up 468m vly) Cash balance increased to 1,857 million m 2,500 2,000 General facilities Cash 1,500 1, Mar-09 Sep-09 Mar-10 Sep-10 Net debt reduced to 2,047 million
22 % Yield/RPK vly Q1 Q2 Winter 2009/ /11
23 domestic/up to 2000 miles UK Air Passenger Duty - economy miles miles over 6000 miles 1994 Oct-10 Nov-10
24 OPPORTUNITIES Joint Business with AA/IB New routes Underlying economic growth RISKS APD Competitor capacity UK consumer confidence
25
26 Willie Walsh Chief Executive Officer
27 Delivering on our agenda Merger with Iberia Joint Business Pension Recovery Plan Restoring Profitability Structural cost base T5 transformation Investing for the future
28 Our merger
29 Iberia timetable Publication of key documents October 26 Shareholder meetings November 29 Closing January 2011

30 Our Joint Business
31 Why is the Joint Business necessary? Star and SkyTeam alliance members with broad-based immunity protections have a distinct advantage over AA, BA and IB competitive position at LHR Joint Business structure enhances relationships, global reach and the ability to coordinate, schedule and market the network ATI/Joint Business brings substantial benefits to our customers


32 Our customer vision: how they benefit Access to broader network via extensive codeshare Superior customer experience and service integration Greater convenience through coordinated schedules Corporate customers benefit from joint sales agreements across larger network Frequent flyer programme consistency
33 New timings give greater choice ORD >>> LHR - Departure Times Pre-ATI BA = Blue AA = Orange Post-ATI BA = Blue AA = Orange 6:00 8:00 10:00 12:00 14:00 16:00 18:00 20:00 22:00 0:00 Local Time 6:00 8:00 10:00 12:00 14:00 16:00 18:00 20:00 22:00 0:00 Local Time ORD >>> LHR - Arrival Times Pre-ATI BA = Blue AA = Orange Post-ATI BA = Blue AA = Orange 6:00 8:00 10:00 12:00 14:00 16:00 18:00 20:00 22:00 0:00 Local Time 6:00 8:00 10:00 12:00 14:00 16:00 18:00 20:00 22:00 0:00 Local Time

34 Five exciting new Joint Business routes Delivering profitable growth & improved customer choice New York JFK Budapest 7pw Chicago Helsinki 7pw London LHR San Diego 7pw MIA BCN Madrid Los Angeles 4pw Barcelona Miami 7pw
35 Pension recovery plan Agreement reached with pension trustees Approved by Pensions Regulator Contributions to remain at 330m in real terms Benefit changes introduced for future service from October 1, 2010
36 Restoring profitability July - September Operating Result ( m)
37 Cost actions the key to profitability m H H Structural cost savings Non Fuel Non Fuel Fuel Fuel Non operating costs Revenue Costs Revenue Costs Since Revenue Flat Fuel up 28% Non-fuel Flat, after annualised savings of 400m
38 Structural changes Management reduction December 2008 Engineering efficiencies June 2009 Flight crew efficiencies October 2009 Cabin crew changes November 2009 Passenger service efficiencies Agreed August 2010
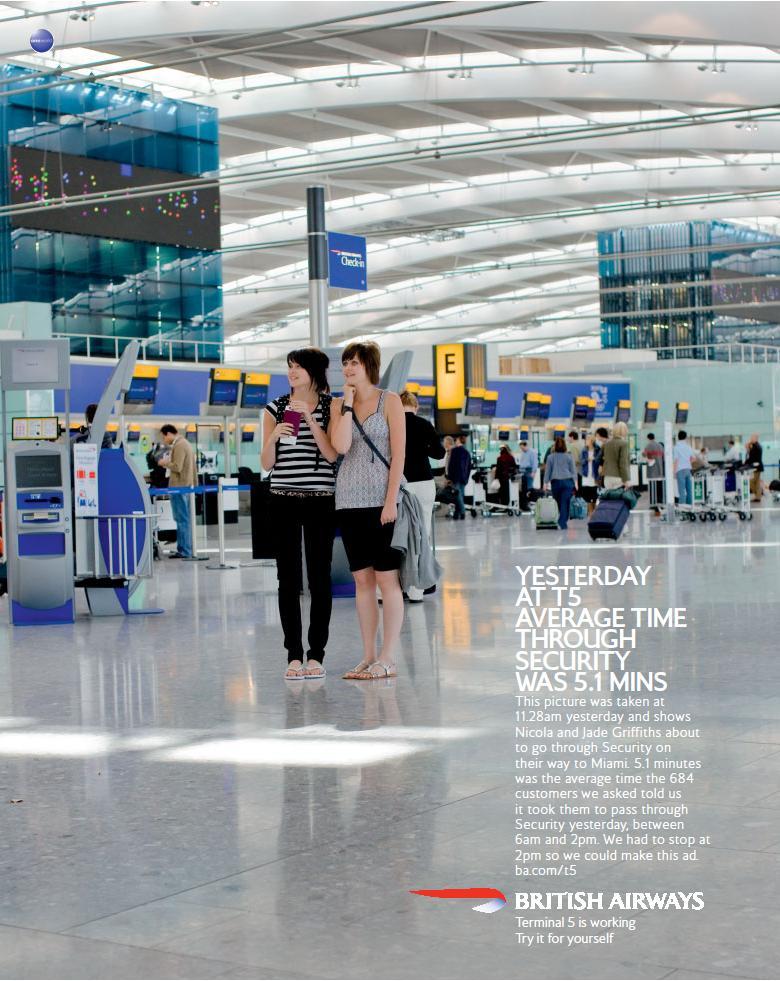

39 T5 Transformation
40 Step change in departure punctuality 100% Mainline departures on time performance 90% Post-T5 Opening 80% 70% 60% 50% Aug-06 Oct-06 Dec-06 Pre-T5 Opening Feb-07 Apr-07 Jun-07 Aug-07 Oct-07 Dec-07 Feb-08 Apr-08 Jun-08 Aug-08 Oct-08 Dec-08 Feb-09 Apr-09 Jun-09 Aug-09 Oct-09 Dec-09 Feb-10 Apr-10 Jun-10 Aug-10
41 Heathrow baggage regularly beating target LHR Overall Shortlanded Baggage Performance Shortlanded Bags / 1000 Pax 120 Shortlanded Bags / 1000 Pax Apr May Jun Jul Aug Sep Oct Nov Dec Jan Feb Mar 2006/7 2007/8 2008/9 2009/ /11 Target


42 Investing for the future
43 Start of an exciting new chapter
44
45 Q & A
46
Full Year 2009 Results
 Full Year 2009 Results 1 Antonio Vázquez Chairman & Chief Executive Officer 2 Highlights 2009 Strong decrease in revenues: weak demand and yield deterioration. High competition and drop of business traffic.
IAG results presentation. Quarter One th May 2018
 IAG results presentation Quarter One 2018 4 th May 2018 Highlights Willie Walsh, Chief Executive Officer Highlights Another strong quarter performance with an operating profit of 280m (5.6% margin, +2.3pts)
SAS Group Q Teleconference
 SAS Group Q4 2012 Teleconference December 12, 2012 1 Break-even result in 2012 despite 1.6 bn SEK higher fuel cost 23 MSEK EBT (before non-recurring items) despite 1.6 bn SEK higher fuel cost Positive
Fourth Quarter and Full Year 2011 Results Presentation. February 1, 2012
 Fourth Quarter and Full Year 2011 Results Presentation February 1, 2012 This presentation may include forward-looking comments regarding the Company s business outlook and anticipated financial and operating
2010 Preliminary Full Year Results. 28 February 2011
 2010 Preliminary Full Year Results 28 February 2011 Disclaimer Forward looking information Certain information included in these statements is forward-looking and involves risks and uncertainties that
Q3 Results, Feb 2016
 Q3 Results, Feb 2016 Europe s Favourite Airline Europe s Lowest Fares/Lowest Cost Carrier No 1, Traffic 106m No 1, Coverage 78 Bases No 1, C mer Service Low Fares/On-time/Fewest/Canx Always Getting Better
Singapore Airlines Group Analyst/Media Briefing HALF YEAR FY RESULTS 5 NOVEMBER 2012 THE PARENT AIRLINE 1H FY2012/13 RESULTS
 Singapore Airlines Group Analyst/Media Briefing HALF YEAR FY2012-13 13 RESULTS 5 NOVEMBER 2012 THE PARENT AIRLINE 1H FY2012/13 RESULTS THE PARENT AIRLINE COMPANY RESULTS 2Q & 1H FY12/13 2Q/12 $million
First Quarter Results August 31 st, 2006
 First Quarter Results 2006-07 August 31 st, 2006 Key features of the First Quarter Market context Sustained global economic growth, and a recovery in Europe Average jet fuel price of 691 $/t, up 25% year-on-year
Bank of America Merrill Lynch 2018 Emerging Markets Corporate Credit Conference. Miami, May 2018
 Bank of America Merrill Lynch 2018 Emerging Markets Corporate Credit Conference Miami, May 2018 This presentation may include forward-looking comments regarding the Company s business outlook and anticipated
JAPAN AIRLINES Co., Ltd. Financial Results 1 st Quarter Mar/2018(FY2017)
") JAPAN AIRLINES Co., Ltd. Financial Results Mar/2018(FY2017) July 31, 2017 Today s Topics P.1 P.2 P.3 P.4 P.6 P.15 Overview of Financial Results for (FY2017) 1 st quarter resulted in an increase in both
JAPAN AIRLINES Co., Ltd. Financial Results Mar/2018(FY2017) July 31, 2017 Today s Topics P.1 P.2 P.3 P.4 P.6 P.15 Overview of Financial Results for (FY2017) 1 st quarter resulted in an increase in both
Air China Limited Annual Results. March Under IFRS
 Air China Limited 21 Annual Results Under IFRS March 211 Agenda Part 1 Highlights Part 2 Business Overview Part 3 Financial Overview Part 4 Outlook 2 Part 1 Highlights Steady Economic Growth; Asia Pacific
SIA GROUP FINANCIAL RESULTS
 FINANCIAL RESULTS For Ended 30 June 2018 197200078R Operating Result Q1 Q1 Better/ FY18/19 FY17/18 R1 (Worse) ($M) ($M) (%) Total Revenue 3,844 3,864 (0.5) Q1 Better/ FY17/18 R2 (Worse) ($M) (%) 3,689
Santander 22 nd Annual Latin American Conference. Cancun, January 2018
 Santander 22 nd Annual Latin American Conference Cancun, January 2018 This presentation may include forward-looking comments regarding the Company s business outlook and anticipated financial and operating
SIA ANALYST/MEDIA BRIEFING Q2 and 1H FY17/18 Results 8 November 2017
 SIA ANALYST/MEDIA BRIEFING Q2 and 1H FY17/18 Results 8 November 2017 THE PARENT AIRLINE Q2 AND 1H FY17/18 RESULTS THE PARENT AIRLINE COMPANY OPERATING PERFORMANCE Q2 % 1H % FY17/18 Change FY17/18 Change
Management Presentation. November 2018
 Management Presentation November 2018 Forward looking statements This presentation as well as oral statements made by officers or directors of Allegiant Travel Company, its advisors and affiliates (collectively
SAS Group Presentation Carnegie, May 22, 2012 Sture Stölen, Head of IR
 SAS Group Presentation Carnegie, May 22, 2012 Sture Stölen, Head of IR 1 This is the SAS Group 128 destinations 27,2 million passengers 28 new routes to be launched 2012 1,085 daily flights Revenues 2011,
Air China Limited 2014 Annual Results Under IFRS
 Air China Limited 2014 Annual Results Under IFRS March 2015 Agenda Part 1 Results Highlights Part 2 Business Overview Part 3 Financial Overview Part 4 Outlook Part 1 Results Highlights Gradual Global Economic
Transportation and Logistics Conference. Toronto March 18, 2008
 Transportation and Logistics Conference Toronto March 18, 2008 1 Our Investment Proposition Innovative revenue strategy that produces results Major cost reductions Strong financial performance Aggressive
Jet Airways (India) Ltd. Presentation on Annual Results FY06. May 2006
 Ltd. Presentation on Annual Results FY06. May 2006") Jet Airways (India) Ltd. Presentation on Annual Results FY06 May 2006 1 Agenda 1. Performance Highlights 2. Sahara Acquisition Update 3. Outlook 2 Performance Highlights 3 Domestic landscape capacity growth
Jet Airways (India) Ltd. Presentation on Annual Results FY06 May 2006 1 Agenda 1. Performance Highlights 2. Sahara Acquisition Update 3. Outlook 2 Performance Highlights 3 Domestic landscape capacity growth
Management Presentation. May 2013
 Management Presentation May 2013 Forward looking statements This presentation as well as oral statements made by officers or directors of Allegiant Travel Company, its advisors and affiliates (collectively
2012 Result. Mika Vehviläinen CEO
 2012 Result Mika Vehviläinen CEO 1 Agenda Market environment in Q4 Business performance and strategy execution Outlook Financials 2 Market Environment According to IATA, Global air travel continues to
Cathay Pacific Airways Interim Results for the six months ended 30 June 2012
 Cathay Pacific Airways Interim Results for the six months ended 30 June 2012 8 August 2012 1 Interim Result 1H2012 1H2011 Change Group attributable (loss) / profit HK$ million (935) 2,808-133.3% Group
2007/08 Full Year Results Investor Briefing
 2007/08 Full Year Results Investor Briefing Highlights of Result Profit before tax up 46% to $1,408 million Up 36% on the reported result Margin improvement $3 billion of Sustainable Future Benefits achieved
JAPAN AIRLINES Co., Ltd. Financial Results 1 st Quarter Mar/2018(FY2017)
") JAPAN AIRLINES Co., Ltd. Financial Results Mar/2018(FY2017) July 31, 2017 Today s Topics P.1 P.2 P.3 P.4~ P.6~ P.15~ Overview of Financial Results for Mar/18 Mar/18 (FY2017) 1 st quarter resulted in an
JAPAN AIRLINES Co., Ltd. Financial Results Mar/2018(FY2017) July 31, 2017 Today s Topics P.1 P.2 P.3 P.4~ P.6~ P.15~ Overview of Financial Results for Mar/18 Mar/18 (FY2017) 1 st quarter resulted in an
Third Quarter Results
 1 Third Quarter 2010-11 Results Highlights of the Third Quarter Passenger business affected by significant disruptions Dynamic cargo activity Strong improvement in results Decline in ex-fuel unit costs
Cathay Pacific Airways 2013 Analyst Briefing 25 June Cathay Pacific Airways Analyst Briefing 27 November 2013
 Cathay Pacific Airways 2013 Analyst Briefing 25 June 2013 Cathay Pacific Airways Analyst Briefing 27 November 2013 2013 Operating Performance to date: Passenger yield and load factor growth on lower ASKs.
JAPAN AIRLINES Financial Results 2 nd Quarter Mar / 2014 (FY2013)
") JAPAN AIRLINES Financial Results 2 nd Quarter Mar / 2014 (FY2013) Yoshiharu Ueki, President Norikazu Saito, Managing Executive Officer 31 October, 2013 Contents P.2 P.3 P.4 P.6 1 Overview of 2 nd Quarter
JAPAN AIRLINES Financial Results 2 nd Quarter Mar / 2014 (FY2013) Yoshiharu Ueki, President Norikazu Saito, Managing Executive Officer 31 October, 2013 Contents P.2 P.3 P.4 P.6 1 Overview of 2 nd Quarter
2011 Preliminary Full Year Results. 28 February 2012
 2011 Preliminary Full Year Results 28 February 2012 Disclaimer Forward looking information Certain information included in these statements is forward-looking and involves risks and uncertainties that
Information meeting. Jean-Cyril Spinetta Chairman and CEO
 Information meeting Jean-Cyril Spinetta Chairman and CEO Forward-looking statements The information herein contains forward-looking statements about Air France-KLM and its business. These forward-looking
Management Presentation. November 2011
 Management Presentation November 2011 Forward looking statements This presentation as well as oral statements made by officers or directors of Allegiant Travel Company, its advisors and affiliates (collectively
TUI GROUP INVESTOR PRESENTATION
 TUI GROUP INVESTOR PRESENTATION German Investment Conference UniCredit / Kepler Munich, 26-27 September 2012 Future-related statements This presentation contains a number of statements related to the future
Air China Limited Interim Results. August Under IFRS
 Air China Limited 21 Interim Results Under IFRS August 21 1 Agenda 21 Interim Results Overview Business Overview Financial Overview Outlook 2 2 2 21 Interim Results 3 21 Interim Results Overview 4 4 4
Vueling Airlines 2010 Full-Year and Q4 Financial Results
 Vueling Airlines 2010 Full-Year and Q4 Financial Results Executive summary Executive Summary Vueling achieved a net profit of 46m in 2010, a 66% increase vs. 2009. In Q4, the net loss has been reduced
Corporate presentation CIBC Whistler Institutional Investor Conference January 21, 2010
 Corporate presentation CIBC Whistler Institutional Investor Conference January 21, 2010 Forwardlooking statement Certain information in this presentation and statements made during this presentation, including
Gerry Laderman SVP Finance, Procurement and Treasurer
 Gerry Laderman SVP Finance, Procurement and Treasurer Safe Harbor Statement Certain statements included in this release are forward-looking and thus reflect our current expectations and beliefs with respect
1 st Quarter Results FY
 1 st Quarter Results FY 2004-05 05 Q1 Highlights p Context 8Improving economic context 8Strong economic growth in Americas and Asia 8Modest economic recovery in Europe 8Soaring fuel prices 8IPE Brent up
JET AIRWAYS (I) LTD. Presentation on Financial Results Q3 2012
 LTD. Presentation on Financial Results Q3 2012") JET AIRWAYS (I) LTD Presentation on Financial Results Q3 2012 20.01.2012 1 1 1 Domestic operating environment 2 2 2 Domestic industry. 8.00 7.00 6.00 5.00 4.00 3.00 Q3 12 vs Q3 11 Industry capacity 17%
JET AIRWAYS (I) LTD Presentation on Financial Results Q3 2012 20.01.2012 1 1 1 Domestic operating environment 2 2 2 Domestic industry. 8.00 7.00 6.00 5.00 4.00 3.00 Q3 12 vs Q3 11 Industry capacity 17%
SHAPING A SUSTAINABLE FUTURE
 SHAPING A SUSTAINABLE FUTURE Full Year Results Year ended 31 March 2017 Analyst and Investor Presentation 8 June 2017 Agenda Introduction Christine Ourmieres-Widener Financial Review Philip de Klerk Performance
Citi Industrials Conference
 Citi Industrials Conference June 13, 2017 Andrew Levy Executive Vice President and Chief Financial Officer Safe Harbor Statement Certain statements included in this presentation are forward-looking and
January 2018 Air Traffic Activity Summary
 January 2018 Air Traffic Activity Summary Jan-2018 Jan-2017 CY-2018 CY-2017 Passengers 528,947 505,421 4.7% 528,947 505,421 4.7% Passengers 537,332 515,787 4.2% 537,332 515,787 4.2% Passengers 1,066,279
Aer Lingus Group plc. Interim Management Statement
 Aer Lingus Group plc ISE: EIL1 LSE: AERL Interim Management Statement Dublin and London, 5 th November 2010: Aer Lingus Group plc ( Aer Lingus or the Group ) today issues an un-audited interim management
Montie Brewer, President and CEO Joshua Koshy, Executive VP and CFO UBS Transport Conference
 Montie Brewer, President and CEO Joshua Koshy, Executive VP and CFO UBS Transport Conference 1 London, England September 17, 2007 Agenda Strongly positioned international airline Investment proposition
Forward looking statements
 Forward looking statements This presentation contains forward-looking statements. Forward-looking statements often include words such as anticipate", "expect", "intend", "plan", "believe, continue or similar
Analysts Briefing. 27 November Cathay Pacific Airways Limited
 Analysts Briefing 27 November 2015 Cathay Pacific Airways Limited Operating performance - overview Passenger load factors are high, driven by strong back-end demand. Passenger front-end yield and load
Management Presentation. September 2011
 Management Presentation September 2011 Forward looking statements This presentation as well as oral statements made by officers or directors of Allegiant Travel Company, its advisors and affiliates (collectively
Third Quarter 2014 Results. 29 October 2014
 Third Quarter 2014 Results 29 October 2014 Highlights of the Third Quarter Operating environment Air France-KLM Economic environment remains weak Further currency volatility affecting revenues and results
Airline industry outlook remains fragile
 Airline industry outlook remains fragile June 2009 www.iata.org/economics To represent, lead and serve the airline industry Airline industry outlook remains fragile Green shoots starting to appear Recovery
Jumpstart 2017 Lukas Johnson SVP, Commercial. June 2017
 Jumpstart 2017 Lukas Johnson SVP, Commercial June 2017 Forward looking statements This presentation as well as oral statements made by officers or directors of Allegiant Travel Company, its advisors and
2010 Global Transportation Conference
 Air Canada's Executive Vice President & CFO Michael Rousseau presents at 2010 Global Transportation Conference New York June 16, 2010 Agenda Air Canada leading carrier in all markets Managing through challenging
THAI AIRWAYS INTERNATIONAL PCL
 THAI AIRWAYS INTERNATIONAL PCL 2Q2017 analysts briefing 16-Aug-2017 1 DISCLAIMER The information contained herein is intended to represent the Company s operating and financial position at a given point
JET AIRWAYS (I) LTD. Presentation on Financial Results Q July 24, 2009
 LTD. Presentation on Financial Results Q July 24, 2009") JET AIRWAYS (I) LTD Presentation on Financial Results Q1 2010 July 24, 2009 1 1 1 Agenda Domestic operating environment Jet Airways performance highlights JetLite performance highlights Outlook 2 2 2 Domestic
JET AIRWAYS (I) LTD Presentation on Financial Results Q1 2010 July 24, 2009 1 1 1 Agenda Domestic operating environment Jet Airways performance highlights JetLite performance highlights Outlook 2 2 2 Domestic
Interim results. 11 May 2010
 Interim results 11 May 2010 Introduction Andy Harrison Chief Executive Officer Strong performance despite disruption Improvement in revenue, margins and cash Continued network improvement has driven better
IAG results presentation. Quarter Two rd August 2018
 IAG results presentation Quarter Two 2018 3 rd August 2018 Highlights Willie Walsh, Chief Executive Officer Further progress against strategic objectives 1H 2018 strategic highlights Strengthen portfolio
 1 2 23 24 15 16 7 8 9 Ancillary Revenue target per pax RM55 10 Online 365 11 212 13 14 14 Quarter Ended: 31 March RM'000 Revenue 2,068,227 Operating expenses: - Staff costs (286,663) - Depreciation
Fourth Quarter and Full Year 2009 Results Presentation January 27, 2010
 Fourth Quarter and Full Year 2009 Results Presentation January 27, 2010 This presentation may include forward-looking comments regarding the Company s business outlook and anticipated financial and operating
EASYJET TRADING STATEMENT FOR THE QUARTER ENDED 31 DECEMBER easyjet delivers a good start to the year, in line with expectations
 EASYJET TRADING STATEMENT FOR THE QUARTER ENDED 31 DECEMBER 2018 easyjet delivers a good start to the year, in line with expectations Summary easyjet has delivered a good performance in the quarter with
Air Berlin PLC AGM 06 June 2013 London
 Air Berlin PLC AGM 06 June 2013 London airberlin a strong European carrier Market position as of 31 December 2012 No. 2 in core market: Germany / Austria / Switzerland No. 7 in Europe with 33.3 m guests
UBS 14 th Global Emerging Markets Conference. New York, November 2016
 UBS 14 th Global Emerging Markets Conference New York, November 2016 This presentation may include forward-looking comments regarding the Company s business outlook and anticipated financial and operating
JET AIRWAYS (I) LTD. Presentation on Financial Results Q2 FY10
 LTD. Presentation on Financial Results Q2 FY10") JET AIRWAYS (I) LTD Presentation on Financial Results Q2 FY10 October 27, 2009 1 1 1 Agenda Domestic operating environment Jet Airways performance highlights JetLite performance highlights Outlook 2 2
JET AIRWAYS (I) LTD Presentation on Financial Results Q2 FY10 October 27, 2009 1 1 1 Agenda Domestic operating environment Jet Airways performance highlights JetLite performance highlights Outlook 2 2
Strong improvement in underlying financial performance. Revenue + 11 % Profit before Tax + 48 % PBT Margin pp. Earnings per Share + 50 %
 20 th November 2007 Highlights Strong improvement in underlying financial performance Revenue + 11 % Profit before Tax + 48 % PBT Margin + 2.7 pp Earnings per Share + 50 % Return on Equity + 3.5 pp Net
JET AIRWAYS (I) LTD. Presentation on Financial Results Q4 FY08
 LTD. Presentation on Financial Results Q4 FY08") JET AIRWAYS (I) LTD Presentation on Financial Results Q4 FY08 June 24, 2008 1 1 1 Agenda Domestic operating environment Jet Airways performance highlights JetLite performance highlights Consolidated Jet
JET AIRWAYS (I) LTD Presentation on Financial Results Q4 FY08 June 24, 2008 1 1 1 Agenda Domestic operating environment Jet Airways performance highlights JetLite performance highlights Consolidated Jet
Analysts Briefing. 18 March Cathay Pacific Airways Limited
 Analysts Briefing 18 March 2015 Cathay Pacific Airways Limited Annual Results 2014 2013 Change Group attributable profit HK$m 3,150 2,620 +20.2% Group turnover HK$m 105,991 100,484 +5.5% Profit margin
Analysts and Investors conference call. Q results. 15 May 2013
 Analysts and Investors conference call Q1 2013 results 15 May 2013 Management summary Key messages of Q1 2013 +6% +9% +3.3%p. Q1 2013 operational KPIs are in line with 109.7 116.2 6.5 7.1 82.3 85.6 expectations,
Cathay Pacific Airways
 Cathay Pacific Airways Interim Results for the six months ended 30 th June 2014 13th August 2014 1 Interim Results 1H2014 1H2013 Change Profit attributable to the shareholders of Cathay Pacific HK$ million
Management Presentation. March 2016
 Management Presentation March 2016 Forward looking statements This presentation as well as oral statements made by officers or directors of Allegiant Travel Company, its advisors and affiliates (collectively
FIRST QUARTER 2017 RESULTS. 4 May 2017
 FIRST QUARTER 2017 RESULTS 4 May 2017 A resilient start of the year, traffic up 4.2% 20.9 million passengers carried, up 5.2%, traffic (RPK) up 4.2%, capacity (ASK) up 3.3% and load factor up 0.7pts Confirmation
THE PARENT AIRLINE FY2010/11 RESULTS
 SINGAPORE AIRLINES GROUP ANALYST / MEDIA BRIEFING FY21-11 11 RESULTS 13 MAY 211 THE PARENT AIRLINE FY21/11 RESULTS THE PARENT AIRLINE COMPANY RESULTS FY21/11 4Q/1 $million Better/ (Worse) $million 21/11
FY key data Passenger. Cargo. Maintenance. Other. Operating result in m. Revenues in bn -10.4% 78% 11%
 Information meeting FY 2009-10 key data Revenues in bn Operating result in m 78% Passenger 16.3-13.6% -918 11% Cargo 2.4-27.8% -436 5% Maintenance 1.0-4.0% +81 6% Other 1.3-12 -10.4% 2 Our industry is
Half Year and 2nd Quarter FY Financial Results 27 October 2005
 Half Year and 2nd Quarter FY2005-06 Financial Results 27 October 2005 Singapore Airlines Limited Company Registration No.: 197200078R Further information and media releases can be found at the Singapore
Air Canada's Executive Vice President & CFO Michael Rousseau, presents at. Transportation & Logistics Conference
 Air Canada's Executive Vice President & CFO Michael Rousseau, presents at Transportation & Logistics Conference Toronto March 24, 2010 1 Agenda Air Canada leading carrier in all markets Managing through
2012 Preliminary Results. 6 February 2013
 2012 Preliminary Results 6 February 2013 Disclaimer Forward looking information Certain information included in these statements is forward-looking and involves risks and uncertainties that could cause
AIR NEW ZEALAND ANNUAL RESULTS ANNUAL RESULTS
 AIR NEW ZEALAND ANNUAL RESULTS 2008 1 HIGHLIGHTS Record operating revenue, up 9% Normalised earnings* $197m Net cash position of $1.3bn Launched direct service to Vancouver and Beijing Award winning product
Presents at the. Transportation and Industrials Conference. Miami, Florida. December 1, 2010
 1 Presents at the Transportation and Industrials Conference 2 Miami, Florida December 1, 2010 Agenda Air Canada Leading Carrier in all Markets Improving Performance in a Gradually Strengthening Economy
IAG results presentation. Quarter Three st October 2014
 IAG results presentation Quarter Three 2014 31 st October 2014 Q3 financial summary OPERATING PROFIT TOTAL UNIT REVENUE PAX UNIT REVENUE 900m (reported, pre-exceptional items) -1.9% (constant FX) -0.9%
Analyst and Investor Conference Call Q Ulrik Svensson, CFO and Member of the Executive Board
 Analyst and Investor Conference Call Q2 2017 Ulrik Svensson, CFO and Member of the Executive Board Frankfurt, 2 August 2017 Disclaimer The information herein is based on publicly available information.
Singapore Airlines Group Analyst/Media Briefing HALF YEAR FY RESULTS. 13 November 2013 THE PARENT AIRLINE 1H FY2013/14 RESULTS
 Singapore Airlines Group Analyst/Media Briefing HALF YEAR FY2013-14 14 RESULTS 13 November 2013 THE PARENT AIRLINE 1H FY2013/14 RESULTS THE PARENT AIRLINE COMPANY RESULTS 2Q & 1H FY13/14 2Q/13 $million
Information meeting. 1 st September 2011
 Information meeting 1 st September 2011 Full Year 2010-11 key data April 2010-March 2011 Revenues in billions Operating result in millions 77% Passenger 18.10 +11.3% -44 +874 13% Cargo 3.16 +29.5% +69
1Q 2017 Earnings Call. April 18, 2017
 1Q 2017 Earnings Call April 18, 2017 Safe Harbor Statement Certain statements included in this presentation are forward-looking and thus reflect our current expectations and beliefs with respect to certain
Fourth Quarter 2006 Results Presentation February 15, 2007
 Fourth Quarter 2006 Results Presentation February 15, 2007 This presentation may include forward-looking comments regarding the Company s business outlook and anticipated financial and operating results.
First Half 2013 Results. 16 mai 2013
 First Half 2013 Results 16 mai 2013 26 July 2013 Results Increasing effects of Transform 2015 Highlights of the First Half A difficult global economic environment Transform 2015 plan roll-out on track
Cathay Pacific Airways Analyst Briefing. 21 November 2014
 Cathay Pacific Airways Analyst Briefing 21 November 2014 Operating Performance Passenger demand remains strong, although growth in North America is significantly short of increase in capacity. Demand for
2Q 2017 Earnings Call. July 19, 2017
 2Q 2017 Earnings Call July 19, 2017 Safe Harbor Statement Certain statements included in this presentation are forward-looking and thus reflect our current expectations and beliefs with respect to certain
STAYING TRUE. Scotia Capital Transportation & Aerospace Conference. November 15, 2011
 STAYING TRUE Scotia Capital Transportation & Aerospace Conference November 15, 2011 FORWARD-LOOKING STATEMENT Certain information in this presentation and statements made during this presentation, including
Second Quarter 2004 Teleconference
 Second quarter marginally positive despite to strong yield pressure and record high jet fuel prices MSEK, April-June 2004 Change Revenues 15 143 15 300-157 EBITDAR 1 493 1 608-115 Lease, depreciation &
FY 2013 and Q results. Increasing effects of Transform 2015
 FY 2013 and Q1 2014 results Increasing effects of Transform 2015 Key data FY 13 Change (1) Q1-14 Change (2) Revenue ( bn) 25.52 +2,3% (3) 5.55 +0.0% (4) EBITDA (5) ( m) 1,855 +461m -50 +66m Operating result
JAPAN AIRLINES Co., Ltd. Financial Results 1 st Quarter Mar/2017(FY2016) July 29, 2016
 July 29, 2016") JAPAN AIRLINES Co., Ltd. Financial Results Mar/2017(FY2016) July 29, 2016 Today s Topics P.1 P.2 P.13 From the first quarter of this fiscal year, figures for Revenue Passengers Carried, ASK, RPK and Load
JAPAN AIRLINES Co., Ltd. Financial Results Mar/2017(FY2016) July 29, 2016 Today s Topics P.1 P.2 P.13 From the first quarter of this fiscal year, figures for Revenue Passengers Carried, ASK, RPK and Load
Fourth Quarter & FY 2008 Results Presentation January 28, 2008
 Fourth Quarter & FY 2008 Results Presentation January 28, 2008 This presentation may include forward-looking comments regarding the Company s business outlook and anticipated financial and operating results.
Air Berlin PLC AGM 18 June 2014 London
 Air Berlin PLC AGM 18 June 2014 London Executive summary (1) Key Highlights 2013 2013: a challenging year for airberlin Operational loss of 231.9 million euros Group revenue down in line with capacity
American Airlines Group Inc.
 American Airlines Group Inc. Bank of America Merrill Lynch 2018 Transportation Conference Derek Kerr Chief Financial Officer Cautionary Statement Regarding Forward-Looking Statements and Information This
Cathay Pacific Airways 2012 Analyst Briefing 28 June 2012
 Cathay Pacific Airways 2012 Analyst Briefing 28 June 2012 1 Airline Strategy Grow our international network, expand frequencies and further develop Hong Kong as one of the world s leading aviation hubs
Fundamental Value and Profitable Growth
 - Fundamental Value and Profitable Growth Commerzbank German Investment Seminar 2010 Stephan Gemkow Member of the Executive Board & CFO Deutsche Lufthansa AG New York / January 11, 2010 Disclaimer This
Financial Results 3 rd Quarter MAR/2016 (FY2015)
") Financial Results MAR/2016 (FY2015) January 29 th, 2016 CONTENTS P.1 P.2 P.3 P.4~ Overview of FY MAR/16 Results Operating Revenue Operating Profit 1,030 1,020 1,010 +1.0Bn 1,022.3 1,023.4 (+0.1%) 180 160
Financial Results MAR/2016 (FY2015) January 29 th, 2016 CONTENTS P.1 P.2 P.3 P.4~ Overview of FY MAR/16 Results Operating Revenue Operating Profit 1,030 1,020 1,010 +1.0Bn 1,022.3 1,023.4 (+0.1%) 180 160
STAYING TRUE. BofAML Global Transportation Conference. May
 STAYING TRUE BofAML Global Transportation Conference May 19 2011 FORWARD-LOOKING STATEMENT Certain information in this presentation and statements made during this presentation, including any question
Vueling Airlines 2009 Fourth-Quarter, Full-Year Financial Results. The 100-milion turnaround story
 Vueling Airlines 2009 Fourth-Quarter, Full-Year Financial Results The 100-milion turnaround story Barcelona, February 23 rd, 2009 Introduction Revenues Operations and costs Outlook for 2010 Vueling has
Joshua Koshy, Executive Vice President & CFO. Changing the Game
 Joshua Koshy, Executive Vice President & CFO Changing the Game Changing the Game Canada s #1 domestic, trans-border and international airline Strong brand recognition Innovative revenue model driving customer
SAS Group Q2 2012/13. Q2 Restructuring programme moving KPIs in the right direction
 SAS Group Q2 2012/13 1 Q2 Restructuring programme moving KPIs in the right direction Operating revenues +1.6%* Yield improvement of +2.7%* Forceful implementation of 4XNG plan: Unit cost down by 10.7%
Aer Lingus Group plc. Interim Management Statement
 Aer Lingus Group plc ISE: EIL1 LSE: AERL Interim Management Statement Dublin and London, 4 th May 2010: Aer Lingus Group plc ( Aer Lingus or the Group ) today issues an un-audited interim management statement
SAS Q2 2017/2018 TELECONFERENCE
 SAS Q2 2017/2018 TELECONFERENCE 30 May 2018 Earnings as expected despite negative currency effect POSITIVES + Total revenue up MSEK 73 vs. LY + Currency adjusted yield up 0.6% vs. LY + EB-point sale revenue
Copa Holdings Reports Net Income of $49.9 million and EPS of $1.18 for the Second Quarter of 2018
 Copa Holdings Reports Net Income of $49.9 million and EPS of $1.18 for the Second Quarter of 2018 Panama City, Panama --- Aug 8, 2018. Copa Holdings, S.A. (NYSE: CPA), today announced financial results
J.P. Morgan Aviation, Transportation and Industrials Conference
 J.P. Morgan Aviation, Transportation and Industrials Conference March 3, 08 Scott Kirby President Safe Harbor Statement Certain statements included in this presentation are forward-looking and thus reflect