SAS Group Presentation Carnegie, May 22, 2012 Sture Stölen, Head of IR
|
|
|
- Jocelin Patrick
- 5 years ago
- Views:
Transcription


1 SAS Group Presentation Carnegie, May 22, 2012 Sture Stölen, Head of IR 1


2 This is the SAS Group 128 destinations 27,2 million passengers 28 new routes to be launched ,085 daily flights Revenues 2011, MSEK 41, destinationer 2
 SAS")

3 The SAS Group s business structure (reporting segments as from Q1 2011) SAS Group Scandinavian Airlines Widerøe Including Blue1 SAS Cargo Ground Handling Technical Maintenance 3

4 Q1 A weak quarter as expected due to challenging market conditions Challenging market situation Uncertain business cycle development Continued competitive market Slightly reduced yield pressure Continued high fuel prices Continued good revenue growth Passenger growth RASK improved by 1,7% Accelerated 4Excellence, SEK 5 billion under implementation EBT before non-recurring items MSEK -1,049 Cash flow from operating activities MSEK 1,215 Strong cash flow generation and good cash position at SEK 3,7 billion 4 4


5 Drivers and Performance - development Q Customer Performance Passenger growth Customer satisfaction Operational Performance Punctuality Unit cost (CASK) Financial Drivers Fuel price RASK and Yield Financial Performance Cash flow Financial Preparedness Underlying unit cost down 1.6% SAS Result (EBT) 5 5

6 Continued high jet fuel prices USD/ton excl hedge USD/ton incl hedge Fuel prices (excl hedging) increased approx. 5,7% during Q ,7% 6 Oct-11 Nov-11 Dec-11 Jan-12 Feb-12 Mar-12 Jan-10 Feb-10 Mar-10 Apr-10 May-10 Jun-10 Jul-10 Aug-10 Sep-10 Oct-10 Nov-10 Dec-10 Jan-11 Feb-11 Mar-11 Apr-11 May-11 Jun-11 Jul-11 Aug-11 Sep-11


7 Continued good passenger growth and stable customer satisfaction SAS Group number of passengers, million Customer Satisfaction Target Q Q , (+5,3%) Q Q ,1 7


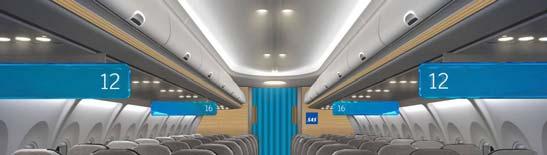
8 Positive trend in underlying route result driven by commercial activities SEK Example Denmark Europe Route Result Apr May Jun Jul Aug Sep Oct Nov Dec Jan Feb Mar New fleet - A320/B737NG Improved product offering SMART PASS Complimentary Coffee/Tea Successful market campaigns New & retained corporate agreements New Eurobonus Partners and Code Share Partners New routes 27 short haul destinations Shanghai 8
9 Q1 a seasonally weak quarter for the industry EBIT-margin, Jan-Mar EUR -76 EUR -597 EUR -98 EUR Norwegian Air France/KLM SAS Group Lufthansa 9
, Scandinavian Airlines 1,30 1,25 1,23 1,20 Q1 2010 1,15 1,11 1,10 Q1 2011 1,07 1,05 Q1 2012 1,00 0,95 10-jan 10-apr 10-jul 10-oct")
10 Yield curve flattens and stabilized RASK Scandinavian Airlines +0,6% Yield Q1 2012: -2,3%* RASK +6,6% Q1 2012: +1,7%* -1,3% +1,7%* -2,8% -2,3%* -2,4% -2,1% Q1 Q2 Q3-4,0% Q4 Q1 *Including Blue1 Q1 Q2 Q3-6,7% Q4 Q1 *Including Blue1 SEK, Nominal Yield (rolling 12 months), Scandinavian Airlines 1,30 1,25 1,23 1,20 Q ,15 1,11 1,10 Q ,07 1,05 Q ,00 0,95 10-jan 10-apr 10-jul 10-oct 11-jan 11-apr 11-jul 11-oct 12-jan SEK, Nominal RASK (12 months), Scandinavian Airlines 0,95 0,90 0,87 0,85 0,85 Q ,84 Q Q ,80 0,75 10-jan 10-apr 10-jul 10-oct 11-jan 11-apr 11-jul 11-oct 12-jan
11 Continuous improvement in unit cost efficiency paramount for our success CASK -3 5% annually = COST % annually ASK & PRODUCTIVITY % annually Key drivers Harmonized product offering Significant reduction in administration Centralization in International Sales Reduced IT and purchasing costs Key drivers Improved aircraft utilization More seats per aircraft Lean productivity improvements 11

12 Union negotiations and admin cost reduction on track Negotiations with all of SAS unions secures EBT effects of SEK 1 billion in Agreements signed with majority of unions affecting Salaries Early retirement Pensions Productivity Since February 2012 administration cost reduction of 300 FTE in process In end March 2012, 50% is in final completion 12
13 Gearing ratios impacted by Spanair write down 400% 350% 300% 250% Fin Net Debt / Equity Equity / Total Assets Fin. Net Debt + 7*Op lease / Equity 200% 150% 100% 50% 0% dec-98 dec-00 dec-02 jun-03 dec-03 jun-04 dec jun dec 06-jun 06-dec 07-jun 07-dec 08-jun 01-dec 09-jun 09-dec 10-jun 10-dec 11-jun dec-11 13


14 but continued strong financial preparedness Financial preparedness Q1, SEK billion Q Credit facilities Cash SEK 8.6 billion in total financial preparedness SEK 4.9 billion credit facilities SEK 3.7 billion cash Good financial preparedness Further improved by property transaction 14


15 Sale of offices and airside properties release MSEK 450 in capital Q2 6 properties sold to Swedavia Part of strategy to reduce capital employed and focus on core business Total value of MSEK 1,775 sold Release capital and cash MSEK 450 Capital gain MSEK 350 to be booked in Q2 15


16 Good financial position and limited CAPEX in 2012 CAPEX (Aircraft and other), SEK billion Debt maturities 2012, SEK billion New secured financing 0.50 capacity Completed asset sales 1.15 Other capital market financing/asset sales or cash SEK 0.4 billion of investments in Q1 SEK 0.1 billion aircraft/ SEK 0.1 billion engines/ SEK 0.2 billion IT and other Further asset sales in 2012 Aircraft and other of approximately SEK 0.5 billion Remaining 2012 To be handled through; New secured financing capacity released from maturities other capital market & asset sales 16

17 Approximately SEK 2 billion per year in amortization until 2016 Scheduled amortization profile, SEK billion 17

18 We have ambitious targets Our target is to achieve sustainable profitability SAS is to be number 1 The Nordic region s most valued airline by reaching new heights in customer satisfaction Unit cost shall be reduced by 3-5% annually Our employee satisfaction is to be in the Top Five in the entire Nordic transportation sector We are to reduce our overall emissions by 20% to secure a sufficient return on investment 18
19 4Excellence is starting to provide effects SEK 1,5 bn Revenue activities Improved route result vs 2011 New airport design being rolled out Eurobonus members continues to grow SEK 3,5 bn Cost activities New distribution platform implemented SEK 1 billion union agreements secured and 300 FTE admin reduction on track Sale of properties completed 19

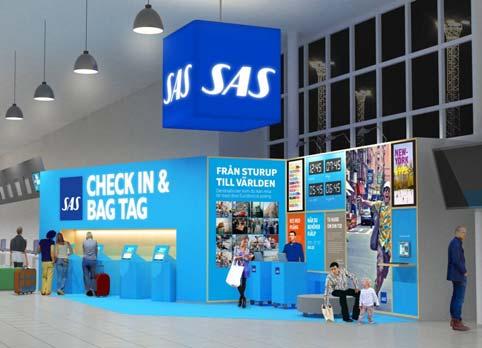


20 The new SAS look and feel


21 New design being rolled out this is Malmö Airport before 21

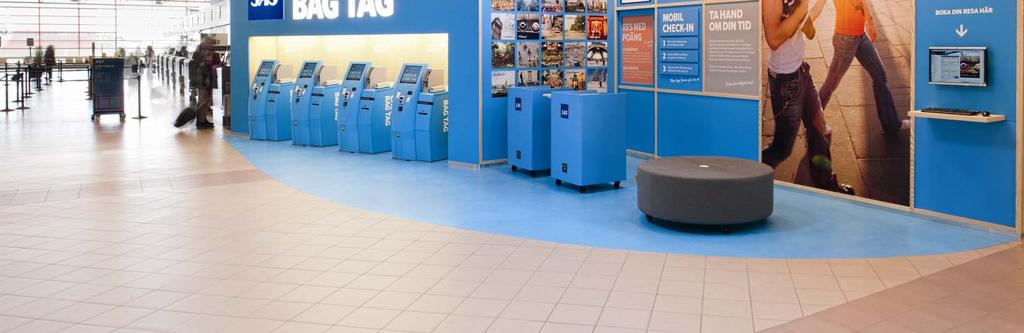
22 Malmö Airport after 22


23 2012 Outlook Increased challenges ahead The global economic climate is unpredictable Continued capacity increase in the market Continued Yield pressure Uncertainty regarding fuel prices Accelerated 4Excellence SEK 5 billion in total measures of which SEK 2 billion in a challenging year Earnings effects from 4Excellence to come in the second half of 2012 SAS passenger growth expected 5-7% Capacity up 5% Due to uncertainties no earnings forecast will be provided for the full year

24 Thank you! 24
SAS Group Q Teleconference
 SAS Group Q4 2012 Teleconference December 12, 2012 1 Break-even result in 2012 despite 1.6 bn SEK higher fuel cost 23 MSEK EBT (before non-recurring items) despite 1.6 bn SEK higher fuel cost Positive
SAS Group Asia Tour Financial Hearing Presentation May 14, 2012
 SAS Group Asia Tour Financial Hearing Presentation May 14, 2012 1 This is the SAS Group 128 destinations 27,2 million passengers 28 new routes to be launched 2012 1,085 daily flights Revenues 2011, MSEK
SAS Group Q Teleconference August 8, 2012
 SAS Group Q2 2012 Teleconference August 8, 2012 1 Q2 4Excellence delivers tangible results Unit cost down 4% EBT (before non rec.) MSEK 137 EBT MSEK 371 Positive cash flow from operating activities MSEK
SAS AB:s Press Conference. Augusti 14 th 2008
 SAS AB:s Press Conference Augusti 14 th 2008 1 Weak second quarter due to unprecedented challenging market conditions Combination of record high fuel prices and economic slowdown probably largest industry
SAS Group Q2 2012/13. Q2 Restructuring programme moving KPIs in the right direction
 SAS Group Q2 2012/13 1 Q2 Restructuring programme moving KPIs in the right direction Operating revenues +1.6%* Yield improvement of +2.7%* Forceful implementation of 4XNG plan: Unit cost down by 10.7%
SAS Group 1 st interim report 2011
 SAS Group 1 st interim report 2011 Media/analyst presentation May 10, 2011 Q1 Improved earnings driven by Core SAS cost reductions Continued strong macro development in Scandinavia Additional capacity
SAS Q2 2017/2018 TELECONFERENCE
 SAS Q2 2017/2018 TELECONFERENCE 30 May 2018 Earnings as expected despite negative currency effect POSITIVES + Total revenue up MSEK 73 vs. LY + Currency adjusted yield up 0.6% vs. LY + EB-point sale revenue
SAS Q1 2017/2018. Q1 in Summary: Improved earnings CHANGE VS. Q1 FY17
 SAS 2017/2018 27.02.2018 in Summary: Improved earnings POSITIVES + Passenger revenue up 1% (FX adj.) + Cargo and EB-point sale revenue increased MSEK 109 + Efficiency program delivered MSEK 165 + Positive
Strengthened SAS delivers positive result in Q3
 SAS Group Q3 2012/13 1 Strengthened SAS delivers positive result in Q3 Passenger revenues up 5.3% (FX adjusted) 32 new routes introduced Capacity up 7.7% Traffic up 5.6% Yield down 0.6% Restructuring status
SAS Group 1 st interim report 2011
 SAS Group 1 st interim report 011 Media/analyst presentation May 10, 011 Q1 Improved earnings driven by Core SAS cost reductions Continued strong macro development in Scandinavia Additional capacity is
SAS Q1 2013/14. Tough 1 st Quarter 2013/2014 as expected THE NEWEUROBONUS. Q1 EBT MSEK -146 Positive effects from pension plans MSEK 1,044
 SAS Q1 2013/14 1 1 Tough 1 st Quarter 2013/2014 as expected Q1 EBT MSEK -146 Positive effects from pension plans MSEK 1,044 Yield down 5.6% in Q1 THE NEWEUROBONUS Launch in Spring 2014 Welcome onboard!
SAS Q1 2016/
 SAS Q1 2016/2017 08.03.2017 Weak Q1 as expected new structural actions underway Q1 in summary Positives + Currency adjusted passenger revenue up 5% + Strong development of ancillary revenues + Passengers
Analysts and Investors conference call. Q results. 15 May 2013
 Analysts and Investors conference call Q1 2013 results 15 May 2013 Management summary Key messages of Q1 2013 +6% +9% +3.3%p. Q1 2013 operational KPIs are in line with 109.7 116.2 6.5 7.1 82.3 85.6 expectations,
Continued good growth in most SAS Group markets first Quarter SAS Group EBT trend on the right track. Improved Result 1 st Quarter 2007
 Continued good growth in most SAS Group markets first Quarter 7 Continued favorable economic cycle Good growth on all markets Strong market growth, particularly in Finland and Norway SAS Group 1 st Quarter
Second Quarter 2004 Teleconference
 Second quarter marginally positive despite to strong yield pressure and record high jet fuel prices MSEK, April-June 2004 Change Revenues 15 143 15 300-157 EBITDAR 1 493 1 608-115 Lease, depreciation &
2012 Result. Mika Vehviläinen CEO
 2012 Result Mika Vehviläinen CEO 1 Agenda Market environment in Q4 Business performance and strategy execution Outlook Financials 2 Market Environment According to IATA, Global air travel continues to
SAS AB:s interim report April 29 th 2008
 SAS AB:s interim report April 29 th 28 A very challenging 1 st Quarter The airline industry under pressure Record high fuel prices Increased competition Yield pressure Increased overcapacity Profit warnings
SAS Q3 2017/ August 2018
 SAS Q3 2017/2018 31 August 2018 Strong earnings in peak season POSITIVES Record number of passengers Total revenue up MSEK 936 vs. LY Currency adjusted yield up 1.1% vs. LY EB point sale up 27% vs. LY
SAS Q3 2016/
 SAS Q3 2016/2017 05.09.2017 A strong summer performance drives result improvements Q3 IN SUMMARY Positives + Currency adjusted passenger revenue up 6.4% + Passengers up by ~300,000 + Ancillary and cargo
SAS takes forceful action in a challenging market
 SAS Q2 2013/14 1 1 SAS takes forceful action in a challenging market Q2 EBT MSEK -1,078 Disappointing result in a challenging market most European carriers struggle During the last year, capacity has outgrown
Third Quarter 2014 Results. 29 October 2014
 Third Quarter 2014 Results 29 October 2014 Highlights of the Third Quarter Operating environment Air France-KLM Economic environment remains weak Further currency volatility affecting revenues and results
Press conference Full Year 2006
 Good growth in most markets in 2006 Good GDP and traffic growth in most markets Strongest traffic growth in Spain, Norway and the Baltics Strong growth also in Finland Sweden: GDP: 4,3% Passengers: +2,5%
The SAS Group five business areas as from Q SAS Group statement of income
 Weak full year result but according to plan Teleconference Fiscal year st Quarter weak according to plan nd Quarter passenger load factors and yields better than expected 3 rd and 4 th Quarter pressure
SAS Q4 2016/2017. Q4 in Summary: Earnings in line with November outlook Negative currency effects of MSEK 273 CHANGE VS.
 SAS Q4 2016/2017 12.12.2017 Q4 in Summary: Earnings in line with November outlook Positives + Passenger revenue up 5.4% (FX adj.) + Yield up 5.5% + Efficiency program delivered MSEK 240 + 3-year collective
SAS Q3 2015/2016. Q3 development largely in accordance with our expectations. Q3 update. Change vs. LY
 SAS Q3 2015/2016 08.09.2016 Q3 development largely in accordance with our expectations Q3 update Most of Q3 developed as expected FX adjusted revenues up by MSEK 428 226,000 more passengers in Q3 vs. LY
Analyst Meeting Full Year 2006
 Good growth in most markets in 26 Good GDP and traffic growth in most markets Strongest traffic growth in Spain, Norway and the Baltics Strong growth also in Finland Sweden: GDP: 4,3% Passengers: +2,5%
Norwegian Air Shuttle ASA
 Norwegian Air Shuttle ASA Q4 2017 Presentation 15 February 2018 Highlights Q4 2017 Added one 737-800 and two 787-9s to operations Financed the first aircraft with a combination of UKEF and JOLCO Agreed
SAS Group Interim Report January March 2012
 SAS Group Interim Report January March 2012 Strengthened cash flow but negative earnings as forecast - continued challenges in 2012-4Excellence measures corresponding to SEK 5 billion to be implemented
Third Quarter 2004 Analyst presentation November, 2004
 Third quarter marginally positive despite large overcapacity Stabilized yield drop, but large overcapacity put pressure on load factors Group traffic revenues down 2% in Q3 Volume 56 Price -7 Third Quarter
A challenging Quarter, but record passenger numbers. Quarter overshadowed by Q400 problems
 A challenging Quarter, but record passenger numbers EBT bef. non rec. Q3: MSEK 632, Jan-Sep : MSEK 982 Record number of passengers Group airlines perform strongly Negative effect from Q4, ECA agreement
Air Berlin PLC AGM 06 June 2013 London
 Air Berlin PLC AGM 06 June 2013 London airberlin a strong European carrier Market position as of 31 December 2012 No. 2 in core market: Germany / Austria / Switzerland No. 7 in Europe with 33.3 m guests
Q1 2018/
 Q1 2018/2019 27.02.2019 Highlights Q1/19 CHANGE VS. Q1-18 Financial drivers Total revenue up 6% with broadly unchanged capacity Slight increase in passengers and load factor HIGHLIGHTS Q1/19 Improved unit
SAS AB Analyst meeting
 SAS AB Analyst meeting London, August 9, 2001 2 2nd Quarter a tough Quarter The Marketplace Continued weak world economy Weaker Swedish economy SAS Weaker traffic growth and reduced passenger load factors
FIRST QUARTER 2017 RESULTS. 4 May 2017
 FIRST QUARTER 2017 RESULTS 4 May 2017 A resilient start of the year, traffic up 4.2% 20.9 million passengers carried, up 5.2%, traffic (RPK) up 4.2%, capacity (ASK) up 3.3% and load factor up 0.7pts Confirmation
Finnair Q Result
 Finnair Q1 2015 Result 7 May 2015 CEO Pekka Vauramo, Interim CFO Mika Stirkkinen 1 Turbulent market environment The weakness of the Finnish economy continued to be reflected in the demand in the first
Third Quarter Presentation of Year end Report 2005 Stockholm and London, February SAS Group positive result 2005
 Third Quarter 25 positive result 25 Presentation of Year end Report 25 Stockholm and London, February 9-1 1 EBT bef nonrecurring items MSEK 114, an improvement of MSEK 1 815 Record number of passengers
AIR BERLIN PLC Q2 RESULTS, APRIL JUNE Berlin, August 18 th, 2011
 AIR BERLIN PLC Q2 RESULTS, APRIL JUNE 2011 Berlin, August 18 th, 2011 MANAGEMENT SUMMARY 1/5 Management Summary Yield 1) [EUR] +7.9% 99.75 107.68 Q2/10 PF Q2/11 ACT Measures: Increase of fuel surcharge
Analyst and Investor Conference Call Q Ulrik Svensson, CFO and Member of the Executive Board
 Analyst and Investor Conference Call Q2 2017 Ulrik Svensson, CFO and Member of the Executive Board Frankfurt, 2 August 2017 Disclaimer The information herein is based on publicly available information.
SAS AB Q December 2018
 SAS AB Q4 2018 4 December 2018 Q4 financial highlights Q4 POSITIVES Q4-18 CHANGE VS. Q4-17 Record number of passengers Total revenue up SEK 1bn vs. LY Yield (nominal) up 5.1% vs. LY RASK (nominal) up 7.0%
2007/08 Full Year Results Investor Briefing
 2007/08 Full Year Results Investor Briefing Highlights of Result Profit before tax up 46% to $1,408 million Up 36% on the reported result Margin improvement $3 billion of Sustainable Future Benefits achieved
Norwegian Air Shuttle ASA
 Norwegian Air Shuttle ASA Q1 2018 Presentation 26 April 2018 Highlights Q1 2018 Successfully completed private placement of NOK 1.3 billion Added two 737-800s and six 787-9s to operations Launched interline
Cathay Pacific Airways 2012 Analyst Briefing 28 June 2012
 Cathay Pacific Airways 2012 Analyst Briefing 28 June 2012 1 Airline Strategy Grow our international network, expand frequencies and further develop Hong Kong as one of the world s leading aviation hubs
SAS Group Interim Report January-September 2010
 July-September 2010 Operating revenue: MSEK 10,690 (11,076) Earnings before non-recurring items in continuing operations: MSEK 387 (37) EBT margin before non-recurring items in continuing operations: 3.6%
Results 2Q17. August 9, 2017
 Results 2Q17 August 9, 2017 2Q17 Highlights Indicators 2Q17 Var. x 2Q16 ASK (BN) 10.4-3.0% Traffic (000) 7,261-1.3% RPK (BN) 8.1 +0.5% Load Factor 77.9% +2.7 p.p. Yield (R$ cents) 23.2 +4.8% Pax Revenue
SAS Q3 2016/2017. A strong summer performance drives result improvements CHANGE VS. Q3 FY16
 SAS Q3 2016/2017 05.09.2017 A strong summer performance drives result improvements Q3 IN SUMMARY Positives + Currency adjusted passenger revenue up 6.4% + Passengers up by ~300,000 + Ancillary and cargo
SAS Group Interim Report
 SAS Group Interim Report January-June 2004 Marginally positive earnings for second quarter of 2004 Operating revenue for the first half of the year amounted to MSEK 27,710 (29,010), a decrease of 4.5%.
Copa Holdings Reports Net Income of $49.9 million and EPS of $1.18 for the Second Quarter of 2018
 Copa Holdings Reports Net Income of $49.9 million and EPS of $1.18 for the Second Quarter of 2018 Panama City, Panama --- Aug 8, 2018. Copa Holdings, S.A. (NYSE: CPA), today announced financial results
Finnair Q Result
 Finnair Q2 2015 Result 14 August 2015 CEO Pekka Vauramo, Interim CFO Mika Stirkkinen 1 Market environment shows signs of improvement There were signs of a recovery in the demand for consumer and business
Information meeting. 1 st September 2011
 Information meeting 1 st September 2011 Full Year 2010-11 key data April 2010-March 2011 Revenues in billions Operating result in millions 77% Passenger 18.10 +11.3% -44 +874 13% Cargo 3.16 +29.5% +69
January 2018 Air Traffic Activity Summary
 January 2018 Air Traffic Activity Summary Jan-2018 Jan-2017 CY-2018 CY-2017 Passengers 528,947 505,421 4.7% 528,947 505,421 4.7% Passengers 537,332 515,787 4.2% 537,332 515,787 4.2% Passengers 1,066,279
PRESS RELEASE Financial Results. Rising passenger traffic at 12.5m Exceeding 1bn in consolidated revenue
 PRESS RELEASE 2016 Financial Results Rising passenger traffic at 12.5m Exceeding 1bn in consolidated revenue Kifissia, 23 March 2017 AEGEAN reports full year 2016 results with consolidated revenue at 1,020m,
Presentation of 1 st Interim Report 2006 Stockholm and London, May 4-5
 Result affected by pilot conflict and underlying yield pressure EBT bef nonrecurring items MSEK -1 319 in line with 25 Positive Easter Effect MSEK 1 Cost for conflicts of MSEK 25 Still underlying price
Second Quarter nd Quarter result improved by MSEK 526. Improved load and stable yields. Positive result and improved operating performance
 Positive result and improved operating performance Second Quarter 25 1 st Half result improved by MSEK 82 Improvement for all business areas and group airlines Operating result almost tripled in 2 nd Quarter
First Quarter Results August 31 st, 2006
 First Quarter Results 2006-07 August 31 st, 2006 Key features of the First Quarter Market context Sustained global economic growth, and a recovery in Europe Average jet fuel price of 691 $/t, up 25% year-on-year
Air China Limited Annual Results. March Under IFRS
 Air China Limited 21 Annual Results Under IFRS March 211 Agenda Part 1 Highlights Part 2 Business Overview Part 3 Financial Overview Part 4 Outlook 2 Part 1 Highlights Steady Economic Growth; Asia Pacific
Air Berlin PLC Frankfurt, 29 August 2012 DVFA Small Cap Conference
 Air Berlin PLC Frankfurt, 29 August 2012 DVFA Small Cap Conference 2012 is the transition year business transformation airberlin on its journey to sharpen its profile in the scheduled business Shape &
26 October 2017 Icelandair Group Interim Report NET PROFIT USD 101 MILLION IN THIRD QUARTER
 NET PROFIT USD 101 MILLION IN THIRD QUARTER Total income in Q3 up by 10% between years, to USD 536.0 million Passenger revenue higher than expected EBITDA unchanged year on year, at USD 161.1 million Passenger
Full Year 2009 Results
 Full Year 2009 Results 1 Antonio Vázquez Chairman & Chief Executive Officer 2 Highlights 2009 Strong decrease in revenues: weak demand and yield deterioration. High competition and drop of business traffic.
PRESS RELEASE. First Half 2017 Financial Results Higher Load Factors and traffic lead to a significant rebound in second quarter profitability
 PRESS RELEASE First Half 2017 Financial Results Higher Load Factors and traffic lead to a significant rebound in second quarter profitability Kifissia, 12 September 2017 AEGEAN announces first half 2017
First Half 2013 Results. 16 mai 2013
 First Half 2013 Results 16 mai 2013 26 July 2013 Results Increasing effects of Transform 2015 Highlights of the First Half A difficult global economic environment Transform 2015 plan roll-out on track
Cathay Pacific Airways Interim Results for the six months ended 30 June 2012
 Cathay Pacific Airways Interim Results for the six months ended 30 June 2012 8 August 2012 1 Interim Result 1H2012 1H2011 Change Group attributable (loss) / profit HK$ million (935) 2,808-133.3% Group
September 2010 Brian Pearce To represent, lead and serve the airline industry
 Cycle turns up but risks and structural challenges remain September 2010 Brian Pearce www.iata.org/economics To represent, lead and serve the airline industry Confidence was still high in July survey Airline
Air Berlin PLC AGM 18 June 2014 London
 Air Berlin PLC AGM 18 June 2014 London Executive summary (1) Key Highlights 2013 2013: a challenging year for airberlin Operational loss of 231.9 million euros Group revenue down in line with capacity
AIR NEW ZEALAND ANNUAL RESULTS ANNUAL RESULTS
 AIR NEW ZEALAND ANNUAL RESULTS 2008 1 HIGHLIGHTS Record operating revenue, up 9% Normalised earnings* $197m Net cash position of $1.3bn Launched direct service to Vancouver and Beijing Award winning product
Finnair Group Interim Report 1 January 30 September 2008
 Finnair Group Interim Report 1 January 30 September 2008 1 31/10/2008 Presentation name / Author Airline industry at a historical turning point Expensive fuel price in the beginning of 2008 has dramatical
Air Berlin PLC 28th April 2014 Annual Results Press Conference
 Air Berlin PLC 28th April 2014 Annual Results Press Conference AGENDA Executive summary A. airberlin at a glance 5 B. airberlin s financial situation / full year results 2013 12 C. Recapitalisation, accelerated
FIRST HALF 2016 RESULTS. 27 July 2016
 FIRST HALF 2016 RESULTS 27 July 2016 Highlights of the Second Quarter 2016 Environment Operations Financial highlights High level of geopolitical uncertainties, including Brexit Terrorist attacks in Europe
AIR BERLIN PLC. FCF GERMAN INDUSTRY CAPITAL MARKET DAYS Dubai, 25 April 2012
 AIR BERLIN PLC FCF GERMAN INDUSTRY CAPITAL MARKET DAYS Dubai, 25 April 2012 2 AGENDA FCF German Industry Capital Market Days, 25 Apr. 2012 page Topic 1 Review 2011 3 Topic 2 Overview 2012 Macro-economic
SHAPING A SUSTAINABLE FUTURE
 SHAPING A SUSTAINABLE FUTURE Full Year Results Year ended 31 March 2017 Analyst and Investor Presentation 8 June 2017 Agenda Introduction Christine Ourmieres-Widener Financial Review Philip de Klerk Performance
VERY GOOD RESULTS IN OUR MOST IMPORTANT QUARTER
 VERY GOOD RESULTS IN OUR MOST IMPORTANT QUARTER Q3 EBITDA USD 161.8 million, as compared to USD 155.6 million in the corresponding quarter last year 19% increase in passenger numbers on international flights
Cebu Air, Inc. Annual Stockholders Briefing. 24 June cebupacificair.com
 Cebu Air, Inc. Annual Stockholders Briefing 24 June 2015 cebupacificair.com Business Updates Passengers (M) Operating Statistics 2014: Passenger traffic grew 17.5% to 16.9M. Seat capacity grew 14.8% to
Q Fast growth continued, Comparable operating result at record high levels Pekka Vauramo
 2018 Fast growth continued, Comparable operating result at record high levels 17.7.2018 Pekka Vauramo 2 A good - Comparable operating result increased to new seasonal high Revenue Comparable operating
Finnair Group Interim Report 1 January 31 March 2008
 Finnair Group Interim Report 1 January 31 March 2008 1 29/04/2008 Presentation name / Author Outlook for the industry less positive Growth of demand declining due to uncertainty of global economy Growth
Information meeting. 12 September 2011
 Information meeting 12 September 2011 Full Year 2010-11 key data April 2010-March 2011 Revenues in billions Operating result in millions 77% Passenger 18.10 +11.3% -44 +874 13% Cargo 3.16 +29.5% +69 +505
GOOD SECOND-QUARTER RESULTS. GOOD OUTLOOK FOR THE YEAR DESPITE NEGATIVE IMPACT OF EXTERNAL FACTORS ON EBITDA GUIDANCE.
 GOOD SECOND-QUARTER RESULTS. GOOD OUTLOOK FOR THE YEAR DESPITE NEGATIVE IMPACT OF EXTERNAL FACTORS ON EBITDA GUIDANCE. EBITDA in Q2 USD 52.4 million, as compared to USD 50.3 million last year 18% increase
OPERATING AND FINANCIAL HIGHLIGHTS. Subsequent Events
 Copa Holdings Reports Net Income of $103.8 million and EPS of $2.45 for the Third Quarter of 2017 Excluding special items, adjusted net income came in at $100.8 million, or EPS of $2.38 per share Panama
Cebu Air, Inc. 4 th Quarter and Full Year 2017 Results of Operations. cebupacificair.com
 Cebu Air, Inc. 4 th Quarter and Full Year 2017 Results of Operations cebupacificair.com Disclaimer The information provided in this presentation is provided only for your reference. Such information has
Airline industry outlook remains fragile
 Airline industry outlook remains fragile June 2009 www.iata.org/economics To represent, lead and serve the airline industry Airline industry outlook remains fragile Green shoots starting to appear Recovery
Interim Management Report First Half Results 2010/11. October 29, 2010
 Interim Management Report First Half Results 2010/11 October 29, 2010 Disclaimer Certain information included in these statements is forward-looking and involves risks and uncertainties that could cause
1 st Quarter Results FY
 1 st Quarter Results FY 2004-05 05 Q1 Highlights p Context 8Improving economic context 8Strong economic growth in Americas and Asia 8Modest economic recovery in Europe 8Soaring fuel prices 8IPE Brent up
JET AIRWAYS (I) LTD. Presentation on Financial Results Q July 24, 2009
 LTD. Presentation on Financial Results Q July 24, 2009") JET AIRWAYS (I) LTD Presentation on Financial Results Q1 2010 July 24, 2009 1 1 1 Agenda Domestic operating environment Jet Airways performance highlights JetLite performance highlights Outlook 2 2 2 Domestic
JET AIRWAYS (I) LTD Presentation on Financial Results Q1 2010 July 24, 2009 1 1 1 Agenda Domestic operating environment Jet Airways performance highlights JetLite performance highlights Outlook 2 2 2 Domestic
Third Quarter Results
 1 Third Quarter 2010-11 Results Highlights of the Third Quarter Passenger business affected by significant disruptions Dynamic cargo activity Strong improvement in results Decline in ex-fuel unit costs
Forward looking statements
 Forward looking statements This presentation contains forward-looking statements. Forward-looking statements often include words such as anticipate", "expect", "intend", "plan", "believe, continue or similar
Analyst and Investor Conference Call Q Frankfurt, 25 October 2017
 Analyst and Investor Conference Call Q3 2017 Frankfurt, 25 October 2017 Disclaimer The information herein is based on publicly available information. It has been prepared by the Company solely for use
Cathay Pacific Airways 2011 Analyst Briefing 23 June 2011
 Cathay Pacific Airways 2011 Analyst Briefing 23 June 2011 1 Airline Strategy Grow our international network, expand frequencies and further develop Hong Kong as one of the world s leading aviation hubs
Even Frydenberg, President & CEO Jan Johansson, CFO
 Even Frydenberg, President & CEO Jan Johansson, CFO CONTINUED IMPROVED EARNINGS Good demand in the quarter driven by leisure Sales growth of 23% fueled by more rooms in operation and currency effects Like-for-like
Copa Holdings Reports Net Income of $136.5 million and EPS of $3.22 for the First Quarter of 2018
 Copa Holdings Reports Net Income of $136.5 million and EPS of $3.22 for the First Quarter of 2018 May 9, 2018 PANAMA CITY, May 9, 2018 /PRNewswire/ -- Copa Holdings, S.A. (NYSE: CPA), today announced financial
Finnair Group Interim Report 1 January 30 June 2008
 Finnair Group Interim Report 1 January 30 June 2008 1 08/08/2008 Presentation name / Author Airline industry at a historical turning point Fuel price has a stranglehold on the business Average ticket prices
Copa Holdings Reports Net Income of $57.7 million and EPS of $1.36 for the Third Quarter of 2018
 Copa Holdings Reports Net Income of $57.7 million and EPS of $1.36 for the Third Quarter of 2018 November 14, 2018 PANAMA CITY, Nov. 14, 2018 /PRNewswire/ -- Copa Holdings, S.A. (NYSE: CPA), today announced
Q Finnair s growth continued Pekka Vähähyyppä
 2018 Finnair s growth continued 25.10.2018 Pekka Vähähyyppä 1 We continued to develop our services and network New route to Los Angeles in 2019, two daily flights to Hong Kong New digital service for exploring
OPERATING AND FINANCIAL HIGHLIGHTS. Subsequent Events
 Copa Holdings Reports Net Income of US$113.1 Million and EPS of US$2.57 for the First Quarter of 2015 Excluding special items, adjusted net income came in at US$106.0 million, or EPS of US$2.41 per share
Cathay Pacific Airways Analyst & Investor Briefing June Cathay Pacific Airways Interim Results 6 August 2008
 Cathay Pacific Airways 2010 Analyst & Investor Briefing June 2010 Cathay Pacific Airways 2008 Interim Results 6 August 2008 Airline Strategy Remains largely unchanged Grow our international network, expand
Information meeting. September 2011
 Information meeting September 2011 Full Year 2010-11 key data April 2010-March 2011 Revenues in billions Operating result in millions 77% Passenger 18.10 +11.3% -44 +874 13% Cargo 3.16 +29.5% +69 +505
Fourth Quarter and Full Year 2011 Results Presentation. February 1, 2012
 Fourth Quarter and Full Year 2011 Results Presentation February 1, 2012 This presentation may include forward-looking comments regarding the Company s business outlook and anticipated financial and operating
Leaving the Competition Behind. Second Quarter (Apr-Jun) 2009 Results
 2009 Results") Leaving the Competition Behind Second Quarter (Apr-Jun) 2009 Results 12 Aug 2009 1 Disclaimer Information contained in our presentation is intended solely for your reference. Such information is subject
Leaving the Competition Behind Second Quarter (Apr-Jun) 2009 Results 12 Aug 2009 1 Disclaimer Information contained in our presentation is intended solely for your reference. Such information is subject
AIR FRANCE-KLM RESULTS PRESENTATION
 AIR FRANCE-KLM RESULTS PRESENTATION Results as at 30 th of June 2018 1 st August 2018 SECOND QUARTER 2018: KEY HIGHLIGHTS Leveraging ongoing solid demand +0.8% +1.7% Stable operating result before strike
Cathay Pacific Airways Interim Results 04 August Cathay Pacific Airways Interim Results 6 August 2008
 Cathay Pacific Airways 2010 Interim Results 04 August 2010 Cathay Pacific Airways 2008 Interim Results 6 August 2008 Interim Result 1H 2010 1H 2009 Group Profit/(Loss) HK$6,840m HK$812m Group Turnover
Finnair 2015 kolmannen vuosineljänneksen tulos
 Finnair 215 kolmannen vuosineljänneksen tulos Q3 Result 215 3 October 215 3.1.215 Toimitusjohtaja Pekka Vauramo Talousjohtaja Pekka Vähähyyppä 1 Highlights of the quarter Excellent Q3 result: Record result
Management Presentation. March 2016
 Management Presentation March 2016 Forward looking statements This presentation as well as oral statements made by officers or directors of Allegiant Travel Company, its advisors and affiliates (collectively
Cebu Air, Inc. 2Q2014 Results of Operation
 Cebu Air, Inc. 2Q2014 Results of Operation 1 Disclaimer This information provided in this presentation is provided only for your reference. Such information has not been independently verified and, as