AGENDA. Group overview. Financial highlights. Operational highlights. Expansion plans
|
|
|
- Penelope Mills
- 5 years ago
- Views:
Transcription


1 1


2 AGENDA Group overview Financial highlights Operational highlights Expansion plans 2
3 3
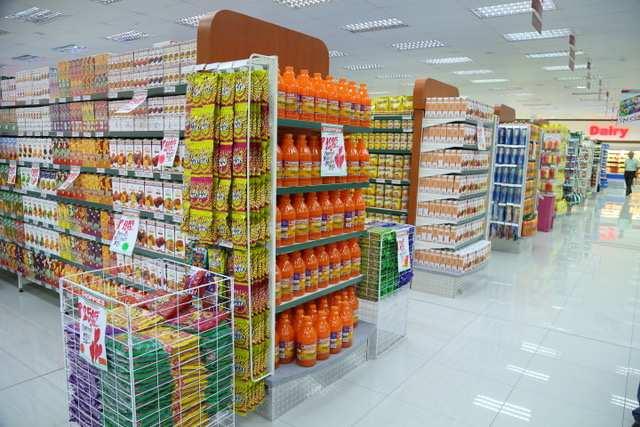
4 CURRENT FOOTPRINT Kenya 12 stores 2 DCs Tanzania 2 stores Number of stores 31-Dec Dec-17 Increase: Dec-16 to Dec-17 Current (Apr-18) Botswana Zambia 16 stores 1 DC South Africa Zimbabwe Namibia 3 stores Uganda Botswana 85 stores 3 DCs Zimbabwe 32 stores 2 DCs Mozambique 1 store Zambia Kenya Tanzania Mozambique South Africa (North West) 57 stores 2 DCs Arizona 8 stores Namibia Total Durban 23 stores 1 Factory 1 DC 4
5 Financial highlights Financial Metrics (Group) HY 2018 HY 2017 Movement No. of stores Revenue (BWP millions) % Gross profit (BWP millions) % Gross profit margin 19.5% 19.4% 0.1% EBITDA (BWP millions) % EBITDA margin 4.4% 4.0% 0.4% PAT (BWP millions) % PAT margin 1.2% 1.2% 0% Like for like revenue (BWP millions) % Like for like footfall (in millions) % Like for like basket size (BWP) % Number of employees % Return on net assets 5.55% 3.74% 1.81% Revenue per sqm % 5
6 Revenue split by region HY 2018 HY 2017 Zambia, 4.2% Kenya, 3.6% Tanzania, Namibia, 0.1% 0.1% Mozambique, 0.2% Zambia, 2.5% Kenya, 2.7% Tanzania, 0.0% Zimbabwe, 15.2% Zimbabwe, 15.6% Jwayelani, 9.1% Botswana, 40.3% Jwayelani, 9.5% Botswana, 48.5% SA total 36.2% Rustenburg, 27.1% SA total 30.6% Rustenburg, 21.1% Reduced dependency on Botswana (from 49% revenue contribution in HY 2017, to 40% contribution in HY 2018). 6% contribution increase in SA. New regions scaling up and contributing to diversified growth. 6
7 Revenue growth P 5762 m P 4714 m P 3531 m P 3008 m P 2504 m P 2005 m HY 2013 HY 2014 HY 2015 HY 2016 HY 2017 HY 2018 Consistent revenue growth, with a 5-year compounded annual growth rate of 23.5%. 7
8 Revenue growth Segment wise Existing Stores (%) New Stores (%) Total (%) Botswana 2% 4% 6% South Africa 32% 27% 59% North West 43% 33% 76% KZN 10% 12% 22% Zimbabwe 20% 5% 25% Zambia 13% 105% 118% Kenya 28% 40% 68% Tanzania 95% 132% 227% Mozambique N/A N/A N/A Namibia N/A N/A N/A Total Sales 17% 13% 29% Like for like analysis HY 2018 HY 2017 Movement Sales (BWP millions) % Footfall (millions) % Basket size (BWP) % 8
9 Gross Profit 22.3% 20.8% 19.8% 18.1% 23.1% 21.9% 16.5% 18.3% 14.4% 15.9% 19.5% 19.4% Botswana SA - North west SA - KZN Zimbabwe Other regions Total HY 2018 HY
10 EBITDA P 62 m P 19 m P 251 m P 185 m P 166 m P 189 m SA Total P 46 m P 3 m Loss P 6 m P 41 m P 18 m P 24 m P 33 m P 30 m Botswana SA - North west SA - KZN Zimbabwe Other regions Total -P 11 m -P 26 m -P 20 m HY 2018 HY
11 Profitability analysis EBITDA P 189 m P 251 m Depreciation P 127 m P 100 m Net interest PBT Tax PAT P 31 m P 16 m P 93 m P 73 m P 25 m P 17 m P 68 m P 56 m P 62 m increase in EBITDA Profitability increase of P 12 m due to: P 27 m increase in depreciation P 15 m increase in net interest P 8 m increase in tax HY 2018 HY
12 Gross profit margin KPIs 19.5% 19.4% Gross profit: Positive increase in Gross Profit Margin, mainly from the Botswana and South Africa North West regions. Gross Profit increased by 23% in value YoY. Dec-17 Dec 16 EBITDA margin 4.4% 4.0% EBITDA: Improved performance of Botswana and SA regions resulted in improved total group EBITDA margin. Dec-17 Dec 16 12
13 1.12 Current ratio 1.14 KPIs Current ratio: Current ratio for HY 2018 reduced to 1.12x, compared to 1.26x for FY Current ratio reduced mainly due to increase in working capital days Dec-17 Dec 16 Interest coverage ratio Interest coverage ratio: Ratio improved to 7.68x for HY 2018, compared to 6.34x for FY Dec-17 Dec 16 13
14 Inventory days Dec-17 Dec 16 Receivable days 4 3 Dec-17 Dec 16 Working capital Inventory days increased due to opening of new stores in South Africa and new geographies. The majority of the group s sales are in cash. Receivables are mainly associated with credit extended to buying groups. Due to increases in stock holding, NWC days is positive. The group s objective is to maintain zero or negative NWC days. New regions are expected to meet these targets, once they mature. Net working capital days 3 Payable days Payable days increased mainly due to increases in inventories for South Africa and new geographies. (0.28) Dec-17 Dec 16 Dec-17 Dec 16 14
15 Cash flow BWP Millions HY 2018 Cash flows generated from operating activities 332 Investing activities - New store capex (161) - Replacement capex (73) Financing activities - New loans 32 - Loan repayment (including interest) (49) Net movement 81 Opening cash & cash equivalents (Net of overdraft) 76 Closing cash & cash equivalents (Net of overdraft)
16 Net debt position BWP Millions HY 2018 HY 2017 Long term debt Bank overdraft Total debt Cash (194) (221) Net Debt EBITDA LTM EBITDA Equity Total Debt to Equity 0.46x 0.42x Net Debt to LTM EBITDA 1.31x 1.51x 16
17 Operational highlights 17
18 Retail space growth Region (all values in sqm) HY 2018 HY 2017 Growth Botswana 119, ,430 3,063 South Africa 139, ,706 31,072 Zimbabwe 37,841 37, Zambia 18,668 12,007 6,661 Kenya 20,199 16,315 3,884 Tanzania 1, ,106 Mozambique 1,504-1,504 Namibia 1,915-1,915 Total 340, ,968 50,005 18


19 Botswana Despite aggressive store roll outs by competitors, we were able to achieve decent growth in Botswana, whilst maintaining our strong market share in the region. 5.9% increase in overall revenue. 2.3% like for like revenue increase. Value added financial products / services continue to grow in Botswana, and we expect to add more products in the calendar year. 19

20 Botswana Whilst Botswana experienced continued subdued economic activity and increased competition, we managed to maintain market share in this market. We expect the economy to improve under Botswana s new political leadership. 20


21 South Africa North-West region: Region demonstrated strong like for like growth of 43%, and overall growth of 76%. This was achieved mainly due to competitive buying, ensuring stock availability in stores and improvements in product range. Achieved profitability in the first half of the year. Significant improvement in financial services. 21


22 KZN region: South Africa The KZN business was hard hit by the import ban on chickens and production stoppages by local chicken farmers. Gross margin was severely compromised to maintain volumes, and we only expect this to change post June new stores were acquired in KZN effective from 1 November These are expected to benefit the group in terms of enhanced scale and efficiencies. 22


23 Zimbabwe Despite liquidity issues in the economy, our segmental revenue grew by 25%, with like for like growth of 20%, and 12% growth in EBITDA. Under the new political dispensation, we expect the economy to rebound quickly. There are a few initiatives in the pipeline to streamline financial services. We expect a significant turnaround once the necessary financial approval is obtained from regulatory authorities. 23


24 Zambia: Other Regions We continue to aggressively promote the brand for market share. We expect to be able to achieve breakeven profitability with the opening of a few more stores, which are scheduled before the end of this calendar year. Kenya: Planned revamp of stores taken over from Ukwala have started, and we expect to finish renovations by end of July The market is ripe for a turnaround, and we are hopeful that this will pay off. 24
25 Tanzania: Other Regions We expect to open the third store by the end of May 2018 this will provide some good volumes, as it will be the biggest Choppies retail outlet in Tanzania. Retail site development is generally very slow in Tanzania, and we expect to grow at a slow pace in this market. Namibia: Commenced operations in Namibia in November Currently we operate 3 stores in Namibia. Preliminary indications are very good, and the market has similar characteristics to Botswana. We are confident that we will excel in this market. 25
26 Other Regions Mozambique: Due to continued economic issues in the Mozambique market, we are taking a very cautious approach going forward. 2 leases are in the pipeline, but will commence operations at a slow pace. 26
27 EXPANSION PLANS 27
28 Planned New Stores & Capex Planned New Stores (Post Dec 17) Country FY 2018 (# stores) Botswana - South Africa 3 Zimbabwe 2 Zambia 2 Kenya 2 Tanzania 1 Mozambique - Namibia 2 Total 12 Estimated Capex Country FY 2018 (Pula millions) Botswana - South Africa 24 Zimbabwe 11 Zambia 15 Kenya 24 Tanzania 8 Mozambique - Namibia 15 Total 97 Cumulative no. stores
29 THANK YOU 29
2007/08 Interim Results
 Bossini International Holdings Limited 2007/08 Interim Results For the six months ended 31 December 2007 Corporate Presentation 19 March 2008 0 Agenda Results Highlights Review of Operations Future Plans
Minor International Public Company Limited
 Minor International Public Company Limited Management Discussion & Analysis MINT s financial performance as of 30th June 2008 Summary of Key Financial Performance 2Q08 Performance Minor International Public
FIRST QUARTER RESULTS 2017
 FIRST QUARTER RESULTS 2017 KEY RESULTS In the 1Q17 Interjet total revenues added $4,421.5 million pesos that represented an increase of 14.8% over the income generated in the 1Q16. In the 1Q17, operating
Cathay Pacific Airways Interim Results 04 August Cathay Pacific Airways Interim Results 6 August 2008
 Cathay Pacific Airways 2010 Interim Results 04 August 2010 Cathay Pacific Airways 2008 Interim Results 6 August 2008 Interim Result 1H 2010 1H 2009 Group Profit/(Loss) HK$6,840m HK$812m Group Turnover
Minor International Public Company Limited
 Minor International Public Company Limited Management Discussion & Analysis MINT s financial performance as of 30th September 2008 Summary of Key Financial Performance 3Q08 Performance Minor International
PRESS RELEASE. First Half 2017 Financial Results Higher Load Factors and traffic lead to a significant rebound in second quarter profitability
 PRESS RELEASE First Half 2017 Financial Results Higher Load Factors and traffic lead to a significant rebound in second quarter profitability Kifissia, 12 September 2017 AEGEAN announces first half 2017
ERW. 022/ ACC003/ th February Subject: Management's Discussion and Analysis period ending 31 st December 2012
 ERW. 022/ ACC003/56 26 th February 2013 Subject: Management's Discussion and Analysis period ending 31 st December 2012 Attention: The President, The Stock Exchange of Thailand Dear Sir, The Erawan Group
THIRD QUARTER RESULTS 2017
 THIRD QUARTER RESULTS 2017 KEY RESULTS In the 3Q17 Interjet total revenues added $5,835.1 million pesos that represented an increase of 22.0% over the revenue generated in the 3Q16. In the 3Q17, operating
Investec Africa Conference. Nampak Growth Strategy in Africa
 Investec Africa Conference Nampak Growth Strategy in Africa Presented by: Andrew Marshall Date Tuesday, 22 nd March 2011 Agenda An overview of Nampak in Africa Our presence on the continent Strategy and
01 Amadeus at a glance
 01 Amadeus at a glance 7 Amadeus Annual Report 2011 1.1 Company s origins and development Most people associate the birth of electronic commerce distribution with the arrival of the internet. In fact,
Corporate Presentation 2015/16 Interim Results
 Corporate Presentation 2015/16 Interim Results 24 February 2016 0 Disclaimer The information contained in this presentation is intended solely for your personal reference. Such information is subject to
AEROFLOT ANNOUNCES FY 2017 IFRS FINANCIAL RESULTS
 AEROFLOT ANNOUNCES FY 2017 IFRS FINANCIAL RESULTS Moscow, 1 March 2018 Aeroflot Group ( the Group, Moscow Exchange ticker: AFLT) today publishes its audited financial statements in accordance with International
ERW. 083/ ACC012/ th November Subject: Management's Discussion and Analysis period ending 30 th September 2012
 ERW. 083/ ACC012/55 12 th November 2012 Subject: Management's Discussion and Analysis period ending 30 th September 2012 Attention: The President, The Stock Exchange of Thailand Dear Sir, The Erawan Group
FOURTH QUARTER RESULTS 2017
 FOURTH QUARTER RESULTS 2017 KEY RESULTS In the 4Q17 Interjet total revenues added $5,824.8 million pesos that represented an increase of 10.8% over the revenue generated in the 4Q16. In the 4Q17, operating
All Time High Quarter I Results, FY Net Sales up 35.7 %, EBITDA up 65.6 %, Net profit up 55.8%
 All Time High Quarter I Results, FY 2014-15 Net Sales up 35.7 %, EBITDA up 65.6 %, Net profit up 55.8% Mumbai, July 30, 2014: Pharma Major, Lupin Ltd. reported its performance for the first quarter ending
Summary of Results for the First Quarter of FY2015/3
 Summary of for the First Quarter of FY2015/3 August 8, 2014 Tokyu Corporation (9005) http://www.tokyu.co.jp/ Contents Ⅰ.Executive Summary 2 Ⅱ.Conditions in Each Business 4 Ⅲ.Details of Financial for the
Helloworld Travel Limited results announcement Half year ended 31 December 2017
 Helloworld Travel Limited results announcement Half year ended 31 December 2017 HIGHLIGHTS FOR THE HALF YEAR ENDED 31 DECEMBER 2017 Total Transaction Value (TTV) growth of 2.7% to $2.968 billion. Earnings
MANAGEMENT DISCUSSION AND ANALYSIS
 MANAGEMENT DISCUSSION AND ANALYSIS COMPANY AND SUBSIDIARIES FINANCIAL STATUS AND PERFORMANCE MINOR INTERNATIOANL PUBLIC COMPANY LIMITED CONSOLIDATED FINANCIAL STATEMENTS AS OF JUNE 2006 1.) Overview In
Investment Highlights
 Third Quarter 2014 Investment Highlights 1 Mexican airport portfolio positioned to take full advantage of global growth. 2 Diversified business model contributing to earnings resilience. 3 Well-defined
Management Presentation. May 2013
 Management Presentation May 2013 Forward looking statements This presentation as well as oral statements made by officers or directors of Allegiant Travel Company, its advisors and affiliates (collectively
THIRD QUARTER RESULTS 2018
 THIRD QUARTER RESULTS 2018 KEY RESULTS In the 3Q18 Interjet total revenues added $ 6,244.8 million pesos that represented an increase of 7.0% over the revenue generated in the 3Q17. In the 3Q18, operating
Preliminary Figures FY 2016
 February 14, 2017 Preliminary Figures FY 2016 Capital Markets Day 2017 Tom Blades (CEO) Disclaimer This presentation has been produced for support of oral information purposes only and contains forwardlooking
Creation of the Largest African Coca-Cola Bottler
 Creation of the Largest African Coca-Cola Bottler Presented by: Alan Clark, Chief Executive Jamie Wilson, Chief Financial Officer 27 November 2014 Forward looking statements This presentation includes
M2 Group Ltd 2014 Interim Results
 M2 Group Ltd 2014 Interim Results 24 February 2014 Geoff Horth, CEO Presentation Content Record Financial Performance Strong Organic Growth FY14 Priorities and Guidance Slide 2, 24 February 2014 Record
Final Dividend 7.0 cents per share, full year payout of 10.0
 KATHMANDU HOLDINGS LIMITED ASX/NZX/Media Announcement 21 September 2011 Kathmandu Holdings Ltd announces record sales and earnings result for FY2011: NZ$ Denominated Result Sales up 24.5% to $306.1m, EBIT
Summary o f Results for the First Half of FY2018
 Summary o f Results for the First Half of FY2018 November 9, 2018 (9005) https://www.tokyu.co.jp/ Contents Ⅰ.Executive Summary 2 Ⅱ.Conditions in Each Business 6 Ⅲ.Details of Financial Results for the 13
First Half 2013 Results. 16 mai 2013
 First Half 2013 Results 16 mai 2013 26 July 2013 Results Increasing effects of Transform 2015 Highlights of the First Half A difficult global economic environment Transform 2015 plan roll-out on track
Ramsay Health Care Limited Results Briefing Half Year ended 31 December 2018
 Ramsay Health Care Limited Results Briefing Half Year ended 31 December 2018 Craig McNally, Group Managing Director & Bruce Soden, Group Finance Director 28 February 2019 ramsayhealth.com Agenda Group
PRESS RELEASE Financial Results. Rising passenger traffic at 12.5m Exceeding 1bn in consolidated revenue
 PRESS RELEASE 2016 Financial Results Rising passenger traffic at 12.5m Exceeding 1bn in consolidated revenue Kifissia, 23 March 2017 AEGEAN reports full year 2016 results with consolidated revenue at 1,020m,
SADC SELECTED ECONOMIC AND SOCIAL INDICATORS, 2016
 SADC SELECTED ECONOMIC AND SOCIAL INDICATORS, 2016 1. INTRODUCTION This report is an attempt to provide data series and a brief trend analysis of the major socio-economic characteristics of SADC region
FIRST QUARTER RESULTS 2016
 FIRST QUARTER RESULTS 2016 KEY RESULTS In 1Q16 Interjet total revenues added $3,850.8 million pesos that represented an increase of 21.9% over the income generated in the 1Q15. In 1Q16 total passengers
Center Parcs. Investor Presentation
 Center Parcs Investor Presentation Annual Results: Year to 24 th April 2014 1 st July 2014 Agenda 1. Overview 2. Key Financial Highlights 3. Financial Covenants 4. Capital Investment and Business Development
2012 Result. Mika Vehviläinen CEO
 2012 Result Mika Vehviläinen CEO 1 Agenda Market environment in Q4 Business performance and strategy execution Outlook Financials 2 Market Environment According to IATA, Global air travel continues to
NORWEGIAN AIR SHUTTLE ASA QUARTERLY REPORT FIRST QUARTER 2004 [This document is a translation from the original Norwegian version]
![NORWEGIAN AIR SHUTTLE ASA QUARTERLY REPORT FIRST QUARTER 2004 [This document is a translation from the original Norwegian version]](/thumbs/87/95085804.jpg "NORWEGIAN AIR SHUTTLE ASA QUARTERLY REPORT FIRST QUARTER 2004 [This document is a translation from the original Norwegian version]") NORWEGIAN AIR SHUTTLE ASA QUARTERLY REPORT 2004 IN BRIEF At the start of 2003, Norwegian has become a pure low-fare airline. The Fokker F-50 operations have been terminated, and during the quarter the
NORWEGIAN AIR SHUTTLE ASA QUARTERLY REPORT 2004 IN BRIEF At the start of 2003, Norwegian has become a pure low-fare airline. The Fokker F-50 operations have been terminated, and during the quarter the
Summary of Results for the First Three Quarters FY2015/3
 Summary of Results for the First Three Quarters FY2015/3 February 10, 2015 Tokyu Corporation (9005) http://www.tokyu.co.jp/ Contents Ⅰ.Executive Summary 2 Ⅱ.Conditions in Each Business 5 Ⅲ.Details of Financial
2017 results: REVENUE up to million (+1.6%), NET PROFIT FOR THE PERIOD 1 shows significant increase to million (+12.
, NET PROFIT FOR THE PERIOD 1 shows significant increase to million (+12.") Business Results in 2017: Significant Rise in Profits of the Flughafen Wien Group Management Board Announces Substantial Upward Revision of Earnings Guidance and Traffic Figures for 2018 2017 results:
Business Results in 2017: Significant Rise in Profits of the Flughafen Wien Group Management Board Announces Substantial Upward Revision of Earnings Guidance and Traffic Figures for 2018 2017 results:
Peppers Docklands, Melbourne
 Peppers Docklands, Melbourne Contents Mantra Group Overview State of Market 8 3 Australian Market Mantra Group 18 24 Mantra Salt, Kingscliff Peppers Noosa, Noosa Mantra Group* CBD - RevPAR (A$) Largest
Heathrow (SP) Limited
 Limited") Draft v2.0 10 Feb Heathrow (SP) Limited Results for year ended 31 December 2013 24 February 2014 Strong operational and financial performance in 2013 Passenger satisfaction at record high and over 72 million
Draft v2.0 10 Feb Heathrow (SP) Limited Results for year ended 31 December 2013 24 February 2014 Strong operational and financial performance in 2013 Passenger satisfaction at record high and over 72 million
Finnair Q Result
 17 August 2016 CEO Pekka Vauramo CFO Pekka Vähähyyppä Finnair Q2 2016 Result 1 Highlights of the second quarter The seventh consecutive quarter of profit improvement Fukuoka & Guangzhou route openings
Corporate Presentation 2012/13 Interim Results
 Corporate Presentation 2012/13 Interim Results 26 February 2013 0 Disclaimer The information contained in this presentation is intended solely for your personal reference. Such information is subject to
Agenda. Conclusion of Transform Key Perform 2020 initiatives. Perform 2020 financial framework. Information meeting
 Information meeting Agenda Conclusion of Transform 2015 Key Perform 2020 initiatives Perform 2020 financial framework 2 Transform 2015: first phase of group turnaround accomplished Strict capacity discipline
2007/08 Full Year Results Investor Briefing
 2007/08 Full Year Results Investor Briefing Highlights of Result Profit before tax up 46% to $1,408 million Up 36% on the reported result Margin improvement $3 billion of Sustainable Future Benefits achieved
FIRST QUARTER 2017 RESULTS. 4 May 2017
 FIRST QUARTER 2017 RESULTS 4 May 2017 A resilient start of the year, traffic up 4.2% 20.9 million passengers carried, up 5.2%, traffic (RPK) up 4.2%, capacity (ASK) up 3.3% and load factor up 0.7pts Confirmation
Management s Review and Analysis of Financial Position
 Management s Review and Analysis of Financial Position Japan Airlines System Corporation and Consolidated Subsidiaries Years Ended March 31, 22 and 23 Consolidated operating revenues 2,4 1,8 1,2 6 21 22
Analyst Presentation Schiphol Group 2006 Interim Financial Results
 Analyst Presentation Schiphol Group 2006 Interim Financial Results 24 August 2006 Interim Results Disclaimer This release may contain certain forward-looking statements with respect to the financial condition,
Investment Highlights
 Second Quarter 2014 Investment Highlights 1 Mexican airport portfolio positioned to take full advantage of global growth. 2 Diversified business model contributing to earnings resilience. 3 Well-defined
Q4 & FULL YEAR FY15 RESULTS UPDATE MAY 2015
 Q4 & FULL YEAR FY15 RESULTS UPDATE MAY 2015 DISCUSSION SUMMARY Q4 & FY15 RESULTS HIGHLIGHTS OUR PORTFOLIO UPDATE AMUSEMENT PARK, BANGALORE RESORT, BANGALORE AMUSEMENT PARK, KOCHI AMUSEMENT PARK, HYDERABAD
I ll give you an overview of financial results for the first half of fiscal year 2017 and topics of each business, mainly Shopping Complex Business.
 I ll give you an overview of financial results for the first half of fiscal year 2017 and topics of each business, mainly Shopping Complex Business. Page 2 shows a summary. Let me begin with consolidated
Q Fast growth continued, Comparable operating result at record high levels Pekka Vauramo
 2018 Fast growth continued, Comparable operating result at record high levels 17.7.2018 Pekka Vauramo 2 A good - Comparable operating result increased to new seasonal high Revenue Comparable operating
Management Presentation. November 2013
 Management Presentation November 2013 Forward looking statements This presentation as well as oral statements made by officers or directors of Allegiant Travel Company, its advisors and affiliates (collectively
1Q 2014 Edition. Share Information. Daily Share Price Movements
 1Q 2014 Edition 1Q 2013 1Q 2014 Change Financial Summary (USD Mio) OPERATING REVENUES 807 807 0.01% OPERATING EXPENSES 827 1,000 20.86% OTHERS (INCOME) 4 25 460.80% INCOME (LOSS) FROM OPERATIONS -20-193
INVESTOR NEWSLETTER. Full Year 2013 Editions. PT Garuda Indonesia (Persero) Tbk. FY 2012 FY 2013 Change. Summary.
 Tbk. FY 2012 FY 2013 Change. Summary.") INVESTOR NEWSLETTER PT Garuda Indonesia (Persero) Tbk. Full Year 2013 Editions FY 2012 FY 2013 Change Financial Summary (USD Mio) OPERATING REVENUES 3,472 3,716 7.02% OPERATING EXPENSES 3,304 3,660 10.75%
INVESTOR NEWSLETTER PT Garuda Indonesia (Persero) Tbk. Full Year 2013 Editions FY 2012 FY 2013 Change Financial Summary (USD Mio) OPERATING REVENUES 3,472 3,716 7.02% OPERATING EXPENSES 3,304 3,660 10.75%
GALAXY ENTERTAINMENT GROUP
 GALAXY ENTERTAINMENT GROUP RECORD HALF YEAR GROUP ADJUSTED EBITDA OF $5.8 BILLION, UP 23% YEAR-ON-YEAR NET PROFIT ATTRIBUTABLE TO SHAREHOLDERS GREW 35% TO $4.6 BILLION FURTHER STRENGTHENED LIQUID BALANCE
Q1 FY19 Trading Update
 Regulatory Story Go to market news section Whitbread PLC - WTB 1st Quarter Results Released 07:00 27-Jun-2018 RNS Number : 6748S Whitbread PLC 27 June 2018 Q1 FY19 Trading Update 27 June 2018 Group total
3M 2013 Edition. Share Information : GIAA.IJ / GIAA.JK. Daily Share Price Movements
 3M 2013 Edition 3M 2012 3M 2013 Change Financial Summary (USD Mio) OPERATING REVENUES 717 807 12.51% OPERATING EXPENSES 734 827 12.70% INCOME (LOSS) FROM OPERATIONS (17) (20) 20.68% INCOME (LOSS) BEFORE
Interim results. 11 May 2010
 Interim results 11 May 2010 Introduction Andy Harrison Chief Executive Officer Strong performance despite disruption Improvement in revenue, margins and cash Continued network improvement has driven better
Aéroports de Paris 2007 consolidated annual results. Dividend proposal to be submitted to the Annual General Meeting: 1.
 Paris, 13 March 2008 Aéroports de Paris 2007 consolidated annual results Dividend proposal to be submitted to the Annual General Meeting: 1.63 euro per share Strong growth in all of the Group's business
FOURTH QUARTER AND FULL-YEAR RESULTS February 2008
 FOURTH QUARTER AND FULL-YEAR RESULTS 2 1 February 2 AGENDA CEO review Financial review Operating review of Mobile Concluding remarks Harri Koponen Lars Nilsson Harri Koponen Harri Koponen 2 29-2-1 Fourth
Annual General Meeting. 13 June 2017
 Annual General Meeting 13 June 2017 Agenda 1. Approval of the Annual Report of the financial year 2016 of AS Tallink Grupp 2. Proposal on distribution of profits 3. Extension of authorities of the members
El Al Israel Airlines announced today its financial results for the second quarter and the first half of 2017.
 August 16, 2017 El Al Israel Airlines announced today its financial results for the second quarter and the first half of 2017. The Company's revenues in the second quarter of 2017 amounted to approx. USD
Crown Resorts Limited
 Crown Resorts Limited 2015 Full Year Results Presentation 13 August 2015 1 Crown Resorts Limited Results Overview Crown Resorts Limited (Crown) performance: Overall, the results for Crown s portfolio of
Corporate Presentation CIMB 11th Annual Malaysia Corporate Day
 No. 58019-U Corporate Presentation CIMB 11th Annual Malaysia Corporate Day 4 January 2019 1 1 2 3 4 5 6 GROUP OVERVIEW KEY PROPERTIES FINANCIAL HIGHLIGHTS MALAYSIA OPERATIONS OVERSEAS OPERATIONS UNITED
Tat Hong Reports 13% Decline in FY2017 Revenue
 FOR IMMEDIATE RELEASE Registration No: 199105392H Tat Hong Reports 13 Decline in FY2017 Revenue - Cash and cash equivalents of S$114.3 million - Cash flow from operations of S$85.2 million - Net gearing
Fourth Quarter and Full Year 2009
 Investor and analyst meeting: Fourth Quarter and Full Year 29 25 th February 21 2 The views expressed here contain some information derived from publicly available sources that have not been independently
Results for the year ended 31 December Creating Advantage
 Results for the year ended 31 December 2018 Creating Advantage 2018 Overview Record revenues and profits Revenue 225m +14% HPBT 31m +26% Growth in Healthcare Revenue 152m +27% Profits 35m +36% Return to
Even Frydenberg, President & CEO Jan Johansson, CFO
 Even Frydenberg, President & CEO Jan Johansson, CFO CONTINUED IMPROVED EARNINGS Good demand in the quarter driven by leisure Sales growth of 23% fueled by more rooms in operation and currency effects Like-for-like
Operative & Financial Results:
 Operative & Financial Results: F i r s t Q u a r t e r 2 0 1 4 Grupo Posadas, S.A.B. de C.V. & Subsidiaries Mexico City April 29, 2014 Information presented with respect to the same quarter of last year
Press release February 21, 2014
 Press release February 21, 2014 2013 earnings Recurrent ent net income per share up +1.2%, with NAV per share growth of +1.7% Significant improvement in the financial occupancy rate and rental margin Recurrent
SAS Q1 2016/
 SAS Q1 2016/2017 08.03.2017 Weak Q1 as expected new structural actions underway Q1 in summary Positives + Currency adjusted passenger revenue up 5% + Strong development of ancillary revenues + Passengers
Annual Results for the year ended 28 February 2015
 Annual Results for the year ended 28 February 2015 AGENDA OVERVIEW PROPERTY UNITED KINGDOM PROPERTY DEVELOPMENT AFRICA FINANCIAL SERVICES FINANCIAL REVIEW LOOKING AHEAD Q & A ANNUAL RESULTS FOR THE YEAR
Quarterly Meeting# 4/2018
 Quarterly Meeting# 4/2018 3Q18 & 9M18 Performance & Outlook 14 November 2018 1 2016 ERAWAN. All rights reserved. The views expressed here contain some information derived from publicly available sources
75 Years of Thrills and Entertainment. The Rank Group Plc Preliminary Results to 30 June 2012
 75 Years of Thrills and Entertainment The Rank Group Plc Preliminary Results to 30 June 2012 Agenda Introduction Ian Burke, chairman and chief executive Review of financial results Clive Jennings, finance
Ryannair Holdings plc. Sample 8
 GCE Business Studies Aer Lingus plc Ryannair Sample 8 GCE Business Study the information below and answer the questions that follow. The following are two public limited companies that operate within the
Air China Limited Annual Results. March Under IFRS
 Air China Limited 21 Annual Results Under IFRS March 211 Agenda Part 1 Highlights Part 2 Business Overview Part 3 Financial Overview Part 4 Outlook 2 Part 1 Highlights Steady Economic Growth; Asia Pacific
Quarterly Meeting # 2/2014
 Quarterly Meeting # 2/2014 Performance & Outlook 15 May 2014 The views expressed here contain some information derived from publicly available sources that have not been independently verified. No representation
5. Economic performance
 AT 1 1 Economic performance STOCK MAINTAINING LEADERSHIP EFFICIENCY AND COMPETITIVENESS Income Costs INVESTMENT GENERATING CAPACITY AND VALUE AT 1 1 Profitability CHALLENGES AIMS 2018 PROGRESS IN SDG The
China Lodging Group (HTHT.US) Q Earnings Call August 17, 2017
 Q Earnings Call August 17, 2017") China Lodging Group (HTHT.US) Q2 2017 Earnings Call August 17, 2017 Agenda Lodging Landscape in China Strategy Review Operational and Financial Review Q & A Appendix 1 Strong Demand: Domestic Travel Remains
China Lodging Group (HTHT.US) Q2 2017 Earnings Call August 17, 2017 Agenda Lodging Landscape in China Strategy Review Operational and Financial Review Q & A Appendix 1 Strong Demand: Domestic Travel Remains
China Lodging Group (HTHT.US) Q4 and full year 2017 Earnings Call March 13, 2018
 Q4 and full year 2017 Earnings Call March 13, 2018") China Lodging Group (HTHT.US) Q4 and full year 2017 Earnings Call March 13, 2018 Agenda Strategy Review Operational and Financial Review Q & A Appendix 1 Strong RevPAR Growth Driven by ADR + Occupancy
China Lodging Group (HTHT.US) Q4 and full year 2017 Earnings Call March 13, 2018 Agenda Strategy Review Operational and Financial Review Q & A Appendix 1 Strong RevPAR Growth Driven by ADR + Occupancy
Investor Presentation
 TUI Group Investor Presentation WestLB Deutschland Conference 2010 17 November 2010 TUI AG Investor Relations Seite 1 Future-related related statements This presentation contains a number of statements
For personal use only
 Automotive Holdings Group Limited 21 Old Aberdeen Place West Perth, WA 6005 www.ahgir.com.au ABN 35 111 470 038 PRESENTATION TO MACQUARIE CONFERENCE 7 th May 2015 The company advises the attached presentation
Heathrow (SP) Limited
 Limited") 28 April 2014 Heathrow (SP) Limited Results for three months ended 31 March 2014 Strong operational and financial performance at the outset of the new regulatory period Highest ever passenger satisfaction
28 April 2014 Heathrow (SP) Limited Results for three months ended 31 March 2014 Strong operational and financial performance at the outset of the new regulatory period Highest ever passenger satisfaction
Yoma Strategic s 3Q2017 Revenue grew by 16.6% with improved Gross Profit margins
 Media Release Yoma Strategic s 3Q2017 Revenue grew by 16.6% with improved Gross Profit margins Revenue across the Group s core businesses grew for the quarter Gross Profit margins improved from 34.3% in
Investor update presentation. November 2016
 Investor update presentation November 2016 Content Update on Q3 2016 financial performance 3-8 Recap on ATG Evolution 9-10 Update on hospitality strategic business unit 11-14 Update on online travel and
Nicco Parks & Resorts Ltd BSE Scrip Code:
 Nicco Parks & Resorts Ltd BSE Scrip Code: 526721 Other Leisure Facilities September 14, 2012 Equity Statistics Current Market Price Rs. 15.9 52 Week High / Low Rs. 24.4/15.2 Market Capitalisation Rs. crores
Bank of America Gaming Conference Presentation. June 2006
 Bank of America Gaming Conference Presentation June 2006 Agenda Company Overview Slot Route Operations Nevada Casino Operations Midwest Casino Operations (Grace) Financial Overview Key Takeaway 1 Company
Flughafen Wien AG results in Q1 2015: Increased revenue and earnings despite passenger decline
 Flughafen Wien AG results in Q1 2015: Increased revenue and earnings despite passenger decline REVENUE up slightly to 140.7 million (+0.9%), EBITDA improved to 54.0 million (+1.4%) and EBIT rose to 21.9
H1 RESULTS 2007 Jón Karl Ólafsson, CEO
 H1 RESULTS 2007 Jón Karl Ólafsson, CEO Agenda 01 Highlights 02 Financial results 03 Outlook 04 New organizational chart 05 Q & A H1 Highlights Aggressive fleet growth characterizes H1 results 12 aircraft
FIRST QUARTER
 FIRST QUARTER 2007 1 WELCOME TO REZIDOR one of the fastest growing hotel companies in the world 300 250 200 150 100 FAST TRACK GROWTH FRESH & DYNAMIC MULTI-BRAND PORTFOLIO BRAND SEGMENT HOTELS ROOMS Upscale
MEDIA RELEASE JUST GROUP ACHIEVES FIRST HALF PROFIT INCREASE OF 25.2%
 MEDIA RELEASE 7 March 2006 JUST GROUP ACHIEVES FIRST HALF PROFIT INCREASE OF 25.2% Just Group today announced a record net profit of $36.4 million for the six months ending 28 January 2006, a rise of 25.2%.
Crown Resorts Limited
 Crown Resorts Limited 2016 Half Year Results Presentation 25 February 2016 1 Crown Resorts Limited Results Overview Crown Resorts Limited (Crown) performance: The 2016 First Half results across Crown s
2008/09 Interim Results For the six months ended 31 December 2008
 Bossini International Holdings Limited 2008/09 Interim Results For the six months ended 31 December 2008 Corporate Presentation 18 March 2009 0 0 Disclaimer The information contained in this presentation
HOPEWELL HOLDINGS LIMITED ANNOUNCES FY 2018/19 INTERIM RESULTS
 Press Release HOPEWELL HOLDINGS LIMITED ANNOUNCES FY 2018/19 INTERIM RESULTS Highlights 1H FY19 (1 April to 30 September 2018) First financial year after the change of financial year end date from 30 June
Overview. 2Q10 Performance. Minor International Public Company Limited. Favorable Economic Indicators against Lingering Political Dispute
 August 11, 2010 Minor International Public Company Limited M A N A G E M E N T DI DISCUSSION S C U S S I O N A AN N D ANA ANA L Y S I I S Overview Favorable Economic Indicators against Lingering Political
Corporate Presentation
 Corporate Presentation 2010/11 Interim Results 22 February 2011 Bossini International Holdings Limited 堡獅龍國際集團有限公司 Disclaimer The information contained in this presentation is intended solely for your
For personal use only
 HELLOWORLD TRAVEL LIMITED RESULTS ANNOUNCEMENT Highlights for the year ended 30 June 2018 Total Transaction Value (TTV) growth of 3.5% to $6.1 billion, underpinned by strong air ticket sales volume growth.
Highlights from the Annual Results December 2007
 Highlights from the Annual Results December 2007 Disclaimer The information in this document is taken from the BAA 2007 Annual Results ( the Results ) which were published on 11 March 2008 and other public
Minor International Public Company Limited
 Minor International Public Company Limited Management Discussion & Analysis Financial Performance as of March 31, 2009 1Q09 Performance Minor International Pcl. ( MINT ) reported 1Q09 performance with
Investor Briefings First-Half FY2016 Financial Results
 Cedar Woods Properties Limited Investor Briefings First-Half FY2016 Financial Results 26 February 2016 Cedar Woods Presentation 2 Snapshot of Achievements in FY2016 Extensive portfolio of residential estates
For personal use only HILLS HOLDINGS HALF YEAR RESULTS FY2013
 HILLS HOLDINGS HALF YEAR RESULTS FY2013 TODAY KEY HIGHLIGHTS OUR FY13 FIRST HALF RESULTS GROUP PERFORMANACE FIRST HALF NPAT 1 $8.2M IN LINE WITH NOVEMBER AGM GUIDANCE. STRONG MANAGEMENT OF WORKING CAPITAL
Copa Holdings Reports Net Income of US$51.9 Million for the Fourth Quarter of 2008 and US$152.2 Million for Full Year 2008
 Copa Holdings Reports Net Income of US$51.9 Million for the Fourth Quarter of 2008 and US$152.2 Million for Full Year 2008 Panama City, Panama --- February 19, 2009. Copa Holdings, S.A. (NYSE: CPA), parent