Investment Highlights
|
|
|
- Julian Cook
- 5 years ago
- Views:
Transcription


1 Third Quarter 2014

2 Investment Highlights 1 Mexican airport portfolio positioned to take full advantage of global growth. 2 Diversified business model contributing to earnings resilience. 3 Well-defined strategy to capitalize favorable industry dynamic in traffic increases and profitability. 4 Successful implementation of commercial and diversification strategy. 5 Track record of operating and financial performance and solid capital structure. 6 Well-defined capital investment program to meet expected traffic growth. 7 Focus on total return with strong growth and dividend yield. 8 World-class, strong and experienced strategic shareholder. 9 Experienced management team with proven track record. 10 Transparent regulatory regime with clear parameters. 2


3 Company Overview

4 Passenger Traffic 9.2% 3Q14: 4.0 MPAX Metropolitan Regional Tourist Border Cities NH Hotel 4
5 4,000 3,500 3,000 2,500 2,000 1,500 1, A History of Successful Milestones Historical Performance Revenue figures in Ps. million ,480 1,334 1,137 1,204 19% 14% 16% 19% 86% 84% 81% 81% ,687 19% 81% ,459 2,144 1,897 1,988 1,896 24% 18% 19% 19% 23% 82% 81% 81% 77% 76% ,065 2,820 26% 24% 76% 74% ,311 26% 74% LTM 3 Adjusted EBITDA Margin 2 Aeronautical Revenues Non Aeronautical Revenues Passenger Traffic (million) 39% 42% 47% 50% 54% 56% 53% 51% 44% 51% 54% 55% 54% Note: From 2010 to 2013 figures expressed under IFRS; figures expressed under MFRS. 1 Represent the sum of aeronautical and non-aeronautical revenues (exclude construction). 2 Adjusted EBITDA Margin = Adjusted EBITDA / (Aeronautical + Non-Aeronautical Revenues). Adjusted EBITDA = Operating income + Depreciation and Amortization + Maintenance Provision. 3 As of September


6 Shareholders Mexico s leading construction and infrastructure operations company, with important operations in Latin America and Europe. AEROINVEST, 24.70% PUBLIC FLOAT, 58.60% 2 1 SETA 16.70% SETA- AEROINVEST, 12.40% Company that specializes in airport management around the world, as well as participation in specialized management. SETA-ADP, 4.30% 1 SETA: Servicios de Tecnología Aeroportuaria S.A. de C.V. 2 include 4,620,150 repurchased shares as of September,


7 Industry Outlook
8 Projected GDP GAGR Projected Domestic Passenger Traffic CAGR Positive Trends in Aeronautical Industry Air Passenger Transport per Capita Projected Domestic Passenger Traffic CAGR % 5.0% 3.2% 1 5.7% 5.7% % 2.1% 2.3% Mexico Argentina Brazil Canada Chile United States México United States Eastern Europe Canada Midle East South Africa Asia Central America Source: World Bank. Last information available of 2012 Source: Airbus. (Global Market Forecast ). 1 CAGR: Compound Annual Growth Rate. 8


9 Positive Outlook in Mexico Travelers in Mexico by Type of Transportation Airlines Fleet and Expansion Plans Economy bus Airplane Executive bus Train Sea Transportation Luxury bus 0.4% 1.5% 1.6% 1.9% 23.9% 70.7% Airplanes Orders/ additional Average Age Source: Ministry of Communication and Transportation 2012 Report. Source: DGAC, Airlines. August


10 Operational, Security, and Efficiency Leadership Increase Aeronautical Revenues Increase Non- Aeronautical Revenues OMA Strategy Develop Air Traffic and Connectivity Diversification Sustainable Company Improve Passenger Experience


11 Air Traffic Development Strategy


12 Develop Air Traffic and Connectivity +45 net new routes 9M % passenger growth 9M14 Air national connectivity Air international connectivity Air regional connectivity 12

13 Aeromexico s HUB in Monterrey +12 new direct routes + 213,000 additional passengers per year 13

14 Volaris Regional HUB in Monterrey +27 new routes + 466,000 additional passengers per year 14

15 Interjet s Regional HUB in Monterrey +9 new direct routes + 241,000 additional passengers per year 15

16 + 145,000 additional passengers +10 new routes New Airline: TAR 16

17 Commercial Strategy


18 Commercial key points Maximize commercial areas. Increase presence of international franchises and renowned local brands. Introduce Premium strategy focus and loyalty programs. Innovative and alternative advertising. 18


19 Parking lots improvements


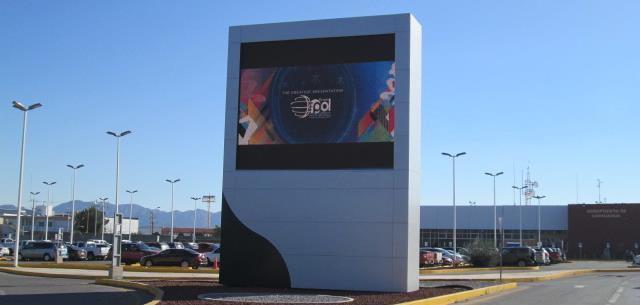


20 Innovative and alternative advertising Magnopantallas


21 OMA Premium


22 Diversification Strategy


23 Monterrey Airport Hotel Monterrey Airport Hotel Partnership: Grupo Hotelero TERMINAL A Santa Fe with15% stake and OMA 85%. Completition and opening 1Q rooms. Expected investment 2014 from OMA: Ps.162 million. ESTACIONAMIENTO GLORIETA ACCESO/SALIDA MOTOR LOBBY ESTACIONAMIENTO PUENTE CONEXION TERMINAL B 23


24 Industrial Park at Monterrey Airport Industrial Park at Monterrey Airport Joint venture: OMA 51%- VYNMSA 49%. 32 hectares. Urbanization works and first warehouse (5,000 m2). Expected investment 2014 from OMA: Ps. 24 million. 24

25 Operational and Sustainability Leadership


26 Sustainable Management Model Source: Company filings, GRI Report. 26
27 Results Track Record & & Track Results Record


28 Aeronautical Revenues 75% of total revenues excluding construction Aeronautical revenue per passenger Ps (Ps. Million) 3Q13 3Q14 % Var Domestic Passenger Charges International Passenger Charges Aeronautical Services, Regulated Leases and Access Rights Aeronautical Revenues % 28

 3Q13 3Q14 % Var Commercial Activities 105 112")

29 Non Aeronautical Revenues 25% of total revenues excluding construction Non Aeronautical revenue per passenger Ps (Ps. Million) 3Q13 3Q14 % Var Commercial Activities Diversification Activities % Complementary Activities Cost Recovery Non Aeronautical Revenues
 3Q13 3Q14 % Var Total Revenues 47 49 5.1 Operating Results 14 15 5.")
 bp Average Daily Room Rate (pesos) 1,637 1,738 6.")
30 Occupancy Rate NH Hotel Strong Results NH Hotel Results Mexico City Airport Hotel Market +1.9% vs 3Q13 (Ps. Million) 3Q13 3Q14 % Var Total Revenues Operating Results EBITDA EBITDA Margin % Occupancy Rate 85.5% 82.1% (343) bp Average Daily Room Rate (pesos) 1,637 1, RevPAR 1 : 1,427 1 Rev PAR: Revenue per available room. Average Rate 30
 Cost of Airport Services +GA 316 322 1.8 Major Maintenance Provision 41 42 2.8 Construction Cost 52 90 72.3 Concession Taxes 40 45 13.")
31 Operating Cost and Expenses Operating Cost and Expenses 6.9% Cost of airport services +GA up: 1.8% (Ps. million) 3Q13 3Q14 %Var Cost of Services General and Administrative Expenses (0.4) Cost of Airport Services +GA Major Maintenance Provision Construction Cost Concession Taxes Technical Assistance Fee Depreciation & Amortization Other Expenses (Revenues), Net (3) (24) Total Operating Cost and Expense


32 3Q14 Highlights (Million Passengers and Million Pesos) 3Q13 3Q14 %Var Passenger Traffic Aeronautical+Non Aeronautical Revenues Construction Revenues Total Revenues 869 1, Income from Operations Adjusted EBITDA Adjusted EBITDA Margin 54.3% 59.8% Consolidated Net Income MDP and strategic Investments c 1 OMA calculates Adjusted EBITDA, which further adjusts EBITDA for the maintenance provision, construction revenue, and construction expense. The Adjusted EBITDA margin is calculated against the sum of aeronautical and non-aeronautical revenues. 32

33 OMA s Strategy has resulted in Strong Traffic, Revenues and Adjusted EBITDA Growth Million of terminal passengers and Million of Pesos Diversification and Cost Control CAGR % CAGR % 3,500 3,000 2,500 2,000 1,500 1, Y-o-Y growth 14% 9% 12% 5% -5% 10% Financial Downturn 13% 15% 11% 3% 2% 0% 15% 9% 9% 9% 8% 5% 2,900 2,400 1,900 1, LTM NAR Total Passenger Non Aeronautical Revenues (NAR) has increased faster than passenger traffic as a result of commercial initiatives and diversification projects LTM Aeronautical+Non Aeronautical Revenues Operating Cost 1 Operating costs excludes construction costs, maintenance provision, and other expenses (income). 2 As of September
34 Focus on Generating Value 1,400 1,200 1, Historical Dividend / Capital Reimbursement Million Pesos 1,200 1,200 1,600 1,400 1,200 1,000 Percentage Dividend Yield and Payout Ratio Título del gráfico Payout Ratio Dividend 1 Yield 1 Note: 2012, 2011 and 2010 figures expressed under IFRS; figures expressed under MFRS. 1 Dividend per share divided by year end closing share price. Include capital reimbursements. Denotes declared dividends for the results in the stated period different from the cash flow in the period. 34

35 Focus on Generating Value ROA/ROE EPS 25.0 Percentage ROA ROE Pesos LTM 1 As of September LTM 35 1

36 Balance Sheet Cash and Equivalents Other Current Assets Land, Buildings, Machinery and Equipment 21.3% 6.2% 18.0% Current Portion of Long Term Debt 0.3% Long Term Debt Major Maintenance Provision 4.9% Other Liabilities 38.3% 8.9% Million Pesos Debt Maturity Profile 3,000 Investment in Airport Concessions Other Assets 3.9% 50.6% Assets Stockholders' Equity % Liabilities and Stockholder's Equity 1, año 2 años 3 años 4 años 5 años + USD Debt OMA13 OMA14 36

37 MDP 1,2 Million Pesos Additional Recognition of Land Acquired Federal Government agreed to recognize land reserve for Ps. 487 million acquired for Culiacan and Monterrey airports as improvement in concession assets MDP Investment in Land Recognized 1 Pesos of December 31, MDP: Master Development Plan. 37

38 2014E (Previous) 2014E (Revised) Passenger Traffic Growth 6%-8% 8%-10% Aeronautical and Non Aeronautical Revenue Growth 9%-11% 10%-12% Adjusted EBITDA 52%-54% 54%-56% Outlook MDP Investments 850-1,100 mdp OMA is providing this outlook based on internal estimates. A number of factors could have a significant effect on the estimates of passenger traffic, revenue growth, Adjusted EBITDA, and Capex. These include changes in airline expansion plans, ticket prices and other factors affecting traffic volumes, the evolution of commercial and diversification projects, and economic conditions, among others. OMA can provide no assurance that the Company will achieve these results.. 38


39 Results & Monterrey Track Record
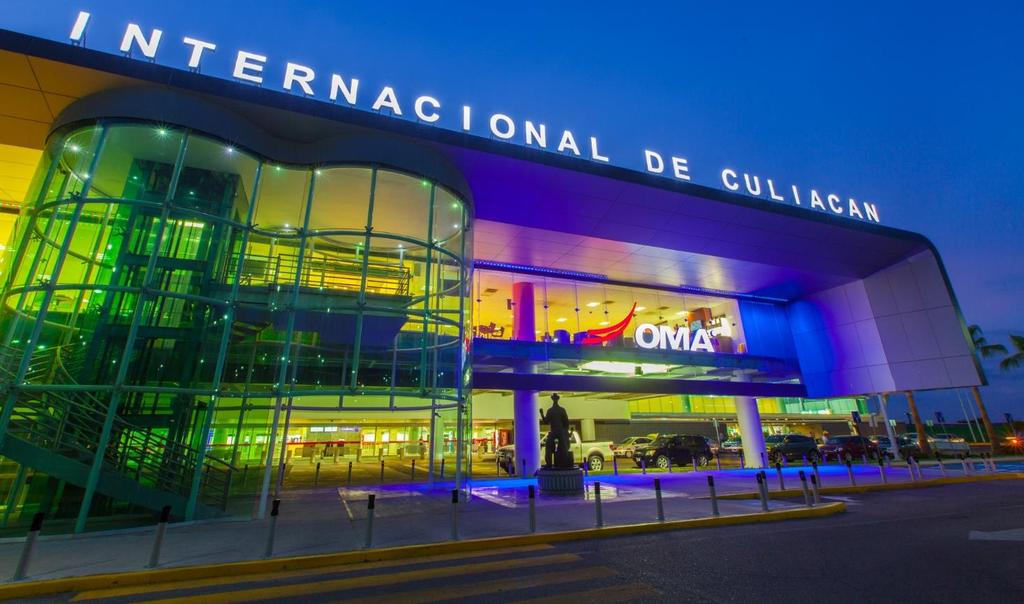

40 Culiacán
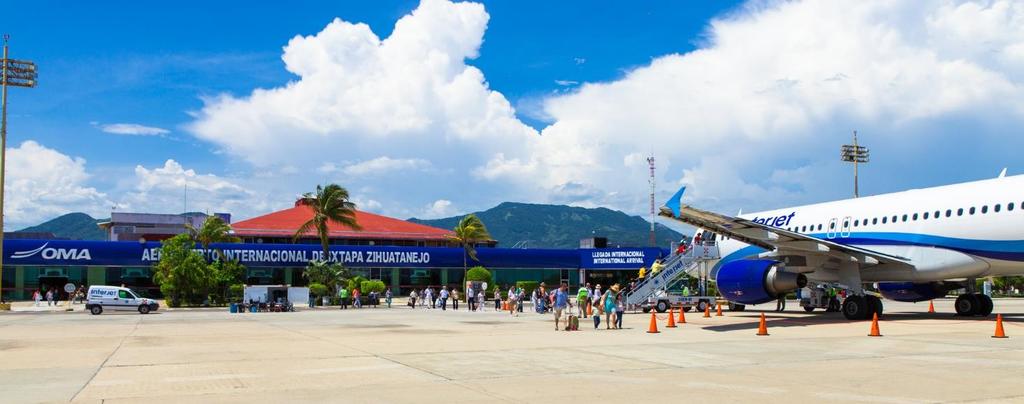
41 Zihuatanejo


42 San Luis Potosí


43 Acapulco

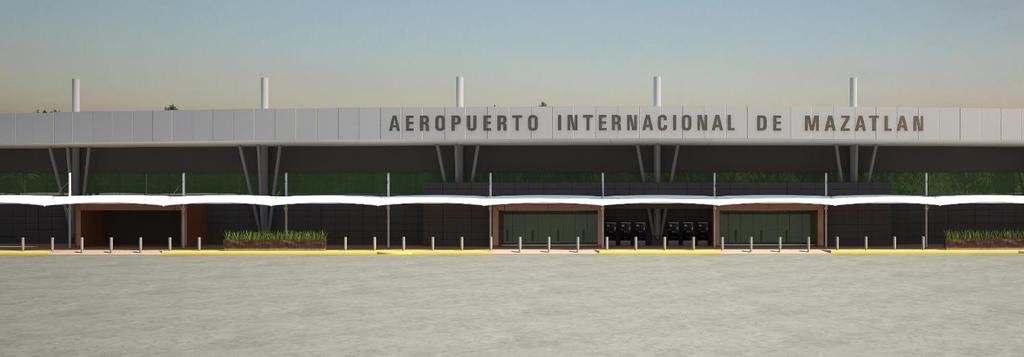

44 Mazatlán
Investment Highlights
 Second Quarter 2014 Investment Highlights 1 Mexican airport portfolio positioned to take full advantage of global growth. 2 Diversified business model contributing to earnings resilience. 3 Well-defined
Third Quarter 2015 Results
 Third Quarter 2015 Results Investment Highlights Positioned to take full advantage of global growth Diversified business model Well-defined strategy to capitalize on favorable industry dynamic Successful
First Quarter Grupo Aeroportuario del Centro Norte S.A.B. de C.V.
 First Quarter 204 Grupo Aeroportuario del Centro Norte S.A.B. de C.V. Investment Highlights Mexican airport portfolio positioned to take full advantage of global growth. 2 Diversified business model contributing
First Quarter 2016 Results
 First Quarter 2016 Results This presentation may contain forward-looking information and statements. Forward-looking statements are statements that are not historical facts. These statements are only predictions
INVESTOR PRESENTATION FOURTH QUARTER 2017 RESULTS
 INVESTOR PRESENTATION FOURTH QUARTER 2017 RESULTS This presentation may contain forward-looking information and statements. Forward-looking statements are statements that are not historical facts. These
Grupo Aeroportuario del Centro Norte SAB de CV SECOND QUARTER 2018 RESULTS
 Grupo Aeroportuario del Centro Norte SAB de CV SECOND QUARTER 2018 RESULTS This presentation may contain forward-looking information and statements. Forward-looking statements are statements that are not
INVESTOR PRESENTATION THIRD QUARTER 2017 RESULTS
 INVESTOR PRESENTATION THIRD QUARTER 2017 RESULTS This presentation may contain forward-looking information and statements. Forward-looking statements are statements that are not historical facts. These
INVESTOR PRESENTATION SECOND QUARTER 2017 RESULTS
 INVESTOR PRESENTATION SECOND QUARTER 2017 RESULTS This presentation may contain forward-looking information and statements. Forward-looking statements are statements that are not historical facts. These
First Quarter 2010 Earnings Report
 First Quarter 2010 Earnings Report April 23, 2010 Mexican airport operator Grupo Aeroportuario del Centro Norte, S.A.B. de C.V., known as OMA (NASDAQ: OMAB; BMV: OMA), reported its unaudited, preliminary
UBS Latin American New Opportunities Conference. June 11 th -12 th, 2007
 UBS Latin American New Opportunities Conference June 11 th -12 th, 2007 Company Overview OMA operates a diversified portfolio of 13 airports distributed throughout Northern and Central Mexico and is diversified
Third Quarter 2010 Earnings Report
 Third Quarter 2010 Earnings Report October 19, 2010 Mexican airport operator Grupo Aeroportuario del Centro Norte, S.A.B. de C.V., known as OMA (NASDAQ: OMAB; BMV: OMA), reported its unaudited, preliminary
FIRST QUARTER RESULTS 2017
 FIRST QUARTER RESULTS 2017 KEY RESULTS In the 1Q17 Interjet total revenues added $4,421.5 million pesos that represented an increase of 14.8% over the income generated in the 1Q16. In the 1Q17, operating
FOURTH QUARTER RESULTS 2017
 FOURTH QUARTER RESULTS 2017 KEY RESULTS In the 4Q17 Interjet total revenues added $5,824.8 million pesos that represented an increase of 10.8% over the revenue generated in the 4Q16. In the 4Q17, operating
FIRST QUARTER RESULTS 2016
 FIRST QUARTER RESULTS 2016 KEY RESULTS In 1Q16 Interjet total revenues added $3,850.8 million pesos that represented an increase of 21.9% over the income generated in the 1Q15. In 1Q16 total passengers
THIRD QUARTER RESULTS 2017
 THIRD QUARTER RESULTS 2017 KEY RESULTS In the 3Q17 Interjet total revenues added $5,835.1 million pesos that represented an increase of 22.0% over the revenue generated in the 3Q16. In the 3Q17, operating
THIRD QUARTER AND NINE MONTHS OF 2014 KEY RESULTS
 THIRD QUARTER AND NINE MONTHS OF 2014 KEY RESULTS In 3Q14 INTERJET total revenues were $ 3,643.4 million, representing an increase of 9.9% on revenues generated in the 3Q13. Accumulated 9M14 INTERJET total
THIRD QUARTER RESULTS 2018
 THIRD QUARTER RESULTS 2018 KEY RESULTS In the 3Q18 Interjet total revenues added $ 6,244.8 million pesos that represented an increase of 7.0% over the revenue generated in the 3Q17. In the 3Q18, operating
OMA Announces Fourth Quarter 2011 Earnings
 OMA Announces Fourth Quarter 2011 Earnings Monterrey, Mexico, February 23, 2012 -Mexican airport operator Grupo Aeroportuario del Centro Norte, S.A.B. de C.V., known as OMA (NASDAQ: OMAB; BMV: OMA), reported
UBS 14 th Global Emerging Markets Conference. New York, November 2016
 UBS 14 th Global Emerging Markets Conference New York, November 2016 This presentation may include forward-looking comments regarding the Company s business outlook and anticipated financial and operating
Santander Conference Acapulco. January 2007
 Santander Conference Acapulco January 2007 Post-IPO Shareholder Ownership IPO on November 29, 2006; 47% free float Aeroinvest* 74.5% 25.5% SETA Public Float B Shares (Mexico) 50% ADSs 50% 36.0%* 16.7%
Results 1 st Quarter 2005
 Grupo Posadas, s, S.A. de C.V. & Subsidiaries April 28, 2005 Results 1 st Quarter 2005 Total revenues increase 13% in the quarter Higher demand in urban hotels Better results in coastal hotels 3 openings
Deutsche Bank 16 th Annual Global Emerging Markets. New York, September 2017
 Deutsche Bank 16 th Annual Global Emerging Markets New York, September 2017 This presentation may include forward-looking comments regarding the Company s business outlook and anticipated financial and
Santander 22 nd Annual Latin American Conference. Cancun, January 2018
 Santander 22 nd Annual Latin American Conference Cancun, January 2018 This presentation may include forward-looking comments regarding the Company s business outlook and anticipated financial and operating
Corporate Presentation April 2018
 Corporate Presentation April 2018 1 Grupo Hotelero Santa Fe Ticker: HOTEL (BMV) Financial Highlights (LTM March 31, 2018 ) Revenue: Ps. 1,769 million (US 96 million) EBITDA: Ps. 603 million (US 33 million)
SECOND QUARTER RESULTS 2018
 SECOND QUARTER RESULTS 2018 KEY RESULTS In the 2Q18 Interjet total revenues added $ 5,781.9 million pesos that represented an increase of 9.6% over the revenue generated in the 2Q17. In the 2Q18, operating
Corporate Presentation April 2018
 Corporate Presentation April 2018 1 Grupo Hotelero Santa Fe Ticker: HOTEL (BMV) Financial Highlights (LTM June 30, 2018 ) Revenue: Ps. 1,873 million (US 94 million) EBITDA: Ps. 627 million (US 32 million)
Corporate Presentation February 2018 NOMBRE DE LA PRESENTACIÓN
 Corporate Presentation February 2018 NOMBRE DE LA PRESENTACIÓN 1 1 Grupo Hotelero Santa Fe Ticker: HOTEL (BMV) 2017 Financial Highlights Revenue: Ps. 1,582 million (US 80 million) EBITDA: Ps. 528 million
Bank of America Merrill Lynch 2018 Emerging Markets Corporate Credit Conference. Miami, May 2018
 Bank of America Merrill Lynch 2018 Emerging Markets Corporate Credit Conference Miami, May 2018 This presentation may include forward-looking comments regarding the Company s business outlook and anticipated
Results 2 nd Quarter 2004
 Grupo Posadas, s, S.A. de C.V. & Subsidiaries July 28 th, 2004 Results 2 nd Quarter 2004 Cosolidated revenues increased 11% EBITDA increased 15% Recovery on REVPAR 3 new openings in the 2Q04, which sum
J.P. Morgan 2019 Global Emerging Markets Corporate Conference. Miami, February 2019
 J.P. Morgan 2019 Global Emerging Markets Corporate Conference Miami, February 2019 This presentation may include forward-looking comments regarding the Company s business outlook and anticipated financial
FIRST QUARTER
 FIRST QUARTER 2007 1 WELCOME TO REZIDOR one of the fastest growing hotel companies in the world 300 250 200 150 100 FAST TRACK GROWTH FRESH & DYNAMIC MULTI-BRAND PORTFOLIO BRAND SEGMENT HOTELS ROOMS Upscale
Results 3 rd Quarter 2003
 Grupo Posadas, s, S.A. de C.V. & Subsidiaries October 28 th, 2003 Results 3 rd Quarter 2003 Total revenue and EBITDA increased by 10 and 12 % respectively Coastal hotels continue to improve, rates on urban
Bank of America Merrill Lynch Emerging Markets Corporate Conference. Miami, June 2016
 Bank of America Merrill Lynch Emerging Markets Corporate Conference Miami, June 2016 This presentation may include forward-looking comments regarding the Company s business outlook and anticipated financial
Volaris Reports Strong First Quarter 2015: 32% Adjusted EBITDAR Margin, 9% Operating Margin
 Volaris Reports Strong First Quarter 2015: 32% Adjusted EBITDAR Margin, 9% Operating Margin Mexico City, Mexico, April 22, 2015 Volaris* (NYSE: VLRS and BMV: VOLAR), the ultra-low-cost airline serving
OPERATING AND FINANCIAL HIGHLIGHTS. Subsequent Events
 Copa Holdings Reports Financial Results for the First Quarter of 2016 Excluding special items, adjusted net income came in at US$69.9 million, or EPS of US$1.66 per share Panama City, Panama --- May 5,
TOKYO MEETINGS NOVEMBER 2016
 TOKYO MEETINGS NOVEMBER 2016 CONTENTS AEROMEXICO AT A GLANCE BUILDING A STRONG AND FLEXIBLE AIRLINE STRATEGIC INITIATIVES 2 AEROMEXICO: MEXICO S PREMIUM NETWORK CARRIER. Mexico s only full service carrier,
OPERATING AND FINANCIAL HIGHLIGHTS SUBSEQUENT EVENTS
 Copa Holdings Reports Net Income of US$6.2 Million and EPS of US$0.14 for the Third Quarter of 2015 Excluding special items, adjusted net income came in at $37.4 million, or EPS of $0.85 per share Panama
Air China Limited Interim Results. August Under IFRS
 Air China Limited 21 Interim Results Under IFRS August 21 1 Agenda 21 Interim Results Overview Business Overview Financial Overview Outlook 2 2 2 21 Interim Results 3 21 Interim Results Overview 4 4 4
Corporate Presentation February 2019
 Corporate Presentation February 2019 1 Grupo Hotelero Santa Fe Ticker: HOTEL (BMV) Financial Highlights (LTM Dec 31, 2018 ) Revenue: Ps. 2,064 million (US 105 million) EBITDA: Ps. 676 million (US 34 million)
FIRST QUARTER 2014 RESULTS
 FIRST QUARTER 2014 RESULTS Mexico City, April 29, 2014 - Grupo Aeromexico S.A.B de C.V. ( Aeromexico ) (BMV: AEROMEX), the largest airline in Mexico, today reported its unaudited consolidated results for
Results 1 st Quarter 2004
 Grupo Posadas, s, S.A. de C.V. & Subsidiaries April 30 th, 2004 Results 1 st Quarter 2004 Consolidated revenue decreased 1.3%. Revenew and Conectum progress is on track in order to improve the profitability
MGM Resorts International Reports Second Quarter Financial Results
 NEWS RELEASE MGM Resorts International Reports Second Quarter Financial Results 8/5/2014 Consolidated Adjusted EBITDA Increased 8%, Led By 10% Growth In Wholly Owned Domestic Resorts MGM China Declares
MARRIOTT INTERNATIONAL, INC. PRESS RELEASE SCHEDULES QUARTER 4, 2016 TABLE OF CONTENTS
 PRESS RELEASE SCHEDULES QUARTER 4, 06 TABLE OF CONTENTS Consolidated Statements of Income - As Reported A- Consolidated Statements of Income - Fourth Quarter Adjusted 06 Compared to Combined 05 A-3 Consolidated
OPERATING AND FINANCIAL HIGHLIGHTS SUBSEQUENT EVENTS
 Copa Holdings Reports Financial Results for the Third Quarter of 2016 Excluding special items, adjusted net income came in at $55.3 million, or adjusted EPS of $1.30 per share Panama City, Panama --- November
Thank you for participating in the financial results for fiscal 2014.
 Thank you for participating in the financial results for fiscal 2014. ANA HOLDINGS strongly believes that safety is the most important principle of our air transportation business. The expansion of slots
Earnings Report 1 st Quarter 2016 Grupo Viva Aerobus
 Earnings Report 1 st Quarter 2016 Grupo Viva Aerobus Grupo Viva Aerobus announces results for the first quarter of 2016 Mexico City, Mexico, April 29, 2016- Grupo Viva Aerobus S.A. de C.V. ( Grupo Viva
ASUR 2Q11 PASSENGER TRAFFIC UP 2.89% YOY
 In Mexico ASUR Lic. Adolfo Castro (52) 5552-84-04-08 acastro@asur.com.mx In the U.S. Breakstone Group Susan Borinelli (646) 330-5907 sborinelli@breakstone-group.com ASUR 2Q11 PASSENGER TRAFFIC UP 2.89%
Enhancing air travel options through a strong focus on profitability and innovation. 4 th Quarter 2017 Earnings Report Grupo Viva Aerobus
 4 th Quarter 2017 Earnings Report Grupo Viva Aerobus Enhancing air travel options through a strong focus on profitability and innovation 1 VIVA AEROBUS REPORTS GROWTH OF 17.9% IN TOTAL OPERATING REVENUE
OPERATING AND FINANCIAL HIGHLIGHTS. Subsequent Events
 Copa Holdings Reports Net Income of US$113.1 Million and EPS of US$2.57 for the First Quarter of 2015 Excluding special items, adjusted net income came in at US$106.0 million, or EPS of US$2.41 per share
OPERATING AND FINANCIAL HIGHLIGHTS
 Copa Holdings Reports Financial Results for the Fourth Quarter of 2015 Excluding special items, adjusted net income came in at $31.7 million, or EPS of $0.73 per share Panama City, Panama --- February
Agenda. I. The Mexican Market. II. What Next in 2012? Financial Results. IV. Key Initiatives (Medium and Long Term)
") Agenda I. The Mexican Market II. What Next in 2012? III. Financial Results IV. Key Initiatives (Medium and Long Term) Agenda The Mexican Market Mexico: A Growing Market Mexican equity markets are outperforming,
Agenda I. The Mexican Market II. What Next in 2012? III. Financial Results IV. Key Initiatives (Medium and Long Term) Agenda The Mexican Market Mexico: A Growing Market Mexican equity markets are outperforming,
Copa Holdings Reports Net Income of $49.9 million and EPS of $1.18 for the Second Quarter of 2018
 Copa Holdings Reports Net Income of $49.9 million and EPS of $1.18 for the Second Quarter of 2018 Panama City, Panama --- Aug 8, 2018. Copa Holdings, S.A. (NYSE: CPA), today announced financial results
Management Presentation. March 2016
 Management Presentation March 2016 Forward looking statements This presentation as well as oral statements made by officers or directors of Allegiant Travel Company, its advisors and affiliates (collectively
OPERATING AND FINANCIAL HIGHLIGHTS. Subsequent Events
 Copa Holdings Reports Net Income of $103.8 million and EPS of $2.45 for the Third Quarter of 2017 Excluding special items, adjusted net income came in at $100.8 million, or EPS of $2.38 per share Panama
Conference Call 1Q14 Results. Investor Relations May 15, 2014
 Conference Call Results Investor Relations May 15, 2014 1 Highlights 2 Highlights Net revenues of R$2.5 billion in the quarter, an increase of 20% or R$411 million quarter-over-quarter; EBIT totaled R$144
Operative & Financial Results:
 Operative & Financial Results: F i r s t Q u a r t e r 2 0 1 4 Grupo Posadas, S.A.B. de C.V. & Subsidiaries Mexico City April 29, 2014 Information presented with respect to the same quarter of last year
Management Presentation. May 2013
 Management Presentation May 2013 Forward looking statements This presentation as well as oral statements made by officers or directors of Allegiant Travel Company, its advisors and affiliates (collectively
OPERATING AND FINANCIAL HIGHLIGHTS
 Copa Holdings Reports Net Income of US$32.0 Million and EPS of US$0.72 for the Second Quarter of 2012 Excluding special items, adjusted net income came in at $58.6 million, or EPS of $1.32 per share Panama
Grupo Hotelero Santa Fe Reports Increase of 36% in Total Revenue and 46% EBITDA for 1Q16
 Grupo Hotelero Santa Fe Reports Increase of 36% in Total Revenue and 46% EBITDA for 1Q16 Mexico City, April 21, 2016 Grupo Hotelero Santa Fe S.A.B. de C.V. (BMV: HOTEL) ( HOTEL or the Company ), announced
Q Fast growth continued, Comparable operating result at record high levels Pekka Vauramo
 2018 Fast growth continued, Comparable operating result at record high levels 17.7.2018 Pekka Vauramo 2 A good - Comparable operating result increased to new seasonal high Revenue Comparable operating
Investor Relations Presentation. March 2018
 Investor Relations Presentation March 2018 Aeromexico: Mexico s premium revenue carrier Aeromexico Delta relationship: A new chapter Building a strong and flexible airline 2 Aeromexico s business model
ABX HOLDINGS, INC. Shareholders Meeting. May 13, 2008
 Shareholders Meeting May 13, 2008 1 1 1 Safe Harbor Statement Except for historical information contained herein, the matters discussed in this presentation contain forward-looking statements that involve
Copa Holdings Reports Record Earnings of US$41.8 Million for 4Q06 and US$134.2 Million for Full Year 2006
 Copa Holdings Reports Record Earnings of US$41.8 Million for 4Q06 and US$134.2 Million for Full Year 2006 Panama City, Panama --- March 7, 2007. Copa Holdings, S.A. (NYSE: CPA), parent company of Copa
CONTACT: Investor Relations Corporate Communications
 NEWS RELEASE CONTACT: Investor Relations Corporate Communications 435.634.3200 435.634.3553 Investor.relations@skywest.com corporate.communications@skywest.com SkyWest, Inc. Announces Second Quarter 2017
Fourth Quarter and Full Year 2011 Results Presentation. February 1, 2012
 Fourth Quarter and Full Year 2011 Results Presentation February 1, 2012 This presentation may include forward-looking comments regarding the Company s business outlook and anticipated financial and operating
INVESTOR PRESENTATION. Imperial Capital Global Opportunities Conference September 2015
 INVESTOR PRESENTATION Imperial Capital Global Opportunities Conference September 2015 Forward-looking Statements This presentation contains forward-looking statements within the meaning of the Private
J.P. Morgan 9 th Annual Global Emerging Markets Corporate Conference. Miami, February 2018
 J.P. Morgan 9 th Annual Global Emerging Markets Corporate Conference Miami, February 2018 This presentation may include forward-looking comments regarding the Company s business outlook and anticipated
Grupo Viva Aerobus announces results for the third quarter of 2016
 Earnings Earnings Report Report 3 rd rd Quarter Quarter 2016 2016 Grupo Grupo Viva Viva Aerobus Aerobus Grupo Viva Aerobus announces results for the third quarter of 2016 Mexico City, Mexico, October 27,
OPERATING AND FINANCIAL HIGHLIGHTS
 Copa Holdings Reports Financial Results for the Fourth Quarter of 2018 Excluding special items, adjusted net profit came in at $44.0 million, or Adjusted EPS of $1.04 Panama City, Panama --- February 13,
INVESTOR PRESENTATION. May 2015
 INVESTOR PRESENTATION May 2015 Forward-looking Statements This presentation contains forward-looking statements within the meaning of the Private Securities Litigation Reform Act of 1995 that reflect the
ABX. Holdings, Inc. BB&T Transportation Conference. February 2008
 ABX Holdings, Inc. BB&T Transportation Conference February 2008 1 Safe Harbor Statement Except for historical information contained herein, the matters discussed in this presentation contain forward-looking
OMA announces Third Quarter 2017 Operational and Financial Results
 OMA announces Third Quarter 2017 Operational and Financial Results Monterrey, Mexico, October 17, 2017 Mexican airport operator Grupo Aeroportuario del Centro Norte, S.A.B. de C.V., known as OMA (NASDAQ:
2012 Result. Mika Vehviläinen CEO
 2012 Result Mika Vehviläinen CEO 1 Agenda Market environment in Q4 Business performance and strategy execution Outlook Financials 2 Market Environment According to IATA, Global air travel continues to
Record Result. 2006/07 Full Year Results Investor Presentation. Moved on successfully following bid. Profit before tax % to $1,032 million
 2006/07 Full Year Results Investor Presentation August 16 2007 Record Result Moved on successfully following bid Profit before tax + 53.8% to $1,032 million Group returning above Cost of Capital 2 Key
OPERATING AND FINANCIAL HIGHLIGHTS
 Copa Holdings Reports Net Income of US$18.6 Million and EPS of US$0.42 for the Second Quarter of 2010 Excluding special items, adjusted net income came in at $26.3 million, or $0.60 per share Panama City,
Grupo Hotelero Santa Fe Reports 24% Increase in Total Revenue and 28% in EBITDA for 2Q16
 Grupo Hotelero Santa Fe Reports 24% Increase in Total Revenue and 28% in EBITDA for 2Q16 Mexico City, July 21, 2016 Grupo Hotelero Santa Fe S.A.B. de C.V. (BMV: HOTEL) ( HOTEL or the Company ), announced
Enhancing air travel options through a strong focus on profitability and innovation. 1 rst Quarter 2018 Earnings Report Grupo Viva Aerobus
 1 rst Quarter 2018 Earnings Report Grupo Viva Aerobus Enhancing air travel options through a strong focus on profitability and innovation 1 VIVA AEROBUS REPORTS GROWTH OF 49.2% IN REVENUE AND 83.2% IN
Scotia Capital Transportation & Aerospace Conference. June 5, 2007
 Scotia Capital Transportation & Aerospace Conference June 5, 2007 1 2 Changing the Game Changing the Game Canada s #1 domestic, trans-border and international airline Strong brand recognition Innovative
Air China Limited Annual Results. March Under IFRS
 Air China Limited 21 Annual Results Under IFRS March 211 Agenda Part 1 Highlights Part 2 Business Overview Part 3 Financial Overview Part 4 Outlook 2 Part 1 Highlights Steady Economic Growth; Asia Pacific
HOTEL reports 49% and 50% increases in Total Revenues and EBITDA respectively for 1Q18
 HOTEL reports 49% and 50% increases in Total Revenues and EBITDA respectively for 1Q18 Mexico City, April 19 th, 2018 Grupo Hotelero Santa Fe S.A.B. de C.V. (BMV: HOTEL) ( HOTEL or the Company ), announced
5. Economic performance
 AT 1 1 Economic performance STOCK MAINTAINING LEADERSHIP EFFICIENCY AND COMPETITIVENESS Income Costs INVESTMENT GENERATING CAPACITY AND VALUE AT 1 1 Profitability CHALLENGES AIMS 2018 PROGRESS IN SDG The
PRESS RELEASE Financial Results. Rising passenger traffic at 12.5m Exceeding 1bn in consolidated revenue
 PRESS RELEASE 2016 Financial Results Rising passenger traffic at 12.5m Exceeding 1bn in consolidated revenue Kifissia, 23 March 2017 AEGEAN reports full year 2016 results with consolidated revenue at 1,020m,
01 Amadeus at a glance
 01 Amadeus at a glance 7 Amadeus Annual Report 2011 1.1 Company s origins and development Most people associate the birth of electronic commerce distribution with the arrival of the internet. In fact,
Marriott International Reports Third Quarter 2016 Results
 November 7, 2016 Marriott International Reports Third 2016 Results BETHESDA, Md., Nov. 7, 2016 /PRNewswire/ -- HIGHLIGHTS Marriott International's acquisition of Starwood Hotels & Resorts Worldwide closed
Operational and Financial Results:
 Operatiol and Fincial Results: T h i r d Q u a r t e r 2 0 1 2 Grupo Posadas, S.A.B. de C.V. & Subsidiaries Mexico City, October 26, 2012 Information presented with respect to the same quarter of last
GATWICK AIRPORT JOINS VINCI AIRPORTS December 2018
 GATWICK AIRPORT JOINS VINCI AIRPORTS December 2018 Asset presentation Gatwick is the 2 nd largest airport in the UK and the 8 th busiest in Europe with 46 mpax Key features 46 mpaxin FY18, in the wealthiest
NORWEGIAN AIR SHUTTLE ASA QUARTERLY REPORT SECOND QUARTER 2006 [This document is a translation from the original Norwegian version]
![NORWEGIAN AIR SHUTTLE ASA QUARTERLY REPORT SECOND QUARTER 2006 [This document is a translation from the original Norwegian version]](/thumbs/74/71229964.jpg "NORWEGIAN AIR SHUTTLE ASA QUARTERLY REPORT SECOND QUARTER 2006 [This document is a translation from the original Norwegian version]") NORWEGIAN AIR SHUTTLE ASA QUARTERLY REPORT SECOND QUARTER 2006 SECOND QUARTER IN BRIEF had earnings before tax of MNOK 24.8 (20.6) in the second quarter. The operating revenue increased by 44 % this quarter,
NORWEGIAN AIR SHUTTLE ASA QUARTERLY REPORT SECOND QUARTER 2006 SECOND QUARTER IN BRIEF had earnings before tax of MNOK 24.8 (20.6) in the second quarter. The operating revenue increased by 44 % this quarter,
LAN AIRLINES REPORTS NET INCOME OF US$88.3 MILLION FOR THE FIRST QUARTER OF 2010
 FOR IMMEDIATE RELEASE LAN AIRLINES REPORTS NET INCOME OF US$88.3 MILLION FOR THE FIRST QUARTER OF 2010 Santiago, Chile, April 27, 2010 LAN Airlines S.A. (NYSE: LFL), one of Latin America s leading passenger
Joshua Koshy, Executive Vice President & CFO. Changing the Game
 Joshua Koshy, Executive Vice President & CFO Changing the Game Changing the Game Canada s #1 domestic, trans-border and international airline Strong brand recognition Innovative revenue model driving customer
Copa Holdings Reports Fourth Quarter and Full Year 2007 Results
 Copa Holdings Reports Fourth Quarter and Full Year 2007 Results Panama City, Panama --- February 21, 2008. Copa Holdings, S.A. (NYSE: CPA), parent company of Copa Airlines and Aero Republica, today announced
AIR CANADA REPORTS 2010 THIRD QUARTER RESULTS; Operating Income improved $259 million or 381 per cent from previous year s quarter
 AIR CANADA REPORTS 2010 THIRD QUARTER RESULTS; Operating Income improved $259 million or 381 per cent from previous year s quarter MONTRÉAL, November 4, 2010 Air Canada today reported operating income
Southwest Airlines Co. (NYSE: LUV) ONE YEAR PRICE RANGE : $ $73.62 LAST PRICE: $ ANALYST RATING: Long. VALUATION DATE: July 13, 2017
 ONE YEAR PRICE RANGE : $ $73.62 LAST PRICE: $ ANALYST RATING: Long. VALUATION DATE: July 13, 2017") Southwest Airlines Co. (NYSE: LUV) ONE YEAR PRICE RANGE : $69.66 - $73.62 LAST PRICE: $62.08 ANALYST RATING: Long VALUATION DATE: July 13, 2017 NEXT EARNINGS DATE: July 27, 2017 Investment Thesis: Dominant
Southwest Airlines Co. (NYSE: LUV) ONE YEAR PRICE RANGE : $69.66 - $73.62 LAST PRICE: $62.08 ANALYST RATING: Long VALUATION DATE: July 13, 2017 NEXT EARNINGS DATE: July 27, 2017 Investment Thesis: Dominant
Enhancing air travel options through a strong focus on profitability and innovation innovation
 2 nd Quarter 2018 Earnings Report Grupo Viva Aerobus Enhancing air travel options through a strong focus on profitability and innovation innovation 1 VIVA AEROBUS REPORTS GROWTH OF 32.3% IN EBITDAR AND
FibraHotel ended the quarter with 37 hotels and 5,132 rooms, with 34 hotels in operation (4,798 rooms) and 3 hotels under development (334 rooms).
 and 3 hotels under development (334 rooms).") FibraHotel ( FibraHotel ), the first real estate investment trust specialized in urban business-class hotels in Mexico, announces its financial results and distribution corresponding to the second quarter
FibraHotel ( FibraHotel ), the first real estate investment trust specialized in urban business-class hotels in Mexico, announces its financial results and distribution corresponding to the second quarter
ASUR 2Q15 PASSENGER TRAFFIC UP 14.27% YOY
 In Mexico ASUR Lic. Adolfo Castro (52) 5552-84-04-08 acastro@asur.com.mx In the U.S. MBS Value Partners Susan Borinelli (646) 330-5907 susan.borinelli@mbsvalue.com For Immediate Release ASUR 2Q15 PASSENGER
Interim Business Report 2017
 April 1, 2017 through September 30, 2017 November 22, 2017 Contents SECTION 1 01 Consolidated Statement of Income 02 Factors Leading to Difference in Consolidated Ordinary Income Compared With Same Period
ALAFCO Aviation Lease And Finance Co. KSCC
 Information MEMORANDUM ALAFCO Aviation Lease And Finance Co. KSCC Mr. Ahmad A. Alzabin Vice Chairman and Chief Executive Officer The 6th Forum for Listed Companies and Analysts Kuwait 20 May 2014 Core
Interim Report 3m Bilfinger Berger SE, Mannheim May 10, 2012 Joachim Müller, CFO
 Interim Report 3m 2012 Bilfinger Berger SE, Mannheim May 10, 2012 Joachim Müller, CFO Bilfinger Berger SE Interim report 3m 2012 May 10, 2012 Page 1 3m 2012: Highlights Growth in output volume and orders
Copa Holdings Reports Net Income of US$113.9 Million for the Fourth Quarter of 2013
 Copa Holdings Reports Net Income of US$113.9 Million for the Fourth Quarter of 2013 Panama City, Panama --- February 12, 2014. Copa Holdings, S.A. (NYSE: CPA), today announced financial results for the
Ramsay Health Care Limited Results Briefing Half Year ended 31 December 2018
 Ramsay Health Care Limited Results Briefing Half Year ended 31 December 2018 Craig McNally, Group Managing Director & Bruce Soden, Group Finance Director 28 February 2019 ramsayhealth.com Agenda Group