SAS Group Asia Tour Financial Hearing Presentation May 14, 2012
|
|
|
- David Ryan
- 5 years ago
- Views:
Transcription


1 SAS Group Asia Tour Financial Hearing Presentation May 14,


2 This is the SAS Group 128 destinations 27,2 million passengers 28 new routes to be launched ,085 daily flights Revenues 2011, MSEK 41, destinationer 2


3 Improved customer position New advantage achieved as Europe s most punctual airline Europe s most punctual airline three years in a row 2009, 2010 and 2011 World s most punctual airline in July and August 2011 All-time high perceived punctuality among customers Innovative and award winning onground solutions that saves passengers time flights on time in 2011 (88.9%) (Departure within 15 min) Innovative and time-saving solutions SAS Fast Track World class punctuality 3
 Oslo-Stockholm SAS 18 Largest competitor 10 Copenhagen-Stockholm Europe SAS Star Alliance: 980,000 Star")

4 The SAS Group is the Nordic s leading airline group - increasing presence in Asia Key advantage in corporate accounts Introduction of new regional partner concept Codeshare ANA from May 2011 Closer cooperation with Singapore Airlines Launch of Copenhagen-Shanghai (March 2012) Oslo-Stockholm SAS 18 Largest competitor 10 Copenhagen-Stockholm Europe SAS Star Alliance: 980,000 Star Alliance SAS: 1,140,000 Asia SAS Star Alliance: 70,000 Star Alliance SAS: 120,000 SAS 20 North America SAS Star Alliance: 290,000 Star Alliance SAS: 220,000 Africa SAS Star Alliance: 10,000 Star Alliance SAS: 30,000 Largest competitor 8 South America SAS Star Alliance: 1,000 Star Alliance SAS: 20,000 Scandinavia/Regional SAS Regional network: 390,000 Regional network SAS: 140,000 4
5 While the macro environment in Europe is weak, traffic to/from is Asia growing GDP growth Total international traffic China Europe Norway Low comparable figures due to ash cloud in 2010 AEA SAS Sweden 10 5 Denmark 0 Asia Pacific Jan-11 Feb-11 Mar-11 Apr-11 May-11 Jun-11 Jul-11 Aug-11 Sep-11 Oct-11 Nov-11 Dec-12 Jan-12 Feb-12 Mar-12 5
6 Successful opening of Copenhagen- Shanghai in March Traffic to/from Asia Earthquake in Japan Jan-11 Feb-11 Mar-11 Apr-11 May-11 Jun-11 Jul-11 Aug-11 Sep-11 Oct-11 Nov-11 Dec-12 Jan-12 Feb-12 Mar-12 Apr-12 AEA Introduction of Copenhagen- Shanghai SAS SAS offering fastest connection to most Scandinavian destinations More than 15 transfer connections at Copenhagen under 2 hours Award winning three class product Business Class, Economy Extra and Economy Class Will increase SAS market share on the Chinese market 6

7 The Nordic region s traffic has grown 148% to/from Asia-Pacific since 2000 Source: Airbus, OAG, traffic as of month of September
8 Traffic will continue to grow as the trade with Asia becomes increasingly important Asia is Sweden s second largest export region 10% 3% Export from Sweden* 13% 1% Europe America Oceania and Antarctica Africa Asia 73% Traffic to/from and within Asia to develop fast Nordic region traffic expected to grow faster than other developed regions % Forecast Annual traffic growth Source: SCB, Jan-Feb 2012 Source: Airbus
9 Nordic-Asia is the 5 th largest traffic flow from Europe Passengers to/from Asia, 2011 (mill.) More than 55 million passengers in 2011 Approximately 3.5 million passengers flying between Asia- Nordic Value of traffic flow between Europe- Asia in 2011 more than USD 43 billion Nordic-Asia traffic value above USD 2 billion in 2011 Nordic traffic flows 4 th largest on the destinations that SAS is serving 9
10 Prolonged high jet fuel prices is a major challenge for the industry Jet fuel, spot price development, USD Jan-03 Jan-05 Jan-07 Jan-09 Jan-11 Policy to offset fuel price volatility Hedging 40-70% of expected consumption (12 months rolling) Up to 18 months hedging allowed Yield management Cost initiatives SAS Current hedges 49% of the consumption hedged for next 12 months Only swaps and options Value of hedging portfolio on 31 March at MUSD 22 10
11 has resulted in weak results for European airlines in Q EBIT-margin, Jan-Mar EUR -76 EUR -597 EUR -98 EUR Norwegian Air France/KLM SAS Group Lufthansa 11


12 SAS award winning three class product to/from Asia Bangkok Beijing Shanghai Tokyo


13 Stay connected with SAS You will be able to browse the internet and use your cell phone to stay connected above feet! WiFi Internet, a shared connection of 12 Mbps GSM* telephony (starting 2012) Send and receive SMS text and MMS messages Use GPRS services Receive and make voice calls * GSM: Global System for Mobile Communications, digital cellular networks. 13

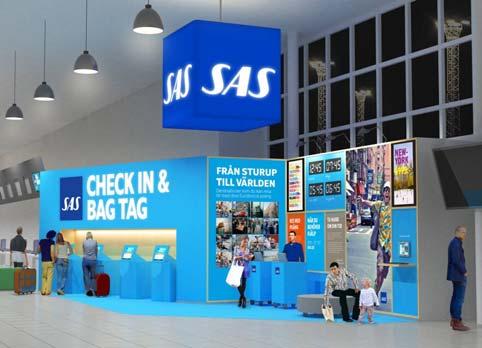

14 The new SAS look and feel

15 The new SAS look and feel: Copenhagen lounge exterior today

16 The new SAS look and feel: Potential new look, Copenhagen lounge


17 The new SAS look and feel: Malmö Airport before


18 The new SAS look and feel: New look today, Malmö Airport after

19 Modernization of fleet well in progress SAS main Airbus A330/ Scandinavian Airlines Airbus A319/A320/A321 Scandinavian Airlines Boeing /700/800 Scandinavian Airlines SAS being fased out, no later than 2013/2014 Boeing /500 Scandinavian Airlines MD-82/87 Scandinavian Airlines 3% increased short-haul production 2012 with one aircraft less in operation Widerøe & Blue1 dehavilland Q 100/300/400NG Scandinavian Airlines Boeing 717 Scandinavian Airlines The SAS Group recently signed additional three A320 on lease. In total, SAS is phasing in 30 modern aircraft that will completely replace older generations until

20 The new SAS look and feel: onboard. From this
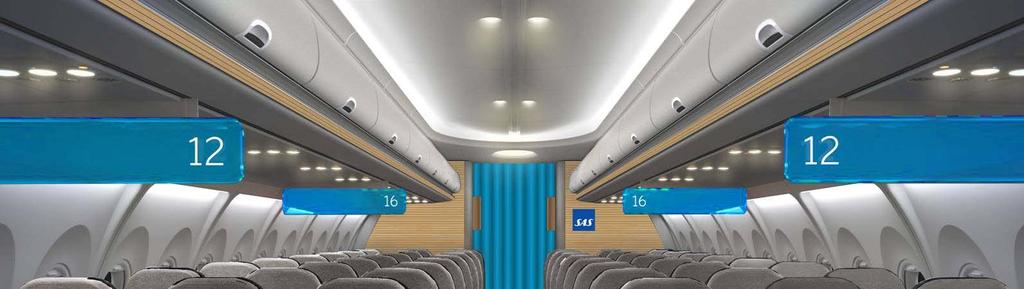
21 to this
 40,000 members in Asia New Partnerships Increased attractiveness 10 for 1 * Norway Domestic *) Variations apply 22")
22 SAS has the largest loyality program in Scandinavia competitive advantage Loyality program 2.8 million EuroBonus members new EuroBonus members in Q (1,8%) Corporate program members in SAS Credits new SAS Credit members in Q (4,8%) 40,000 members in Asia New Partnerships Increased attractiveness 10 for 1 * Norway Domestic *) Variations apply 22
 Total cost reduction SEK 7.8 bn (-24%) where of realized SEK 6.")

23 Strong focus on cost reductions - unit cost reduced 23% versus % unit cost reduction (excluding jet fuel) Total cost reduction SEK 7.8 bn (-24%) where of realized SEK 6.9 bn in 2011 Still a cost gap of 20-25% to be handled Cost reduction (excl jet fuel) Scandinavian Airlines -23% 30,1 6,9 Currency adj cost base 2008 Net cost reductions ,2 Actual cost base


24 4Excellence comes together Commercial Excellence Sales Excellence Operational Excellence People Excellence 4Excellence 24

25 New strategy 4Excellence is starting to provide effects SEK 1,5 bn Revenue activities Improved route result vs 2011 New airport design being rolled out EuroBonus members continues to grow SEK 3,5 bn Cost activities New distribution platform implemented SEK 1 billion union agreements secured and 300 FTE admin reduction on track Sale of properties completed 25

 Financial Drivers")

26 Drivers and Performance - development Q Customer Performance Passenger growth Customer satisfaction Operational Performance Punctuality Unit cost (CASK) Financial Drivers Fuel price RASK and Yield Financial Performance Cash flow Financial Preparedness SAS Result (EBT) 26 26


27 Continued strong financial preparedness Financial preparedness Q1, SEK billion Q Credit facilities Cash SEK 8.6 billion in total financial preparedness SEK 4.9 billion credit facilities SEK 3.7 billion cash Good financial preparedness Further improved by property transaction 27

28 Thank you! 28
SAS Group Presentation Carnegie, May 22, 2012 Sture Stölen, Head of IR
 SAS Group Presentation Carnegie, May 22, 2012 Sture Stölen, Head of IR 1 This is the SAS Group 128 destinations 27,2 million passengers 28 new routes to be launched 2012 1,085 daily flights Revenues 2011,
SAS Group 1 st interim report 2011
 SAS Group 1 st interim report 2011 Media/analyst presentation May 10, 2011 Q1 Improved earnings driven by Core SAS cost reductions Continued strong macro development in Scandinavia Additional capacity
SAS Group Q Teleconference August 8, 2012
 SAS Group Q2 2012 Teleconference August 8, 2012 1 Q2 4Excellence delivers tangible results Unit cost down 4% EBT (before non rec.) MSEK 137 EBT MSEK 371 Positive cash flow from operating activities MSEK
SAS Group Q Teleconference
 SAS Group Q4 2012 Teleconference December 12, 2012 1 Break-even result in 2012 despite 1.6 bn SEK higher fuel cost 23 MSEK EBT (before non-recurring items) despite 1.6 bn SEK higher fuel cost Positive
SAS Group Q2 2012/13. Q2 Restructuring programme moving KPIs in the right direction
 SAS Group Q2 2012/13 1 Q2 Restructuring programme moving KPIs in the right direction Operating revenues +1.6%* Yield improvement of +2.7%* Forceful implementation of 4XNG plan: Unit cost down by 10.7%
SAS Group 1 st interim report 2011
 SAS Group 1 st interim report 011 Media/analyst presentation May 10, 011 Q1 Improved earnings driven by Core SAS cost reductions Continued strong macro development in Scandinavia Additional capacity is
Continued good growth in most SAS Group markets first Quarter SAS Group EBT trend on the right track. Improved Result 1 st Quarter 2007
 Continued good growth in most SAS Group markets first Quarter 7 Continued favorable economic cycle Good growth on all markets Strong market growth, particularly in Finland and Norway SAS Group 1 st Quarter
Strengthened SAS delivers positive result in Q3
 SAS Group Q3 2012/13 1 Strengthened SAS delivers positive result in Q3 Passenger revenues up 5.3% (FX adjusted) 32 new routes introduced Capacity up 7.7% Traffic up 5.6% Yield down 0.6% Restructuring status
SAS Q1 2013/14. Tough 1 st Quarter 2013/2014 as expected THE NEWEUROBONUS. Q1 EBT MSEK -146 Positive effects from pension plans MSEK 1,044
 SAS Q1 2013/14 1 1 Tough 1 st Quarter 2013/2014 as expected Q1 EBT MSEK -146 Positive effects from pension plans MSEK 1,044 Yield down 5.6% in Q1 THE NEWEUROBONUS Launch in Spring 2014 Welcome onboard!
SAS AB:s interim report April 29 th 2008
 SAS AB:s interim report April 29 th 28 A very challenging 1 st Quarter The airline industry under pressure Record high fuel prices Increased competition Yield pressure Increased overcapacity Profit warnings
SAS Q1 2017/2018. Q1 in Summary: Improved earnings CHANGE VS. Q1 FY17
 SAS 2017/2018 27.02.2018 in Summary: Improved earnings POSITIVES + Passenger revenue up 1% (FX adj.) + Cargo and EB-point sale revenue increased MSEK 109 + Efficiency program delivered MSEK 165 + Positive
SAS AB:s Press Conference. Augusti 14 th 2008
 SAS AB:s Press Conference Augusti 14 th 2008 1 Weak second quarter due to unprecedented challenging market conditions Combination of record high fuel prices and economic slowdown probably largest industry
SAS Q3 2017/ August 2018
 SAS Q3 2017/2018 31 August 2018 Strong earnings in peak season POSITIVES Record number of passengers Total revenue up MSEK 936 vs. LY Currency adjusted yield up 1.1% vs. LY EB point sale up 27% vs. LY
SAS Q3 2015/2016. Q3 development largely in accordance with our expectations. Q3 update. Change vs. LY
 SAS Q3 2015/2016 08.09.2016 Q3 development largely in accordance with our expectations Q3 update Most of Q3 developed as expected FX adjusted revenues up by MSEK 428 226,000 more passengers in Q3 vs. LY
SAS Q1 2016/
 SAS Q1 2016/2017 08.03.2017 Weak Q1 as expected new structural actions underway Q1 in summary Positives + Currency adjusted passenger revenue up 5% + Strong development of ancillary revenues + Passengers
Second Quarter 2004 Teleconference
 Second quarter marginally positive despite to strong yield pressure and record high jet fuel prices MSEK, April-June 2004 Change Revenues 15 143 15 300-157 EBITDAR 1 493 1 608-115 Lease, depreciation &
SAS AB Analyst meeting
 SAS AB Analyst meeting London, August 9, 2001 2 2nd Quarter a tough Quarter The Marketplace Continued weak world economy Weaker Swedish economy SAS Weaker traffic growth and reduced passenger load factors
SAS Q2 2017/2018 TELECONFERENCE
 SAS Q2 2017/2018 TELECONFERENCE 30 May 2018 Earnings as expected despite negative currency effect POSITIVES + Total revenue up MSEK 73 vs. LY + Currency adjusted yield up 0.6% vs. LY + EB-point sale revenue
Press conference Full Year 2006
 Good growth in most markets in 2006 Good GDP and traffic growth in most markets Strongest traffic growth in Spain, Norway and the Baltics Strong growth also in Finland Sweden: GDP: 4,3% Passengers: +2,5%
2012 Result. Mika Vehviläinen CEO
 2012 Result Mika Vehviläinen CEO 1 Agenda Market environment in Q4 Business performance and strategy execution Outlook Financials 2 Market Environment According to IATA, Global air travel continues to
SAS takes forceful action in a challenging market
 SAS Q2 2013/14 1 1 SAS takes forceful action in a challenging market Q2 EBT MSEK -1,078 Disappointing result in a challenging market most European carriers struggle During the last year, capacity has outgrown
SAS Q3 2016/
 SAS Q3 2016/2017 05.09.2017 A strong summer performance drives result improvements Q3 IN SUMMARY Positives + Currency adjusted passenger revenue up 6.4% + Passengers up by ~300,000 + Ancillary and cargo
Analyst Meeting Full Year 2006
 Good growth in most markets in 26 Good GDP and traffic growth in most markets Strongest traffic growth in Spain, Norway and the Baltics Strong growth also in Finland Sweden: GDP: 4,3% Passengers: +2,5%
Q1 2018/
 Q1 2018/2019 27.02.2019 Highlights Q1/19 CHANGE VS. Q1-18 Financial drivers Total revenue up 6% with broadly unchanged capacity Slight increase in passengers and load factor HIGHLIGHTS Q1/19 Improved unit
SAS AB Q December 2018
 SAS AB Q4 2018 4 December 2018 Q4 financial highlights Q4 POSITIVES Q4-18 CHANGE VS. Q4-17 Record number of passengers Total revenue up SEK 1bn vs. LY Yield (nominal) up 5.1% vs. LY RASK (nominal) up 7.0%
Analysts and Investors conference call. Q results. 15 May 2013
 Analysts and Investors conference call Q1 2013 results 15 May 2013 Management summary Key messages of Q1 2013 +6% +9% +3.3%p. Q1 2013 operational KPIs are in line with 109.7 116.2 6.5 7.1 82.3 85.6 expectations,
Presentation of 1 st Interim Report 2006 Stockholm and London, May 4-5
 Result affected by pilot conflict and underlying yield pressure EBT bef nonrecurring items MSEK -1 319 in line with 25 Positive Easter Effect MSEK 1 Cost for conflicts of MSEK 25 Still underlying price
SAS Q4 2016/2017. Q4 in Summary: Earnings in line with November outlook Negative currency effects of MSEK 273 CHANGE VS.
 SAS Q4 2016/2017 12.12.2017 Q4 in Summary: Earnings in line with November outlook Positives + Passenger revenue up 5.4% (FX adj.) + Yield up 5.5% + Efficiency program delivered MSEK 240 + 3-year collective
Third Quarter 2004 Analyst presentation November, 2004
 Third quarter marginally positive despite large overcapacity Stabilized yield drop, but large overcapacity put pressure on load factors Group traffic revenues down 2% in Q3 Volume 56 Price -7 Third Quarter
Third Quarter Presentation of Year end Report 2005 Stockholm and London, February SAS Group positive result 2005
 Third Quarter 25 positive result 25 Presentation of Year end Report 25 Stockholm and London, February 9-1 1 EBT bef nonrecurring items MSEK 114, an improvement of MSEK 1 815 Record number of passengers
Second Quarter nd Quarter result improved by MSEK 526. Improved load and stable yields. Positive result and improved operating performance
 Positive result and improved operating performance Second Quarter 25 1 st Half result improved by MSEK 82 Improvement for all business areas and group airlines Operating result almost tripled in 2 nd Quarter
3rd Quarter Analyst Presentation
 SAS Group 3rd Quarter Analyst Presentation London, November 12, 1999 Contents of 3rd Quarter presentation The quarter in brief SAS International Hotels Business review & financial summary Impact from fleet
A challenging Quarter, but record passenger numbers. Quarter overshadowed by Q400 problems
 A challenging Quarter, but record passenger numbers EBT bef. non rec. Q3: MSEK 632, Jan-Sep : MSEK 982 Record number of passengers Group airlines perform strongly Negative effect from Q4, ECA agreement
SAS Q3 2016/2017. A strong summer performance drives result improvements CHANGE VS. Q3 FY16
 SAS Q3 2016/2017 05.09.2017 A strong summer performance drives result improvements Q3 IN SUMMARY Positives + Currency adjusted passenger revenue up 6.4% + Passengers up by ~300,000 + Ancillary and cargo
Singapore Airlines Group Analyst/Media Briefing HALF YEAR FY RESULTS 5 NOVEMBER 2012 THE PARENT AIRLINE 1H FY2012/13 RESULTS
 Singapore Airlines Group Analyst/Media Briefing HALF YEAR FY2012-13 13 RESULTS 5 NOVEMBER 2012 THE PARENT AIRLINE 1H FY2012/13 RESULTS THE PARENT AIRLINE COMPANY RESULTS 2Q & 1H FY12/13 2Q/12 $million
Bank of America Merrill Lynch 2018 Emerging Markets Corporate Credit Conference. Miami, May 2018
 Bank of America Merrill Lynch 2018 Emerging Markets Corporate Credit Conference Miami, May 2018 This presentation may include forward-looking comments regarding the Company s business outlook and anticipated
Information meeting. 1 st September 2011
 Information meeting 1 st September 2011 Full Year 2010-11 key data April 2010-March 2011 Revenues in billions Operating result in millions 77% Passenger 18.10 +11.3% -44 +874 13% Cargo 3.16 +29.5% +69
Santander 22 nd Annual Latin American Conference. Cancun, January 2018
 Santander 22 nd Annual Latin American Conference Cancun, January 2018 This presentation may include forward-looking comments regarding the Company s business outlook and anticipated financial and operating
Third Quarter 2014 Results. 29 October 2014
 Third Quarter 2014 Results 29 October 2014 Highlights of the Third Quarter Operating environment Air France-KLM Economic environment remains weak Further currency volatility affecting revenues and results
SAS Group Interim Report
 SAS Group Interim Report January-June 2004 Marginally positive earnings for second quarter of 2004 Operating revenue for the first half of the year amounted to MSEK 27,710 (29,010), a decrease of 4.5%.
Fourth Quarter and Full Year 2011 Results Presentation. February 1, 2012
 Fourth Quarter and Full Year 2011 Results Presentation February 1, 2012 This presentation may include forward-looking comments regarding the Company s business outlook and anticipated financial and operating
THE FIRST CHOICE FOR FREQUENT TRAVELERS
 THE FIRST CHOICE FOR FREQUENT TRAVELERS One of SAS s strategic priorities is to be the first choice for frequent travelers. We define frequent travelers as individuals who take five or more return flights
AIR NEW ZEALAND ANNUAL RESULTS ANNUAL RESULTS
 AIR NEW ZEALAND ANNUAL RESULTS 2008 1 HIGHLIGHTS Record operating revenue, up 9% Normalised earnings* $197m Net cash position of $1.3bn Launched direct service to Vancouver and Beijing Award winning product
Asian stopovers in Nordic countries Optimistic perspectives. March 2018
 Asian stopovers in Nordic countries Optimistic perspectives March 2018 OUR COMMITMENT IS TO HAVE THE MOST PRECISE, UP-TO-DATE MARKETDATA ON TRAVELLERS JOURNEYS 30.238.647 Travellers monitored each day
Norwegian Air Shuttle ASA
 Norwegian Air Shuttle ASA Q1 2018 Presentation 26 April 2018 Highlights Q1 2018 Successfully completed private placement of NOK 1.3 billion Added two 737-800s and six 787-9s to operations Launched interline
Cathay Pacific Airways 2012 Analyst Briefing 28 June 2012
 Cathay Pacific Airways 2012 Analyst Briefing 28 June 2012 1 Airline Strategy Grow our international network, expand frequencies and further develop Hong Kong as one of the world s leading aviation hubs
Cathay Pacific Airways 2013 Analyst Briefing 25 June Cathay Pacific Airways Analyst Briefing 27 November 2013
 Cathay Pacific Airways 2013 Analyst Briefing 25 June 2013 Cathay Pacific Airways Analyst Briefing 27 November 2013 2013 Operating Performance to date: Passenger yield and load factor growth on lower ASKs.
Cathay Pacific Airways 2011 Analyst Briefing 23 June 2011
 Cathay Pacific Airways 2011 Analyst Briefing 23 June 2011 1 Airline Strategy Grow our international network, expand frequencies and further develop Hong Kong as one of the world s leading aviation hubs
Building A New Silk Road Capacity Planning and Selecting Markets. Greg Kaldahl SVP Resource Management
 Building A New Silk Road Capacity Planning and Selecting Markets Greg Kaldahl SVP Resource Management 1 The Airline Industry Is In A State Of Constant Change Market cap ( bn) as of 1 Jan 1999 10 9.3 NA/EU
Fourth Quarter and Full Year 2009 Results Presentation January 27, 2010
 Fourth Quarter and Full Year 2009 Results Presentation January 27, 2010 This presentation may include forward-looking comments regarding the Company s business outlook and anticipated financial and operating
Enskilda Nordic Seminar 2006 Copenhagen 12 January President and CEO Jukka Hienonen
 Enskilda Nordic Seminar 2006 Copenhagen 12 January 2006 President and CEO Jukka Hienonen On blue and white wings since 1923 Over 8 million passengers/year Turnover 1.7 billion euro 9 000 employees 70 aircraft
Air Berlin PLC AGM 18 June 2014 London
 Air Berlin PLC AGM 18 June 2014 London Executive summary (1) Key Highlights 2013 2013: a challenging year for airberlin Operational loss of 231.9 million euros Group revenue down in line with capacity
THAI AIRWAYS INTERNATIONAL PCL
 THAI AIRWAYS INTERNATIONAL PCL 2Q2017 analysts briefing 16-Aug-2017 1 DISCLAIMER The information contained herein is intended to represent the Company s operating and financial position at a given point
Air China Limited Annual Results. March Under IFRS
 Air China Limited 21 Annual Results Under IFRS March 211 Agenda Part 1 Highlights Part 2 Business Overview Part 3 Financial Overview Part 4 Outlook 2 Part 1 Highlights Steady Economic Growth; Asia Pacific
Air Berlin PLC AGM 06 June 2013 London
 Air Berlin PLC AGM 06 June 2013 London airberlin a strong European carrier Market position as of 31 December 2012 No. 2 in core market: Germany / Austria / Switzerland No. 7 in Europe with 33.3 m guests
On the right track cost cuts taking effects 1 st Quarter Weakest quarter in history for airline industry
 On the right track cost cuts taking effects st Quarter Weakest quarter in history for airline industry Stockholm Arlanda, August 2th London Radisson SAS, August 2th 2 nd Quarter Continued pressure on revenues
AIR FRANCE-KLM RESULTS PRESENTATION
 AIR FRANCE-KLM RESULTS PRESENTATION Results as at 30 th of June 2018 1 st August 2018 SECOND QUARTER 2018: KEY HIGHLIGHTS Leveraging ongoing solid demand +0.8% +1.7% Stable operating result before strike
The SAS Group five business areas as from Q SAS Group statement of income
 Weak full year result but according to plan Teleconference Fiscal year st Quarter weak according to plan nd Quarter passenger load factors and yields better than expected 3 rd and 4 th Quarter pressure
Air Berlin PLC 28th April 2014 Annual Results Press Conference
 Air Berlin PLC 28th April 2014 Annual Results Press Conference AGENDA Executive summary A. airberlin at a glance 5 B. airberlin s financial situation / full year results 2013 12 C. Recapitalisation, accelerated
Results 2Q17. August 9, 2017
 Results 2Q17 August 9, 2017 2Q17 Highlights Indicators 2Q17 Var. x 2Q16 ASK (BN) 10.4-3.0% Traffic (000) 7,261-1.3% RPK (BN) 8.1 +0.5% Load Factor 77.9% +2.7 p.p. Yield (R$ cents) 23.2 +4.8% Pax Revenue
Navigating through Turbulence. Andrew Herdman AAPA Director General IFSA ITCA WAEA Asia Pacific Conference Kuala Lumpur Malaysia, 29 April 2009
 Asia Pacific Aviation Navigating through Turbulence Andrew Herdman AAPA Director General IFSA ITCA WAEA Asia Pacific Conference Kuala Lumpur Malaysia, 29 April 2009 Presentation Outline Asia Pacific Aviation
Analyst Briefing. 12 June Cathay Pacific Airways Limited
 Analyst Briefing 12 June 2015 Cathay Pacific Airways Limited Operating Performance The positive operating environment continues into the first half of 2015. Robust passenger demand and healthy cargo demand.
Singapore Airlines Group Analyst/Media Briefing HALF YEAR FY RESULTS. 13 November 2013 THE PARENT AIRLINE 1H FY2013/14 RESULTS
 Singapore Airlines Group Analyst/Media Briefing HALF YEAR FY2013-14 14 RESULTS 13 November 2013 THE PARENT AIRLINE 1H FY2013/14 RESULTS THE PARENT AIRLINE COMPANY RESULTS 2Q & 1H FY13/14 2Q/13 $million
Information meeting. 12 September 2011
 Information meeting 12 September 2011 Full Year 2010-11 key data April 2010-March 2011 Revenues in billions Operating result in millions 77% Passenger 18.10 +11.3% -44 +874 13% Cargo 3.16 +29.5% +69 +505
Analysts Briefing. 24 June Cathay Pacific Airways Limited
 Analysts Briefing 24 June 2016 Cathay Pacific Airways Limited Operating performance - overview Challenging business environment. Load factor lower than expectations on weakening passenger demand. Strong
Montie Brewer, President and CEO Joshua Koshy, Executive VP and CFO UBS Transport Conference
 Montie Brewer, President and CEO Joshua Koshy, Executive VP and CFO UBS Transport Conference 1 London, England September 17, 2007 Agenda Strongly positioned international airline Investment proposition
January 2018 Air Traffic Activity Summary
 January 2018 Air Traffic Activity Summary Jan-2018 Jan-2017 CY-2018 CY-2017 Passengers 528,947 505,421 4.7% 528,947 505,421 4.7% Passengers 537,332 515,787 4.2% 537,332 515,787 4.2% Passengers 1,066,279
Analysts Briefing. 27 November Cathay Pacific Airways Limited
 Analysts Briefing 27 November 2015 Cathay Pacific Airways Limited Operating performance - overview Passenger load factors are high, driven by strong back-end demand. Passenger front-end yield and load
DANSK LUFTFARTS ÅRSMØDE RICKARD GUSTAFSON, PRESIDENT & CEO SAS
 DANSK LUFTFARTS ÅRSMØDE RICKARD GUSTAFSON, PRESIDENT & CEO SAS 23.05.2018 1 SAS AT A GLANCE 2 THE FUTURE OF SCANDIAVIAN AVIATION 2 SAS is an important part of Scandinavian infrastructure A DAY IN THE LIFE
UBS 14 th Global Emerging Markets Conference. New York, November 2016
 UBS 14 th Global Emerging Markets Conference New York, November 2016 This presentation may include forward-looking comments regarding the Company s business outlook and anticipated financial and operating
Information meeting. September 2011
 Information meeting September 2011 Full Year 2010-11 key data April 2010-March 2011 Revenues in billions Operating result in millions 77% Passenger 18.10 +11.3% -44 +874 13% Cargo 3.16 +29.5% +69 +505
J.P. Morgan 2019 Global Emerging Markets Corporate Conference. Miami, February 2019
 J.P. Morgan 2019 Global Emerging Markets Corporate Conference Miami, February 2019 This presentation may include forward-looking comments regarding the Company s business outlook and anticipated financial
Interim Report 3:2000 January-September
 Interim Report 3:2000 January-September The SAS Group SAS Danmark A/S SAS Norge ASA SAS Sverige AB Corporate Structure SAS Danmark A/S The Danish State: 50% Private interests: 50% SAS Norge ASA The Norwegian
FY key data Passenger. Cargo. Maintenance. Other. Operating result in m. Revenues in bn -10.4% 78% 11%
 Information meeting FY 2009-10 key data Revenues in bn Operating result in m 78% Passenger 16.3-13.6% -918 11% Cargo 2.4-27.8% -436 5% Maintenance 1.0-4.0% +81 6% Other 1.3-12 -10.4% 2 Our industry is
SAS Group Interim Report January March 2012
 SAS Group Interim Report January March 2012 Strengthened cash flow but negative earnings as forecast - continued challenges in 2012-4Excellence measures corresponding to SEK 5 billion to be implemented
Airline Current Business Environment Alex Heiter
 Airline Current Business Environment Alex Heiter Istanbul Technical University Air Transportation Management M.Sc. Program Network, Fleet and Schedule Strategic Planning Module 2: 28 March 2016 The underlying
SAS Group Interim Report January-September 2010
 July-September 2010 Operating revenue: MSEK 10,690 (11,076) Earnings before non-recurring items in continuing operations: MSEK 387 (37) EBT margin before non-recurring items in continuing operations: 3.6%
Airline industry outlook remains fragile
 Airline industry outlook remains fragile June 2009 www.iata.org/economics To represent, lead and serve the airline industry Airline industry outlook remains fragile Green shoots starting to appear Recovery
Air China Limited 2014 Annual Results Under IFRS
 Air China Limited 2014 Annual Results Under IFRS March 2015 Agenda Part 1 Results Highlights Part 2 Business Overview Part 3 Financial Overview Part 4 Outlook Part 1 Results Highlights Gradual Global Economic
Finnair Group Interim Report 1 January 30 June 2008
 Finnair Group Interim Report 1 January 30 June 2008 1 08/08/2008 Presentation name / Author Airline industry at a historical turning point Fuel price has a stranglehold on the business Average ticket prices
Cathay Pacific Airways Interim Results for the six months ended 30 June 2012
 Cathay Pacific Airways Interim Results for the six months ended 30 June 2012 8 August 2012 1 Interim Result 1H2012 1H2011 Change Group attributable (loss) / profit HK$ million (935) 2,808-133.3% Group
Annual Results Air New Zealand
 Annual Results 2011 Air New Zealand Highlights Normalised earnings* $75m Net cash position of $860m Operating cash flow down 5% Gearingat467% at 46.7% Final dividend 2.5 cents per share (unimputed) New
Results for the Year Ended 30 th June Brett Godfrey Chief Executive Officer 21 August 2007
 Results for the Year Ended 30 th June 2007 Brett Godfrey Chief Eecutive Officer 21 August 2007 New World Strategy Delivering RASK up 13.0% 10.02 CASK (underlying) up 2.6% 8.24 Net Profit up 92.9% $216M
Conference Call 1Q14 Results. Investor Relations May 15, 2014
 Conference Call Results Investor Relations May 15, 2014 1 Highlights 2 Highlights Net revenues of R$2.5 billion in the quarter, an increase of 20% or R$411 million quarter-over-quarter; EBIT totaled R$144
Vueling Airlines 2009 Fourth-Quarter, Full-Year Financial Results. The 100-milion turnaround story
 Vueling Airlines 2009 Fourth-Quarter, Full-Year Financial Results The 100-milion turnaround story Barcelona, February 23 rd, 2009 Introduction Revenues Operations and costs Outlook for 2010 Vueling has
Industry Update. ACI-NA Winter Board of Directors Meeting February 3, 2016 Orlando, FL
 Industry Update ACI-NA Winter Board of Directors Meeting February 3, 2016 Orlando, FL U.S. & Canadian GDP 8% 6% 4% U.S.* Canada** Estimate by BEA as of 02/11/16 2% 0% -2% -4% -6% -8% -10% The U.S. economy
AIR BERLIN PLC Q2 RESULTS, APRIL JUNE Berlin, August 18 th, 2011
 AIR BERLIN PLC Q2 RESULTS, APRIL JUNE 2011 Berlin, August 18 th, 2011 MANAGEMENT SUMMARY 1/5 Management Summary Yield 1) [EUR] +7.9% 99.75 107.68 Q2/10 PF Q2/11 ACT Measures: Increase of fuel surcharge
September 2010 Brian Pearce To represent, lead and serve the airline industry
 Cycle turns up but risks and structural challenges remain September 2010 Brian Pearce www.iata.org/economics To represent, lead and serve the airline industry Confidence was still high in July survey Airline
Global Airline Trends and Impacts International Aviation Issues Seminar
 Global Airline Trends and Impacts International Aviation Issues Seminar December 2017, Washington D.C. Oliver Lamb Managing Director 1 Around the world in 45 minutes Financial Performance Canada Mexico
CORPORATE STEVE BOOKING SMITH CHANNELS
 JAPAN AIRLINES: NAVIGATING THE FUTURE Steve Myer, Tokyo September 30, 2016 CORPORATE STEVE BOOKING SMITH CHANNELS VICE PRESIDENT, GLOBAL & STRATEGIC SALES, THE AMERICAS SEPTEMBER 20, 2016 RENO, NEVADA
Air Berlin PLC 15 th June, 2016 Annual General Meeting 2016 London
 Air Berlin PLC 15 th June, 2016 Annual General Meeting 2016 London Despite headwind, airberlin made good progress in 2015 RASK +3.7% Yield +2.0% Load Factor +0.7%pt Ancillary Revenues* +9.2% ASKs -5.4%
Market Outlook. Michael Warner, Director Market Analysis. Boeing Commercial Airplanes October October 7 10, 2012 Atlanta, Georgia, USA
 Market Outlook Michael Warner Director, Market Analysis Boeing Commercial Airplanes October 2012 Agenda Aviation environment Current products Product strategy & development 2012 719 net orders through
2017 Marketing and Communications Conference. November 6, 2017
 2017 Marketing and Communications Conference November 6, 2017 1 2 Introduction Carrie Kenrick State of the Industry Industry Consolidation Financial Trends Ancillary Product / Customer Segmentation Fleet
Finnair Group Interim Report 1 January 31 March 2008
 Finnair Group Interim Report 1 January 31 March 2008 1 29/04/2008 Presentation name / Author Outlook for the industry less positive Growth of demand declining due to uncertainty of global economy Growth
Commercial success improves earnings
 SAS Interim Report November July 215 SAS Interim Report November July 215 Commercial success improves earnings May 215 July 215 Income before tax: MSEK 1,31 (756) Income before tax and nonrecurring items:
Even Frydenberg, President & CEO Jan Johansson, CFO
 Even Frydenberg, President & CEO Jan Johansson, CFO CONTINUED IMPROVED EARNINGS Good demand in the quarter driven by leisure Sales growth of 23% fueled by more rooms in operation and currency effects Like-for-like
MAp today released its monthly report on traffic performance at its airports for December Traffic Performance. 8.
 AFSL 236875 Level 9, 130 Pitt Street, Sydney, New South Wales, 2000, Australia T 1800 181 895 or +61 2 9237 3333 F +61 2 9237 3399 www.mapairports.com.au ASX Release 20 January 2010 MAp TRAFFIC PERFORMANCE
Finnair Q Result
 Finnair Q1 2015 Result 7 May 2015 CEO Pekka Vauramo, Interim CFO Mika Stirkkinen 1 Turbulent market environment The weakness of the Finnish economy continued to be reflected in the demand in the first
Overview. > Normalised earnings* before taxation of, up 30% > Statutory earnings before taxation of, up 40% > Statutory net profit after taxation of
 1 Overview > Normalised earnings* before taxation of, up 30% > Statutory earnings before taxation of, up 40% > Statutory net profit after taxation of > Operating revenue of > Strong operating cash flow
2007/08 Full Year Results Investor Briefing
 2007/08 Full Year Results Investor Briefing Highlights of Result Profit before tax up 46% to $1,408 million Up 36% on the reported result Margin improvement $3 billion of Sustainable Future Benefits achieved