Board Report April 26, 2016
|
|
|
- Suzanna Small
- 5 years ago
- Views:
Transcription

1 Board Report April 26, 2016 ANYONE WISHING TO SPEAK BEFORE THE VOTE ON ANY AGENDA ITEM MUST FILL OUT A PURPLE FORM ON THE SIGN-IN TABLE. COMMENTS WILL BE LIMITED TO THREE MINUTES. Audience Questions and Comments PERSONS WISHING TO SPEAK MUST FILL OUT A WHITE FORM, LOCATED ON THE SIGN-IN TABLE, BEFORE THE MEETING. COMMENTS WILL BE LIMITED TO THREE MINUTES.
2 Board Report April 26, 2016 CHAIRMAN LONGORIA


3 OUTREACH EFFORTS

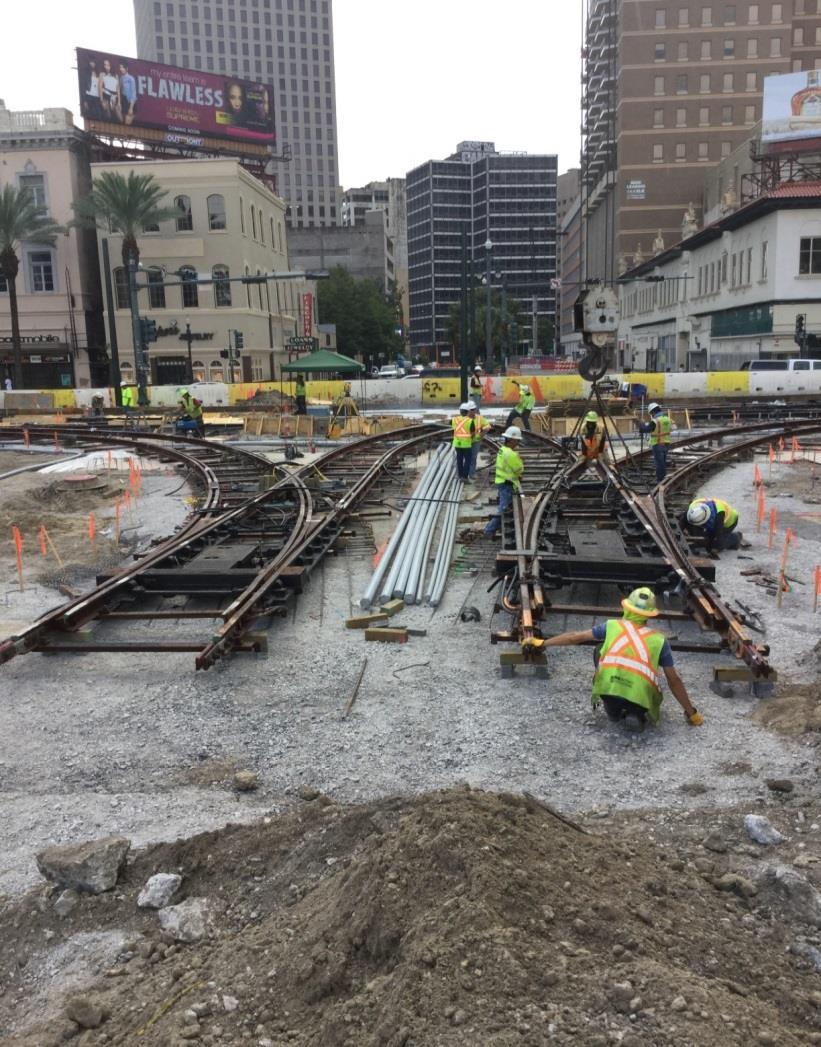
4 STREETCAR TRACK INSTALLATION
5 PRINT PUBLICATIONS THE TRIBUNE- April 18 th LOUISIANA WEEKLY April 25 th VIET Community Newsletter- April 26 th JAMBALAY A NEWS April 25 th THE ADVOCATE April 28 th and May 1st EL TIEMPO- May 1 st Date reflects run date of advertisement


6 PRINT PUBLICATIONS

7 ENGLISH
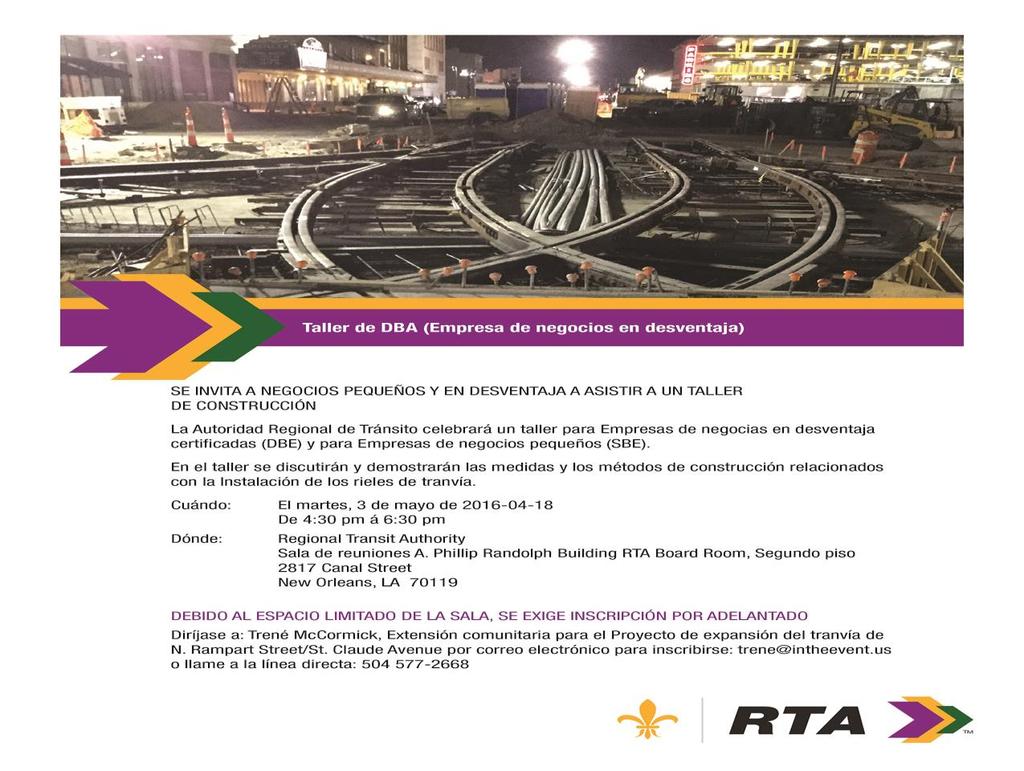
8 SPANISH
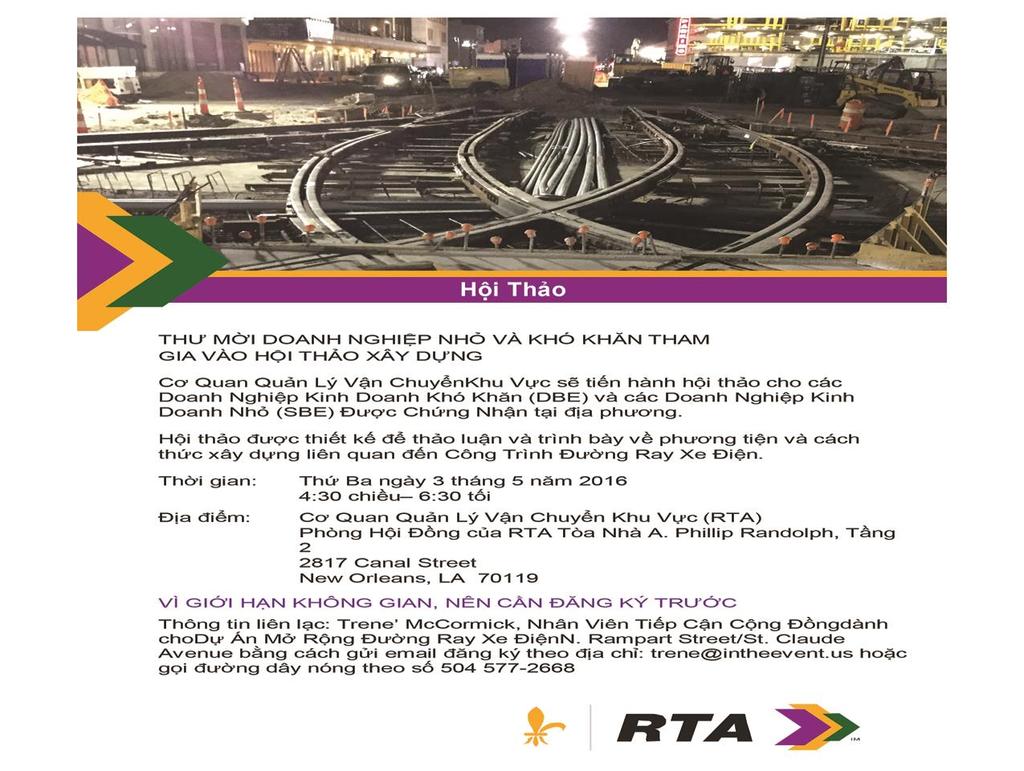
9 VIETNAMESE
10 BLAST ITE April 20 th, April 28 th & May 2 nd 150 VIET- April 26 th 16,000 THE COLLABORATIVE- April 21 st Date reflects date eblast was sent and number of recipients
11 ADVOCATE CITY BUSINESS EL TIEMPO ENTERCOM NOLA.COM RTA- April 19 th WDSU WVUE WWL WYLD ONLINE


12 SOCIAL MEDIA EL TIEMPO facebook RTA-twitter & facebook
13 RADIO/PSA ENTERCOM 6 stations/all genres
14 EXECUTIVE MANAGEMENT REPORT April 26, 2016 Justin T. Augustine, III Welcome: Adelee Marie Le Grand Chief Strategy Officer State Update Kevin Lawson Ferry Grant - $5 million DBE First Quarter 2016 TSA Safety Award

15 DBE Program Performance Report First Quarter 2016
16 Current Contracts FEDERAL Total $ 5.9 Million Total $ 1.4 Million for DBEs 24% DBE Participation NON-FEDERAL Total $47.2 Million Total $14.7 Million for DBEs 31% DBE Participation
17 First Quarter Performance Total spending $12,441,687 (federal and nonfederal not including fuel and vehicles) DBE Spending $2,822,230 1st Quarter DBE Attainment 23%
18 EXECUTIVE MANAGEMENT REPORT April 26, 2016 Justin T. Augustine, III TSA Safety Award


19 Canal/Algiers Point and Lower Algiers/Chalmette Ferry Routes Financial and Operations Report For the Period January 1, 2015 through March 31, 2016 April 26, 2016
20 Ferry Operations Statement of Expenses and Revenues MARCH 2016 Fiscal year July 1, 2015 June 30, 2016 July August September October November DECEMBER JANUARY FEBRUARY MARCH Total Expenses 593, , , , , , , , , Less Fares and Credits (166,127.83) (213,761.00) (92,801.75) (134,893.26) (106,499.18) (108,775.05) (109,233.09) (209,814.13) (146,825.45) Transdev Net Billing 427, , , , , , , , , FY LADOTD Ferry Subsidy 1,747, ,266, ,491, ,986, ,347, ,709, ,326, ,859, ,309, Less Ferry diesel fuel provided by RTA (41,817.40) (12,693.00) (37,639.64) (24,511.00) (47,429.00) (6,831.59) (16,974.40) (29,498.89) (28,880.16) RTA Ferry Grant Revenues 183, ,691 94, ,365 Less RTA Grant Expenses (11,679.00) (6,100.00) (6,100.00) (180,340.00) (229,066.00) -0- (5,864) (118,210) (51,707) Less Transdev s Net March 2016 Billing (427,476.93) (556,192.00) (377,869.33) (434,656.27) (544,843.19) (376,536.78) (448,573.92) (496,555.79) (533,554.43) Balance of LADOTD Subsidy 1,266, , ,069, ,347, ,709, ,326, ,859, ,309, ,736,
21 Ferry Operations RIDERSHIP April 26, 2016 January 1, 2015 through March 31, 2016 Algiers Point/Canal Street Lower Algiers/Chalmette Date Pedestrians Scooters Total Pedestrians Vehicles Total Jan , , ,638 25,943 Feb ,606* 15 73, ,432 27,455 Mar , , ,509 23,520 Apr , , ,748 25,759 May , , ,046 26,431 Jun , , ,231 22,486 Jul , , ,475 22,730 Aug , , ,798 31,241 Sep , , ,807 19,114 Oct , , ,136 26,455 Nov-15 37, , ,865 24,679 Dec-15 40, , ,793 22,088 Jan-16 37, , ,856 23,237 *Feb , , ,536 26,933 Mar-16 46, , ,479 27,838 *Mardi Gras - Saturday, February 6, 2016 through Tuesday, February 9, ,733 21
22 INFRASTRUCTURE DEPARTMENT BOARD REPORT April 26, 2016


23 N. Rampart Street / St. Claude Avenue Streetcar Expansion Project Status Update Period: January 5, 2015 April 26,
24 Construction Progress Completed Trackwork (Canal to Bienville) (Toulouse to Elysian Fields) Trackwork in Progress (Bienville to Toulouse) (Rail Installed all the way to St. Louis) Waterline in Progress 24

25 Construction Progress Photos Elysian Fields Station Elysian to Esplanade View 25

26 Construction Progress Photos Pauger Station Pauger to Elysian Fields View 26

27 Construction Progress Photos Restored Esplanade Intersection with the Station in Progress 27

28 Construction Progress Photos St. Ann Station St. Ann to Esplanade View 28

29 Construction Progress Photos Track Installation Bienville to St. Louis 29

30 Construction Progress Photos Completed Tracks from Canal to Bienville 30


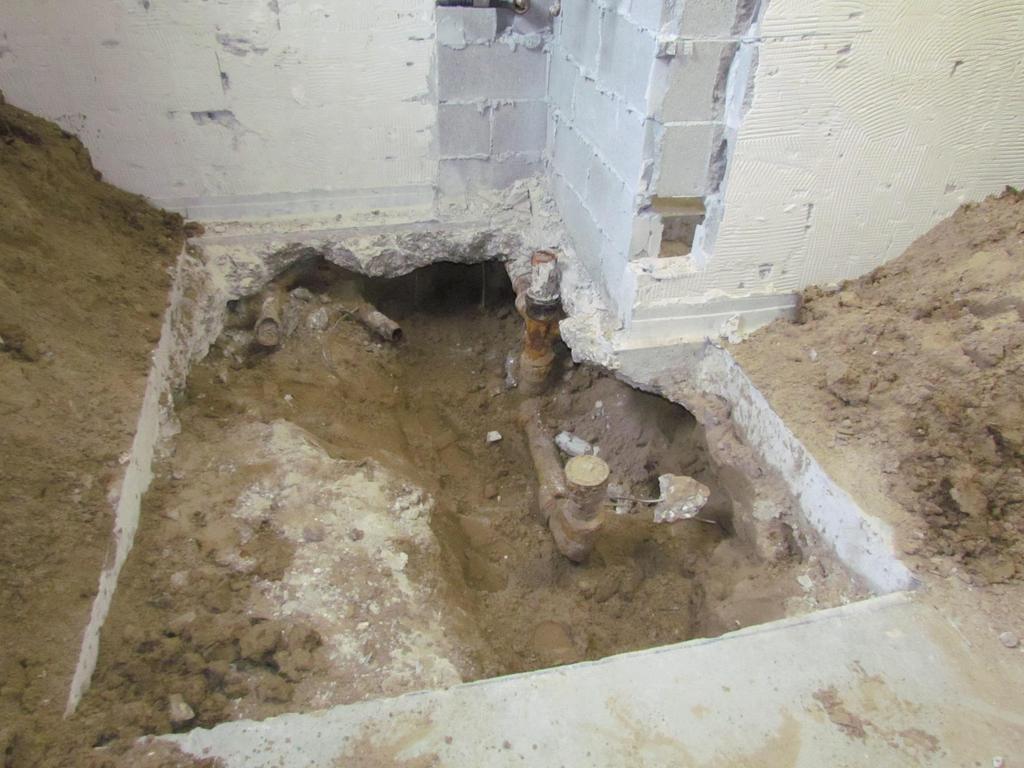
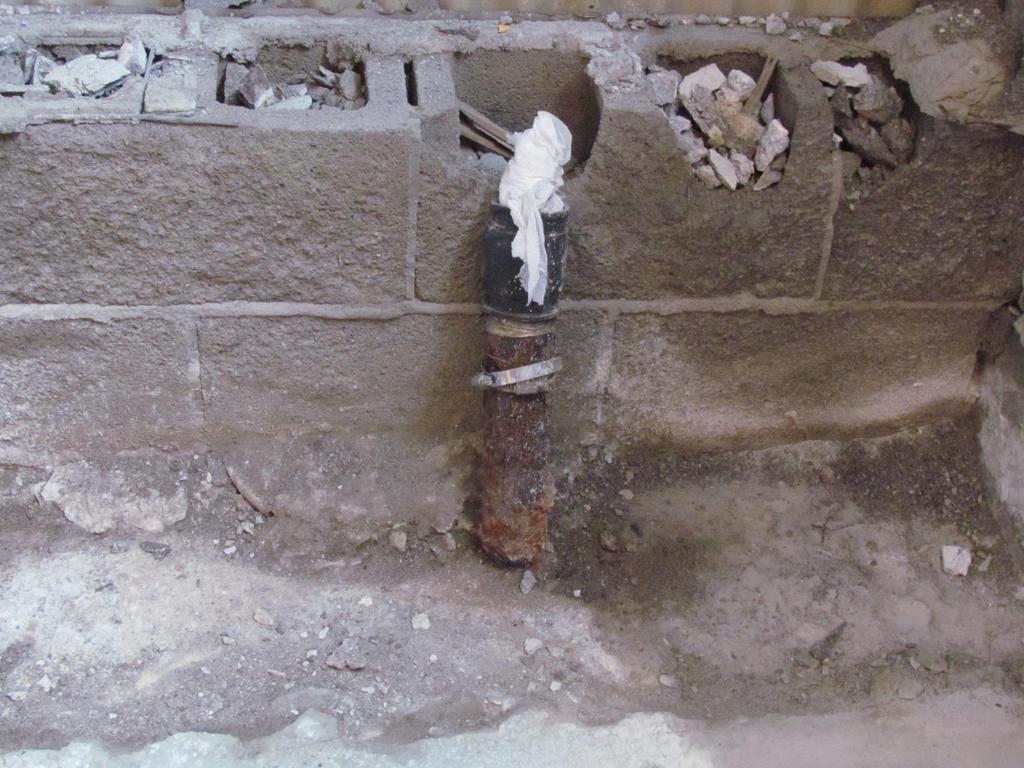
31 Construction Progress Photos Touro Street towards Elysian Fields View Underground Utilities Work
32 Financial Status Original Contract Value: $ 41,154,229 Change Orders Value: - $ 530,510 Revised Contract Value: $ 40,623,719 Estimated Value of Change Orders under Negotiation: $ 250, Differing Site Conditions to Date:» All for underground conflicts» To date value approx. $ 275,000» Billed to Bid Item for Differing Site Conditions - $ 300,000 available in the Original Contract Internal Monthly Cost Review Meetings (AWC, Transdev, PB, and TMG) Current DBE Goal at 32% (28.56% Required by Contract) 32
33 Other Remarks Monthly Project Update for the Community» Next meeting today at 6pm (Golden Feather Mardi Gras Indian Restaurant Gallery at 704 N. Rampart) 33

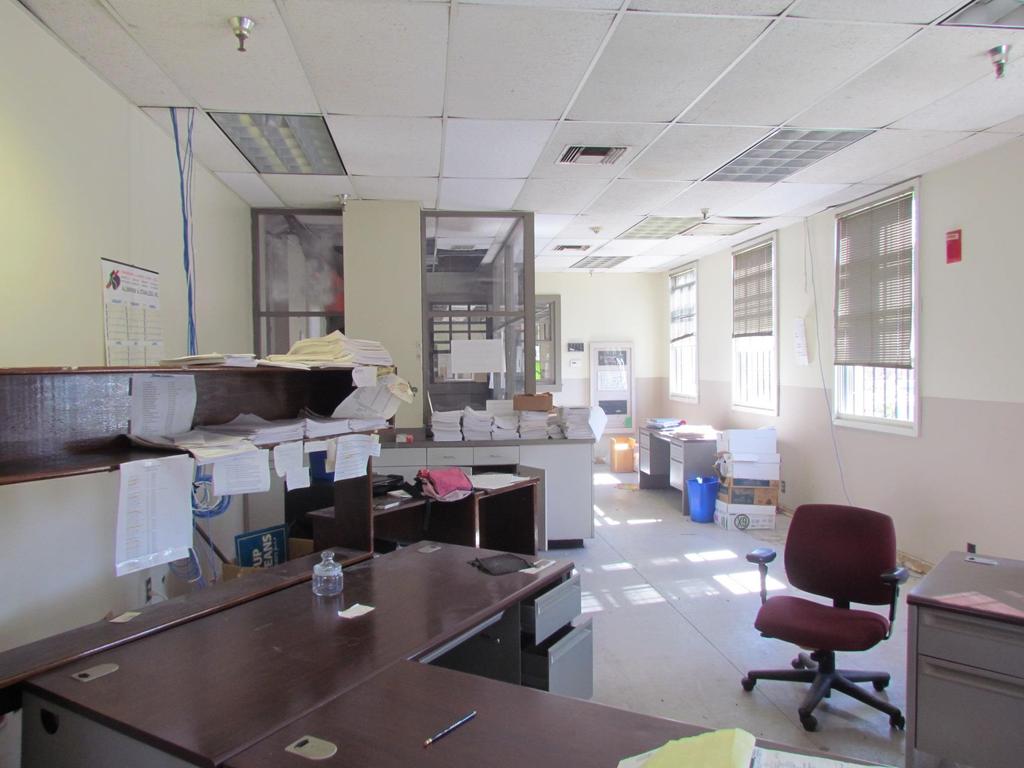
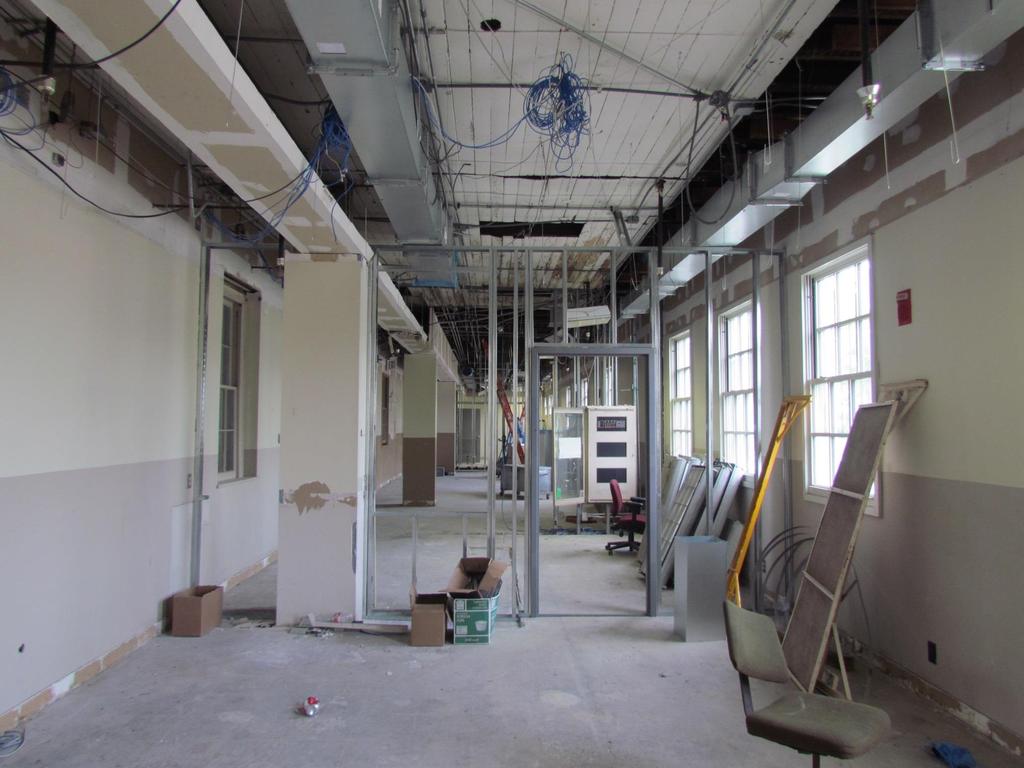
34 Carrollton Streetcar Facility State of Good Repair
35 Carrollton Facility State of Good Repair Board awarded contract for A&E Services in August 2012 to Royal Engineering Notice to Proceed issued on September 5, 2012 Kick-off meeting was held on October 3, % Design has been completed and forwarded to FTA for review FTA approval received on June 20, 2013, now moving forward with Final Design Received 100% plans and specs Approval to solicit for construction at March 2014 Board Meeting Bidding process pending with bids due end of April 2014 Bidding process resulted in only one bid over budget, June 24, 2014 Board Meeting to Reject and Resolicit Engineers Plans and Specifications out for bids, bids due December 18, 2014 Notice To Proceed (NTP) was issued on February 26, 2016 Construction Kick Off Meeting was held on February 25, 2016
36
37
38
39
40 FEMA PROGRESS April 26, 2016
41 FEMA Status - Katrina Number of PW s 116 FEMA Estimate of Repairs - $118,300, Total Estimate of Repairs (with insurance) - $130,691, Reimbursements to Date from State - $109,234, State PW Close-out Team from Baton Rouge working with us to complete process Request to Solicit for Consultant Services to Assist with Close Out Process at June 24, 2014 Board Meeting Currently 111 PW s in close out with 99 closed and 11 in final close out process August 2015 Requesting Board to Award a Not-to-exceed contract with GOTECH, Inc. to complete outstanding issues with FEMA
42 Infrastructure End of Report
43 MARCH 2016 FINANCIALS April 26, 2016 Ronald G. Baptiste, Jr.
44 Month of March Year-to-Date March ACTUAL BUDGET VARIANCE ACTUAL ACTUAL BUDGET VARIANCE ACTUAL OPERATING REVENUES $ 1,614,890 $ 1,618,679 $ (3,789) $ 1,660,603 Passenger Revenue $ 4,395,514 $ 4,382,256 $ 13,258 $ 4,544,316 4,757,743 5,079,261 (321,518) 5,810,136 General Use Sales Tax 15,087,653 15,409,171 (321,518) 15,467, , ,082 (34,138) 403,640 Hotel/Motel Sales Tax 1,316,129 1,350,267 (34,138) 1,147, , ,984 45, ,023 State Motor Vehicle Sales Tax 1,451,800 1,406,188 45,612 1,941, , ,886 17, ,813 Other Revenue 848, ,175 16, ,137 $ 7,878,757 $ 8,174,892 $ (296,135) $ 8,620,214 TOTAL OPERATING REVENUES $ 23,099,281 $ 23,380,057 $ (280,776) $ 23,527,789 OPERATING REVENUES $ 18,478 $ 42,835 $ 24,357 $ 15,669 Labor and Fringe Benefits $ 51,010 $ 121,755 $ 70,745 $ 45,769 6,090,102 6,248, ,803 5,732,272 Services 17,754,529 18,127, ,953 16,757, , , , ,532 Materials and Supplies 498, , , , , ,774 6, ,422 Utilities 328, ,742 34, , , ,224 68, ,393 Casualty & Liability 1,536,849 1,743, ,820 1,681,176 33,547 32,850 (697) 27,495 Taxes 83,019 93,500 10,481 70,589 5,327 17,166 11,839 3,702 Miscellaneous 15,907 52,341 36,434 12,530 $ 6,985,627 $ 7,380,993 $ 395,366 $ 6,691,484 TOTAL OPERATING REVENUES $ 20,268,215 $ 21,460,662 $ 1,192,447 $ 19,539,618 $ 893,130 $ 793,899 $ 99,231 $ 1,928,730 NET OPERATING REVENUE $ 2,831,065 $ 1,919,395 $ 911,670 $ 3,988,171
45 Month of March Year-to-Date March ACTUAL BUDGET VARIANCE ACTUAL ACTUAL BUDGET VARIANCE ACTUAL TMSEL LEGACY COSTS $ 133,333 $ 133,334 $ 1 $ 166,666 TMSEL Pension Costs $ 399,999 $ 400,000 $ 1 $ 500,000 75, , , ,972 TMSEL Health Benefit Costs 409, , , ,784 33,165 41,666 8, ,455 TMSEL Workers' Comp. Costs 232, ,000 (107,357) 210,590 61,783 61,334 (449) 51,656 TMSEL All Other Costs 170, ,000 13, ,388 $ 303,890 $ 462,102 $ 158,213 $ 448,748 TMSEL LEGACY COSTS $ 1,212,271 $ 1,386,300 $ 174,029 $ 1,298,762 $ 589,240 $ 331,797 $ 257,443 $ 1,479,981 NET REVENUE $ 1,618,795 $ 533,095 $ 1,085,700 $ 2,689,410 (Before Operating Assistance) MARITIME OPERATIONS $ 247,406 $ (611,094) $ 97,549 $ 130,842 Passenger Fares $ 465,873 $ 438,424 $ 27,449 $ 461,300 (828,943) (611,094) 217,849 (794,869) Services (1,944,557) (1,787,723) 156,834 (1,642,195) (28,784) (57,992) (29,208) (42,236) Materials and Supplies (75,079) (175,351) (100,272) (76,508) (96) (108) (12) (96) Other Operating Expenses (274) (327) (53) (172) (51,707) (51,707) 0 0 Grant Expenses (175,781) (175,781) (83,567) Preventive Maintenance ,475 41,365 41, Grant Revenues 140, , , ,678 91, ,926 State Subsidy 1,589,194 1,560,133 29,060 1,064,100 $ 0 $ 0 $ (0) $ 0 TOTAL MARITIME OPERATIONS $ - $ 0 $ - $ 0
46 Month of March Year-to-Date March ACTUAL BUDGET VARIANCE ACTUAL ACTUAL BUDGET VARIANCE ACTUAL GOVERNMENT OPERATING ASST. $ 934,187 $ 883,582 $ 50,605 $ 550,122 Preventive Maintenance $ 2,701,350 $ 2,650,745 $ 50,605 $ 2,254, , , ,036 State Parish Transportation 491, ,775 30, ,108 8,117 3,788 4,329 36,435 Federal - Other 21,662 11,364 10,298 95,697 4,166 4, Other State Funds 11,646 12,500 (854) 20,302 $ 1,100,394 $ 1,045,461 $ 54,933 $ 771,525 TOTAL GOV'T. OPERATING ASST. $ 3,226,543 $ 3,136,384 $ 90,159 $ 2,922,217 $ 1,689,634 $ 1,377,258 $ 312,376 $ 2,251,506 NET REVENUE $ 4,845,338 $ 3,669,479 $ 1,175,859 $ 5,611,626 (after Government Operating Asst.) GOV'T NON-OPERATING REV. (EXP.) $ 504,371 $ 1,260,760 $ (756,389) $ 510,383 Federal - Capital $ 640,692 $ 3,063,538 $ (2,422,846) $ 1,109,740 2,012,690 3,007,596 (994,906) 2,561,677 Local - Capital 4,029,524 9,022,788 (4,993,264) 4,834,749 (2,653,567) (4,583,544) 1,929,977 (3,153,512) Capital Expenditures (4,708,369) (12,788,819) 8,080,450 (6,923,196) FEMA Insurance Reimbursement , ,157 (862,440) 3,769 FEMA Project Worksheets 14,647 2,628,473 (2,613,826) 136,482 (888) (876,157) 875,270 (5,405) FEMA Project Worksheet Expenditures (888) (2,628,473) 2,627,586 (133,745) $ (123,676) $ (315,188) $ 191,512 $ (83,088) TOTAL GOV'T NON-OPER. REV. (EXP.) $ (24,393) $ (702,493) $ 678,100 $ (975,970) $ 1,565,958 $ 1,062,070 $ 503,888 $ 2,168,418 TOTAL REVENUE (EXPENSE) BEFORE $ 4,820,945 $ 2,966,986 $ 1,853,959 $ 4,635,656 CAPITAL EXPENDITURES AND DEBT
47 Month of March Year-to-Date March ACTUAL BUDGET VARIANCE ACTUAL ACTUAL BUDGET VARIANCE ACTUAL CAPITAL EXPENDITURES $ 63,672 $ 15,000 $ 48,672 $ 62,110 Interest Income - Capital (bonds) $ 168,711 $ 45,000 $ 123,711 $ 172,038 (411,967) (417,933) 5,966 (434,917) Capital Interest Expense (1,226,480) (1,253,799) 27,319 (1,296,669) (110,380) (110,379) (1) (117,945) Interest from Disaster Borrowing (331,139) (331,139) 0 (353,836) $ (458,675) $ (513,312) $ 54,637 $ (490,753) TOTAL CAPITAL EXPENDITURES $ (1,388,908) $ (1,539,938) $ 151,030 $ (1,478,467) PRINCIPAL ON LONG TERM DEBT $ (531,168) $ (531,168) $ (0) $ (516,143) Principal on Long Term Debt $ (1,062,337) $ (1,593,505) $ 531,168 $ (1,032,286) (170,621) (170,621) 0 (163,054) Principal on Disaster Borrowing (341,242) (511,863) 170,622 (326,108) $ (701,789) $ (701,789) $ (0) $ (679,197) TOTAL PRINCIPAL ON L-TERM DEBT $ (1,403,578) $ (2,105,368) $ 701,790 $ (1,358,394) OTHER FUNDING SOURCES $ 0 $ 0 $ 0 $ 0 BP OPA Settlement $ 0 $ 0 $ 0 $ 0 (405,494) 153, ,525 (998,468) Restricted Operating / Capital Reserve (2,028,458) 678,320 2,706,778 (1,798,795) $ (405,494) $ 153,031 $ 558,525 $ (998,468) TOTAL OTHER FUNDING $ (2,028,458) $ 678,320 $ 2,706,778 $ (1,798,795) $ 0 $ 0 $ 0 $ 0 NET OPERATING REVENUE $ 0 $ 0 $ 0 $ 0

48 PROCUREMENT REPORT April 26, 2016
49 Operations Status Update April 26, 2016 Safety Ridership On Time Performance Call Center ADA 49
50 Chargeable Accidents Per 100,000 Miles Mar-16 YTD Goal Actual Actual Bus Rail Para Contributing factors to Fixed Route Vehicle accident statistics. Multiple detours and construction throughout the system diverting vehicles from normal routes. Passenger vehicles making left turns into path of on coming streetcars. Fixed objects leading cause of chargeable bus accidents. Tools being implemented to help deduce accidents Mirror stations Diminishing clearance course (Wall Street) Random ride along with operators. Safety & Operation staff early morning presence and personal safety messages. Safety messages over the radio system to each mode 50
51 PRODUCTIVITY (BOARDINGS PER HOUR) Mar YTD Goal Actual Actual Bus Rail Para
52 ON-TIME PERFORMANCE Goal Mar-16 Actual 2016 YTD Actual Bus 85.00% 74.90% 74.8% Rail 85.00% 67.30% 70.7% Para 90.00% 85.15% 87.6% 86% of all lines experienced detours or service interruptions. 6.1% Bus and 7.8% of Streetcar trips ran early. 52


53 March Service Impacts -- Service Disruptions: 23 Lines -- Short Term Detours: 3 Lines -- Long Term Detours: 4 Lines 53
54 Call Center Customer Service Standards Goal Mar-16 Actual YTD Actual Time on Hold <5 Minutes 1:53 1:38 Missed Calls 9.29% 9.02% 7.83% Ride-Line received 17,643 calls in March Ride-Line answered 16,052 calls in March 1,591 calls abandoned in March 90.98% Calls answered and 9.02% Calls abandoned. 54
55 Rideline Extended Hours Rideline extended service hours went into effect on April 17, 2016 with the start of the service increase Rideline extended hours: Weekdays 5:00am Midnight Weekends 5:00am 11:00pm 425 calls received during extended weekend hours (13.28 calls per hour) 205 calls received during extended weekday hours (8.2 calls per hour) Ironman triathlon on April 17, 2016 required detouring of the 32 Leondias, 51 St. Anthony, 52 Paris Ave, 57 Franklyn, 60 Hayne, 62 Morris, 84 Galvez, 88 St. Claude, 90 Carrollton,91 Jackson-Esplanade, 94 Broad 55

56 French Quarter Festival During the four day period of French Quarter Festival system wide 241,000 passengers carried compared with 223,247 in 2015 an 8.3% increase year over year No Customer Complaints received in Rideline associated with the French Quarter Festival service. 56
57 Up Coming Events Jazz Fest Thursday April 28- May 1, 2016 Bayou Boogaloo, Friday May 20-22, 2016 Greek Festival, May 27-29, 2016 New Orleans Oyster Festival, June 4-5, 2016 French Creole Tomato Festival, June 11-12, 2016 Essence Festival, June 30 July3,
58 April 17, 2016 Service Increase 32 Operators hired and trained associated with the April 17, 2016 service increase 18 additional Operators to be hired by mid-june bring the total number of new Operators to 50 From April1-21, 2016 training sessions on the new service made available to all employees All Operations Administrative staff along with Road Supervisors worked Sunday April 17, 2016 the first day of service increase at major locations throughout the system giving out schedules and talking with Customers about service enhancements Signage was placed at new stop locations one week prior to service change and new schedules delivered to all Libraries (All current time table green) 16,00 Service enhancement brochures distributed throughout the system 58
59 April 17, 2016 Service Increase Customer Feedback Broad line in Michoud adjusted to better service both Einstein Schools on morning and afternoon trips. Louisa line enhancements have received both positive and negative feedback about the bus operating on Stephen Girard between Press and Congress. We are in the process of scheduling a meeting to hear and better understand the issue New Orleans East Express late trips are being held five minutes at Desire Parkway and Chef Hwy (Winn Dixie) to connect with the late night Broad Service Airport Express is experiencing ridership to and from both the north terminal construction site and the main terminal building 59
60 ADA Report 60
61 ID CENTER STATS Provided service to 752 individuals 307 ID cards were issued (86 Senior, 86 Medicare, 110 ADA and 25 Fixed Route Disabled) Eligibility received 173 applications, approved 101, denied 38 and mailed reduced fare applications were also received and processed. 95,876 individuals paid $0.40 discount fare on fixed route 5,034 ADA certified clients rode free on the fixed route. There were 2,037 wheelchair passengers, 6,581 bike riders. 61
62 Paratransit Report March 2016 Paratransit stats: Trips requested = 24,919 Trips Completed = 18,779 Total Passengers = 19,101 Total hours = 11,036 On-Time Performance 88.14% Trips Cancelled = 6150 Trips Denied = 0 Active Clients = 1,270 62


63 THE END Cleaner, Smarter
64 St. Bernard Route 52 Route/Hour 5:00 6:00 7:00 8:00 9:00 10:00 11:00 12:00 1:00 2:00 3:00 4:00 5:00 6:00 7:00 8:00 9:00 10:00 11:00 Total St. Bernard- St. Anthony (IB) 100% 96% 81% 80% 90% 77% 94% 3 89% 71% 68% 25% 84% 68% 81% 57% 95% 77% - 79% St. Bernard- St. Anthony (OB) 100% 90% 72% 70% 69% 90% 45% 80% 71% 90% 64% 57% 63% 95% 57% 86% 80% 81% 36% 74% Total 100% 93% 78% 74% 78% 84% 81% 81% 77% 79% 67% 47% 71% 78% 74% 78% 86% 79% 36% 77% St. Bernard on time performance is adversely affected by number of schools along route during AM and PM school travel times. Ben Franklin, Lake Area High School, McDonogh 35, Holy Cross, St. Augustine, J.S. Clark UNO peak dismissal time between 3pm 4pm
65 St. Bernard Route 52 What is changing: Simplify St. Bernard routes so that they run on one main street. Trips outside of peak periods would be better coordinated with the 94 Broad to ease transfers. Overnight service is added on Line 52. To ensure hourly round trip service, line 52 buses would turn at Robert E. Lee Boulevard. Late night service to UNO is proposed to be provided n Line 55 Elysian Fields. The route for Line 52 would be changed slightly to run all of Paris Avenue between St. Bernard Avenue and Le on C. Simon Drive. Line 52 would no longer turn onto Mirabeau Avenue or St. Anthony Avenue. It would instead continue up Paris Avenue to Robert E. Lee Boulevard and Leon C. Simon Drive. The route name for Line 52 would be changed from 52 St. Bernard St. Anthony to 52 St. Bernard Paris.

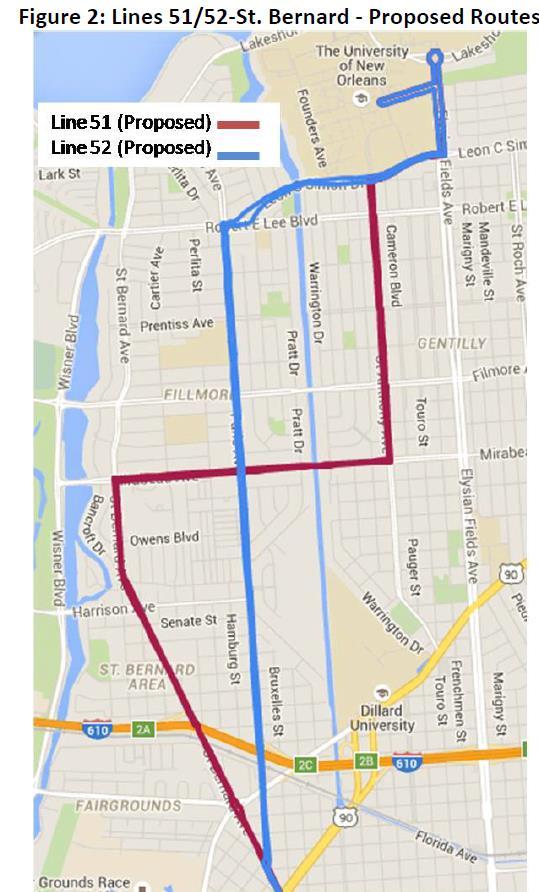
66 St. Bernard Route 52
REGIONAL TRANSIT AUTHORITY BOARD OF COMMISIONERS MAY 27, 2014 FERRY PRESENTATION
 REGIONAL TRANSIT AUTHORITY BOARD OF COMMISIONERS MAY 27, 2014 FERRY PRESENTATION Two Agreements Effective February 16, 2014 1. LADOTD and RTA CEA A) Operating Subsidy Funds B) Ferry Capital Funds C) Ferry
Board Box. October Item # Item Staff Page 1. Key Performance Indicators Sep 2018 M. Mungia Financial Report Aug 2018 H.
 Board Box October 2018 Item # Item Staff Page 1. Key Performance Indicators Sep 2018 M. Mungia 2-10 2. Financial Report Aug 2018 H. Rodriguez 11-15 ITEM 1 October 31, 2018 TO: FROM: RE: BOARD OF DIRECTORS
Sound Transit Operations December 2014 Service Performance Report. Ridership
 Ridership Total Boardings by Mode Mode Dec-13 Dec-14 % YTD-13 YTD-14 % ST Express 1,266,130 1,396,787 10.3% 16,605,299 17,661,976 6.4% Sounder 248,710 285,016 14.6% 3,035,735 3,361,317 10.7% Tacoma Link
Performance Measures Year End Updated-
 Performance Measures Year End 2017 -Updated- Priorities and Objectives 1. Earn and Retain the Community s Trust 2. Provide Excellent Customer Service 3. Enable Organizational Success 4. Exemplify Financial
MONTHLY OPERATIONS REPORT SEPTEMBER 2015
 MONTHLY OPERATIONS REPORT SEPTEMBER 215 Table of Contents SEPTEMBER 215 Section Page September Highlights... 3 Strategic Goals Progress Update... 4 Ridership... 6 Revenue... 9 Expenses... 1 System Summary...
Sound Transit Operations August 2015 Service Performance Report. Ridership
 Ridership Total Boardings by Mode Mode Aug-14 Aug-15 % YTD-14 YTD-15 % ST Express 1,534,241 1,553,492 1.3% 11,742,839 12,354,957 5.2% Sounder 275,403 326,015 18.4% 2,139,086 2,463,422 15.2% Tacoma Link
MONTHLY OPERATIONS REPORT DECEMBER 2015
 MONTHLY OPERATIONS REPORT DECEMBER 215 Table of Contents DECEMBER 215 Section Page December Highlights... 3 Strategic Goals Progress Update... 4 Ridership... 6 Revenue... 9 Expenses... 1 System Summary...
RIDERSHIP TRENDS. October 2017
 RIDERSHIP TRENDS October 2017 Prepared by the Division of Strategic Capital Planning December 2017 Table of Contents Executive Summary...1 Ridership...3 Estimated Passenger Trips by Line...3 Estimated
MONTHLY REPORT JUNE 2017
 & MONTHLY REPORT JUNE 2017 SECTION Sun Tran & Sun Van Monthly Operations Report Table of Contents June 2017 PAGE I.System Highlights and Accomplishments 3-10 II.Sun Tran a.ridership 11 b.revenue 12 c.pass
MONTHLY REPORT SEPTEMBER 2017
 & MONTHLY REPORT SEPTEMBER 2017 SECTION Sun Tran & Sun Van Monthly Operations Report Table of Contents September 2017 PAGE I.System Highlights and Accomplishments 3-10 II.Sun Tran a.ridership 11 b.revenue
MONTHLY REPORT OCTOBER 2017
 & MONTHLY REPORT OCTOBER SECTION Sun Tran & Sun Van Monthly Operations Report Table of Contents October PAGE I.System Highlights and Accomplishments 3-11 II.Sun Tran a.ridership 12 b.revenue 13 c.pass
2017/ Q1 Performance Measures Report
 2017/2018 - Q1 Performance Measures Report Contents Ridership & Revenue... 1 Historical Revenue & Ridership... 1 Revenue Actual vs. Planned... 3 Mean Distance Between Failures... 5 Maintenance Cost Quarter
Capital Metropolitan Transportation Authority. Monthly Performance Report
 Capital Metropolitan Transportation Authority Monthly Performance Report AUGUST 2010 Ridership Report August 23, 2010 Budget to Actual Ridership Budget Target: 2,290,590 Actual: 2,300,796 Ridership Comparison
Sound Transit Operations January 2017 Service Performance Report. Ridership. Total Boardings by Mode
 January 217 Service Performance Report Ridership ST Express Sounder Tacoma Link Link Paratransit Jan-16 Jan-17 % 1,433,7 1,3,33 4.9% 331,27 7,121 98,411 3,633 Total Boardings by Mode 363,6 74,823 1,76,914
MONTHLY REPORT MAY 2017
 & MONTHLY REPORT MAY 2017 SECTION Sun Tran & Sun Van Monthly Operations Report Table of Contents May 2017 PAGE I.System Highlights and Accomplishments 3-10 II.Sun Tran a.ridership 11 b.revenue 12 c.pass
Sound Transit Operations March 2018 Service Performance Report. Ridership
 March 218 Service Performance Report Ridership Total Boardings by Mode Mar-17 Mar-18 % YTD-17 YTD-18 % ST Express 1,622,116 1,47,79-4.6% 4,499,798 4,428,14-1.6% Sounder 393,33 39,6.% 1,74,96 1,163,76 8.3%
Sound Transit Operations January 2014 Service Performance Report. Ridership
 Ridership Total Boardings by Mode Mode Jan-13 Jan-14 % YTD-13 YTD-14 % ST Express 1,343,290 1,426,928 6.2% 1,343,290 1,426,928 6.2% Sounder 245,135 256,775 4.7% 245,135 256,775 4.7% Tacoma Link 86,229
Sound Transit Operations January 2018 Service Performance Report. Ridership
 January 218 Service Performance Report Ridership Total Boardings by Mode Jan-17 Jan-18 % YTD-17 YTD-18 % ST Express 1,3,33 1,7,91.3% 1,3,33 1,7,91.3% Sounder 367,33 416,8 13.3% 367,33 416,8 13.3% Tacoma
RIDERSHIP TRENDS. August 2018
 RIDERSHIP TRENDS August Prepared by the Division of Strategic Capital Planning October Table of Contents Executive Summary...1 Ridership...3 Estimated Passenger Trips by Line...3 Estimated Passenger Trips
Sound Transit Operations February 2018 Service Performance Report. Ridership
 February 218 Service Performance Report Ridership Total Boardings by Mode Feb-17 Feb-18 % YTD-17 YTD-18 % ST Express 1,373,96 1,372,88 -.1% 2,877,294 2,88,719.1% Sounder 314,96 32,187 11.9% 681,923 768,69
MONTHLY REPORT AUGUST 2017
 & MONTHLY REPORT AUGUST SECTION Sun Tran & Sun Van Monthly Operations Report Table of Contents August PAGE I.System Highlights and Accomplishments 3-10 II.Sun Tran a.ridership 11 b.revenue 12 c.pass Sales
RIDERSHIP TRENDS. January 2018
 RIDERSHIP TRENDS January 2018 Prepared by the Division of Strategic Capital Planning March 2018 Table of Contents Executive Summary...1 Ridership...3 Estimated Passenger Trips by Line...3 Estimated Passenger
Sound Transit Operations June 2016 Service Performance Report. Ridership
 Ridership Total Boardings by Mode Mode Jun-15 Jun-16 % YTD-15 YTD-16 % ST Express 1,622,222 1,617,420-0.3% 9,159,934 9,228,211 0.7% Sounder 323,747 361,919 11.8% 1,843,914 2,099,824 13.9% Tacoma Link 75,396
PERFORMANCE REPORT NOVEMBER 2017
 PERFORMANCE REPORT NOVEMBER 2017 Note: New FY2018 Goal/Target/Min or Max incorporated in the Fixed Route and Connection Dashboards. Keith A. Clinkscale Performance Manager INTRODUCTION/BACKGROUND In June
Bristol Virginia Transit
 Bristol Virginia Transit 1 Transit Overview Bristol Virginia Transit (BVT) is a Federally Funded and certified urban area transit system. BVT began operation in its current form in 1982. In Fiscal Year
ARLINGTON COUNTY, VIRGINIA. County Board Agenda Item Meeting of February 22, 2014
 ARLINGTON COUNTY, VIRGINIA County Board Agenda Item Meeting of February 22, 2014 DATE: January 23, 2014 SUBJECT: Request to authorize advertisement of a public hearing to consider an ordinance amending
Service Cost Estimate for Route 10 only
 2009-2011 Service Cost Estimate for Route 10 only The City of Ashland buys down the fare on Route 10 for each passenger riding in Ashland, therefore service cost estimates are based on recent ridership
PERFORMANCE REPORT DECEMBER Performance Management Office
 PERFORMANCE REPORT DECEMBER 2018 Performance Management Office INTRODUCTION/BACKGROUND Performance Management Office FIXED ROUTE DASHBOARD FY 2019 Safety Max Target Goal Preventable Collisions per 100k
2017/2018 Q3 Performance Measures Report. Revised March 22, 2018 Average Daily Boardings Comparison Chart, Page 11 Q3 Boardings figures revised
 2017/2018 Q3 Performance Measures Report Revised March 22, 2018 Average Daily Boardings Comparison Chart, Page 11 Q3 Boardings figures revised Contents Ridership & Revenue... 1 Historical Revenue & Ridership...
Board Box. February Item # Item Staff Page 1. Key Performance Indicators M. Thompson Financial Report for Dec H.
 Board Box February 2016 Item # Item Staff Page 1. Key Performance Indicators M. Thompson 2-8 2. Financial Report for Dec. 2015 H. Rodriguez 9-13 ITEM 1 February 15, 2016 TO: FROM: RE: BOARD OF DIRECTORS
PERFORMANCE REPORT JANUARY Keith A. Clinkscale Performance Manager
 PERFORMANCE REPORT JANUARY 2018 Keith A. Clinkscale Performance Manager INTRODUCTION/BACKGROUND Keith A. Clinkscale Performance Manager FIXED ROUTE DASHBOARD JANUARY 2018 Safety Max Target Goal Preventable
Canal Street Ferry Terminal Design Presentation and Pedestrian Bridge Public Input Session. Facilitated by Bill Rouselle, Bright Moments, LLC
 7:45 Canal Street Ferry Terminal Design Presentation and Pedestrian Bridge Public Input Session Facilitated by Bill Rouselle, Bright Moments, LLC Canal Street Ferry Terminal Design Presentation 6:00pm-6:30pm
Why we re here: For educational purposes only
 Transportation 2050 Why we re here: For educational purposes only Transportation 2050 Bus Elements PUBLIC TRANSIT DEPARTMENT City of Phoenix Citizens Committee on the Future of Phoenix Transportation (CCFPT)
Sound Transit Operations March 2017 Service Performance Report. Ridership. Total Boardings by Mode
 March 217 Service Performance Report Ridership ST Express Sounder Tacoma Link Link Paratransit Mar-16 Mar-17 % 1,83,4 1,621,49 2.4% 37,496 82,631 1,264,47 3,821 Total Boardings by Mode 389,98 87,39 1,89,43,297
PERFORMANCE REPORT DECEMBER 2017
 PERFORMANCE REPORT DECEMBER 2017 Note: New FY2018 Goal/Target/Min or Max incorporated in the Fixed Route and Connection Dashboards. Keith A. Clinkscale Performance Manager INTRODUCTION/BACKGROUND Keith
COLTS Complementary ADA Paratransit Service. Special Efforts Accessibility Transportation Service (SEATS) SEATS Trip Tips (570)
 SEATS Trip Tips (570)") COLTS Complementary ADA Paratransit Service Special Efforts Accessibility Transportation Service (SEATS) SEATS Trip Tips (570) 963-6795 June, 2016 1 Welcome to SEATS!!! COLTS provides Complementary ADA
COLTS Complementary ADA Paratransit Service Special Efforts Accessibility Transportation Service (SEATS) SEATS Trip Tips (570) 963-6795 June, 2016 1 Welcome to SEATS!!! COLTS provides Complementary ADA
FIXED ROUTE Operating Statistics For Periods Ending 9/30/2008 & 9/30/2009
 FIXED ROUTE Operating Statistics For Periods Ending 9/30/2008 & 9/30/2009 CURRENT MONTH YEAR TO DATE Actual Actual Variance Actual Actual Variance 2008 2009 2008 to 2009 2008 2009 2008 to 2009 Service
January 2018 Air Traffic Activity Summary
 January 2018 Air Traffic Activity Summary Jan-2018 Jan-2017 CY-2018 CY-2017 Passengers 528,947 505,421 4.7% 528,947 505,421 4.7% Passengers 537,332 515,787 4.2% 537,332 515,787 4.2% Passengers 1,066,279
METRO OPERATIONS COMMITTEE
 Los Angeles County Metropolitan Transportation Authority Item 1 CHIEF OPERATIONS OFFICER S S REPORT METRO OPERATIONS COMMITTEE Lonnie Mitchell Chief Operations Officer May 19, 20 1 Employee Recognition
DTTAS Quarterly Aviation Statistics Snapshot Quarter Report
 Contents DTTAS Quarterly Aviation Statistics Snapshot Quarter 1 2018 Report 1.1 Dublin Airport Key Statistics... 1 1.2 Cork Airport Key Statistics... 3 1.3 Shannon Airport Key Statistics... 5 1.4 Total
DTTAS Quarterly Aviation Statistics Snapshot Quarter Report
 Contents DTTAS Quarterly Aviation Statistics Snapshot Quarter 3 2018 Report 1.1 Dublin Airport Key Statistics... 1 1.2 Cork Airport Key Statistics... 3 1.3 Shannon Airport Key Statistics... 5 1.4 Total
JANUARY 2017 BOARD INFORMATION PACKAGE
 JANUARY 2017 BOARD INFORMATION PACKAGE MEMORANDUM TO: Members of the Airport Authority FROM: Lew Bleiweis, Executive Director DATE: January 13, 2017 Financial Report (document) Informational Reports: A.
Att. A, AI 46, 11/9/17
 Total s San Diego Metropolitan Transit System POLICY 42 PERFORMANCE MONITORING REPORT Page 1 of 6 Date: 11/8/17 OBJECTIVE Develop a Customer-Focused and Competitive System The following measures of productivity
Date: 11/6/15. Total Passengers
 Total San Diego Metropolitan Transit System POLICY 42 PERFORMANCE MONITORING REPORT Page 1 of 6 OBJECTIVE Develop a Customer-Focused and Competitive System The following measures of productivity and service
MONTHLY REPORT DECEMBER 2017
 & MONTHLY REPORT DECEMBER 2017 SECTION Sun Tran & Sun Van Monthly Operations Report Table of Contents December 2017 PAGE I.System Highlights and Accomplishments 3-12 II.Sun Tran a.ridership 13 b.revenue
LODI CITY COUNCIL Carnegie Forum 305 West Pine Street, Lodi
 TM LODI CITY COUNCIL Carnegie Forum 305 West Pine Street, Lodi "SHIRTSLEEVE" SESSION Date: March 26, 2019 Time: 7:00 a.m. *and via conference call: 1311 Midvale Road Lodi, CA 95240 For information regarding
Recommendations for Funding Water, Sewer and Drainage Systems. Presentation to the Citizens and Businesses of New Orleans January 2012
 Recommendations for Funding Water, Sewer and Drainage Systems Presentation to the Citizens and Businesses of New Orleans January 2012 Sewerage & Water Board of New Orleans www.swbno.org 2 Agenda Opening
PUBLIC NOTICE The Greater Boise Auditorium District will hold a Regular Board Meeting on Thursday, December 20, 2018 at 2 p.m. Boise Centre West Room
 PUBLIC NOTICE The Greater Boise Auditorium District will hold a Regular Board Meeting on Thursday, December 20, 2018 at 2 p.m. Boise Centre West Room 200 GREATER BOISE AUDITORIUM DISTRICT REGULAR BOARD
 SCHEDULE OF REVENUES BY SOURCE September 1, 2015 - May 31, 2016 CV Transit District State Administered Program Transit Transit Aging Local Toll Total Total Excess Revenue Grant No Grant Name Federal Federal
Fiscal Management and Control Board. Fare Policy October 16, Draft for Discussion & Policy Purposes Only
 Fiscal Management and Control Board Fare Policy October 16, 2015 1 Components of Fares Fare Level Different types of pricing by: By mode By time of day By distance By rider type (reduced fare) Subscription
JANUARY 2018 BOARD INFORMATION PACKAGE
 JANUARY 2018 BOARD INFORMATION PACKAGE MEMORANDUM TO: Members of the Airport Authority FROM: Lew Bleiweis, Executive Director DATE: January 19, 2018 Financial Report (document) Informational Reports: A.
CWC LA - Cash Balance (January 2012)
") CWC LA - Cash Balance 2012-13 (January 2012) 1,200,000 Cash Balance 1,000,000 800,000 ($1,000s) 600,000 400,000 200,000 - CWC LA - Actuals/Projected CWC LA - ed (Nov) 1 1 CWC Hollywood - Financial Dashboard
CWC LA - Cash Balance 2012-13 (January 2012) 1,200,000 Cash Balance 1,000,000 800,000 ($1,000s) 600,000 400,000 200,000 - CWC LA - Actuals/Projected CWC LA - ed (Nov) 1 1 CWC Hollywood - Financial Dashboard
Alexandria Transit Company Board of Directors Meeting
 Alexandria Transit Company Board of Directors Meeting Meeting Agenda Wednesday, May 10, 2017 5:30 p.m. Alexandria City Hall: City Council Workroom - #2410 #1 Public Comment #2 Consideration of Meeting
Bus Operations Report
 Third Quarter FY 216 (January 1 - March 31, 216) Wednesday April 27, 216 Operations Ridership: 783,194 passengers used in the third quarter. This represents a 2% increase over the same period in FY 215.
Capital Metropolitan Transportation Authority. Monthly Performance Report
 Capital Metropolitan Transportation Authority Monthly Performance Report SEPTEMBER 2010 Ridership Report Budget to Actual Ridership Budget Target: 2,335,906 Actual: 2,291,235 Ridership Comparison Fiscal
Factors that Affect Fixed-Route Ridership Frequency Connections and accessibility Travel time Travel cost Service area coverage Reliability
 The transit industry defines ridership as the number of passengers who board public transportation vehicles called unlinked passenger trips. Ridership measures transit utilization at the system, route,
Rides Mass Transit District. Jackson County Mass Transit District. FY 2020 Program of Projects (POP) Carbondale UZA
 Carbondale UZA") Rides Mass Transit District Jackson County Mass Transit District FY 2020 Program of Projects (POP) Carbondale UZA General Rides Mass Transit District (RMTD) is the public transportation provider for the
Rides Mass Transit District Jackson County Mass Transit District FY 2020 Program of Projects (POP) Carbondale UZA General Rides Mass Transit District (RMTD) is the public transportation provider for the
ESCAMBIA COUNTY AREA TRANSIT MTAC REPORT
 ESCAMBIA COUNTY AREA TRANSIT MTAC REPORT November 8, 2017 Meeting Escambia County Area Transit 1515 W. Fairfield Drive Pensacola, FL 32501 850-595-3228 INTRODUCTION 2 Summary Background MTAC ECAT Benchmarks
PRELIMINARY ACCOUNTS FOR 2012
 INTERIM REPORT FOR Q4 2012 AND INTERIM REPORT FOR Q4 2012 AND PRELIMINARY ACCOUNTS FOR 2012 HIGHLIGHTS Q4 with growth in volume and improved normalized EBITDA MNOK 261 improvement in normalized EBITDA
APRIL 2016 BOARD INFORMATION PACKAGE
 APRIL 2016 BOARD INFORMATION PACKAGE MEMORANDUM TO: Members of the Airport Authority FROM: Lew Bleiweis, Executive Director DATE: April 8, 2016 Financial Report (document) Informational Reports: A. February,
SEPTEMBER 2015 BOARD INFORMATION PACKAGE
 SEPTEMBER 2015 BOARD INFORMATION PACKAGE MEMORANDUM TO: Members of the Airport Authority FROM: Lew Bleiweis, Executive Director DATE: September 11, 2015 Financial Report (document) Informational Reports:
Interim Management Report First Half Results 2010/11. October 29, 2010
 Interim Management Report First Half Results 2010/11 October 29, 2010 Disclaimer Certain information included in these statements is forward-looking and involves risks and uncertainties that could cause
Hard Labor Creek State Park Business Plan. Table of Contents
 Hard Labor Creek State Park Business Plan Table of Contents Georgia State Parks and Historic Sites Executive Summary Site Name Site Manager Region Manager Hard Labor Creek State Park Daniel Schay Eric
Fare Policy Discussion Background and History
 Fare Policy Discussion Background and History Transportation Committee Nick Eull Senior Manager of Revenue Operations February 27 th, 2017 2013 Fare Policy Analysis Report Cross-functional group comprised
DTTAS Quarterly Aviation Statistics Snapshot Quarter Report
 Contents DTTAS Quarterly Aviation Statistics Snapshot Quarter 4 2015 Report 1.1 Dublin Airport Key Statistics... 1 1.2 Cork Airport Key Statistics... 3 1.3 Shannon Airport Key Statistics... 5 1.4 Total
Tallulah Gorge State Park Business Plan. Table of Contents
 Tallulah Gorge State Park Business Plan Table of Contents 2 Georgia State Parks and Historic Sites Executive Summary Site Name Tallulah Gorge State Park Site Manager Danny Tatum Region Manager Joe Yeager
Quarterly Report Transit Bureau, Local Transit Operations. First Quarter, Fiscal Year 2015 (July 2014 September 2014) ART & STAR
 ART & STAR") Quarterly Report Transit Bureau, Local Transit Operations First Quarter, Fiscal Year 2015 (July 2014 September 2014) ART & STAR A Arlington Transit ART 1) Introduction The purpose of ART is to provide
Quarterly Report Transit Bureau, Local Transit Operations First Quarter, Fiscal Year 2015 (July 2014 September 2014) ART & STAR A Arlington Transit ART 1) Introduction The purpose of ART is to provide
Establishes a fare structure for Tacoma Link light rail, to be implemented in September 2014.
 RESOLUTION NO. R2013-24 Establish a Fare Structure and Fare Level for Tacoma Link MEETING: DATE: TYPE OF ACTION: STAFF CONTACT: PHONE: Board 09/26/2013 Final Action Ric Ilgenfritz, Executive Director,
COMO Bus Service Evaluation DRAFT COA. September 19, 2016
 DRAFT COA September 19, 2016 Chapter 1 Introduction Introduction The City of Columbia Missouri unveiled COMO Connect in 2013 with the goal of changing how public transportation options were delivered in
VCTC Transit Ridership and Performance Measures Quarterly Report
 VCTC Transit Ridership and Performance Measures Quarterly Report Overview Quarter 2 Fiscal Year 2018-2019 This report provides performance measures for VCTC Intercity Bus Service covering the FY 2018-19
DRT Performance Measurement: the U.S. Experience
 DRT Performance Measurement: the U.S. Experience FOR ANYBODY GOING ANYWHER IN LA HABRA International Conference on Demand Responsive Transportation Breckenridge, Colorado September 2016 DRT Performance
More cruise nights and marginally improved result
 INTERIM REPORT FOR Q1 2011 HIGHLIGHTS More cruise nights and marginally improved result Pre-tax result improved by NOK 7 million from Q1 2010 8.6% more cruise nights improved the capacity utilization to
DEMOGRAPHICS AND EXISTING SERVICE
 EXECUTIVE SUMMARY The Central Corridor light-rail transit (LRT) project will open in 2014 and operate between downtown Minneapolis and downtown St. Paul, serving the University of Minnesota and University
Administrative Operations Report
 Fiscal Year 2017/18 Administrative Operations Report November 1, 2018 Prepared by: El Dorado County Transit Authority 6565 Commerce Way Diamond Springs, CA 95619 (530) 642-5383 www.eldoradotransit.com
Existing Services, Ridership, and Standards Report. June 2018
 Existing Services, Ridership, and Standards Report June 2018 Prepared for: Prepared by: Contents Overview of Existing Conditions... 1 Fixed Route Service... 1 Mobility Bus... 34 Market Analysis... 41 Identification/Description
FIXED ROUTE DASHBOARD JULY 2018
 FIXED ROUTE DASHBOARD JULY 2018 Safety Max Target Goal Preventable Collisions per 100k Miles Non-Preventable Collisions per 100k Miles Total Incidents per 10,000 Boardings 1.6 1.3 0.8 2.63 2.1 2.0 1.60
FY Transit Needs Assessment. Ventura County Transportation Commission
 FY 18-19 Transit Needs Assessment Ventura County Transportation Commission Contents List of Figures and Appendices.. 2 Appendices... 1 Chapter 1: Introduction What is the Ventura County Transportation
MERRIMACK VALLEY REGIONAL TRANSIT AUTHORITY (MVRTA) PERFORMANCE MEASURES: FIXED ROUTE
 PERFORMANCE MEASURES: FIXED ROUTE") PERFORMANCE MEASURES: FIXED ROUTE IT IS OUR GOAL TO IMPROVE FIXED ROUTE SERVICE ON ALL LEVELS, ON A CONTINUOUS BASIS. IN ORDER TO DO THIS, WE HAVE ESTABLISHED BENCHMARKS TO MEASURE PERFORMANCE. THIS INFORMATION
PERFORMANCE MEASURES: FIXED ROUTE IT IS OUR GOAL TO IMPROVE FIXED ROUTE SERVICE ON ALL LEVELS, ON A CONTINUOUS BASIS. IN ORDER TO DO THIS, WE HAVE ESTABLISHED BENCHMARKS TO MEASURE PERFORMANCE. THIS INFORMATION
Highway & Bridge Construction Market Update Southern Region
 Highway & Bridge Construction Market Update Southern Region Alison Premo Black, PhD ARTBA Senior VP & Chief Economist November 26, 2016 2016 ARTBA. All rights reserved. No part of this document may be
Message from the Director
 SUMMER 2014 TOGETHER WE CAN I C E I M P R O V E S E R V MAC MEETINGS The remaining 2014 METROLift Advisory Committee meetings will be held at: Metropolitan Multi-Service Center 1475 W. Gray Thursday, August
Front Carport Design Standards, Requirements & Application
 Front Carport Design Standards, Requirements & Application THIS PAGE INTENTIONALLY LEFT BLANK. Carport: A structure designed or used to shelter vehicles that is open on at least two sides. Carport shall
METRO FLEET FUNDING HUMAN RESOURCES
 2018 FACT SHEET METRO FLEET METRO s overall revenue-producing fleet totals 235 vehicles: 144 large buses and 91 smaller paratransit buses. Some passenger vehicles are equipped with a hydraulic lift to
With the completion of this project, we would like to follow-up on the projections as well as highlight a few other items:
 TO: FROM: Mayor and Council Interim City Manager Rebecca Underhill, Director of Finance DATE: February 28, 2014 SUBJECT: Water Meter Project Analysis On March 28, 2012, Acting City Manager Mike Loftin
Multi-Aero Inc. d/b/a Air Choice One
 Multi-Aero Inc. d/b/a Air Choice One Proposal to Provide Essential Air Service at Owensboro, Kentucky Docket DOT-OST-2000-7855 Direct Inquiries Regarding this Proposal to: Shane Storz, CEO Air Choice One
Item # 28. Chief Capital Management Officer Report. November 20, 2008
 Item # 28 Chief Capital Management Officer Report November 20, 2008 1 Metro Gold Line Eastside Extension Project Update November 2008 6 Mile Alignment 1.7 Miles of Tunnel 8 Stations (6 At-grade & 2 Underground)
BRIEFING Subject: 2017 Visitation Initiatives
 BRIEFING Subject: 2017 Visitation Initiatives Presented to: Council Submitted by: Adrian Field Date: June 12, 2017 Agenda #: 7.6 This report is submitted for council s information. BACKGROUND Reason for
ORANGE COUNTY TRANSPORTATION AUTHORITY. Go Local Fixed-Guideway Program History and Project Update. PowerPoint 3
 ORANGE COUNTY TRANSPORTATION AUTHORITY Go Local Fixed-Guideway Program History and Project Update PowerPoint 3 Santa Ana-Garden Grove Fixed Guideway Project OCTA Board of Directors September 26, 2011 Project
TRANSIT WINDSOR REPORT
 TRANSIT WINDSOR REPORT MISSION STATEMENT: PROVIDING SAFE, RELIABLE AND AFFORDABLE PUBLIC TRANSIT FOR THE COMMUNITY THROUGH CONTINUOUS IMPROVEMENT IN CUSTOMER CARE, ENVIRONMENTAL STEWARDSHIP AND EMPLOYEE
MAXIMIZING INVESTMENT AND UTILIZATION
 MAXIMIZING INVESTMENT AND UTILIZATION November 2013 Luis Ajamil Bermello, Ajamil & Partners Two perspectives How to increase use of the facility OPTIMIZATION How to improve the capacity of the facility
JET AIRWAYS (I) LTD. Presentation on Financial Results Q2 FY10
 LTD. Presentation on Financial Results Q2 FY10") JET AIRWAYS (I) LTD Presentation on Financial Results Q2 FY10 October 27, 2009 1 1 1 Agenda Domestic operating environment Jet Airways performance highlights JetLite performance highlights Outlook 2 2
JET AIRWAYS (I) LTD Presentation on Financial Results Q2 FY10 October 27, 2009 1 1 1 Agenda Domestic operating environment Jet Airways performance highlights JetLite performance highlights Outlook 2 2
Title VI Service Equity Analysis
 Pierce Transit Title VI Service Equity Analysis Pursuant to FTA Circular 4702.1B NE Tacoma Service May 2016 Pierce Transit Transit Development Dept. PIERCE TRANSIT TITLE VI SERVICE EQUITY ANALYSIS TABLE
AGENDA. Alaska Marine Highway System Background Data. Fiscal Year 2015 Look Forward. Dayboat Alaska Class Ferry Reservations & Manifest System
 AGENDA Alaska Marine Highway System Background Data Fiscal Year 2015 Look Forward Dayboat Alaska Class Ferry Reservations & Manifest System 2 MISSION STATEMENT DOT&PF: Keep Alaska moving through service
Note: These Louisiana indicators show the percentage difference from Second Quarter 2004 to Second Quarter 2005.
 Second Quarter 2005 The Louisiana Travel Pulse is a quarterly industry travel barometer designed to present recent trends in travel industry performance. This issue s emphasis is on the Second Quarter
Estimated operating transfers in - - 4,427, , ,538 4,845, , , ,664
 REVENUE, EXPENDITURES AND CHANGES IN FUND BALANCE ALL GOVERNMENTAL FUND TYPES YEAR ENDED JUNE 30, 2016 Camp Drug General General Brownfield West Dbn East Dbn Component Major Local Dearborn Law Designated
Estimated operating transfers in - - 2,679, , ,698,323 4,388, , ,810
 REVENUE, EXPENDITURES AND CHANGES IN FUND BALANCE ALL GOVERNMENTAL FUND TYPES YEAR ENDED JUNE 30, 2015 Camp Drug General General Brownfield West Dbn East Dbn Component Major Local Dearborn Law Designated
Metra Board of Directors. Board Meeting November 11, 2011
 Metra Board of Directors Board Meeting November 11, 2011 State of Metra Operations Metra Board of Directors November 11, 2011 Presented by George Hardwidge Deputy Executive Director Operations System On-Time
Cebu Air, Inc. 4 th Quarter and Full Year 2017 Results of Operations. cebupacificair.com
 Cebu Air, Inc. 4 th Quarter and Full Year 2017 Results of Operations cebupacificair.com Disclaimer The information provided in this presentation is provided only for your reference. Such information has
Providing public transportation since 1999 between Washington and Milwaukee Counties
 Providing public transportation since 1999 between Washington and Milwaukee Counties Background Information Started in 1999, funded by a three-year CMAQ grant. Employers and fare revenue covered local
Hampton Roads Express Lane Network
 More Choices For Travelers Hampton Roads Express Lane Network James Utterback, PMP Hampton Roads District Administrator Presented to HRTPO Board July 20, 2017 Regional Express Lane Network 2 History of
About This Report GAUGE INDICATOR. Red. Orange. Green. Gold
 ATTACHMENT A About This Report The Orange County Transportation Authority (OCTA) operates a countywide network of local, community, rail connector, and express bus routes serving over 6, bus stops. OCTA