With the completion of this project, we would like to follow-up on the projections as well as highlight a few other items:
|
|
|
- Colleen Martha Hicks
- 6 years ago
- Views:
Transcription
.")
1 TO: FROM: Mayor and Council Interim City Manager Rebecca Underhill, Director of Finance DATE: February 28, 2014 SUBJECT: Water Meter Project Analysis On March 28, 2012, Acting City Manager Mike Loftin submitted a memo to Mayor and Council in regards to the proposed Water Meter Replacement Project. (See attachment B for a copy of the memo). That memo contained, among other items, the following information: The total Water Meter Project cost for the replacement of current meters with Sensus meters A cost benefit analysis demonstrating the period of time required to recover the City s investment in the Sensus meters Projected savings expected to be realized with installation of the Sensus meters With the completion of this project, we would like to follow-up on the projections as well as highlight a few other items: Total Project Cost The total project cost including design, fiber, meters, and installation was estimated to be $9.94 million Total actual costs are estimated to be $9.29 million; a savings of $649,470
2 As detailed on this the bulk of the savings is from installation. This is a result of anticipating a greater number of the larger, more costly meters to be installed. In reality fewer of these meters and more of smaller, lower cost meters were installed. Item Budget Actual Actual (Over)/Under Budget $ $ 54,854 Design Contract $ 128,550 73,697 Fiber 56,200 56,200 - Meters 7,823,834 7,838,135 (14,301) Installation 1,740,502 1,264, ,982 Contingency 190,000 57, ,935 $ 9,939,086 $ 9,289,616 $ 649,470 Cost Benefit Evaluation Based on Actual Costs Initial phasing for this project, as approved in the FY12-16 CIP, was a two-year phasing in fiscal years 2013 and With savings negotiated from the initial cost of this project along with savings realized during the project, 90% of this project was completed in FY13 instead of phasing the project in two fiscal years. The $4.1 million in actual costs over the estimated cost in FY13 is a direct result of the project being completed in a little more than a year instead of the two-year period. The cost benefit analysis for this project provided to Council in March 2012 projected a total cumulative estimated cost of $23.6 million for both operating and capital costs over a 10 year period (FY13-22). With the project now completed along with accounting for actual costs in FY12 and FY13 and a more realistic budget for FY14, the projected cumulative cost over the 10 year period is now expected to be $21.1 million. (See attachment A for the detail of both the actual and estimated costs.) This is a savings of $2.5 million over the 10 year cumulative cost estimate that was presented to Council in March That report also projected savings of $4.17 million over the existing system; these updated costs increase that savings estimate to $6.67 million over ten years. SENSUS OPTION SENSUS Cumulative ACTUAL Cost Net Present Value SENSUS OPTION - ESTIMATE as Reported in March 2012 Actual Costs Over/(Under) Projected Costs FY2013 Actual Costs FY2014 Budget FY2015 FY2016 FY2017 FY2018 FY2019 FY2020 FY2021 FY2022 $10,856,507 $12,387,981 $13,434,175 $14,479,338 $15,539,940 $16,616,668 $17,709,999 $18,819,524 $19,945,825 $21,089,412 $6,801,827 $12,414,715 $13,749,365 $15,085,510 $16,442,347 $17,819,470 $19,217,415 $20,637,000 $22,077,443 $23,539,499 $4,054,680 ($26,735) ($315,190) ($606,172) ($902,407) ($1,202,803) ($1,507,416) ($1,817,476) ($2,131,618) ($2,450,087) Detail of Projected Savings Savings on contracted personnel: With the installation of the Sensus meters, a savings of $200,000 was projected in contracting additional personnel to assist with manual meter reads. This contract was reduced from $189,600 in FY2012 to $83,700 in
3 FY2013 and reduced even further in FY2014 with a budget of $2,500. Of the $200,000 projected in savings; we realized a savings of $187,000 over the two year period. Reduction in field personnel s system maintenance work: A savings of $15,000 was projected and realized in the system maintenance required of personnel in FY13. Reduction in number of Customer Service Technicians: With the efficiency of the Sensus meters, we have decreased our full-time equivalents for customer service technicians from five to four and continue to assess for additional reductions in the future Other Efficiencies worth Noting Faster Customer Service for our Citizens: Utilizing the Neptune meters, the length of time necessary to respond to a citizen s billing question was two to three days depending on the nature of the call and the need for the customer service technicians to physically re-read the meter. With the Sensus meters, the length of time to respond to a citizen s inquiry can now be minutes; in addition, we now have the ability to the citizen results and usage charts. Manual Meter Reads: With the efficiency of the Sensus meters over the Neptune meters, manual meter reads have decreased from a high of 9,482 manual reads in December 2012 to only 575 manual reads in December While total water customers continue to increase 3.2 percent, with efficiency of the Sensus meters manual meter reads have significantly decreased allowing our customer service technicians to be more efficient. 12,000 10,000 8,000 6,000 4,000 2,000 Manual Meter Reads vs. Total Water Customers Oct Nov Dec Jan 2012 Feb Mar Apr May Jun Jul Aug Sep Oct Nov Dec Jan 2013 Feb Mar Apr May Jun Jul Aug Sep Oct Nov Dec 30,000 29,500 29,000 28,500 28,000 27,500 27,000 26,500 Total Manual Reads Total Water Customers
4 Consistent Billing: In order to achieve consistent billing the goal is to bill 100 percent of all customers within a day billing cycle. Billing on a billing cycle has increased from a low in May 2012 of 32% to a high in December 2013 of 99%. 100% 90% 80% 70% 60% 50% 40% 30% 20% 10% 0% Standard Billing Percentages Goal: Bill 100% of customers on a day billing cycle 32% Oct Nov Dec Jan 2012 Feb Mar Apr May Jun Jul Aug Sep Oct Nov Dec Jan 2013 Feb Mar Apr May Jun Jul Aug Sep Oct Nov Dec 99% Attachments: A Detailed schedule of actual and estimated costs B Memo provided to Council in March 2012
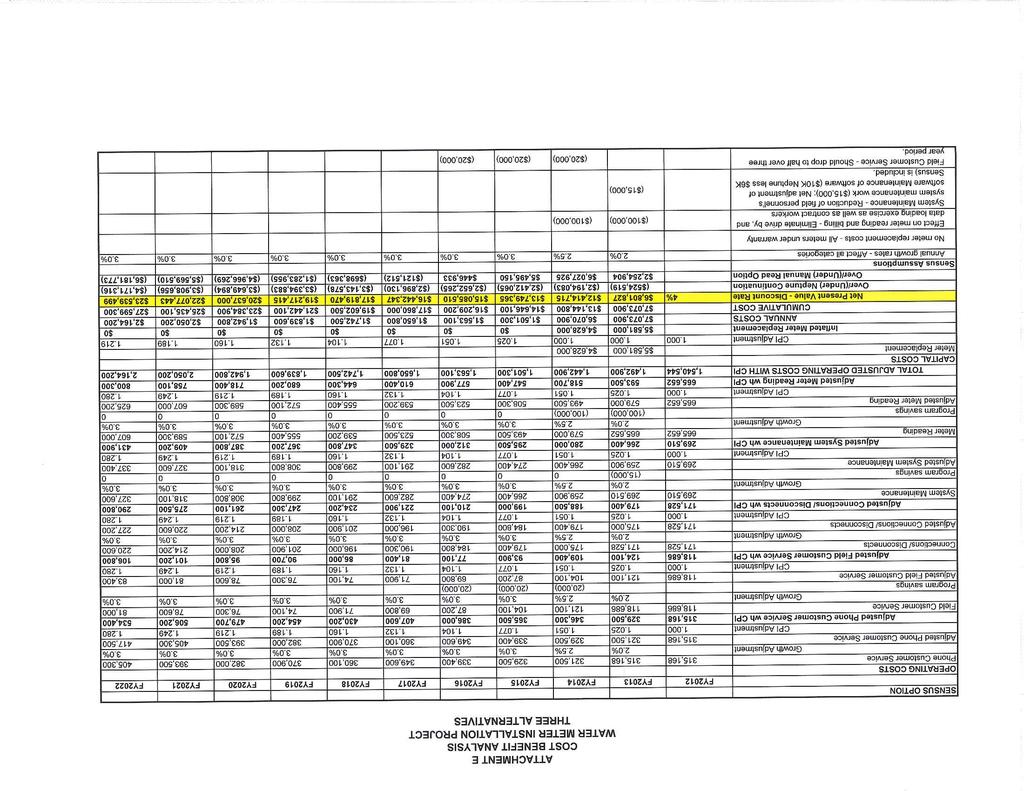
5 COST BENEFIT ANALYSIS WATER METER INSTALLATION PROJECT Attachment A SENSUS OPTION - Post Meter Project Completed Report FY2012 Actual Costs FY2013 Actual Costs FY2014 Budget FY2015 OPERATING COSTS Phone Customer Service 289, , , , , , , , , , ,700 Growth Adjustment 0.0% 3.0% 3.0% 3.0% 3.0% 3.0% 3.0% 3.0% 3.0% Adjusted Phone Customer Service 289, , , , , , , , , , ,100 CPI Adjustment Adjusted Phone Customer Service wh CPI 289, , , , , , , , , , ,500 Field Customer Service 129,565 96,074 78,176 78,200 60,500 42,300 43,600 44,900 46,200 47,600 49,000 Growth Adjustment 0.0% 3.0% 3.0% 3.0% 3.0% 3.0% 3.0% 3.0% 3.0% Program savings (20,000) (20,000) Adjusted Field Customer Service 129,565 96,100 78,200 60,500 42,300 43,600 44,900 46,200 47,600 49,000 50,500 CPI Adjustment Adjusted Field Customer Service wh CPI 129,565 96,100 78,200 62,000 44,500 47,000 49,600 52,300 55,200 58,300 61,600 Connections/ Disconnects 219, , , , , , , , , , ,900 Growth Adjustment 0.0% 3.0% 3.0% 3.0% 3.0% 3.0% 3.0% 3.0% 3.0% Adjusted Connections/ Disconnects 219, , , , , , , , , , ,600 CPI Adjustment Adjusted Connections/ Disconnects wh CPI 219, , , , , , , , , , ,700 System Maintenance 289, , , , , , , , , , ,300 Growth Adjustment 3.0% 3.0% 3.0% 3.0% 3.0% 3.0% 3.0% 3.0% Program savings Adjusted System Maintenance 289, , , , , , , , , , ,600 CPI Adjustment Adjusted System Maintenance wh CPI 289, , , , , , , , , , ,000 Meter Reading 595, , , , , , , , , , ,300 Growth Adjustment 0.0% 3.0% 3.0% 3.0% 3.0% 3.0% 3.0% 3.0% 3.0% Program savings Adjusted Meter Reading 595, , , , , , , , , , ,400 CPI Adjustment Adjusted Meter Reading wh CPI 595, , , , , , , , , , ,700 TOTAL ADJUSTED OPERATING COSTS WITH CPI 1,523,786 1,359,900 1,178,700 1,223,900 1,271,600 1,342,000 1,416,900 1,496,300 1,579,200 1,667,200 1,760,500 CAPITAL COSTS Meter Replacement Project $1,319,495 $7,426,413 $543,708 CPI Adjustment Inflated Meter Replacement $1,319,000 $7,426,000 $544,000 $0 $0 $0 $0 $0 $0 $0 $0 ANNUAL COSTS $2,842,786 $8,785,900 $1,722,700 $1,223,900 $1,271,600 $1,342,000 $1,416,900 $1,496,300 $1,579,200 $1,667,200 $1,760,500 CUMULATIVE COST $2,842,786 $11,628,686 $13,351,386 $14,575,286 $15,846,886 $17,188,886 $18,605,786 $20,102,086 $21,681,286 $23,348,486 $25,108,986 SENSUS Cumulative ACTUAL Cost Net Present Value 4% $10,856,507 $12,387,981 $13,434,175 $14,479,338 $15,539,940 $16,616,668 $17,709,999 $18,819,524 $19,945,825 $21,089,412 SENSUS OPTION - Cumulative ESTIMATE Cost Net Present Value As Reported in March 2012 $6,801,827 $12,414,715 $13,749,365 $15,085,510 $16,442,347 $17,819,470 $19,217,415 $20,637,000 $22,077,443 $23,539,499 Actual Costs Over/(Under) Projected Costs $4,054,680 ($26,735) ($315,190) ($606,172) ($902,407) ($1,202,803) ($1,507,416) ($1,817,476) ($2,131,618) ($2,450,087) Sensus Assumptions Annual growth rates - Affect all categories 3.0% 3.0% 3.0% 3.0% 3.0% 3.0% 3.0% 3.0% Discount Rate of 4% applied to cumulative costs No meter replacement costs; all meters under warranty Effect on meter reading and billing - Eliminate drive by, and data loading exercise as well as contract workers ($100,000) ($100,000) System Maintenance - Reduction of field personnel's system maintenance work ($15,000) ($15,000) Field Customer Service - Should drop to half over three year period. $0 ($20,000) ($20,000) NOTE: In order to obtain a realistic comparison of actual costs to estimated costs the actual costs above include costs associated with the purchase of water meters for new construction. FY2016 FY2017 FY2018 FY2019 FY2020 FY2021 FY2022
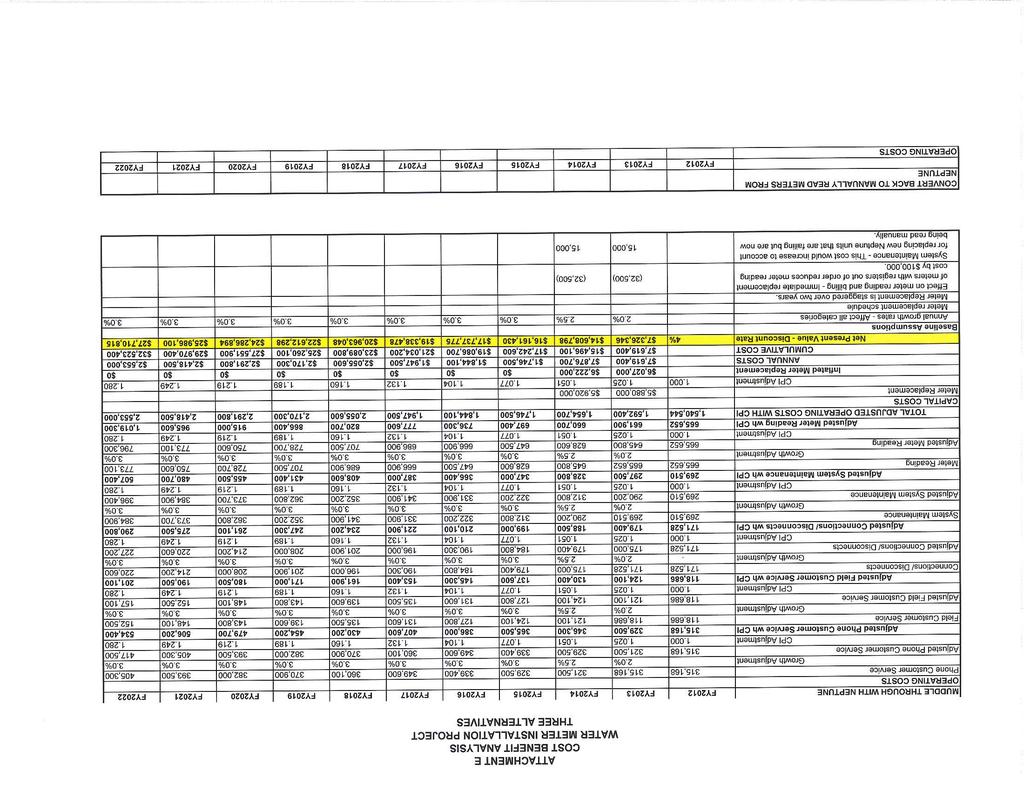
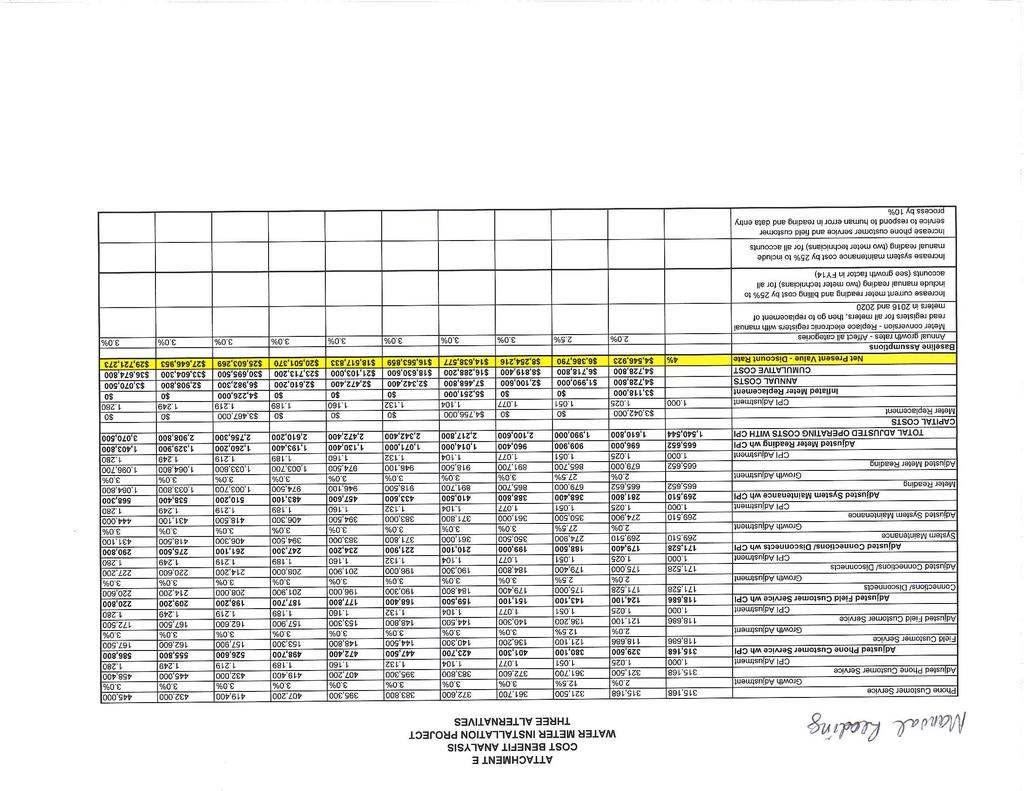
6 COST BENEFIT ANALYSIS WATER METER INSTALLATION PROJECT Attachment A SENSUS OPTION - As Reported in March 2012 FY2012 FY2013 FY2014 FY2015 FY2016 FY2017 FY2018 FY2019 FY2020 FY2021 FY2022 OPERATING COSTS Phone Customer Service 315, , , , , , , , , , ,300 Growth Adjustment 2.0% 2.5% 3.0% 3.0% 3.0% 3.0% 3.0% 3.0% 3.0% 3.0% Adjusted Phone Customer Service 315, , , , , , , , , , ,500 CPI Adjustment Adjusted Phone Customer Service wh CPI 315, , , , , , , , , , ,400 Field Customer Service 118, , , ,100 87,200 69,800 71,900 74,100 76,300 78,600 81,000 Growth Adjustment 2.0% 2.5% 3.0% 3.0% 3.0% 3.0% 3.0% 3.0% 3.0% 3.0% Program Savings (20,000) (20,000) (20,000) Adjusted Field Customer Service 118, , ,100 87,200 69,800 71,900 74,100 76,300 78,600 81,000 83,400 CPI Adjustment Adjusted Field Customer Service wh CPI 118, , ,400 93,900 77,100 81,400 86,000 90,700 95, , ,800 Connections/ Disconnects 171, , , , , , , , , , ,600 Growth Adjustment 2.0% 2.5% 3.0% 3.0% 3.0% 3.0% 3.0% 3.0% 3.0% 3.0% Adjusted Connections/ Disconnects 171, , , , , , , , , , ,200 CPI Adjustment Adjusted Connections/ Disconnects wh CPI 171, , , , , , , , , , ,800 System Maintenance 269, , , , , , , , , , ,600 Growth Adjustment 2.0% 2.5% 3.0% 3.0% 3.0% 3.0% 3.0% 3.0% 3.0% 3.0% Program Savings (15,000) Adjusted System Maintenance 269, , , , , , , , , , ,400 CPI Adjustment Adjusted System Maintenance wh CPI 269, , , , , , , , , , ,900 Meter Reading 665, , , , , , , , , , ,000 Growth Adjustment 2.0% 2.5% 3.0% 3.0% 3.0% 3.0% 3.0% 3.0% 3.0% 3.0% Program Savings (100,000) (100,000) Adjusted Meter Reading 665, , , , , , , , , , ,200 CPI Adjustment Adjusted Meter Reading wh CPI 665, , , , , , , , , , ,300 TOTAL ADJUSTED OPERATING COSTS WITH CPI 1,540,544 1,492,900 1,442,900 1,501,300 1,563,100 1,650,800 1,742,500 1,839,600 1,942,800 2,050,200 2,164,200 CAPITAL COSTS Meter Replacement $5,581,000 $4,628,000 CPI Adjustment Inflated Meter Replacement $5,581,000 $4,628,000 $0 $0 $0 $0 $0 $0 $0 $0 ANNUAL COSTS $7,073,900 $6,070,900 $1,501,300 $1,563,100 $1,650,800 $1,742,500 $1,839,600 $1,942,800 $2,050,200 $2,164,200 CUMULATIVE COST $7,073,900 $13,144,800 $14,646,100 $16,209,200 $17,860,000 $19,602,500 $21,442,100 $23,384,900 $25,435,100 $27,599,300 SENSUS Cumulative ESTIMATED Cost Net Present Value 4% As Reported in March 2012 $6,801,827 $12,414,715 $13,749,365 $15,085,510 $16,442,347 $17,819,470 $19,217,415 $20,637,000 $22,077,443 $23,539,499 Baseline Assumptions Annual growth rates - Affect all categories 2.0% 2.5% 3.0% 3.0% 3.0% 3.0% 3.0% 3.0% 3.0% 3.0% Discount Rate of 4% applied to cumulative costs No meter replacement costs - All meters under warranty Effect on meter reading and billing - Eliminate drive by, and data loading exercise as well as contract workers ($100,000) ($100,000) System Maintenance - Reduction of field personnel's system maintenance work ($15,000); Net adjustment of software Maintenance of software ($10K Neptune less $6K ($15,000) Sensus) is included. Field Customer Service - Should drop to half over three year period. ($20,000) ($20,000) ($20,000)
7
8
9
10
11
12
13
14
15
16
17
18
January 2018 Air Traffic Activity Summary
 January 2018 Air Traffic Activity Summary Jan-2018 Jan-2017 CY-2018 CY-2017 Passengers 528,947 505,421 4.7% 528,947 505,421 4.7% Passengers 537,332 515,787 4.2% 537,332 515,787 4.2% Passengers 1,066,279
Board Box. October Item # Item Staff Page 1. Key Performance Indicators Sep 2018 M. Mungia Financial Report Aug 2018 H.
 Board Box October 2018 Item # Item Staff Page 1. Key Performance Indicators Sep 2018 M. Mungia 2-10 2. Financial Report Aug 2018 H. Rodriguez 11-15 ITEM 1 October 31, 2018 TO: FROM: RE: BOARD OF DIRECTORS
2017/ Q1 Performance Measures Report
 2017/2018 - Q1 Performance Measures Report Contents Ridership & Revenue... 1 Historical Revenue & Ridership... 1 Revenue Actual vs. Planned... 3 Mean Distance Between Failures... 5 Maintenance Cost Quarter
PERFORMANCE REPORT NOVEMBER 2017
 PERFORMANCE REPORT NOVEMBER 2017 Note: New FY2018 Goal/Target/Min or Max incorporated in the Fixed Route and Connection Dashboards. Keith A. Clinkscale Performance Manager INTRODUCTION/BACKGROUND In June
October 2013 Passenger and Cargo Traffic Statistics Reno-Tahoe International Airport
 October 2013 Passenger and Cargo Traffic Statistics Reno-Tahoe International Airport December 4, 2013 U.S. DOMESTIC INDUSTRY OVERVIEW FOR OCTOBER 2013 All RNO Carriers Systemwide year over year comparison
U.S. DOMESTIC INDUSTRY OVERVIEW FOR MAY 2009
 Inter-Office Memo Reno-Tahoe Airport Authority Date: June 30, 2009 To: Statistics Recipients From: Krys T. Bart, A.A.E., President/CEO Subject: RENO-TAHOE INTERNATIONAL AIRPORT PASSENGER STATISTICS U.S.
U.S. DOMESTIC INDUSTRY OVERVIEW FOR MARCH
 Inter-Office Memo Reno-Tahoe Airport Authority Date: April 30, 2009 To: Statistics Recipients From: Krys T. Bart, A.A.E., President/CEO Subject: RENO-TAHOE INTERNATIONAL AIRPORT PASSENGER STATISTICS U.S.
Inter-Office Memo Reno-Tahoe Airport Authority
 Inter-Office Memo Reno-Tahoe Airport Authority Date: November 30, 2009 To: Statistics Recipients From: Krys T. Bart, A.A.E., President/CEO Subject: RENO-TAHOE INTERNATIONAL AIRPORT PASSENGER STATISTICS
DASHBOARD DEC YOUR MONTHLY UPDATE FOR IOWA ONE CALL
 Executive Summary Per the Board s request, we have added this Executive Summary to the Monthly Dashboard. We ll be including it from now on. It will provide you with a running total of the number of tickets
November 2013 Passenger and Cargo Traffic Statistics Reno-Tahoe International Airport
 November 2013 Passenger and Cargo Traffic Statistics Reno-Tahoe International Airport December 26, 2013 U.S. DOMESTIC INDUSTRY OVERVIEW FOR NOVEMBER 2013 All RNO Carriers Domestic Systemwide year over
Reno-Tahoe Airport Authority U.S. DOMESTIC INDUSTRY OVERVIEW FOR FEBRUARY
 Inter-Office Memo Reno-Tahoe Airport Authority Date: March 30, 2009 To: Statistics Recipients From: Krys T. Bart, A.A.E., President/CEO Subject: RENO-TAHOE INTERNATIONAL AIRPORT PASSENGER STATISTICS U.S.
December 2013 Passenger and Cargo Traffic Statistics Reno-Tahoe International Airport
 December 2013 Passenger and Cargo Traffic Statistics Reno-Tahoe International Airport January 24, 2014 U.S. DOMESTIC INDUSTRY OVERVIEW FOR DECEMBER 2013 All RNO Carriers Domestic Systemwide year over year
DTTAS Quarterly Aviation Statistics Snapshot Quarter Report
 Contents DTTAS Quarterly Aviation Statistics Snapshot Quarter 4 2015 Report 1.1 Dublin Airport Key Statistics... 1 1.2 Cork Airport Key Statistics... 3 1.3 Shannon Airport Key Statistics... 5 1.4 Total
DTTAS Quarterly Aviation Statistics Snapshot Quarter Report
 Contents DTTAS Quarterly Aviation Statistics Snapshot Quarter 1 2018 Report 1.1 Dublin Airport Key Statistics... 1 1.2 Cork Airport Key Statistics... 3 1.3 Shannon Airport Key Statistics... 5 1.4 Total
SJC North and South Flow
 SJC North and South Flow Pre and Post OAPM Date: January 2018 Phases of Flight ATCC ARTCC ATCC 2 AviationTerms VFR- Visual Flight Rules. Pilots must maneuver to avoid clouds and are responsible for their
March 2014 Passenger and Cargo Traffic Statistics Reno-Tahoe International Airport
 March 2014 Passenger and Cargo Traffic Statistics Reno-Tahoe International Airport April 25, 2014 U.S. DOMESTIC INDUSTRY OVERVIEW FOR MARCH 2014 All RNO Carriers Domestic Systemwide year over year comparison
SAS Group Q Teleconference
 SAS Group Q4 2012 Teleconference December 12, 2012 1 Break-even result in 2012 despite 1.6 bn SEK higher fuel cost 23 MSEK EBT (before non-recurring items) despite 1.6 bn SEK higher fuel cost Positive
Airport Noise Management System
 July Monthly Report Airport Noise Management System Chicago O Hare International Airport City of Chicago Department of Aviation Visit the Community Noise Resource Center on the Internet at www.flychicago.com
September 2013 Passenger and Cargo Traffic Statistics Reno-Tahoe International Airport
 September 2013 Passenger and Cargo Traffic Statistics Reno-Tahoe International Airport October 31, 2013 U.S. DOMESTIC INDUSTRY OVERVIEW FOR SEPTEMBER 2013 All RNO Carriers Systemwide year over year comparison
SIA GROUP FINANCIAL RESULTS
 FINANCIAL RESULTS For Ended 30 June 2018 197200078R Operating Result Q1 Q1 Better/ FY18/19 FY17/18 R1 (Worse) ($M) ($M) (%) Total Revenue 3,844 3,864 (0.5) Q1 Better/ FY17/18 R2 (Worse) ($M) (%) 3,689
Visit Wales Research Update
 Visit Wales Research Update 19 January 21 This update summarises tourism performance by drawing upon Visit Wales own research and information from other relevant sources. It is based upon information available
RIDERSHIP TRENDS. October 2017
 RIDERSHIP TRENDS October 2017 Prepared by the Division of Strategic Capital Planning December 2017 Table of Contents Executive Summary...1 Ridership...3 Estimated Passenger Trips by Line...3 Estimated
2017/2018 Q3 Performance Measures Report. Revised March 22, 2018 Average Daily Boardings Comparison Chart, Page 11 Q3 Boardings figures revised
 2017/2018 Q3 Performance Measures Report Revised March 22, 2018 Average Daily Boardings Comparison Chart, Page 11 Q3 Boardings figures revised Contents Ridership & Revenue... 1 Historical Revenue & Ridership...
SYSTEM BRIEF DAILY SUMMARY
 SYSTEM BRIEF SUMMARY * ANNUAL (PEAK HOURS 7:00 AM TO 10:00 PM MON-SAT) MaxTemp NEL (MWH) Hr Ending Hr Ending LOAD ENERGY (MWH) INCREMENTAL COST DAY DATE Civic TOTAL MAXIMUM @Max MINIMUM @Min FACTOR ON
Manual vs. Automatic Operation and Operational Restrictions
 Customer Services, Operations, and Safety Committee Board Information Item IV-B March 11, 2010 Manual vs. Automatic Operation and Operational Restrictions Page 81 of 91 Washington Metropolitan Area Transit
PRELIMINARY ACCOUNTS FOR 2012
 INTERIM REPORT FOR Q4 2012 AND INTERIM REPORT FOR Q4 2012 AND PRELIMINARY ACCOUNTS FOR 2012 HIGHLIGHTS Q4 with growth in volume and improved normalized EBITDA MNOK 261 improvement in normalized EBITDA
JANUARY 2017 BOARD INFORMATION PACKAGE
 JANUARY 2017 BOARD INFORMATION PACKAGE MEMORANDUM TO: Members of the Airport Authority FROM: Lew Bleiweis, Executive Director DATE: January 13, 2017 Financial Report (document) Informational Reports: A.
D_HO_V ER1 GL_ P03 GL_6030
 < EVDRE ID="BPC- CYB 001-00001"/>< EVDRE ID="BPC- CYF 004-00001"/>< EVDRE ID="BPC- CYF 001-00001"/>< C C_500377 6013-40.00000 00 6018-10.00000
Tourism Trends. Humphrey Walwyn Head of VisitEngland Research October 2018
 Tourism Trends Humphrey Walwyn Head of VisitEngland Research October 2018 1 England Research & Evaluation GBTS - Overnights (statutory research & official statistic) GBDVS - Day (statutory/ official) Occupancy
_VER1 CC_ PC_5000 FA_21500 C </CELL ><CELL> HO_ADJ 2015.P02 GL_6290 _VER1 GL_6010 PC_5000 FA_21500 C
 < EVDRE ID="Head count Roll Forward 001-00001"/>< EVDRE ID="BPC- CYB 004-00001"/>< EVDRE ID="BPC- CYB 001-00001"/>< EVDRE ID="BPC- CYF 004-00001"/>< EVDRE
Recommendations for Northbound Aircraft Departure Concerns over South Minneapolis
 Recommendations for Northbound Aircraft Departure Concerns over South Minneapolis March 21, 2012 Noise Oversight Committee Agenda Item #4 Minneapolis Council Member John Quincy Background Summer of 2011
RENO-TAHOE INTERNATIONAL AIRPORT APRIL 2008 PASSENGER STATISTICS
 Inter-Office Memo Reno-Tahoe Airport Authority Date: June 5, 2008 To: Statistics Recipients From: Tom Medland, Director Air Service Business Development Subject: RENO-TAHOE INTERNATIONAL AIRPORT PASSENGER
U.S. DOMESTIC INDUSTRY OVERVIEW FOR OCTOBER 2010 All RNO Carriers Systemwide year over year comparison
 Inter-Office Memo Reno-Tahoe Airport Authority Date: November 22, 2010 To: Chairman and Board of Trustees From: Krys T. Bart, A.A.E., President/CEO Subject: RENO-TAHOE INTERNATIONAL AIRPORT OCTOBER 2010
DTTAS Quarterly Aviation Statistics Snapshot Quarter Report
 Contents DTTAS Quarterly Aviation Statistics Snapshot Quarter 3 2018 Report 1.1 Dublin Airport Key Statistics... 1 1.2 Cork Airport Key Statistics... 3 1.3 Shannon Airport Key Statistics... 5 1.4 Total
APRIL 2016 BOARD INFORMATION PACKAGE
 APRIL 2016 BOARD INFORMATION PACKAGE MEMORANDUM TO: Members of the Airport Authority FROM: Lew Bleiweis, Executive Director DATE: April 8, 2016 Financial Report (document) Informational Reports: A. February,
AUGUST 2008 MONTHLY PASSENGER AND CARGO STATISTICS
 Inter-Office Memo Reno-Tahoe Airport Authority Date: October 2, 2008 To: Statistics Recipients From: Tom Medland, Director Air Service Business Development Subject: RENO-TAHOE INTERNATIONAL AIRPORT PASSENGER
May 2011 Passenger and Cargo Traffic Statistics Reno-Tahoe International Airport
 May 2011 Passenger and Cargo Traffic Statistics Reno-Tahoe International Airport July 5, 2011 U.S. DOMESTIC INDUSTRY OVERVIEW FOR MAY 2011 All RNO Carriers Systemwide year over year comparison Average
RIDERSHIP TRENDS. January 2018
 RIDERSHIP TRENDS January 2018 Prepared by the Division of Strategic Capital Planning March 2018 Table of Contents Executive Summary...1 Ridership...3 Estimated Passenger Trips by Line...3 Estimated Passenger
JANUARY 2018 BOARD INFORMATION PACKAGE
 JANUARY 2018 BOARD INFORMATION PACKAGE MEMORANDUM TO: Members of the Airport Authority FROM: Lew Bleiweis, Executive Director DATE: January 19, 2018 Financial Report (document) Informational Reports: A.
MARKET NEWSLETTER No 57 January 2012
 OVERVIEW OF INTRA-EUROPEAN UNION TRADING BETWEEN 2007/08 AND 2010/11 The data on intra-eu trade reported in this month s newsletter have been taken from the EUROSTAT database. However, it is important
PERFORMANCE REPORT JANUARY Keith A. Clinkscale Performance Manager
 PERFORMANCE REPORT JANUARY 2018 Keith A. Clinkscale Performance Manager INTRODUCTION/BACKGROUND Keith A. Clinkscale Performance Manager FIXED ROUTE DASHBOARD JANUARY 2018 Safety Max Target Goal Preventable
SAN LUIS OBISPO COUNTY REGIONAL AIRPORT ANNUAL AIRLINE PASSENGER SUMMARY SUMMARY BY YEAR AND MONTH 4/11/2018
 ANNUAL AIRLINE PASSENGER SUMMARY SUMMARY BY YEAR AND MONTH 4/11/ JAN FEB MAR IL E Y T 35,023 36,435 38,282 38,390 37,848 35,589 38,325 37,433 32,324 31,169 32,771 33,627 30,978 24,586 23,382 2017 24,586
DISTRICT EXPRESS LANES ANNUAL REPORT FISCAL YEAR 2017 JULY 1, 2016 JUNE 30, FloridaExpressLanes.com
 DISTRICT EXPRESS LANES ANNUAL REPORT FISCAL YEAR 2017 JULY 1, 2016 JUNE 30, 2017 FloridaExpressLanes.com This page intentionally left blank. TABLE OF CONTENTS List of Figures... ii List of Tables.... ii
Airport Capacity, Airport Delay, and Airline Service Supply: The Case of DFW
 Airport Capacity, Airport Delay, and Airline Service Supply: The Case of DFW Faculty and Staff: D. Gillen, M. Hansen, A. Kanafani, J. Tsao Visiting Scholar: G. Nero and Students: S. A. Huang and W. Wei
Sound Transit Operations January 2014 Service Performance Report. Ridership
 Ridership Total Boardings by Mode Mode Jan-13 Jan-14 % YTD-13 YTD-14 % ST Express 1,343,290 1,426,928 6.2% 1,343,290 1,426,928 6.2% Sounder 245,135 256,775 4.7% 245,135 256,775 4.7% Tacoma Link 86,229
PERFORMANCE REPORT DECEMBER 2017
 PERFORMANCE REPORT DECEMBER 2017 Note: New FY2018 Goal/Target/Min or Max incorporated in the Fixed Route and Connection Dashboards. Keith A. Clinkscale Performance Manager INTRODUCTION/BACKGROUND Keith
Performance Measures Year End Updated-
 Performance Measures Year End 2017 -Updated- Priorities and Objectives 1. Earn and Retain the Community s Trust 2. Provide Excellent Customer Service 3. Enable Organizational Success 4. Exemplify Financial
Measures & Projections October 31, GoToBermuda.com
 Measures & Projections October 31, 2015 GoToBermuda.com October Total Vacation Visitor Arrivals Vacation Arrivals Oct-14 Oct-15 2015 Air Vacation 9,203 10,344 1,141 12.40 126,842 127,044 202 0.16 Cruise
Keflavik International Airport Passenger forecast 2018
 Keflavik International Airport Passenger forecast 2018 2 Keflavik International Airport Passenger forecast Keflavik International Airport 2018 3 Passenger Forecast 2018 Forecast 2018 6,409,312 3,971,969
Kentucky Lock Project Update Inland Waterways Users Board Meeting No. 84
 Kentucky Lock Project Update Inland Waterways Users Board Meeting No. 84 MR. DON GETTY PROJECT MANAGER Kentucky Lock Addition Nashville District 19 July 2017 The views, opinions and findings contained
Air Berlin PLC AGM 06 June 2013 London
 Air Berlin PLC AGM 06 June 2013 London airberlin a strong European carrier Market position as of 31 December 2012 No. 2 in core market: Germany / Austria / Switzerland No. 7 in Europe with 33.3 m guests
Industry Update. ACI-NA Winter Board of Directors Meeting February 3, 2016 Orlando, FL
 Industry Update ACI-NA Winter Board of Directors Meeting February 3, 2016 Orlando, FL U.S. & Canadian GDP 8% 6% 4% U.S.* Canada** Estimate by BEA as of 02/11/16 2% 0% -2% -4% -6% -8% -10% The U.S. economy
RIDERSHIP TRENDS. August 2018
 RIDERSHIP TRENDS August Prepared by the Division of Strategic Capital Planning October Table of Contents Executive Summary...1 Ridership...3 Estimated Passenger Trips by Line...3 Estimated Passenger Trips
Monthly SunPass Transponder Sales Inception to June 2012
 Monthly SunPass Transponder Sales Inception to June 2012 This graph shows the monthly SunPass transponder sales since inception. The significant increase in transponder sales during March 2004 is attributed
Consumer Price Index (CPI) March Consumer Price Index. March Contact Statistician: Phaladi Labobedi
 March Consumer Price Index. March Contact Statistician: Phaladi Labobedi") Consumer Price Index (CPI) March 2018 Consumer Price Index March 2018 Contact Statistician: Phaladi Labobedi Email: +267 3671300 March 2018 CPI 1 Published by STATISTICS BOTSWANA Private Bag 0024, Gaborone
Consumer Price Index (CPI) March 2018 Consumer Price Index March 2018 Contact Statistician: Phaladi Labobedi Email: +267 3671300 March 2018 CPI 1 Published by STATISTICS BOTSWANA Private Bag 0024, Gaborone
Airport Noise Management System
 4 th Quarter 2009 Quarterly Report Airport Noise Management System City of Chicago Department of Aviation Visit the Community Noise Resource Center on the Internet at www.flychicago.com Airport Noise Management
January 2014 Passenger and Cargo Traffic Statistics Reno-Tahoe International Airport
 January 2014 Passenger and Cargo Traffic Statistics Reno-Tahoe International Airport March 12, 2014 U.S. DOMESTIC INDUSTRY OVERVIEW FOR DECEMBER 2013 All RNO Carriers Domestic Systemwide year over year
Residents ensure increase on overnight stays in hotels and similar establishments
 13 July 2018 Tourism Activity May 2018 Residents ensure increase on overnight stays in hotels and similar establishments Hotels and similar establishments registered 2.0 million guests and 5.4 million
PERFORMANCE REPORT DECEMBER Performance Management Office
 PERFORMANCE REPORT DECEMBER 2018 Performance Management Office INTRODUCTION/BACKGROUND Performance Management Office FIXED ROUTE DASHBOARD FY 2019 Safety Max Target Goal Preventable Collisions per 100k
December 2012 Passenger and Cargo Traffic Statistics Reno-Tahoe International Airport
 December 2012 Passenger and Cargo Traffic Statistics Reno-Tahoe International Airport January 29, 2013 U.S. DOMESTIC INDUSTRY OVERVIEW FOR DECEMBER 2012 All RNO Carriers Systemwide year over year comparison
The number of passengers using city transport increases 2.2% in December as compared with the same month of the previous year
 9 February 2009 Passenger Transport Statistics December 2008. Provisional data The number of passengers using city transport increases 2.2% in December as compared with the same month of the previous year
Presentation on Results for the 2nd Quarter FY Idemitsu Kosan Co.,Ltd. November 14, 2018
 Presentation on Results for the 2nd Quarter FY 2018 Idemitsu Kosan Co.,Ltd. November 14, 2018 Table of Contents 1. FY 2018 2nd Quarter Financials (1) Overview (2) Segment Information 2. Reference Materials
I T N E T R E N R A N T A I T ON O AL A L A R A R R I R VA V L A S L S A N A D N D D E D PA
 INTERNATIONAL ARRIVALS AND DEPARTURES July 2015 Government of Tonga SD18M-36 Statistical Bulletin Month of Change from Change from July 2015 Number previous month previous year All Arrivals 8,252-28.0
August 2014 Passenger and Cargo Traffic Statistics Reno-Tahoe International Airport
 August 2014 Passenger and Cargo Traffic Statistics Reno-Tahoe International Airport October 8, 2014 U.S. DOMESTIC INDUSTRY OVERVIEW FOR AUGUST 2014 All RNO Carriers Domestic Systemwide year over year comparison
Passenger and Cargo Statistics Report
 Passenger and Cargo Statistics Report RenoTahoe International Airport November 2017 U.S. DOMESTIC INDUSTRY OVERVIEW FOR NOVEMBER 2017 Systemwide RNO Carriers Domestic Flights year over year comparison
Results of Tourism Activity Mexico, February 2017
 Results of Tourism Activity Mexico, February Undersecretariat of Planning and Tourism Policy Available in http://www.datatur.sectur.gob.mx/sitepages/versionesrat.aspx DIRECTORy ENRIQUE DE LA MADRID CORDERO
Noise Oversight Committee
 Noise Oversight Committee July 22, 2015 Audio recordings are made of this meeting 1 Noise Oversight Committee July 22, 2015 Item 1 Review and Approve Draft Meeting Minutes Minutes from May 20, 2015 Noise
Performance Metrics for Oceanic Air Traffic Management. Moving Metrics Conference Pacific Grove, California January 29, 2004 Oceanic Metrics Team
 Performance Metrics for Oceanic Air Traffic Management Moving Metrics Conference Pacific Grove, California January 29, 2004 Oceanic Metrics Team Agenda Metrics Team Michele Merkle, FAA AUA-600 Lynne Hamrick,
FIXED ROUTE DASHBOARD JULY 2018
 FIXED ROUTE DASHBOARD JULY 2018 Safety Max Target Goal Preventable Collisions per 100k Miles Non-Preventable Collisions per 100k Miles Total Incidents per 10,000 Boardings 1.6 1.3 0.8 2.63 2.1 2.0 1.60
Main indicators kept growing
 September, 15 th 2016 Tourism Activity July 2016 Main indicators kept growing Hotel establishments recorded 2.1 million guests and 6.5 million overnight stays in July 2016, corresponding to year-onyear
Asheville Metro Economic Report 2014 Second Quarter
 Asheville Metro Economic Report Johnson Price Sprinkle PA HIGHLIGHTS: ASHEVILLE METRO The Asheville metro area gained 2,400 more jobs than one year earlier, averaging a growth rate of 1.4 percent, continuing
Hotel Association of North Texas. Karrie Keen Director, Destination and Trend Operations
 Hotel Association of North Texas Karrie Keen Director, Destination and Trend Operations To view this presentation, go to HotelNewsNow.com and click on Industry Analysis then Hotel data presentations. Agenda
CONSUMER PRICE INDEX December Statistics Botswana Private Bag 0024 Gaborone Botswana
 December Copyright 2018 @ Contact Statistician: Phaladi Labobedi Tel: 367 1300 Fax: 395 2201 1. CONSUMER PRICE INDEX December. Private Bag 0024 Gaborone Botswana Tel: (+267) 367 1300. Fax: (+267) 395 2201.
Significant increase in accommodation activity but slightly less than in the previous month
 Tourism activity February 2015 15 April, 2015 Significant increase in accommodation activity but slightly less than in the previous month Hotel establishments recorded approximately 2.2 million overnight
Airworthiness Analysis
 Airworthiness Analysis Question How many Approvals do Airworthiness oversee? 1000 1250 1400 Question How many Approvals do Airworthiness oversee? 1000 1250 1400 Question How many Q Pulse events did we
LOVE FIELD ENVIRONMENTAL ADVISORY COMMITTEE QUARTERLY REPORT. October December 2016
 LOVE FIELD ENVIRONMENTAL ADVISORY COMMITTEE QUARTERLY REPORT October December 2016 VOLUNTARY NOISE CONTROL PROGRAM COMPLIANCE DURING PREFERENTIAL HOURS 2100 0600 (JAN SEP 2016) 2 PERCENTAGE OF COMPLIANCE
Regional Economic Report July- September 2014
 Regional Economic Report July- September 2014 December 11, 2014 Outline I. Introduction II. Results July September 2014 A. Economic Activity B. Inflation C. Economic Outlook III. Final Remarks Introduction
December 2011 Passenger and Cargo Traffic Statistics Reno-Tahoe International Airport
 December 2011 Passenger and Cargo Traffic Statistics Reno-Tahoe International Airport January 27, 2012 U.S. DOMESTIC INDUSTRY OVERVIEW FOR DECEMBER 2011 All RNO Carriers Systemwide year over year comparison
MONTHLY OPERATIONS REPORT SEPTEMBER 2015
 MONTHLY OPERATIONS REPORT SEPTEMBER 215 Table of Contents SEPTEMBER 215 Section Page September Highlights... 3 Strategic Goals Progress Update... 4 Ridership... 6 Revenue... 9 Expenses... 1 System Summary...
Board of Directors Information Summary
 Regional Public Transportation Authority 302 N. First Avenue, Suite 700, Phoenix, Arizona 85003 602-262-7433, Fax 602-495-0411 Board of Directors Information Summary Agenda Item #6 Date July 11, 2008 Subject
CWC LA - Cash Balance (January 2012)
") CWC LA - Cash Balance 2012-13 (January 2012) 1,200,000 Cash Balance 1,000,000 800,000 ($1,000s) 600,000 400,000 200,000 - CWC LA - Actuals/Projected CWC LA - ed (Nov) 1 1 CWC Hollywood - Financial Dashboard
CWC LA - Cash Balance 2012-13 (January 2012) 1,200,000 Cash Balance 1,000,000 800,000 ($1,000s) 600,000 400,000 200,000 - CWC LA - Actuals/Projected CWC LA - ed (Nov) 1 1 CWC Hollywood - Financial Dashboard
HOTEL INDUSTRY OVERVIEW. Texas
 HOTEL INDUSTRY OVERVIEW Texas DEMAND GROWTH STRONG BALANCED OCC & ADR GROWTH % Change Room Supply* 149M 1.3% Room Demand* 92M 5.6% Occupancy 61.6% 4.3% A.D.R. $90 4.4% RevPAR $55 8.9% Room Revenue* $8.3B
EKH Quarterly Complaints and Enquiries report Q1 2018/19. Customer Feedback, Member Enquiries, Freedom of Information and Subject Access Requests
 EKH Quarterly Complaints and Enquiries report Q1 2018/19 Customer Feedback, Member Enquiries, Freedom of Information and Subject Access Requests Complaints and Enquiries Overview Q4 2017-18 Closed Q4 2017-18
Transit Performance Report FY (JUNE 30, 2007)
") Transit Performance Report FY 2006-2007 (JUNE 30, 2007) J ANUARY 2008 TRANSIT PERFORMANCE REPORT FY 2006 2007 (JUNE 30, 2007) Transit Performance Report I SSUED: JANUARY 2008 The Transit Performance Report
Transit Performance Report FY 2006-2007 (JUNE 30, 2007) J ANUARY 2008 TRANSIT PERFORMANCE REPORT FY 2006 2007 (JUNE 30, 2007) Transit Performance Report I SSUED: JANUARY 2008 The Transit Performance Report
VCTC Transit Ridership and Performance Measures Quarterly Report
 VCTC Transit Ridership and Performance Measures Quarterly Report Overview Quarter 2 Fiscal Year 2018-2019 This report provides performance measures for VCTC Intercity Bus Service covering the FY 2018-19
STATISTICAL BULLETIN ON MONTHLY MIGRATION STATISTICS DECEMBER 2016 SERIES NO. SDT: 39-M 55. Government of Tonga
 SERIES NO. SDT: 39-M 55 Government of Tonga STATISTICAL BULLETIN ON MONTHLY MIGRATION STATISTICS DECEMBER 2016 Statistics Department P.O. Box 149, Nuku alofa, Kingdom of Tonga Website: www.spc.int/prism/tonga/
BRAZIL INTERNATIONAL INBOUND TRAVEL MARKET PROFILE (2011) Copyright 2012 by the U.S. Travel Association. All Rights Reserved.
 Copyright 2012 by the U.S. Travel Association. All Rights Reserved.") BRAZIL INTERNATIONAL INBOUND TRAVEL MARKET PROFILE (211) Copyright 212 by the U.S. Travel Association. All Rights Reserved. EXECUTIVE SUMMARY With a population of nearly 2 million and a GDP exceeding $2
BRAZIL INTERNATIONAL INBOUND TRAVEL MARKET PROFILE (211) Copyright 212 by the U.S. Travel Association. All Rights Reserved. EXECUTIVE SUMMARY With a population of nearly 2 million and a GDP exceeding $2
Consumer Price Index. January Contact Statistician: Phaladi Labobedi Fax: January 2018 CPI 1
 Consumer Price Index January 2018 Contact Statistician: Phaladi Labobedi Email: +267 3671300 Fax: 3952201 January 2018 CPI 1 Published by STATISTICS BOTSWANA Private Bag 0024, Gaborone Tel: 3671300 Fax:
BUSINESS BAROMETER December 2018
 Credit: Chris Orange BUSINESS BAROMETER December Credit: Nigel Moore 1 Contents Summary of findings 3 Annual monthly performance: visitor attractions..4 Visit Herts Team update 5 National context.8 Visitor
Full Year 2009 Results
 Full Year 2009 Results 1 Antonio Vázquez Chairman & Chief Executive Officer 2 Highlights 2009 Strong decrease in revenues: weak demand and yield deterioration. High competition and drop of business traffic.
Analysts and Investors conference call. Q results. 15 May 2013
 Analysts and Investors conference call Q1 2013 results 15 May 2013 Management summary Key messages of Q1 2013 +6% +9% +3.3%p. Q1 2013 operational KPIs are in line with 109.7 116.2 6.5 7.1 82.3 85.6 expectations,
Sound Transit Operations June 2016 Service Performance Report. Ridership
 Ridership Total Boardings by Mode Mode Jun-15 Jun-16 % YTD-15 YTD-16 % ST Express 1,622,222 1,617,420-0.3% 9,159,934 9,228,211 0.7% Sounder 323,747 361,919 11.8% 1,843,914 2,099,824 13.9% Tacoma Link 75,396
Sound Transit Operations December 2014 Service Performance Report. Ridership
 Ridership Total Boardings by Mode Mode Dec-13 Dec-14 % YTD-13 YTD-14 % ST Express 1,266,130 1,396,787 10.3% 16,605,299 17,661,976 6.4% Sounder 248,710 285,016 14.6% 3,035,735 3,361,317 10.7% Tacoma Link
Existing Services, Ridership, and Standards Report. June 2018
 Existing Services, Ridership, and Standards Report June 2018 Prepared for: Prepared by: Contents Overview of Existing Conditions... 1 Fixed Route Service... 1 Mobility Bus... 34 Market Analysis... 41 Identification/Description
Implementation of SESAR Pilot Common Project. - expected effects
 Implementation of SESAR Pilot Common Project - expected effects (2014-2024) European Commission May 20, 2014 - Oslo 1 SESAR SESAR - Technological Pillar of the Single Technological pillar of the SES European
SEPTEMBER 2015 BOARD INFORMATION PACKAGE
 SEPTEMBER 2015 BOARD INFORMATION PACKAGE MEMORANDUM TO: Members of the Airport Authority FROM: Lew Bleiweis, Executive Director DATE: September 11, 2015 Financial Report (document) Informational Reports:
Significant increases in overnight stays and revenue
 15 April 2016 Tourism Activity February 2016 Significant increases in overnight stays and revenue Hotel establishments recorded 989.9 thousand guests and 2.6 million overnight stays in February 2016, the
SAMPLE CLIENT. PPC Performance Report. Google AdWords Performance Detail Text Ad Performance Comparisons & Trend Analysis Revenue Tracking Data
 SAMPLE CLIENT PPC Performance Report Included in this report: Google AdWords Performance Detail Text Ad Performance Comparisons & Trend Analysis Revenue Tracking Data SUGAR AND SPICE - AUGUST 213 2 4 8
Presentation on Results for the 2nd Quarter FY Idemitsu Kosan Co.,Ltd. November 1, 2016
 Presentation on Results for the 2nd Quarter FY 2016 Idemitsu Kosan Co.,Ltd. November 1, 2016 Table of Contents 1. 2nd Quarter FY 2016 Financials (1) Overview (2) Segment Information 2. Reference Materials
Implications of Construction Cost Escalation
 Implications of Construction Cost Escalation 2007 ACI-NA Economics and Finance Conference James Gill, CPA Deputy Airport Director Finance, Business & Administration Raleigh-Durham Airport Authority Presentation