MONTHLY REPORT OCTOBER 2017
|
|
|
- Meghan Patterson
- 5 years ago
- Views:
Transcription


1 & MONTHLY REPORT OCTOBER
2 SECTION Sun Tran & Sun Van Monthly Operations Report Table of Contents October PAGE I.System Highlights and Accomplishments 3-11 II.Sun Tran a.ridership 12 b.revenue 13 c.pass Sales 14 d.summary of Expenses 15 e.system Summary 16 f.annual Ridership 17 g.performance Indicators h.route Performance Profile 29 i.route Passenger Per Hour Ranking 30 j.customer Satisfaction 31 III.Sun Van a.ridership & Revenue Collection 32 b.summary of Expenses 33 c.system Summary d.annual Ridership 36 e.performance Indicators f.customer Satisfaction 43 IV.Glossaries
3 Sun Tran & Sun Van Strategic Goals Progress Update October In addition to highlighting major accomplishments and programs each month, this section communicates Sun Tran and Sun Van s ongoing efforts to achieve FY system goals and objectives. Provide Excellent Customer Service Sun Tran Customer Service Sun Tran s Customer Service Center answered 93.0 percent of the total number of calls received, the same as the previous month and a 2 percent increase over October Sun Tran experienced a 64.3 percent increase in compliments, when compared to the previous month. The number of complaints during the month decreased by 14.7 percent when compared to the previous month and decreased by 26.1 percent when compared to the same time last year. Customer Service Representatives met the established goal of answering at least 85 percent of total calls, keeping the average ring time at 14 seconds or less and keeping the calls at 90 seconds or less. These goals are to help ensure better service for the thousands of passengers who phone the call center. Sun Van Customer Calls Sun Van s Dispatch answered 86.8 percent of calls received during the month of October, a decrease of 0.8 percent from September, not reaching their goal of 88.5 percent, and a 3.9 percent decrease from October Reservations answered 96.1 percent of calls during the month of October, the same as the previous month, and the same when compared to October Spanish Reservations answered 95.4 percent of the calls received, a 0.1 percent decrease from September, and a 0.6 percent decrease from October Dispatch answered 15,888 calls. Reservations answered 16,848. Reservations Spanish answered 951 calls. In October 2016, Sun Van staff answered 17,297 in Dispatch, 17,422 in Reservations, and 904 in Spanish Reservations. 3
4 Sun Tran & Sun Van Strategic Goals Progress Update October The percentage of abandoned calls to Dispatch was 2.7 percent, not reaching the goal of less than 2.5 percent. Reservations abandoned calls were 1.8 percent, and Spanish Reservations abandoned calls were 2.4 percent, reaching their goal. On-time performance for the month of October was approximately 94.4 percent, not reaching our goal of 96 percent. Special Services Office Activity The Special Services staff assisted approximately 5,053 customers during the month of October. The daily average was 211 customers compared to 218 for the prior month of September. The daily average for October 2016 was 229. Staff issued a total of 2,724 SunGO ID & Cards during the month of October, compared to 2,521 issued in September and 2,880 issued in October Specifically, the cards issued in October were as follows: 1,998 low-income (513 replacements), 518 disabled (378 replacements), and 208 senior (81 replacement cards were issued.) Agents answered 3,008 calls on the English line or 88.9 percent calls answered, with 318 calls abandoned. The percent calls answered for English in October was higher than the prior month, which was 87.0 percent, and was higher by 4.8 percent from October We continue to monitor staffing needs to improve call statistics and decrease abandoned calls and wait times. Agents also answered 51 calls on the Spanish line with 98.1 percent calls answered with one call abandoned. The percent calls answered for Spanish in October was higher than the prior month in September, which was 97.1 percent, and higher than in October 2016, which was 96.1 percent. Ensure an Efficient and Effective Operation Sun Tran Maintenance Goals A total of 129 preventative maintenance inspections of Sun Tran buses were completed, with 100 percent on-time performance. A total of 14 preventative maintenance inspections of support vehicles were completed, with 100 percent ontime performance, and 28 A/C inspections of buses were completed, with 100 percent on-time performance. A total of 16 Quality Assurance Inspections were performed by Maintenance Managers and Supervisors. The active fleet for Garage 1 (South Yard) maintenance shop is 121 buses and the active fleet at Garage 2 (NW Facility) is 125 buses. The total active fleet for the month remains the same as the previous month at
5 Sun Tran & Sun Van Strategic Goals Progress Update October Warranty Goal For Fiscal Year, the goal is to reduce cumulative un-recovered warranty by $70,000. The monthly goal is $5, Warranty recovered during the month of October was $12, The cumulative warranty recovered through October was $52, The monthly and cumulative FY goal was met. Workforce Compliance On 10/24, contract negotiations between the company and the Sun Van bargaining unit employees started. Employee and Labor Relations On 10/3, 10/4 and 10/5, John Roslansky conducted a series of Labor Relations meetings with Supervisors and Managers at Sun Tran and Sun Van. Some of the topics covered were active listening, progressive corrective action, and employee/supervisor interaction. On 10/4, a bake sale was held at Sun Van. All employees were encouraged to bring in their best desserts and bake goods. The proceeds will be used to benefit all employees during the Christmas season. On 10/5, there was a Staff Meeting held at Sun Van. Some of the topics which were covered were September Road Checks with the bargaining unit employees, staff car mileage, and lift belt security. On 10/10, the HR Director attended a meeting with SHRM-GT (Society of Human Resources Managers of Greater Tucson). The topic covered was Small Acts Can Mean Big Problems: Handling Micro Aggressions in the Workplace. On 10/11, Accounting and HR reviewed the current Administrative Handbook and earmarked those areas that need further review. On 10/12, staff sent out the quarterly employee newsletter, SunXpress, to all Sun Tran and Sun Van employees. On 10/16. Sun Van initiated a New Hire Orientation class for eight Van Operators. On 10/17, Sun Tran conducted a New Hire Orientation class for Coach Operators. 5
6 Sun Tran & Sun Van Strategic Goals Progress Update October On 10/17 and 10/18, staff organized Flu Shot Clinics at Sun Tran and Sun Van. Eligible employees were able to get Flu shot vaccinations. On 10/22, new bids for Operators started, along with new schedules in the dispatch and reservations departments. These new schedules and bids will stay in effect until May. On 10/27, Accounting and Human Resources had a conference call with ADP to discuss the changes scheduled to start next month. On 10/30, seven Coach Operator trainees at Sun Tran were promoted to full-time drivers. Cost Saving Measures & Efficient Facilities During the month of October, Sun Tran s Northwest Facility produced 13,620 kwh of electricity from the solar panels. This provides a cost avoidance of approximately $1,362 for the electricity generated and a Tucson Electric Power solar credit reimbursement to the City of Tucson s Department of Transportation of $2,179. Transit Task Force (TTF) At the general meeting of the Transit Task Force on 10/9, staff presented information on sales of the 3-Day Pass, Annual Pass and the $25 for $20 Discount Program. Staff also presented information on initial results of the experiment to increase the hours at Special Services Office. Sun Tran staff also participated in a Transit Task Force subcommittee meeting to help the group develop a draft Goals & Objectives for their 5 Year Strategic Transit Plan. Transit Center Beautification Project- Sun Tran s Marketing Department is initiating projects related to the usefulness and aesthetics of the three transit centers. Staff has started to develop a logo to represent each transit center. Staff is also starting to create posters for the kiosks at the bays of the three transit centers to promote the routes that connect riders to popular Tucson destinations/attractions. Community Event Calendar- Sun Tran created a & Community Events Calendar to assist Marketing to communicate more effectively internally and externally about upcoming community events, route detours and closures. 6
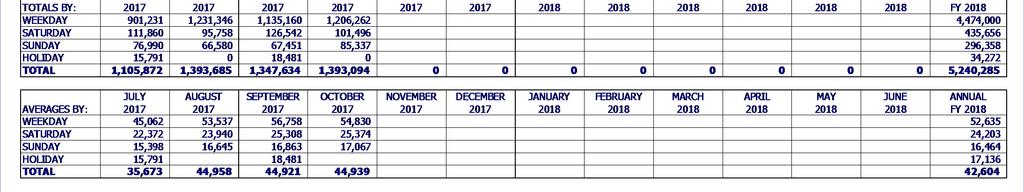
7 Sun Tran & Sun Van Strategic Goals Progress Update October Improve Safety and Security Trainings In October, five Sun Tran and Sun Van employees attended Trapeze s MapMaker 3-day training. The purpose of the training is to guide the users through the various steps involved in creating maps utilized in Trapeze software. The training focused on data preparation, loading features into the MapMaker software, and building Trapeze Maps using the MapMaker software. Thirty-three Sun Tran and Sun Van operations and maintenance supervisors attended a Labor Relations training conducted by RATP DEV McDonald Transit. This 4-hour training session focused on the National Labor Relations Act and collective bargaining agreements. Key concepts discussed included the importance of effective listening skills, conducting thorough investigations, and being fair and consistent. Increase Ridership Sun Tran Ridership Passenger ridership for October totaled 1,393,094. This is a decrease of 83,822 or 5.7 percent when compared with the prior year and is under the budgeted level by 285,306 or 17 percent. Daily ridership shows a decrease when compared to the same time period last year. October Year-to-Date (YTD) passenger ridership was 5,240,285. This is a decrease of 455,562 or 8 percent when compared with the prior year and is under the budgeted level by 896,415 or 14.6 percent. Passenger revenue for October was $958,059. This is an increase of $110,576 or 13 percent when compared to last fiscal year. Also, passenger revenue is below the budgeted level by 165,211 or 14.7 percent. Revenue per passenger boarding in October was $.68 cents compared to $.58 cents last year for the same time period. The overall farebox recovery ratio for October is 17.9 percent, while YTD is 19.5 percent. Sun Tran analyzed ridership trends over the last 10 years to identify key events which contributed to declines in ridership. 7
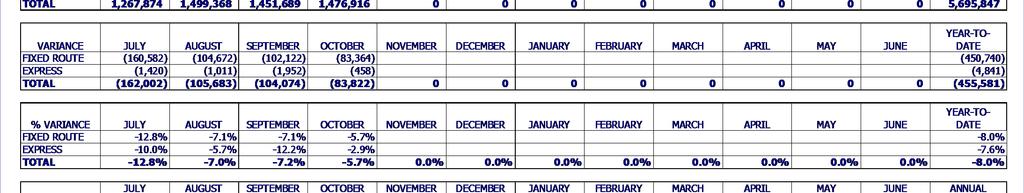
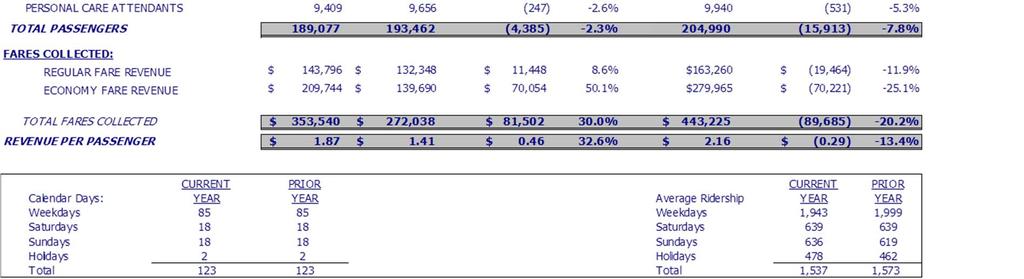
8 Sun Tran & Sun Van Strategic Goals Progress Update October Sun Van Ridership Sun Van ridership for October totaled 48,922. This is an increase of 194 or.4 percent when compared to October Revenue passengers, excluding Personal Care Attendants (PCA) increased by 264 passengers or.6 percent. Total passenger ridership year to date is 189,077. This is a decrease of 4,385 or 2.3 percent when compared to last fiscal year. Revenue passengers, excluding Personal Care Attendants (PCA), decreased by 4,138 passengers or 2.3 percent. Sun Link Sun Tran staff coordinated and led meetings with marketing and communications staff from Downtown Tucson Partnership, Main Gate Square, 4th Avenue, University of Arizona, and City of Tucson. The meetings focused on Sun Link s target audiences, 3-Day Pass promotion, upcoming events in the districts, and a Free Ride Day on Shop Local Day. Staff planned the promotion and communications of Shop Local Day. On Saturday, November 25, Sun Link will provide a Free Ride Day on the streetcar. Staff communicated with the districts about the importance of funding the Free Ride Day, and of organizing activities and events on the day to attract riders to their districts. Sun Tran staff met with KXCI to discuss having a concert in conjunction with Free Ride Day. Sun Link partnered with the Tucson Festival of Books and developed a prize giveaway on social media for their Halloween fundraiser event, Franks N Steins. The purpose of the contest was to increase awareness of Sun Link and promote ridership. Sun Link finalized the how-to-ride video with Roadrunners staff. The video will play during intermissions of all home games showing how to ride the streetcar, featuring Dusty the Roadrunners mascot. Staff confirmed with the Roadrunners that the Zamboni, that s wrapped as a Sun Link streetcar, is driven during games. The Zamboni provides high visibility to fans in attendance when it drives around on the hockey rink before games, during the two intermissions, and after the games to smooth out the ice. The Tucson Roadrunners PSA wrap, promoting the use of the streetcar to get to and from hockey games, continues to display on a Sun Link vehicle. Staff from Sun Tran met with representatives from Sun Link and TDOT in communications planning meetings focusing on issues such as the Roadrunners partnership collaboration, Shop Local Day planning, social media planning for large Tucson events, and what to cover in the Marketing Sun Link & Districts Meeting. 8
9 Sun Tran & Sun Van Strategic Goals Progress Update October Marketing campaigns related to Sun Tran and Sun Link ridership Frequent Transit Network: Sun Tran staff continued running ads on bus shelters and bus benches to promote commuting on routes of the Frequent Transit Network (FTN). Staff specified advertising locations with AdVision Outdoor at major destinations along routes of the FTN. Staff met with representatives from TucsonNewsNow.com (KOLD) in October to discuss and improve upon performance of the digital ads running to encourage employees to use Sun Tran for their commute. The digital ads are served to online users working at specific Travel Reduction Program employers located near FTN routes to encourage commuting by transit. An additional ad promoting the FTN in October was in the Parks & Recreation Fall Course Guide. Arizona Daily Star Advertising-Sun Link ad was created for the special basketball edition of the Arizona Daily Star. Jazz Festival Advertising- SunLink Ad was created for the Jazz Festival program in January. The ad will appear in 22,000 Festival programs. U-Pass: Sun Tran staff created and placed advertisements in two special editions of the Daily Wildcat promoting the U-Pass to students and their parents. Kiosk ads promoting U-Pass for Sun Tran and Sun Link were also on campus in three locations near the Sun Link route. 3-Day Pass: Sun Tran staff promoted the use of the 3-Day Pass to visitors and residents attending events from October including, Tucson Meet Yourself, Bear Down Friday, UA s Family Weekend Football game, and Downtown s 2nd Saturday. Staff maintained fliers at Sun Link stops, and posters in Sun Link and Sun Tran vehicles, and promoted the 3-Day Pass in social media. Bulk Sales Discount: Sun Tran staff promoted the bulk sales discount to organizations, answered questions and sold SunGO 1-Day Ticket at a bulk rate discount. Get on Board program: Sun Tran brainstormed ways to expand the Get on Board program as a means of increasing ridership. 9
10 Sun Tran & Sun Van Strategic Goals Progress Update October Provide information for riders and potential riders Website re-design: Sun Tran staff began research of new website designs. Staff identified key areas for improvement including design aesthetic, content organization, functionality, mobile friendliness, Title VI and ADA compliance. Sun Tran staff reviewed 60 websites of transit providers and identified seven websites which were exceptional in these key areas. Communications for FY Fare Change- The Marketing Department developed multiple communications materials for Sun Tran, Sun Express, Sun Link, Sun Shuttle and Sun Van in the event that the second part of the fare change is implemented in January. Print and digital materials include posters, stripcards, decals for TVMs and fareboxes, webpages, social media posts, media releases, etc. to inform riders and the general public of the fare change expected to take effect January 1,. Community Outreach Sun Tran Accessible Rider Training (START): Sun Tran led a START session at Handi-Dogs for 11 people with disabilities and their service animals. Outreach to apartments: In September, Marketing staff traveled to 49 hotels along Sun Tran and Sun Link routes to speak with staff about transit options for their employees and guests. In October, staff identified 60 apartment communities along the Frequent Transit Network. Staff also developed an outreach plan to provide information about the Frequent Transit Network to apartment managers, who can then market this as an asset to potential residents. Cyclovia: Sun Tran staff attended Cyclovia with a bus and spoke to roughly 100 community members. The majority of the conversations included a demonstration of how to load bikes on Sun Tran buses. Armory Park Senior Fair: Sun Tran staff attended the Senior Fair at Armory Park and spoke to roughly 100 seniors. Collaborations: Sun Tran staff met with representatives of Southern AZ Transit Advocates to discuss projects which we could collaborate on to increase ridership. Staff also met with 2030 Plan to Reduce CO2 to see if collaboration with this group would be fruitful. 10
11 Staff provided transit updates to two groups of employers involved in the Travel Reduction Program (TRP) at Pima Association of Governments (PAG). Online Passenger Tools Sun Tran s Facebook page had 1,335 page views. Sun Tran s most popular post, on October 18, featured photos from the START training at Handi-Dogs serving people with disabilities and their service dogs. The post reached 619 people, and earned 21 reactions, compared to an average of 343 people reached per post. Sun Tran s Twitter audience is 1,787 followers which is a 0.35 percent increase when compared to the previous month, and a 7.0 percent increase when compared to the same time last year. Sun Tran s Twitter page had 8.5 thousand impressions, a decrease of 44.3 percent when compared to the previous month. The top tweet was an alert to riders of detour service due to the TENWEST Festival and earned 676 impressions. Sun Tran s website had 126,361 page views, a decrease of 1.4 percent when compared to the previous month. The website had a total of 100,183 unique page views, a decrease of 1.4 percent from the previous month. The average time on a page by a user is 3 minutes 31 seconds, the same as the previous month. In October, 80.0 percent of sessions were from a mobile device (66,482), and 78,168 users navigated to the Routes & Times page. The Routes & Times page continues to be the most popular page on the Sun Tran website. There were 35,061 new users in October, a decrease of 1.2 percent from the previous month. GoTucson Mobile App The GoTucson mobile app has continued to be promoted during the month of October through placed advertising, social media and online. The number of individuals utilizing the GoTucson mobile app to ride transit throughout the community was 7,304 compared to 7,209 in September. The GoTucson mobile app has continued to be promoted at START sessions, community events, social media and online. 11
12 SUN TRAN RIDERSHIP OCTOBER VARIANCE OCTOBER VARIANCE ROUTE PASSENGERS: CURRENT YEAR PRIOR YEAR AMOUNT PERCENT BUDGET AMOUNT PERCENT FULL FARE 394, ,593 (29,577) -7.0% 494,000 (99,984) -20.2% ECONOMY FARE 570, ,861 (8,276) -1.4% 766,210 (195,625) -25.5% EXPRESS FARE 18,561 18, % 21,580 (3,019) -14.0% DAY PASS 87,508 90,155 (2,647) -2.9% 10,050 77, % OTHER 71,452 78,978 (7,526) -9.5% 84,410 (12,958) -15.4% ROUTE REVENUE PASSENGERS 1,142,122 1,189,828 (47,706) -4.0% 1,376,250 (234,128) -17.0% TRANSFER PASSENGERS 218, ,819 (32,969) -13.1% 265,030 (46,180) -17.4% CHILDREN =<5 31,255 34,469 (3,214) -9.3% 36,280 (5,025) -13.9% PCA % % FREE RIDE DAY % % OTHER ROUTE PASSENGERS 250, ,088 (36,116) -12.6% 302,150 (51,178) -16.9% TOTAL PASSENGERS 1,393,094 1,476,916 (83,822) -5.7% 1,678,400 (285,306) -17.0% (1,393,094) (1,476,916) (1,678,400) CURRENT YEAR PRIOR YEAR CURRENT YEAR Calendar Days School Days Average Route Ridership CURRENT PRIOR Weekdays YEAR YEAR Weekdays 54,830 59,047 Saturdays Saturday 25,374 28,138 Sundays 5 5 Sunday 17,067 19,247 Holidays 0 0 Holidays 0 0 Total Total 44,939 47,642 YEAR TO DATE OCTOBER VARIANCE OCTOBER VARIANCE ROUTE PASSENGERS: CURRENT YEAR PRIOR YEAR AMOUNT PERCENT BUDGET AMOUNT PERCENT FULL FARE 1,436,543 1,600,556 (164,013) -10.2% 1,883,430 (446,887) -23.7% ECONOMY FARE 2,144,168 2,221,779 (77,611) -3.5% 2,592,750 (448,582) -17.3% EXPRESS FARE 68,143 75,928 (7,785) -10.3% 92,410 (24,267) -26.3% DAY PASS 362, ,445 16, % 35, , % OTHER 272, ,912 (28,901) -9.6% 321,940 (49,929) -15.5% ROUTE REVENUE PASSENGERS 4,283,429 4,545,620 (262,191) -5.8% 4,926,120 (642,691) -13.0% TRANSFER PASSENGERS 841,658 1,023,491 (181,833) -17.8% 1,077,200 (235,542) -21.9% CHILDREN =<5 111, ,650 (11,842) -9.6% 130,140 (18,332) -14.1% PCA 3,390 3, % 3, % FREE RIDE DAY % % OTHER ROUTE PASSENGERS 956,856 1,150,227 (193,371) -16.8% 1,210,580 (253,724) -21.0% TOTAL PASSENGERS 5,240,285 5,695,847 (455,562) -8.0% 6,136,700 (896,415) -14.6% (5,240,285) (5,695,847) 6,136,700 Calendar Days CURRENT YEAR PRIOR YEAR School Days Average Route Ridership CURRENT YEAR Weekdays CURRENT YEAR PRIOR YEAR Weekdays 52,635 56,788 Saturdays Saturday 24,203 27,508 Sundays Sunday 16,464 18,711 Holidays 2 2 Holidays 17,136 18,442 PRIOR YEAR PRIOR YEAR Total Total 42,604 46,308 12
13 SUN TRAN REVENUE OCTOBER VARIANCE OCTOBER VARIANCE CURRENT YEAR PRIOR YEAR AMOUNT PERCENT BUDGET AMOUNT PERCENT ROUTE PASSENGER REVENUE: FULL FARE $ 614,084 $ 535,909 $ 78, % $ 765,840 $ (151,757) -19.8% ECONOMY FARE 201, ,626 29, % 198,080 3, % EXPRESS FARE 38,222 30,225 7, % 34,660 3, % DAY PASS 56,350 42,439 13, % 48,670 7, % OTHER 47,617 66,285 (18,668) -28.2% 76,020 (28,403) -37.4% TOTAL ROUTE PASSENGER REVENUE $ 958,059 $ 847,484 $ 110, % $ 1,123,270 $ (165,211) -14.7% (958,059) (847,450) $ (1,123,270) YEAR TO DATE OCTOBER VARIANCE OCTOBER VARIANCE CURRENT YEAR PRIOR YEAR AMOUNT PERCENT BUDGET AMOUNT PERCENT ROUTE PASSENGER REVENUE: FULL FARE $ 2,477,829 $ 2,367,817 $ 110, % $ 2,909,600 $ (431,771) -14.8% ECONOMY FARE 776, ,402 86, % 763,240 13, % EXPRESS FARE 180, ,985 (3,187) -1.7% 203,080 (22,282) -11.0% DAY PASS 223, ,183 49, % 199,670 24, % OTHER 193, ,780 (55,272) -22.2% 285,760 (92,252) -32.3% TOTAL ROUTE PASSENGER REVENUE $ 3,852,985 $ 3,665,167 $ 187, % $ 4,361,350 $ (508,365) -11.7% $ (3,852,985) $ (3,665,167) $ 4,361,350 Notes: YTD Fiscal Year was adjusted due to formula corrections. YTD pass revenue has been reduced by $115,808 for Sun Link's YTD Fiscal Year revenue share 115,808 YTD pass revenue has been reduced by $12,172 for Sun Shuttle's YTD Fiscal Year revenue share 12,172 ` 13
14 SUN TRAN PASSES SOLD AND PASS REVENUE PASSES SOLD PASS REVENUE OCTOBER VARIANCE OCTOBER VARIANCE CURRENT PRIOR AMOUNT PERCENT CURRENT PRIOR AMOUNT PERCENT MONTHLY 8450 DAY PASS 5,898 4,499 1, % 22,118 15,747 $6, % 8459 DISCOUNTED DAY PASS 17,116 15,253 1, % 34,232 26,693 $7, % DAY FULL FARE PASS % 2,636 0 $2, % 8450 FULL FARE 7 DAY % 0 0 $0 0.0% 8450 FULL FARE MONTHLY 3,777 3, % 165, ,791 14, % 8451 ECONOMY MONTHLY 6,890 7,041 (151) -2.1% 121, ,674 18, % 8452 EXPRESS MONTHLY (30) -6.5% 25,164 24, % 8455 ANNUAL % 1,208 0 $1, % 8453 COLLEGE PASS % 77,799 6,220 $71, % 8453 COLLEGE PASS EXPRESS % 8, $8, % 8454 SUMMERGO YOUTH PASS 0 (14) % - (602) $ % SUBTOTAL: 34,821 30,995 3, % $ 459,110 $ 328,340 $ 130, % STORED VALUE 8450 FULL FARE STORED VALUE 35,477 23,314 12, % 53,216 34,971 18, % 8451 ECONOMY STORED VALUE 44,849 63,238 (18,389) -29.1% 26,909 31,619 (4,710) -14.9% 8452 EXPRESS STORED VALUE 1,157 1, % 2,603 2, % SUBTOTAL: 81,483 87,667 (6,184) -7.1% $ 82,728 $ 68,820 $ 13, % TOTAL 116, ,662 (2,358) -2.0% $ 541, ,160 $ 144, % (541,838) (397,160) (144,678) YEAR TO DATE PASSES SOLD PASS REVENUE OCTOBER VARIANCE OCTOBER VARIANCE CURRENT PRIOR AMOUNT PERCENT CURRENT PRIOR AMOUNT PERCENT MONTHLY 8450 DAY PASS 22,349 15,465 6, % 83,809 54,128 29, % 8459 DISCOUNTED DAY PASS 70,088 68,603 1, % 140, ,055 20, % DAY FULL FARE PASS % 5, , % 8450 FULL FARE 7 DAY 0 6 (6) % 0 59 (59) % 8450 FULL FARE MONTHLY 15,831 14,766 1, % 693, ,237 90, % 8451 ECONOMY MONTHLY 26,378 28,925 (2,547) -8.8% 467, ,399 40, % 8452 EXPRESS MONTHLY 1,698 2,013 (315) -15.6% 98, ,854 (9,814) -9.1% 8455 ANNUAL % 13,009-13, % 8453 COLLEGE PASS 1,595 1, % 401, , , % 8453 COLLEGE PASS EXPRESS % 26,917 53,981 (27,063) -50.1% 8454 SUMMERGO YOUTH PASS 2 46 (44) -95.7% 85 1,926 (1,841) -95.6% SUBTOTAL: 138, ,361 7, % $ 1,929,567 $ 1,627,675 $ 301, % STORED VALUE 8263 FULL FARE STORED VALUE 126,593 64,991 61, % 189,890 97,487 92, % 8450 ECONOMY STORED VALUE 165, ,383 (46,585) -21.9% 99, ,192 (6,713) -6.3% 8452 EXPRESS STORED VALUE 4,542 4, % 10,220 8,764 1, % SUBTOTAL: 296, ,756 15, % $ 299,588 $ 212,442 $ 87, % TOTAL 435, ,117 22, % $ 2,229,155 $ 1,840,117 $ 389, % (2,229,155) (1,840,117) (389,038) Note: FY17 A fare change tool effect on January 3, YTD pass revenue has been reduced by $115,808 for Sun Link's YTD Fiscal Year revenue share 115,808 YTD pass revenue has been reduced by $12,172 for Sun Shuttle's YTD Fiscal Year revenue share 12,172 14
15 SUMMARY OF EXPENSES OCTOBER OCTOBER VARIANCE MONTHLY VARIANCE CURRENT PRIOR YEAR YEAR AMOUNT PERCENT BUDGET AMOUNT PERCENT OPERATOR WAGES $ 1,711,704 $ 1,512,162 $ (199,542) -11.7% $ 1,448,365 $ (263,339) -18.2% MAINTENANCE WAGES 608, ,616 (177,887) -29.2% 392,192 (216,311) -55.2% SALARIES 358, ,793 (47,501) -13.3% 350,468 (7,826) -2.2% FRINGE BENEFITS 1,068,511 1,035,002 (33,509) -3.1% 1,017,981 (50,530) -5.0% SERVICES 476, ,930 (135,009) -28.3% 447,008 (29,931) -6.7% UTILITIES 94,552 66,618 (27,934) -29.5% 64,108 (30,444) -47.5% VEHICLE MAINTENANCE 323, ,678 (81,143) -25.1% 412,191 88, % MATERIALS AND SUPPLIES 42, , , % 129,748 87, % CNG FUEL 45,168 48,788 3, % 60,808 15, % DIESEL FUEL 399, ,823 (82,725) -20.7% 436,308 36, % UNLEADED FUEL 9,853 - (9,853) % 7,638 (2,215) -29.0% CAPITAL OUTLAY % % INSURANCE 147, ,958 12, % 160,458 13, % LABOR CREDITS/EXP TRANSFERS (7,294) (4,266) 3, % 59,074 66, % TOTAL EXPENSES $ 5,278,974 $ 4,633,814 $ (645,159) -13.9% $ 4,986,938 $ (292,034) -5.9% OCTOBER OCTOBER YEAR TO DATE CURRENT PRIOR VARIANCE ANNUAL BUDGET BALANCE YEAR YEAR AMOUNT PERCENT BUDGET AMOUNT PERCENT OPERATOR WAGES $ 6,302,866 $ 5,666,183 $ (636,683) -10.1% $ 17,380,380 $ 11,077, % MAINTENANCE WAGES 1,820,114 1,624,787 (195,327) -10.7% 4,706,300 2,886, % SALARIES 1,491,490 1,333,571 (157,919) -10.6% 4,205,620 2,714, % FRINGE BENEFITS 4,285,005 4,055,805 (229,200) -5.3% 12,215,770 7,930, % SERVICES 1,465,870 1,302,879 (162,991) -11.1% 5,364,100 3,898, % UTILITIES 353, ,476 (80,792) -22.9% 769, , % VEHICLE MAINTENANCE 1,519,911 1,141,095 (378,816) -24.9% 4,946,290 3,426, % MATERIALS AND SUPPLIES 213, ,719 99, % 1,556,980 1,343, % CNG FUEL 166, ,616 33, % 729, , % DIESEL FUEL 1,454,659 1,231,626 (223,033) -15.3% 5,235,690 3,781, % UNLEADED FUEL 41,333 22,984 (18,349) -44.4% 91,650 50, % CAPITAL OUTLAY 15, , , % 7,090 (8,164) % INSURANCE 620, ,719 19, % 1,925,500 1,304, % LABOR CREDITS/EXP TRANSFERS (20,580) (17,506) 3, % 708, , % TOTAL EXPENSES $ 19,730,139 $ 17,921,057 $ (1,809,080) -10.1% $ 59,843,260 $ 40,113, % There were two events in April which impacted the YTD totals: 1) $117,000 in expenses were included in April MTD but excluded from April YTD 2) $61, in Pcard expenses were posted after April was final and were not included in April MTD or YTD 15
16 SUN TRAN SYSTEM SUMMARY OCTOBER VARIANCE OCTOBER VARIANCE CURRENT YEAR PRIOR YEAR AMOUNT PERCENT BUDGET AMOUNT PERCENT RIDERSHIP: TOTAL ROUTE PASSENGERS 1,393,094 1,476,916 (83,822) -5.7% 1,678,400 (285,306) -17.0% REVENUE: TOTAL ROUTE PASSENGER REVENUE $ 958,059 $ 847,484 $ 110, % 1,123,270 (165,211) -14.7% EXPENSES: TOTAL EXPENSES $ 5,278,974 $ 4,633,814 $ (645,160) -13.9% $ 4,986,938 $ (292,036) -5.9% MILES: REVENUE MILES 723, ,668 45, % 723,156 (653) -0.1% DEADHEAD MILES 104,292 99,328 4, % 102,512 (1,780) -1.7% TOTAL SERVICE MILES 828, ,996 50, % 825,669 (2,432) -0.3% NON-ROUTE MILES 11,494 12,363 (869) -7.0% 9,550 (1,944) -20.4% TOTAL MILES 839, ,359 49, % 835,219 (4,376) -0.5% REVENUE HOURS 60,560 56,307 4, % 60, % SERVICE HOURS 64,997 60,505 4, % 64, % YEAR TO DATE OCTOBER VARIANCE OCTOBER VARIANCE CURRENT YEAR PRIOR YEAR AMOUNT PERCENT BUDGET AMOUNT PERCENT RIDERSHIP: TOTAL ROUTE PASSENGERS 5,240,285 5,695,847 (455,562) -8.0% 6,136,700 (896,415) -14.6% REVENUE: TOTAL ROUTE PASSENGER REVENUE $ 3,852,985 $ 3,665,167 $ 187, % $ 4,361,350 $ (508,365) -11.7% EXPENSES: TOTAL EXPENSES $ 19,730,139 $ 17,921,057 $ (1,809,082) -10.1% $ 19,947,756 $ 217, % MILES: REVENUE MILES 2,820,714 2,722,607 98, % 2,821, % DEADHEAD MILES 407, ,103 8, % 404,020 (3,538) -0.9% TOTAL SERVICE MILES 3,228,272 3,121, , % 3,225,540 (2,732) -0.1% NON-ROUTE MILES 43,431 30,874 12, % 36,200 (7,231) -20.0% TOTAL MILES 3,271,703 3,152, , % 3,261,740 (9,963) -0.3% REVENUE HOURS 236, ,478 12, % 236, % SERVICE HOURS 253, ,852 13, % 253,235 (215) -0.1% Notes: Fiscal Year Miles and Hours were adjusted due to corrections. 16

17 17
18 SUN TRAN PERFORMANCE INDICATORS OCTOBER SYSTEM INDICATOR CURRENT MONTH BUDGET AVG YTD 1. RIDERSHIP 1,393,094 1,678,400 1,310, PASSENGER REVENUE $ 958,059 $ 1,123,270 $ 963, PASSENGER PER TOTAL MILE PASSENGER PER HOUR REVENUE PER PASSENGER $ 0.69 $ 0.66 $ REVENUE PER TOTAL MILE $ 1.18 $ 1.24 $ REVENUE PER HOUR $ $ $ FAREBOX RECOVERY RATIO 18.1% 20.2% 19.5% 9. TOTAL COST PER PASSENGER $ 3.79 $ 3.39 $ TOTAL COST PER MILE $ 6.29 $ 6.13 $ TOTAL COST PER SERVICE HOUR $ $ $ MILES BETWEEN ROAD CALLS 13,542 8,200 11, MILES BETWEEN BUS INSPECTION 5,914 6,300 5, TOTAL VEHICLE ACCIDENTS PER 100,000 MILES TOTAL COMPLAINTS PER 100,000 PASSENGER VEHICLES OPERATED IN MAXIMUM SERVICE
19 FY 17 FY 18 Budget Sun Tran Performance Indicators Fiscal Year Ridership (in millions) Passenger Revenue (in 100 thousands) Jul Aug Sep Oct Nov Dec Jan Feb Mar Apr May Jun 0 Jul Aug Sep Oct Nov Dec Jan Feb Mar Apr May Jun 19
20 FY 17 FY 18 Budget Sun Tran Performance Indicators Fiscal Year Passengers per Total Mile Passengers per Hour Jul Aug Sep Oct Nov Dec Jan Feb Mar Apr May Jun 0 Jul Aug Sep Oct Nov Dec Jan Feb Mar Apr May Jun 20
21 FY 17 FY 18 Budget Sun Tran Performance Indicators Fiscal Year Revenue per Passenger Revenue per Total Mile Jul Aug Sep Oct Nov Dec Jan Feb Mar Apr May Jun 0 Jul Aug Sep Oct Nov Dec Jan Feb Mar Apr May Jun 21
22 FY 17 FY 18 Budget Sun Tran Performance Indicators Fiscal Year Revenue per Hour Farebox Recovery Ratio Jul Aug Sep Oct Nov Dec Jan Feb Mar Apr May Jun 0 Jul Aug Sep Oct Nov Dec Jan Feb Mar Apr May Jun 22
23 FY 17 FY 18 Budget Sun Tran Performance Indicators Fiscal Year Total Cost per Passenger Total Cost per Mile Jul Aug Sep Oct Nov Dec Jan Feb Mar Apr May Jun Jul Aug Sep Oct Nov Dec Jan Feb Mar Apr May Jun 0 Jul Aug Sep Oct Nov Dec Jan Feb Mar Apr May Jun 23
24 FY 17 FY 18 Budget Sun Tran Performance Indicators Fiscal Year Total Cost per Mile Total Cost per Service Hour Jul Aug Sep Oct Nov Dec Jan Feb Mar Apr May Jun 0 Jul Aug Sep Oct Nov Dec Jan Feb Mar Apr May Jun 24
25 FY 17 FY 18 Budget Sun Tran Performance Indicators Fiscal Year Miles Between Road Calls Miles Between Inspections Jul Aug Sep Oct Nov Dec Jan Feb Mar Apr May Jun Revenue vehicle system failures are defined as mechanical problems that cause a vehicle not to complete its scheduled revenue trip, or does not start its next scheduled revenue trip. *Per NTD guidelines Jul Aug Sep Oct Nov Dec Jan Feb Mar Apr May Jun Acceptable range is + or 10% 25
26 FY 17 FY 18 Budget Sun Tran Performance Indicators Fiscal Year Vehicle Accidents per 100,000 Miles 3.5 Complaints per 100,000 Passengers Jul Aug Sep Oct Nov Dec Jan Feb Mar Apr May Jun 0 Jul Aug Sep Oct Nov Dec Jan Feb Mar Apr May Jun 26

27 Sun Tran Performance Indicators Fiscal Year 27

28 FY 17 FY 18 Sun Tran Performance Indicators Fiscal Year 28
29 ` SUN TRAN ROUTE PERFORMANCE PROFILE OCTOBER ROUTE TOTAL ROUTE PASSENGERS ROUTE REVENUE TOTAL SERVICE MILES TOTAL SERVICE HOURS TOTAL COST ALLOCATION NET COST PER HOUR PASSENGER PER MILE PASSENGER PER HOUR REVENUE PER MILE REVENUE PER HOUR SUBSIDY PER PASSENGER 1 39,735 $ 25,861 21,018 1,811 $ 143,589 $ $ 1.35 $ $ ,034 15,644 21,238 1, , ,448 44,528 47,214 3, , ,709 75,035 56,193 4, , ,013 15,300 18,289 1, , ,470 33,574 19,788 2, , ,490 49,411 46,466 3, , ,393 76,039 56,337 4, , ,021 36,389 39,665 3, , ,805 19,852 15,156 1,234 99, ,698 59,065 47,575 3, , ,593 22,045 20,179 1, , ,043 23,560 27,457 2, , ,543 70,791 46,006 4, , ,841 44,435 45,428 3, , ,617 56,029 25,458 2, , ,387 19,641 9,648 1,085 81, ,967 8,284 10, , ,857 7,696 10, , ,499 21,219 20,245 1, , ,130 10,552 7, , ,104 26,896 23,042 1, , ,828 13,659 17,575 1,066 93, ,449 16,398 22,145 1, , ,080 23,088 21,564 1, , ,328 41,814 37,352 3, , ,348 11,652 15,412 1,164 95, ,694 10,096 6, , ,753 8,610 11, , TOTAL FIXED ROUTE 1,377, , ,700 62,288 5,013,861 $ $ 1.29 $ $ 2.99 TOTAL ROUTE ROUTE TOTAL SERVICE TOTAL SERVICE TOTAL COST NET COST PASSENGER PASSENGER REVENUE REVENUE SUBSIDY PER ROUTE PASSENGERS REVENUE MILES HOURS ALLOCATION PER HOUR PER MILE PER TRIP PER MILE PER HOUR PASSENGER 101X 1,830 $ 8,398 3, $ 18,151 $ $ 5.25 $ $ X 1,490 6,623 5, , X 973 4,317 1, , X 1,225 5,605 3, , X 1,430 5,917 2, , X 1,431 5,984 10, , X 1,353 5,976 4, , X 637 2,601 4, , X 1,473 6,386 5, , X 606 1,203 3, , X 1,889 3,648 8, , X 880 1,702 6, , TOTAL EXPRESS ROUTE 15,217 58,361 61,216 2, ,113 $ $ 1.69 $ $ TOTAL SERVICE 1,393, , ,916 64,997 5,278,974 $ $ 1.30 $ $ 3.11 Notes: 1) Service miles denotes Scheduled Vehicle Revenue and Deadhead Miles (less Lost Miles) per Route. 2) Effective March 2014: The passenger per hour metric has been replaced with passenger per trip for express route service. Passenger per trip is a better measurement of productivity for express service. 3) Routes 110X is bi-directional express service. 29
30 SUN TRAN RANKING OF ROUTES - ROUTE PASSENGERS PER HOUR OCTOBER RANKING ROUTE NUMBER ROUTE DESCRIPTION PASSENGERS PER HOUR 1 18 S. 6TH AVENUE STONE ORACLE / INA TH AVENUE BROADWAY SPEEDWAY FLOWING WELLS EUCLID/ NORTH FIRST AVENUE ALVERNON TH / 12TH AVENUE AJO S. PARK AVENUE GLENN/SWAN ND STREET CRAYCROFT / FT LOWELL VALENCIA TH STREET / WILMOT COUNTRY CLUB / 29TH STREET BENSON HIGHWAY MISSION ROAD GRANT ROAD PIMA STREET / WEST SPEEDWAY GRANDE WEST CONGRESS / SILVERBELL CHERRYBELL CAMPBELL AVENUE LA CHOLLA PANTANO MIDVALE PARK 14.6 FIXED ROUTE SYSTEM AVERAGE 22.1 RANKING ROUTE NUMBER ROUTE DESCRIPTION PASSENGERS PER TRIP 1 102X INA ROAD EXPRESS X GOLF LINKS EXPRESS X MARANA EXPRESS X BROADWAY EXPRESS X SUNRISE EXPRESS X OLDFATHER EXPRESS X ORO VALLEY/DOWNTOWN EXPRESS X RITA RANCH/DOWNTOWN EXPRESS X SPEEDWAY/AEROPARK EXPRESS X TANQUE VERDE EXPRESS X NW / AEROPARK EXPRESS X ORO VALLEY/AEROPARK EXPRESS 4.1 EXPRESS ROUTE SYSTEM AVERAGE
31 CUSTOMER INFORMATION CENTER The customer service information and call center answered 18,653 phone calls in October. That is a 1% increase from the 18,384 calls answered in September and a 25% decrease from the 24,852 calls answered in October Sun Tran s website customer feedback response center received 128 s in October. That is a 24% increase over the 103 s received September and a 1% increase from the 127 s received in October SERVICE REPORTS COMPARISON OCTOBER OCTOBER 2016 % Increase/Decrease Total Service Reports: % Inquiries % Compliments % Complaints % Chargeable % Non-chargeable % Pending % Incomplete % SERVICE REPORTS COMPARISON OCTOBER SEPTEMBER % Increase/Decrease Total Service Reports: % Inquiries % Compliments % Complaints % Chargeable % Non-chargeable % Pending % Incomplete % Notes: 1) Complaints deemed non chargeable were investigated, and the results indicated Sun Tran was not at fault. (Example: bus did not show, bus was early or late, etc.) 2) Incomplete are service reports with incomplete information that did not allow Sun Tran to finish an investigation. 3) Incomplete service reports are held in the event additional facts are provided to finish the investigation. 4) Inquiries are customer questions that are not complaints, but focus on service issues, and are more informational based in the response back to the consumer. 31

32 32
33 33

34 34
35 35
36 SUN VAN ANNUAL RIDERSHIP CURRENT YEAR JULY AUGUST SEPTEMBER OCTOBER NOVEMBER DECEMBER JANUARY FEBRUARY MARCH APRIL MAY JUNE ANNUAL FY 44,044 49,822 46,289 48, ,077 TOTAL 44,044 49,822 46,289 48, ,077 PREVIOUS YEAR JULY 2016 AUGUST 2016 SEPTEMBER 2016 OCTOBER 2016 NOVEMBER 2016 DECEMBER 2016 JANUARY FEBRUARY MARCH APRIL MAY JUNE ANNUAL FY 46,051 50,605 48,078 48, ,462 TOTAL 46,051 50,605 48,078 48, ,462 VARIANCE JULY AUGUST SEPTEMBER OCTOBER NOVEMBER DECEMBER JANUARY FEBRUARY MARCH APRIL MAY JUNE YEAR-TO- DATE (2,007) (783) (1,789) (4,385) TOTAL (2,007) (783) (1,789) (4,385) % VARIANCE JULY AUGUST SEPTEMBER OCTOBER NOVEMBER DECEMBER JANUARY FEBRUARY MARCH APRIL MAY JUNE YEAR-TO- DATE -4.4% -1.5% -3.7% 0.4% 0.0% 0.0% 0.0% 0.0% 0.0% 0.0% 0.0% 0.0% -2.3% TOTAL -4.4% -1.5% -3.7% 0.4% 0.0% 0.0% 0.0% 0.0% 0.0% 0.0% 0.0% 0.0% -2.3% TOTALS BY: JULY AUGUST SEPTEMBER OCTOBER NOVEMBER DECEMBER JANUARY FEBRUARY MARCH APRIL MAY JUNE YEAR-TO- DATE WEEKDAY 37,431 44,667 39,964 43, ,175 SATURDAY 3,039 2,612 3,285 2,572 11,508 SUNDAY 3,076 2,543 2,583 3,237 11,439 HOLIDAYS TOTAL 44,044 49,822 46,289 48, ,077 AVERAGES BY: JULY AUGUST SEPTEMBER OCTOBER NOVEMBER DECEMBER JANUARY FEBRUARY MARCH APRIL MAY JUNE YEAR-TO- DATE WEEKDAY 1, , , , , SATURDAY SUNDAY HOLIDAYS TOTAL 1, , , , , Note: September 2016 Ridership Changed due to Cancellation 36

37 37

38 FY 17 FY 18 Budget Sun Van Performance Indicators Fiscal Year 38

39 FY 17 FY 18 Budget Sun Van Performance Indicators Fiscal Year 39


40 FY 17 FY 18 Budget Sun Van Performance Indicators Fiscal Year 40

41 FY 17 FY 18 Budget Sun Van Performance Indicators Fiscal Year 41


42 FY 17 FY 18 Sun Van Performance Indicators Fiscal Year * ADA Service only. * ADA Service only. 42

43 43

44 Sun Tran Glossary of Terms Ridership (Unlinked Passenger Trips) The number of passengers who board public transportation vehicles. Passengers are counted each time they board vehicles no matter how many vehicles they use to travel from their origin to their destination. Total Cost per Passenger Equals total expenditures divided by total passengers. Passenger per Mile Equals total passengers divided by total miles. Passenger per Service Hour Equals total ridership divided by total service hours. Passenger Revenue Equals revenue collected from passengers (includes farebox revenue and revenue from pass sales). Revenue Miles and Hours The miles and hours that vehicles travel while in revenue service. Vehicle revenue miles and hours (VRM and VRH) include: layover / recovery time. But exclude: deadhead, operator training and maintenance testing, as well as school bus and charter services. Revenue per Mile Equals total passenger revenue divided by total miles. Revenue per Passenger Equals total passenger revenue divided by total passengers Revenue per Service Hour Equals passenger revenue divided by service hours Deadhead Miles and Hours Miles and hours that a vehicle travels when out of revenue service. Deadhead includes: leaving or returning to the garage or yard facility, changing routes, or when there is no expectation of carrying revenue passengers. However, deadhead does not include: charter service, school bus service, operator training, maintenance training. Service Miles and Hours Miles and hours that vehicles travel while in revenue service plus deadhead miles and hours. But exclude: charter and school bus service, operator training, and maintenance testing. Total Cost per Mile Equals total expenditures divided by total miles. Cost per Mile Equals total expenditures less Operating Grant Funds divided by total miles. Cost per Service Hour Equals total expenditures less Operating Grant Funds divided by total service hours. Total Complaints per 100,000 passengers Equals total complaints divided by total passengers times 100,000. On-Time As defined by the Short Range Transit Plan, a bus may be up to 5 minutes late, but less than 1 minute early. Road Calls Equals total chargeable road calls. A road call is defined as a mechanical failure of a bus in revenue service that necessitates removing the bus from service until repairs are made.. 44
45 Sun Van Glossary of Terms Ridership (Unlinked Passenger Trips) - Equals total Passengers actually transported. A one-way trip taken by an ADA Paratransiteligible passenger, a personal care attendant (PCA) or companions from the pick-up point to the destination. Passengers Per Revenue Hour - Equals Ridership divided by Revenue hours. Total Demand - Total number of passenger trips requested. Denial An ADA-eligible trip requested that is not scheduled by Sun Van within the permissible scheduled window of on hour before or one hour after the requested pick-up time. Passengers Per Service Hour - Equals Ridership divided by Service hours. Revenue Per Trip Total Passenger Revenue divided by Trips. Cancellations - Occurs when the passenger or the passenger s representative cancels the reservation two (2) or more hours prior to the beginning of the scheduled pick-up time. Total Cost Per Trip Total Expenses divided by total Trips. No-Shows - Occurs when the passenger does not board the Sun Van vehicle when the vehicle arrives at the pick-up location within the pick up window and the driver waits two (2) minutes, or when the customer does not cancel the reservation within two (2) hours of the reservation. Trip Time - The percentage of ADA Trips with a trip time less than the comparable Sun Tran fixed route trip. Optional ADA Passenger trips beyond the ¾ mile corridors and beyond times available on a Sun Tran fixed route, a same-day request, and will calls. Trip A one-way trip taken by an ADA-Paratransit-eligible passenger from the pick-up point to the destination (excludes PCAs and companions). Revenue Miles All miles operated from pick-up point to destination. Trip Time 110%+5 Minutes Occurs when an ADA trip length exceeds 110% + 5 minutes of the comparable Sun Tran regular fixed route trip. On Time Pick Ups - The number of on time vehicle trips. The van is considered on time if it arrives between 15 minutes before or 15 minutes after the requested pick-up time. Pick Ups before Significantly Late - Pick Ups 30 minutes outside the original pick up window. Deadhead Miles Miles operated not providing specific revenue service. 45
MONTHLY REPORT SEPTEMBER 2017
 & MONTHLY REPORT SEPTEMBER 2017 SECTION Sun Tran & Sun Van Monthly Operations Report Table of Contents September 2017 PAGE I.System Highlights and Accomplishments 3-10 II.Sun Tran a.ridership 11 b.revenue
MONTHLY REPORT MAY 2017
 & MONTHLY REPORT MAY 2017 SECTION Sun Tran & Sun Van Monthly Operations Report Table of Contents May 2017 PAGE I.System Highlights and Accomplishments 3-10 II.Sun Tran a.ridership 11 b.revenue 12 c.pass
MONTHLY REPORT AUGUST 2017
 & MONTHLY REPORT AUGUST SECTION Sun Tran & Sun Van Monthly Operations Report Table of Contents August PAGE I.System Highlights and Accomplishments 3-10 II.Sun Tran a.ridership 11 b.revenue 12 c.pass Sales
MONTHLY REPORT JUNE 2017
 & MONTHLY REPORT JUNE 2017 SECTION Sun Tran & Sun Van Monthly Operations Report Table of Contents June 2017 PAGE I.System Highlights and Accomplishments 3-10 II.Sun Tran a.ridership 11 b.revenue 12 c.pass
MONTHLY REPORT DECEMBER 2017
 & MONTHLY REPORT DECEMBER 2017 SECTION Sun Tran & Sun Van Monthly Operations Report Table of Contents December 2017 PAGE I.System Highlights and Accomplishments 3-12 II.Sun Tran a.ridership 13 b.revenue
MONTHLY OPERATIONS REPORT SEPTEMBER 2015
 MONTHLY OPERATIONS REPORT SEPTEMBER 215 Table of Contents SEPTEMBER 215 Section Page September Highlights... 3 Strategic Goals Progress Update... 4 Ridership... 6 Revenue... 9 Expenses... 1 System Summary...
MONTHLY OPERATIONS REPORT DECEMBER 2015
 MONTHLY OPERATIONS REPORT DECEMBER 215 Table of Contents DECEMBER 215 Section Page December Highlights... 3 Strategic Goals Progress Update... 4 Ridership... 6 Revenue... 9 Expenses... 1 System Summary...
MONTHLY REPORT SEPTEMBER 2017
 MONTHLY REPORT 2017 SUN SHUTTLE RIDERSHIP ROUTE PASSENGERS: CURRENT YEAR PRIOR YEAR AMOUNT PERCENTAGE BUDGET AMOUNT PERCENTAGE TOTAL PASSENGERS 17,250 20,318 (3,068) -15.1% 18,231 (981) -5.4% CALENDAR
PERFORMANCE REPORT NOVEMBER 2017
 PERFORMANCE REPORT NOVEMBER 2017 Note: New FY2018 Goal/Target/Min or Max incorporated in the Fixed Route and Connection Dashboards. Keith A. Clinkscale Performance Manager INTRODUCTION/BACKGROUND In June
VCTC Transit Ridership and Performance Measures Quarterly Report
 VCTC Transit Ridership and Performance Measures Quarterly Report Overview Quarter 2 Fiscal Year 2018-2019 This report provides performance measures for VCTC Intercity Bus Service covering the FY 2018-19
Att. A, AI 46, 11/9/17
 Total s San Diego Metropolitan Transit System POLICY 42 PERFORMANCE MONITORING REPORT Page 1 of 6 Date: 11/8/17 OBJECTIVE Develop a Customer-Focused and Competitive System The following measures of productivity
PERFORMANCE REPORT DECEMBER 2017
 PERFORMANCE REPORT DECEMBER 2017 Note: New FY2018 Goal/Target/Min or Max incorporated in the Fixed Route and Connection Dashboards. Keith A. Clinkscale Performance Manager INTRODUCTION/BACKGROUND Keith
PERFORMANCE REPORT DECEMBER Performance Management Office
 PERFORMANCE REPORT DECEMBER 2018 Performance Management Office INTRODUCTION/BACKGROUND Performance Management Office FIXED ROUTE DASHBOARD FY 2019 Safety Max Target Goal Preventable Collisions per 100k
Sound Transit Operations March 2018 Service Performance Report. Ridership
 March 218 Service Performance Report Ridership Total Boardings by Mode Mar-17 Mar-18 % YTD-17 YTD-18 % ST Express 1,622,116 1,47,79-4.6% 4,499,798 4,428,14-1.6% Sounder 393,33 39,6.% 1,74,96 1,163,76 8.3%
Sound Transit Operations August 2015 Service Performance Report. Ridership
 Ridership Total Boardings by Mode Mode Aug-14 Aug-15 % YTD-14 YTD-15 % ST Express 1,534,241 1,553,492 1.3% 11,742,839 12,354,957 5.2% Sounder 275,403 326,015 18.4% 2,139,086 2,463,422 15.2% Tacoma Link
Sound Transit Operations December 2014 Service Performance Report. Ridership
 Ridership Total Boardings by Mode Mode Dec-13 Dec-14 % YTD-13 YTD-14 % ST Express 1,266,130 1,396,787 10.3% 16,605,299 17,661,976 6.4% Sounder 248,710 285,016 14.6% 3,035,735 3,361,317 10.7% Tacoma Link
2017/ Q1 Performance Measures Report
 2017/2018 - Q1 Performance Measures Report Contents Ridership & Revenue... 1 Historical Revenue & Ridership... 1 Revenue Actual vs. Planned... 3 Mean Distance Between Failures... 5 Maintenance Cost Quarter
RIDERSHIP TRENDS. October 2017
 RIDERSHIP TRENDS October 2017 Prepared by the Division of Strategic Capital Planning December 2017 Table of Contents Executive Summary...1 Ridership...3 Estimated Passenger Trips by Line...3 Estimated
Sound Transit Operations January 2014 Service Performance Report. Ridership
 Ridership Total Boardings by Mode Mode Jan-13 Jan-14 % YTD-13 YTD-14 % ST Express 1,343,290 1,426,928 6.2% 1,343,290 1,426,928 6.2% Sounder 245,135 256,775 4.7% 245,135 256,775 4.7% Tacoma Link 86,229
Date: 11/6/15. Total Passengers
 Total San Diego Metropolitan Transit System POLICY 42 PERFORMANCE MONITORING REPORT Page 1 of 6 OBJECTIVE Develop a Customer-Focused and Competitive System The following measures of productivity and service
Sound Transit Operations January 2017 Service Performance Report. Ridership. Total Boardings by Mode
 January 217 Service Performance Report Ridership ST Express Sounder Tacoma Link Link Paratransit Jan-16 Jan-17 % 1,433,7 1,3,33 4.9% 331,27 7,121 98,411 3,633 Total Boardings by Mode 363,6 74,823 1,76,914
PERFORMANCE REPORT JANUARY Keith A. Clinkscale Performance Manager
 PERFORMANCE REPORT JANUARY 2018 Keith A. Clinkscale Performance Manager INTRODUCTION/BACKGROUND Keith A. Clinkscale Performance Manager FIXED ROUTE DASHBOARD JANUARY 2018 Safety Max Target Goal Preventable
Existing Services, Ridership, and Standards Report. June 2018
 Existing Services, Ridership, and Standards Report June 2018 Prepared for: Prepared by: Contents Overview of Existing Conditions... 1 Fixed Route Service... 1 Mobility Bus... 34 Market Analysis... 41 Identification/Description
FIXED ROUTE DASHBOARD JULY 2018
 FIXED ROUTE DASHBOARD JULY 2018 Safety Max Target Goal Preventable Collisions per 100k Miles Non-Preventable Collisions per 100k Miles Total Incidents per 10,000 Boardings 1.6 1.3 0.8 2.63 2.1 2.0 1.60
2017/2018 Q3 Performance Measures Report. Revised March 22, 2018 Average Daily Boardings Comparison Chart, Page 11 Q3 Boardings figures revised
 2017/2018 Q3 Performance Measures Report Revised March 22, 2018 Average Daily Boardings Comparison Chart, Page 11 Q3 Boardings figures revised Contents Ridership & Revenue... 1 Historical Revenue & Ridership...
Sound Transit Operations January 2018 Service Performance Report. Ridership
 January 218 Service Performance Report Ridership Total Boardings by Mode Jan-17 Jan-18 % YTD-17 YTD-18 % ST Express 1,3,33 1,7,91.3% 1,3,33 1,7,91.3% Sounder 367,33 416,8 13.3% 367,33 416,8 13.3% Tacoma
Board of Directors Information Summary
 Regional Public Transportation Authority 302 N. First Avenue, Suite 700, Phoenix, Arizona 85003 602-262-7433, Fax 602-495-0411 Board of Directors Information Summary Agenda Item #6 Date July 11, 2008 Subject
Transit Performance Report FY (JUNE 30, 2007)
") Transit Performance Report FY 2006-2007 (JUNE 30, 2007) J ANUARY 2008 TRANSIT PERFORMANCE REPORT FY 2006 2007 (JUNE 30, 2007) Transit Performance Report I SSUED: JANUARY 2008 The Transit Performance Report
Transit Performance Report FY 2006-2007 (JUNE 30, 2007) J ANUARY 2008 TRANSIT PERFORMANCE REPORT FY 2006 2007 (JUNE 30, 2007) Transit Performance Report I SSUED: JANUARY 2008 The Transit Performance Report
Sound Transit Operations June 2016 Service Performance Report. Ridership
 Ridership Total Boardings by Mode Mode Jun-15 Jun-16 % YTD-15 YTD-16 % ST Express 1,622,222 1,617,420-0.3% 9,159,934 9,228,211 0.7% Sounder 323,747 361,919 11.8% 1,843,914 2,099,824 13.9% Tacoma Link 75,396
METROBUS SERVICE GUIDELINES
 METROBUS SERVICE GUIDELINES In the late 1990's when stabilization of bus service was accomplished between WMATA and the local jurisdictional bus systems, the need for service planning processes and procedures
RIDERSHIP TRENDS. August 2018
 RIDERSHIP TRENDS August Prepared by the Division of Strategic Capital Planning October Table of Contents Executive Summary...1 Ridership...3 Estimated Passenger Trips by Line...3 Estimated Passenger Trips
RIDERSHIP TRENDS. January 2018
 RIDERSHIP TRENDS January 2018 Prepared by the Division of Strategic Capital Planning March 2018 Table of Contents Executive Summary...1 Ridership...3 Estimated Passenger Trips by Line...3 Estimated Passenger
Board Box. October Item # Item Staff Page 1. Key Performance Indicators Sep 2018 M. Mungia Financial Report Aug 2018 H.
 Board Box October 2018 Item # Item Staff Page 1. Key Performance Indicators Sep 2018 M. Mungia 2-10 2. Financial Report Aug 2018 H. Rodriguez 11-15 ITEM 1 October 31, 2018 TO: FROM: RE: BOARD OF DIRECTORS
Sound Transit Operations February 2018 Service Performance Report. Ridership
 February 218 Service Performance Report Ridership Total Boardings by Mode Feb-17 Feb-18 % YTD-17 YTD-18 % ST Express 1,373,96 1,372,88 -.1% 2,877,294 2,88,719.1% Sounder 314,96 32,187 11.9% 681,923 768,69
Service Cost Estimate for Route 10 only
 2009-2011 Service Cost Estimate for Route 10 only The City of Ashland buys down the fare on Route 10 for each passenger riding in Ashland, therefore service cost estimates are based on recent ridership
Sound Transit Operations March 2017 Service Performance Report. Ridership. Total Boardings by Mode
 March 217 Service Performance Report Ridership ST Express Sounder Tacoma Link Link Paratransit Mar-16 Mar-17 % 1,83,4 1,621,49 2.4% 37,496 82,631 1,264,47 3,821 Total Boardings by Mode 389,98 87,39 1,89,43,297
Performance Measures Year End Updated-
 Performance Measures Year End 2017 -Updated- Priorities and Objectives 1. Earn and Retain the Community s Trust 2. Provide Excellent Customer Service 3. Enable Organizational Success 4. Exemplify Financial
Board Box. February Item # Item Staff Page 1. Key Performance Indicators M. Thompson Financial Report for Dec H.
 Board Box February 2016 Item # Item Staff Page 1. Key Performance Indicators M. Thompson 2-8 2. Financial Report for Dec. 2015 H. Rodriguez 9-13 ITEM 1 February 15, 2016 TO: FROM: RE: BOARD OF DIRECTORS
METRO OPERATIONS COMMITTEE
 Los Angeles County Metropolitan Transportation Authority Item 1 CHIEF OPERATIONS OFFICER S S REPORT METRO OPERATIONS COMMITTEE Lonnie Mitchell Chief Operations Officer May 19, 20 1 Employee Recognition
Quarterly Report Transit Bureau, Local Transit Operations. First Quarter, Fiscal Year 2015 (July 2014 September 2014) ART & STAR
 ART & STAR") Quarterly Report Transit Bureau, Local Transit Operations First Quarter, Fiscal Year 2015 (July 2014 September 2014) ART & STAR A Arlington Transit ART 1) Introduction The purpose of ART is to provide
Quarterly Report Transit Bureau, Local Transit Operations First Quarter, Fiscal Year 2015 (July 2014 September 2014) ART & STAR A Arlington Transit ART 1) Introduction The purpose of ART is to provide
With the completion of this project, we would like to follow-up on the projections as well as highlight a few other items:
 TO: FROM: Mayor and Council Interim City Manager Rebecca Underhill, Director of Finance DATE: February 28, 2014 SUBJECT: Water Meter Project Analysis On March 28, 2012, Acting City Manager Mike Loftin
Establishes a fare structure for Tacoma Link light rail, to be implemented in September 2014.
 RESOLUTION NO. R2013-24 Establish a Fare Structure and Fare Level for Tacoma Link MEETING: DATE: TYPE OF ACTION: STAFF CONTACT: PHONE: Board 09/26/2013 Final Action Ric Ilgenfritz, Executive Director,
Administrative Operations Report
 Fiscal Year 2017/18 Administrative Operations Report November 1, 2018 Prepared by: El Dorado County Transit Authority 6565 Commerce Way Diamond Springs, CA 95619 (530) 642-5383 www.eldoradotransit.com
General Issues Committee Item Transit Operating Budget Ten Year Local Transit Strategy
 General Issues Committee Item 4.1 2017 Transit Operating Budget Ten Year Local Transit Strategy January 27, 2017 Presentation Outline 2017 Operating Budget Overview Ten Year Local Transit Strategy 2 2017
TRANSPORTATION SERVICE Actual
 PERFORMANCE REPORT-THIRD QUARTER VISION TO DELIVER REGIONAL MULTI-MODAL TRANSPORTATION SERVICES AND INFRASTRUCTURE IMPROVEMENTS THAT SIGNIFICANTLY AND CONTINUALLY INCREASE TRANSIT MARKET SHARE. MISSION
About This Report GAUGE INDICATOR. Red. Orange. Green. Gold
 ATTACHMENT A About This Report The Orange County Transportation Authority (OCTA) operates a countywide network of local, community, rail connector, and express bus routes serving over 6, bus stops. OCTA
DRT Performance Measurement: the U.S. Experience
 DRT Performance Measurement: the U.S. Experience FOR ANYBODY GOING ANYWHER IN LA HABRA International Conference on Demand Responsive Transportation Breckenridge, Colorado September 2016 DRT Performance
September 2014 Prepared by the Department of Finance & Performance Management Sub-Regional Report PERFORMANCE MEASURES
 September 2014 Prepared by the Department of Finance & Performance Management 2013 Sub-Regional Report PERFORMANCE MEASURES REGIONAL PERFORMANCE MEASURES RTA staff has undertaken the development of a performance
Factors that Affect Fixed-Route Ridership Frequency Connections and accessibility Travel time Travel cost Service area coverage Reliability
 The transit industry defines ridership as the number of passengers who board public transportation vehicles called unlinked passenger trips. Ridership measures transit utilization at the system, route,
Auckland Transport Quarterly Indicators Report 2018/19
 Attachment 1 Auckland Transport ly Indicators Report 218/19 September 218 Table of Contents Page 2. 1. Executive summary 2. External indicators 3. Performance by Key Priority 3.1 Deliver an efficient and
SUB-REGIONAL PERFORMANCE MEASURES
 SUB-REGIONAL PERFORMANCE MEASURES 29 REPORT Overall regional performance is a function of five major areas: Service Coverage - monitors both how much service is available to people in the region (in terms
Bristol Virginia Transit
 Bristol Virginia Transit 1 Transit Overview Bristol Virginia Transit (BVT) is a Federally Funded and certified urban area transit system. BVT began operation in its current form in 1982. In Fiscal Year
Bus Operations Report
 Third Quarter FY 216 (January 1 - March 31, 216) Wednesday April 27, 216 Operations Ridership: 783,194 passengers used in the third quarter. This represents a 2% increase over the same period in FY 215.
Current Operations CHAPTER II INTRODUCTION DESCRIPTION OF TRANSPORTATION SERVICES
 Chapter II CHAPTER II Current Operations INTRODUCTION This chapter provides an overview of Centre Area Transportation Authority (CATA). CATA is a joint municipal authority formed under the Municipal Authorities
Annual Transit Ridership Monitoring Report Fiscal Year
 Annual Transit Monitoring Report Fiscal Year 214-15 May 2, 216 Metropolitan Transportation Planning Organization for the Gainesville Urbanized Area Annual Transit Monitoring Report Fiscal Year 214-15
FY Transit Needs Assessment. Ventura County Transportation Commission
 FY 18-19 Transit Needs Assessment Ventura County Transportation Commission Contents List of Figures and Appendices.. 2 Appendices... 1 Chapter 1: Introduction What is the Ventura County Transportation
ATTACHMENT A.7. Transit Division Performance Measurements Report Fiscal Year Fourth Quarter
 TTCHMENT.7 Transit Division Performance Measurements Report Fiscal Year 2012-13 Fourth Quarter Introduction The Orange County Transportation uthority (OCT) operates a countywide network of local, community,
Metra Board of Directors. Board Meeting November 11, 2011
 Metra Board of Directors Board Meeting November 11, 2011 State of Metra Operations Metra Board of Directors November 11, 2011 Presented by George Hardwidge Deputy Executive Director Operations System On-Time
METRO FLEET FUNDING HUMAN RESOURCES
 2018 FACT SHEET METRO FLEET METRO s overall revenue-producing fleet totals 235 vehicles: 144 large buses and 91 smaller paratransit buses. Some passenger vehicles are equipped with a hydraulic lift to
BUSINESS BAROMETER December 2018
 Credit: Chris Orange BUSINESS BAROMETER December Credit: Nigel Moore 1 Contents Summary of findings 3 Annual monthly performance: visitor attractions..4 Visit Herts Team update 5 National context.8 Visitor
RACINE COUNTY PUBLIC TRANSIT PLAN:
 RACINE COUNTY PUBLIC TRANSIT PLAN: 2013-2017 Recommended Transit Service Improvement Plan NEWSLETTER 3 SEPTEMBER 2013 This newsletter describes the final recommended public transit plan for the City of
FIXED ROUTE Operating Statistics For Periods Ending 9/30/2008 & 9/30/2009
 FIXED ROUTE Operating Statistics For Periods Ending 9/30/2008 & 9/30/2009 CURRENT MONTH YEAR TO DATE Actual Actual Variance Actual Actual Variance 2008 2009 2008 to 2009 2008 2009 2008 to 2009 Service
Matt Miller, Planning Manager Margaret Heath-Schoep, Paratransit & Special Projects Manager
 DATE May 2, 218 Item #12 TO FROM GCTD Board of Directors Matt Miller, Planning Manager Margaret Heath-Schoep, Paratransit & Special Projects Manager MS SUBJECT I. EXECUTIVE SUMMARY This quarterly report
Chapter 3. Burke & Company
 Chapter 3 Burke & Company 3. WRTA RIDERSHIP AND RIDERSHIP TRENDS 3.1 Service Overview The Worcester Regional Transit Authority (WRTA) provides transit service to over half a million people. The service
January 2018 Air Traffic Activity Summary
 January 2018 Air Traffic Activity Summary Jan-2018 Jan-2017 CY-2018 CY-2017 Passengers 528,947 505,421 4.7% 528,947 505,421 4.7% Passengers 537,332 515,787 4.2% 537,332 515,787 4.2% Passengers 1,066,279
SAMTRANS TITLE VI STANDARDS AND POLICIES
 SAMTRANS TITLE VI STANDARDS AND POLICIES Adopted March 13, 2013 Federal Title VI requirements of the Civil Rights Act of 1964 were recently updated by the Federal Transit Administration (FTA) and now require
PTN-128 Reporting Manual Data Collection and Performance Reporting
 2016 PTN-128 Reporting Manual Data Collection and Performance Reporting Sponsored by the Texas Department of Transportation Table of Contents PTN-128 WHAT, WHY AND WHO... 6 What is the PTN-128... 13 Why
Metro Transit Annual Report
 Metro Transit 2013 Annual Report 2013 Year in Review In 2013, Metro experienced its second-highest ridership of all time, recording more than 14.7 million rides. This ridership was up 1% compared to 2012,
ESCAMBIA COUNTY AREA TRANSIT MTAC REPORT
 ESCAMBIA COUNTY AREA TRANSIT MTAC REPORT November 8, 2017 Meeting Escambia County Area Transit 1515 W. Fairfield Drive Pensacola, FL 32501 850-595-3228 INTRODUCTION 2 Summary Background MTAC ECAT Benchmarks
Peer Performance Measurement February 2019 Prepared by the Division of Planning & Market Development
 2017 Regional Peer Review Peer Performance Measurement February 2019 Prepared by the Division of Planning & Market Development CONTENTS EXECUTIVE SUMMARY... 3 SNAPSHOT... 5 PEER SELECTION... 6 NOTES/METHODOLOGY...
COMO Bus Service Evaluation DRAFT COA. September 19, 2016
 DRAFT COA September 19, 2016 Chapter 1 Introduction Introduction The City of Columbia Missouri unveiled COMO Connect in 2013 with the goal of changing how public transportation options were delivered in
YOSEMITE AREA REGIONAL TRANSPORTATION SYSTEM
 YOSEMITE AREA REGIONAL TRANSPORTATION SYSTEM Short Range Transit Plan Prepared for the Merced County Association of Governments/YARTS Prepared by LSC Transportation Consultants, Inc. YOSEMITE AREA REGIONAL
COLTS Complementary ADA Paratransit Service. Special Efforts Accessibility Transportation Service (SEATS) SEATS Trip Tips (570)
 SEATS Trip Tips (570)") COLTS Complementary ADA Paratransit Service Special Efforts Accessibility Transportation Service (SEATS) SEATS Trip Tips (570) 963-6795 June, 2016 1 Welcome to SEATS!!! COLTS provides Complementary ADA
COLTS Complementary ADA Paratransit Service Special Efforts Accessibility Transportation Service (SEATS) SEATS Trip Tips (570) 963-6795 June, 2016 1 Welcome to SEATS!!! COLTS provides Complementary ADA
October REGIONAL ROUTE PERFORMANCE ANALYSIS
 October 2018 2017 REGIONAL ROUTE PERFORMANCE ANALYSIS The Council s mission is to foster efficient and economic growth for a prosperous metropolitan region Metropolitan Council Members Alene Tchourumoff
Public Meeting. December 19 th, 2018
 Public Meeting December 19 th, 2018 AGENDA Welcome Market Analysis Existing Services Peer Evaluation Outreach Summary Recommendations Discussion Next Steps MARKET ANALYSIS 3 Demographics 50% of population
The packet is available on-line by going to choosing the Monthly Calendar, and clicking on Monday, March 16, 2015.
 AGENDA Ingham County Parks & Recreation Commission 121 E. Maple Street, P.O. Box 178, Mason, MI 48854 Telephone: 517.676.2233; Fax: 517.244.7190 The packet is available on-line by going to www.ingham.org,
Capital Metropolitan Transportation Authority. Monthly Performance Report
 Capital Metropolitan Transportation Authority Monthly Performance Report AUGUST 2010 Ridership Report August 23, 2010 Budget to Actual Ridership Budget Target: 2,290,590 Actual: 2,300,796 Ridership Comparison
Rides Mass Transit District. Jackson County Mass Transit District. FY 2020 Program of Projects (POP) Carbondale UZA
 Carbondale UZA") Rides Mass Transit District Jackson County Mass Transit District FY 2020 Program of Projects (POP) Carbondale UZA General Rides Mass Transit District (RMTD) is the public transportation provider for the
Rides Mass Transit District Jackson County Mass Transit District FY 2020 Program of Projects (POP) Carbondale UZA General Rides Mass Transit District (RMTD) is the public transportation provider for the
BaltimoreLink Implementation Status Report
 BaltimoreLink Implementation Status Report February 218 Joint Chairmen s Report JH1 Executive Summary BaltimoreLink, implemented on June 18, 217, is the complete overhaul and rebranding of the core transit
DISTRICT EXPRESS LANES ANNUAL REPORT FISCAL YEAR 2017 JULY 1, 2016 JUNE 30, FloridaExpressLanes.com
 DISTRICT EXPRESS LANES ANNUAL REPORT FISCAL YEAR 2017 JULY 1, 2016 JUNE 30, 2017 FloridaExpressLanes.com This page intentionally left blank. TABLE OF CONTENTS List of Figures... ii List of Tables.... ii
JANUARY 2018 BOARD INFORMATION PACKAGE
 JANUARY 2018 BOARD INFORMATION PACKAGE MEMORANDUM TO: Members of the Airport Authority FROM: Lew Bleiweis, Executive Director DATE: January 19, 2018 Financial Report (document) Informational Reports: A.
St. Johns County Transit Development Plan Update
 St. Johns County Transit Development Plan Update 2012-2021 Demographic Information Population 190,000 people in 2010 51% increase from 2000 Employment 64% over age 16 in labor force St. Augustine, Ponte
Driving Ridership Strategic Partnerships
 Driving Ridership Strategic Partnerships Feb 29, 2012 Presented by Priya Bhasin-Singh, Strategic Marketing Associate priya.bhasin-singh@edmonton.ca 2012 APTA Marketing & Communications Conference About
Executive Summary. Introduction. Community Assessment
 Executive Summary Introduction The Red Rose Transit Authority (RRTA) Transit Development Plan provides an evaluation of existing RRTA fixed route services, with the outcome being practical recommendations
Hard Labor Creek State Park Business Plan. Table of Contents
 Hard Labor Creek State Park Business Plan Table of Contents Georgia State Parks and Historic Sites Executive Summary Site Name Site Manager Region Manager Hard Labor Creek State Park Daniel Schay Eric
Analysts and Investors conference call. Q results. 15 May 2013
 Analysts and Investors conference call Q1 2013 results 15 May 2013 Management summary Key messages of Q1 2013 +6% +9% +3.3%p. Q1 2013 operational KPIs are in line with 109.7 116.2 6.5 7.1 82.3 85.6 expectations,
GREATER BOISE AUDITORIUM DISTRICT REGULAR BOARD MEETING OF THE BOARD OF DIRECTORS. AGENDA Revised. September 20, 2016
 GREATER BOISE AUDITORIUM DISTRICT REGULAR BOARD MEETING OF THE BOARD OF DIRECTORS AGENDA Revised September 20, 2016 BOISE CENTRE Willows Room 2:00 p.m. I. Call to Order II. III. IV. Changes or Additions
Scorecard Key Performance Indicators
 Scorecard Key Performance Indicators 1 st Quarter 2013 NICE Bus Fixed Route NICE Bus Fixed Route Definitions Scheduled Revenue Hours Full Trip Revenue Hours Lost Runs Missed Revenue Hours Lost Actual Hours
Title VI Service Equity Analysis
 Pierce Transit Title VI Service Equity Analysis Pursuant to FTA Circular 4702.1B NE Tacoma Service May 2016 Pierce Transit Transit Development Dept. PIERCE TRANSIT TITLE VI SERVICE EQUITY ANALYSIS TABLE
AGENDA GUEMES ISLAND FERRY OPERATIONS PUBLIC FORUM
 AGENDA GUEMES ISLAND FERRY OPERATIONS PUBLIC FORUM Wednesday, August 17, 211 6: p.m. Guemes Island Community Hall ~ 7549 Guemes Island Road Thank you for attending the second Annual Public Forum in 211.
AUGUST 2008 MONTHLY PASSENGER AND CARGO STATISTICS
 Inter-Office Memo Reno-Tahoe Airport Authority Date: October 2, 2008 To: Statistics Recipients From: Tom Medland, Director Air Service Business Development Subject: RENO-TAHOE INTERNATIONAL AIRPORT PASSENGER
U.S. DOMESTIC INDUSTRY OVERVIEW FOR MARCH
 Inter-Office Memo Reno-Tahoe Airport Authority Date: April 30, 2009 To: Statistics Recipients From: Krys T. Bart, A.A.E., President/CEO Subject: RENO-TAHOE INTERNATIONAL AIRPORT PASSENGER STATISTICS U.S.
Metrolinx Board of Directors. President, Union Pearson Express Date: September 22, 2015 UP Express Quarterly Board Report
 To: From: Metrolinx Board of Directors Kathy Haley President, Union Pearson Express Date: September 22, 2015 Re: UP Express Quarterly Board Report RECOMMENDATION That this report be received for information.
CWC LA - Cash Balance (January 2012)
") CWC LA - Cash Balance 2012-13 (January 2012) 1,200,000 Cash Balance 1,000,000 800,000 ($1,000s) 600,000 400,000 200,000 - CWC LA - Actuals/Projected CWC LA - ed (Nov) 1 1 CWC Hollywood - Financial Dashboard
CWC LA - Cash Balance 2012-13 (January 2012) 1,200,000 Cash Balance 1,000,000 800,000 ($1,000s) 600,000 400,000 200,000 - CWC LA - Actuals/Projected CWC LA - ed (Nov) 1 1 CWC Hollywood - Financial Dashboard
SAMTRANS SERVICE PLAN
 Agenda Overview Part I: Key Findings Market Assessment Service Evaluation Part II: Service Development Framework Metrics Criteria Part III: Next Steps SAMTRANS SERVICE PLAN Preliminary Analysis and Criteria
Managing And Understand The Impact Of Of The Air Air Traffic System: United Airline s Perspective
 Managing And Understand The Impact Of Of The Air Air Traffic System: United Airline s Perspective NEXTOR NEXTOR Moving Moving Metrics: Metrics: A Performance-Oriented View View of of the the Aviation Aviation
2018 Accomplishments
 CY2018 ANNUAL REPORT Vision The Chippewa Valley Regional Airport will provide our users with a safe, efficient and welcoming operation while striving to meet the current and future needs of the community
Hertfordshire Business Barometer April 2018
 Hertfordshire Business Barometer April 1 Contents Summary of findings 3 Marketing update 4 Visitor Attractions: monthly performance 6 Serviced Accommodation: monthly performance 10 Other news: national
Implementation Guidelines and Performance Measures Special Transportation for Seniors and People with Disabilities (Paratransit) Program
 Program") FY 2019-20 FINAL December 2018 Implementation Guidelines and Performance Measures Special Transportation for Seniors and People with Disabilities (Paratransit) Program Implementation Guidelines These guidelines
FY 2019-20 FINAL December 2018 Implementation Guidelines and Performance Measures Special Transportation for Seniors and People with Disabilities (Paratransit) Program Implementation Guidelines These guidelines
Montgomery Area Paratransit Guide
 Montgomery Area Paratransit Guide May 2016 Contents Welcome to the MAP Program... 3 Getting more information and assistance... 6 What to expect from MAP service.....7 MAP customer responsibilities...