About This Report GAUGE INDICATOR. Red. Orange. Green. Gold
|
|
|
- Timothy Horton
- 5 years ago
- Views:
Transcription


1 ATTACHMENT A
, a shared-ride program available for people unable to use the regular fixed-route bus service because of functional limitations.")
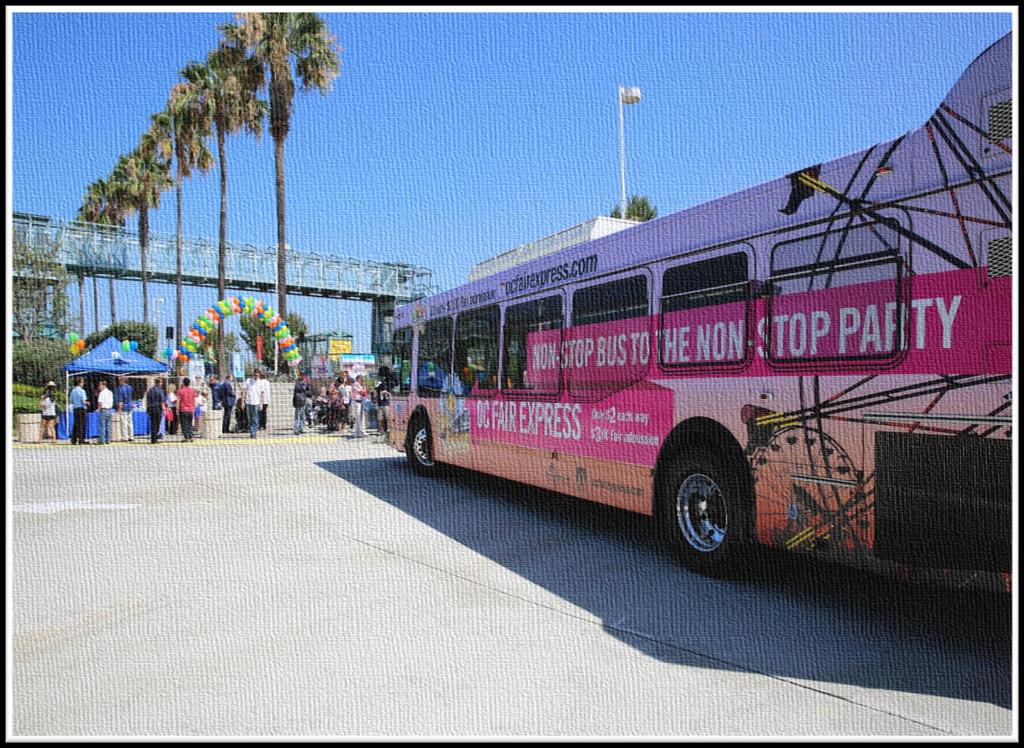
2 About This Report The Orange County Transportation Authority (OCTA) operates a countywide network of local, community, rail connector, and express bus routes serving over 6, bus stops. OCTA also operates federally mandated paratransit service (ACCESS), a shared-ride program available for people unable to use the regular fixed-route bus service because of functional limitations. Fixed-route bus service operated by OCTA is referred to as directly-operated fixed-route (DOFR) service, while routes operated under contract are referred to as contracted fixed-route (CFR) service. The ACCESS program is a contract-operated demand-response service mandated by the Americans with Disabilities Act that is complementary to the fixed-route service and predominately accounts for the overall paratransit services operated by OCTA. These three services make up the bus transit system and are evaluated by the performance measurements summarized in this report. This report tracks transit system safety, courtesy, and reliability in the areas of recordable vehicle accidents, customer complaints, on-time performance (OTP), and miles between road calls. The performance indicators are measured by a gauge scale, and the analysis for each section of the variances between reporting periods are presented under the supporting details column. Graphs also accompany the details of each indicator showing the standards or goals in a fiscal year-to-date format through the fiscal year (FY) and the values for the current and previous reporting periods. In an effort to better understand the recent trend related to ridership decline, a new section focusing on performance evaluation has been added to highlight route level performance. GAUGE INDICATOR KEY TERMS DEFINITIONS (More than 5%) Red CFR DOFR Contracted fixed-route are services operated by First Transit Directly-operated fixed-route are services operated by OCTA (Within 5%) Orange ACCESS OTP A share-ride program available for people with functional limitations On-time performance indicator (Within 5%) Green CNG LNG Compressed Natural Gas Liquefied Natural Gas (More than 5%) Gold Orange County Transportation Authority FY 216 First Quarter Performance Report 1

3 Safety: Preventable Vehicle Accidents Preventable vehicle accidents are counts of incidents concerning physical contact between vehicles used for public transit and other vehicles, objects, or pedestrians, where a coach operator failed to do everything reasonable to prevent the accident. To obtain a standardized measurement, the accident counts are multiplied by 1,, and then divided by the total miles the vehicles traveled. OCTA has established a safety standard of no more than one vehicle accident per 1, miles for each mode. Performance Details: FY FY STANDARD DOFR DOFR achieved the safety standard with a rate of.92 preventable vehicle accidents per 1, miles Supporting Details: 65% increase from the previous year rate of.55. Majority of the accidents involved rear end collisions and operators making contact with both parked and not parked stationary vehicles. Special campaigns such as Avoid Rear-End Collisions have been implemented to help reduce the number of accidents. CFR CFR exceeded the safety standard with a rate of.76 preventable vehicle accidents per 1, miles % decrease from the previous year rate of.89. In an effort to minimize the number of accidents associated with new drivers, stricter hiring requirements have been implemented. To help reduce the number of accidents, a mirror station training course has been implemented at Anaheim Base. ACCESS Q = Quarter ACCESS exceeded the safety standard with a rate of.41 preventable vehicle accidents per 1, miles Less than 3% increase from the previous year rate of.4. Majority of the accidents involved side swipe, fixed objects, and backing. Special campaigns such as Intersections & Avoiding Sideswipe Accidents have been implemented to help reduce the number of accidents. Orange County Transportation Authority FY 216 First Quarter Performance Report 2

4 Courtesy: Valid Complaints Customer complaints are counts of incidents where a user of public transit reports dissatisfaction with the service. For DOFR, the metric is standardized by multiplying the counts by 1, then dividing by the total number of boardings. The standard is no more than five customer complaints per 1, boardings. CFR and ACCESS services do not record the same level of boardings as DOFR; therefore, the statistics are factored by 2, and 3, respectively, and then divided by the total number of boardings. The standards for CFR and ACCESS are also five valid complaints per thousands of boardings. Performance Details: DOFR DOFR is within 5 percent of the courtesy standard with a rate of 5.35 valid complaints per 1, boardings. FY FY STANDARD Supporting Details: Complaints such as behind schedule, pass-by, and ahead of schedule were the main customer complaints. The increase in the number of complaints is associated with a combination of school starting (behind schedule) and road construction where bus stops were temporarily discontinued (pass-by). CFR CFR exceeded the courtesy standard with a rate of 3.93 valid complaints per 2, boardings An increase from previous year rate of 2.75 Similar to DOFR, there were a high a number of complaints associated with behind schedule and pass-by. Due to the hot weather, customers were finding shade under trees or near-by buildings instead of at the bus zone, which resulted in many of the pass-bys. ACCESS ACCESS exceeded the courtesy standard with a rate of 4.26 valid complaints per 3, boardings OCTA and the contractor staff continue to explore options to provide more efficient trip scheduling and routing to achieve the standards for customer service. Staff will continue to address customer service issues in the contractor s monthly meetings. Orange County Transportation Authority FY 216 First Quarter Performance Report 3

5 Reliability: On-Time Performance OTP is a measure of performance evaluating a revenue vehicle s adherence to a planned schedule on a fixed-route schedule or scheduled pick-up time for transportation on a demand-response trip. For fixed-route service, a trip is considered on-time if it departs the time-point no more than five minutes late. There is no tolerance for early departures. The system standard for OTP is at least 85 percent of the scheduled trips will be on-time. OTP is also reported by the service type for the fixed-route system: Local, Community, StationLink, and Express. On ACCESS service, a trip is considered on-time as long as the vehicle arrives within a 3 minute window. The ACCESS OTP standard is 92 percent. Performance Details: Local Fixed- Route Local fixed-route service OTP achieved the standard of 85 percent with an overall OTP of 85.8 percent. FY FY STANDARD 1% 95% 9% 85% 8% 75% 7% 65% Supporting Details: Local fixed-route service, comprised of lines 1 to 99, typically operates along major arterials forming the OCTA fixed-route grid network. Routes serve multiple municipalities and operate longer distances, generally along a single major corridor such as Beach Boulevard (Route 29), Harbor Boulevard (Route 43), and Katella Avenue (Route 5). Community Fixed-Route Community fixed-route service achieved the reliability standard of 85 percent with an overall OTP of 88.2 percent. 1% 95% 9% 85% 8% 75% 7% Community fixed-route service comprises lines 1 to 199, typically serving multiple streets and local community trip generators. Routes provide connections to the major grid routes, allowing passengers to travel beyond their community of origin. 65% Stationlink Fixed-Route StationLink fixed-route service exceeded the reliability standard of 85 percent with an overall OTP of 95.1 percent. 1% 95% 9% 85% 8% 75% 7% 65% StationLink fixed-route service comprises lines 4 to 499 consisting of rail feeder services, transporting passengers from/to Metrolink stations. Travel is over a defined route with limited stops located at major employment centers. These trips are scheduled to meet specific train schedules and, if needed, buses wait for late trains to ensure passengers reach their final destinations. Orange County Transportation Authority FY 216 First Quarter Performance Report 4

 which transports commuters within the county.")
.")


6 Performance Details: FY FY STANDARD Supporting Details: 1% 95% Express fixed-route service is categorized into two types Express Bus Fixed-Route Express fixed-route service achieved the reliability standard of 85 percent with an overall OTP of 88.1 percent. 9% 85% 8% 75% 7% 65% Intra county (lines 2 to 299) which transports commuters within the county. Inter county (lines 7 to 799) which transports riders between Orange County and neighboring counties (Los Angeles, Riverside, and San Bernardino). 1% ACCESS ACCESS achieved the reliability standard of 92 percent with an overall OTP of 94.2 percent. 95% 9% 85% 8% 75% 7% 65% The ACCESS program continues to exceed the OTP standard. The contractor s use of monitoring software has assisted in managing service operations and making real-time adjustments when necessary to ensure trips are performed within standard. Orange County Transportation Authority FY 216 First Quarter Performance Report 5

7 Reliability: Miles Between Road Calls Miles between road calls (MBRC) is a maintenance performance indicator that measures the vehicle miles between mechanical failures of a vehicle used for public transit during revenue service. Valid mechanical road calls may cause a delay in service and necessitate removing the vehicle from service until repairs are made. Performance Details: FY FY STANDARD Supporting Details: DOFR DOFR did not meet the maintenance reliability standard of 14, miles between road calls with 9,44 miles. 17,5 15, 12,5 1, 7,5 5, 2,5 Mid-life engine overhauls and cooling package installations are currently being performed on foot CNG buses. 22 new 4-foot CNG buses are scheduled to begin delivery early in calendar year 216 to replace the LNG and diesel buses, which average over 14 years each. When excluding the LNG and diesel buses from the calculation, the average MBRC is 12,2 miles. CFR ACCESS CFR did not meet the maintenance reliability standard of 12, miles between road calls with 7,596 miles. ACCESS exceeded the maintenance reliability standard of 25, miles between road calls with 42,48 miles. 17,5 15, 12,5 1, 7,5 5, 2,5 45, 4, 35, 3, 25, 2, 15, 1, 5, Similar to DOFR, mid-life engine overhauls are being performed. In addition, the hot summer months have contributed to the higher than usual road calls for engine and air conditioning system breakdowns. The MBRC for the midsize vehicles is 5,94 miles while MBRC for the 4- foot vehicles is 8,169 miles. An improvement of 94% from previous year s 21,91 MBRC as a result of the replacement of 99 ACCESS cutaways. Orange County Transportation Authority FY 216 First Quarter Performance Report 6
8 Performance Evaluation Similar to many other Transit agencies throughout the country, OCTA has been experiencing ridership decline over the last several years. Continuing efforts are underway to better understand and address the ridership trends. Several initiatives have been implemented in an effort to avert further ridership losses. These initiatives include: the discounted summer youth pass, development of a mobile ticketing application, and the re-branding of over 2 buses. Furthermore, in response to customers request for faster service, route 57 Xpress, a limited stop service along the highest demand segment of route 57 (Bristol Street), was introduced with the October 215 service change. Additional route adjustments are currently being evaluated and considered. These adjustments are based on results from the performance evaluation that was conducted as part of the update of the Five-Year Short-Range Transit Plan. Performance evaluation is important because it provides: a better understanding of where resources are being applied; a measure of how well services are being delivered; a measure of how well these services are used; and an objective basis for decisions regarding service changes and service deployment. Orange County Transportation Authority FY 216 First Quarter Performance Report 7

9 Service Performance Index OCTA has developed a Service Performance Index (SPI) to provide a detailed measure of performance at the route and day levels. The SPI uses three performance indicators: Px/RVH PxM/StM Fare Rec y Passenger Boardings per Revenue Vehicle Hour Passenger Miles per Seat Mile Farebox Recovery Ratio Px/RVH measures service effectiveness in terms of usage per unit of service provided. PxM/StM measures service efficiency in terms of the percentage of seats occupied. Fare Rec y measures financial efficiency in terms of farebox revenue as a percentage of operating cost. Each performance measure for a given route and day is compared against the system wide average. The three performance measures are averaged and then converted into a score between zero and one, with a higher score always indicating better performance. This score is the SPI value for the particular route and day. An SPI of.5 represents an average OCTA route. This data is used for evaluating service efficiency and considering route planning options. The table on the following page shows the top 1 ranking routes and bottom 1 ranking routes based on the SPI. Route 64 weekday, route 53 Saturday, and route 66 Saturday rank highest among all fixed routes while route 411 weekday, route 41 weekday, and route 178 Saturday rank toward the bottom with the lowest SPIs. In addition, a system map highlighting the top 1 and bottom 1 routes is also included. Orange County Transportation Authority FY 216 First Quarter Performance Report 8
10 Service Performance Index Ranking (SPI) SPI Rank Day Code Route Route Description Px /RVH PxM /StM Fare Rec'y SPI 1 Wk 64 Bolsa Ave/ 1st St %.96 2 Sa 53 Main St %.94 3 Sa 66 McFadden Ave/ Walnut Ave %.92 4 Wk 43 Harbor Blvd %.92 5 Wk 66 McFadden Ave/ Walnut Ave %.89 Seal Beach Blvd/ Los Alamitos Blvd/ 6 Sa 42 Lincoln Ave %.88 7 Su 53 Main St %.88 8 Wk 53 Main St %.87 9 Wk 38 Del Amo Blvd/ La Palma Ave %.86 1 Su 66 McFadden Ave/ Walnut Ave % Sa 145 Raitt St/ Greenville St/ Fairview St % Wk 193 Camino de Los Mares/ Camino Vera Cruz/ Avenida Pico % Wk 49 Crown Valley Pkwy/ Moulton Pkwy/ Aliso Viejo % Su 191 Rancho Viejo Rd/ Camino Capistrano/ El Camino Rd % Wk 43 Katella Ave/ Harbor Blvd/ Ball Rd % Wk Fwy/ 55 Fwy/ Sunflower Ave % Sa 51 Flower St % Sa 178 Adams Ave/ Birch St/ Campus Dr %.6 16 Wk Fwy % Wk 411 Tustin Ave/ La Palma Ave %.4 SPI Top 1 Routes SPI Bottom 1 Routes Orange County Transportation Authority FY 216 First Quarter Performance Report 9


11 Service Performance Index Map Orange County Transportation Authority FY 216 First Quarter Performance Report 1
ATTACHMENT A.7. Transit Division Performance Measurements Report Fiscal Year Fourth Quarter
 TTCHMENT.7 Transit Division Performance Measurements Report Fiscal Year 2012-13 Fourth Quarter Introduction The Orange County Transportation uthority (OCT) operates a countywide network of local, community,
Date: 11/6/15. Total Passengers
 Total San Diego Metropolitan Transit System POLICY 42 PERFORMANCE MONITORING REPORT Page 1 of 6 OBJECTIVE Develop a Customer-Focused and Competitive System The following measures of productivity and service
Att. A, AI 46, 11/9/17
 Total s San Diego Metropolitan Transit System POLICY 42 PERFORMANCE MONITORING REPORT Page 1 of 6 Date: 11/8/17 OBJECTIVE Develop a Customer-Focused and Competitive System The following measures of productivity
PERFORMANCE REPORT NOVEMBER 2017
 PERFORMANCE REPORT NOVEMBER 2017 Note: New FY2018 Goal/Target/Min or Max incorporated in the Fixed Route and Connection Dashboards. Keith A. Clinkscale Performance Manager INTRODUCTION/BACKGROUND In June
VCTC Transit Ridership and Performance Measures Quarterly Report
 VCTC Transit Ridership and Performance Measures Quarterly Report Overview Quarter 2 Fiscal Year 2018-2019 This report provides performance measures for VCTC Intercity Bus Service covering the FY 2018-19
MERRIMACK VALLEY REGIONAL TRANSIT AUTHORITY (MVRTA) PERFORMANCE MEASURES: FIXED ROUTE
 PERFORMANCE MEASURES: FIXED ROUTE") PERFORMANCE MEASURES: FIXED ROUTE IT IS OUR GOAL TO IMPROVE FIXED ROUTE SERVICE ON ALL LEVELS, ON A CONTINUOUS BASIS. IN ORDER TO DO THIS, WE HAVE ESTABLISHED BENCHMARKS TO MEASURE PERFORMANCE. THIS INFORMATION
PERFORMANCE MEASURES: FIXED ROUTE IT IS OUR GOAL TO IMPROVE FIXED ROUTE SERVICE ON ALL LEVELS, ON A CONTINUOUS BASIS. IN ORDER TO DO THIS, WE HAVE ESTABLISHED BENCHMARKS TO MEASURE PERFORMANCE. THIS INFORMATION
Transit Performance Report FY (JUNE 30, 2007)
") Transit Performance Report FY 2006-2007 (JUNE 30, 2007) J ANUARY 2008 TRANSIT PERFORMANCE REPORT FY 2006 2007 (JUNE 30, 2007) Transit Performance Report I SSUED: JANUARY 2008 The Transit Performance Report
Transit Performance Report FY 2006-2007 (JUNE 30, 2007) J ANUARY 2008 TRANSIT PERFORMANCE REPORT FY 2006 2007 (JUNE 30, 2007) Transit Performance Report I SSUED: JANUARY 2008 The Transit Performance Report
FY Year End Performance Report
 Overall Ridership Big Blue Bus carried 18,748,869 passengers in FY2014-2015, a 0.3% reduction from the year prior. This negligible reduction in ridership represents the beginnings of a reversal from a
PERFORMANCE REPORT DECEMBER 2017
 PERFORMANCE REPORT DECEMBER 2017 Note: New FY2018 Goal/Target/Min or Max incorporated in the Fixed Route and Connection Dashboards. Keith A. Clinkscale Performance Manager INTRODUCTION/BACKGROUND Keith
TRANSPORTATION SERVICE Actual
 PERFORMANCE REPORT-THIRD QUARTER VISION TO DELIVER REGIONAL MULTI-MODAL TRANSPORTATION SERVICES AND INFRASTRUCTURE IMPROVEMENTS THAT SIGNIFICANTLY AND CONTINUALLY INCREASE TRANSIT MARKET SHARE. MISSION
APPENDIX B. Arlington Transit Peer Review Technical Memorandum
 APPENDIX B Arlington Transit Peer Review Technical Memorandum Arlington County Appendix B December 2010 Table of Contents 1.0 OVERVIEW OF PEER ANALYSIS PROCESS... 2 1.1 National Transit Database...2 1.2
PERFORMANCE REPORT DECEMBER Performance Management Office
 PERFORMANCE REPORT DECEMBER 2018 Performance Management Office INTRODUCTION/BACKGROUND Performance Management Office FIXED ROUTE DASHBOARD FY 2019 Safety Max Target Goal Preventable Collisions per 100k
FIXED ROUTE DASHBOARD JULY 2018
 FIXED ROUTE DASHBOARD JULY 2018 Safety Max Target Goal Preventable Collisions per 100k Miles Non-Preventable Collisions per 100k Miles Total Incidents per 10,000 Boardings 1.6 1.3 0.8 2.63 2.1 2.0 1.60
Sound Transit Operations January 2014 Service Performance Report. Ridership
 Ridership Total Boardings by Mode Mode Jan-13 Jan-14 % YTD-13 YTD-14 % ST Express 1,343,290 1,426,928 6.2% 1,343,290 1,426,928 6.2% Sounder 245,135 256,775 4.7% 245,135 256,775 4.7% Tacoma Link 86,229
APPENDIX B COMMUTER BUS FAREBOX POLICY PEER REVIEW
 APPENDIX B COMMUTER BUS FAREBOX POLICY PEER REVIEW APPENDIX B COMMUTER BUS FAREBOX POLICY PEER REVIEW The following pages are excerpts from a DRAFT-version Fare Analysis report conducted by Nelson\Nygaard
2017/ Q1 Performance Measures Report
 2017/2018 - Q1 Performance Measures Report Contents Ridership & Revenue... 1 Historical Revenue & Ridership... 1 Revenue Actual vs. Planned... 3 Mean Distance Between Failures... 5 Maintenance Cost Quarter
Board of Directors Information Summary
 Regional Public Transportation Authority 302 N. First Avenue, Suite 700, Phoenix, Arizona 85003 602-262-7433, Fax 602-495-0411 Board of Directors Information Summary Agenda Item #6 Date July 11, 2008 Subject
PERFORMANCE REPORT JANUARY Keith A. Clinkscale Performance Manager
 PERFORMANCE REPORT JANUARY 2018 Keith A. Clinkscale Performance Manager INTRODUCTION/BACKGROUND Keith A. Clinkscale Performance Manager FIXED ROUTE DASHBOARD JANUARY 2018 Safety Max Target Goal Preventable
Matt Miller, Planning Manager Margaret Heath-Schoep, Paratransit & Special Projects Manager
 DATE May 2, 218 Item #12 TO FROM GCTD Board of Directors Matt Miller, Planning Manager Margaret Heath-Schoep, Paratransit & Special Projects Manager MS SUBJECT I. EXECUTIVE SUMMARY This quarterly report
Sound Transit Operations December 2014 Service Performance Report. Ridership
 Ridership Total Boardings by Mode Mode Dec-13 Dec-14 % YTD-13 YTD-14 % ST Express 1,266,130 1,396,787 10.3% 16,605,299 17,661,976 6.4% Sounder 248,710 285,016 14.6% 3,035,735 3,361,317 10.7% Tacoma Link
Existing Services, Ridership, and Standards Report. June 2018
 Existing Services, Ridership, and Standards Report June 2018 Prepared for: Prepared by: Contents Overview of Existing Conditions... 1 Fixed Route Service... 1 Mobility Bus... 34 Market Analysis... 41 Identification/Description
SAMTRANS TITLE VI STANDARDS AND POLICIES
 SAMTRANS TITLE VI STANDARDS AND POLICIES Adopted March 13, 2013 Federal Title VI requirements of the Civil Rights Act of 1964 were recently updated by the Federal Transit Administration (FTA) and now require
Quarterly Report Transit Bureau, Local Transit Operations. First Quarter, Fiscal Year 2015 (July 2014 September 2014) ART & STAR
 ART & STAR") Quarterly Report Transit Bureau, Local Transit Operations First Quarter, Fiscal Year 2015 (July 2014 September 2014) ART & STAR A Arlington Transit ART 1) Introduction The purpose of ART is to provide
Quarterly Report Transit Bureau, Local Transit Operations First Quarter, Fiscal Year 2015 (July 2014 September 2014) ART & STAR A Arlington Transit ART 1) Introduction The purpose of ART is to provide
September 2014 Prepared by the Department of Finance & Performance Management Sub-Regional Report PERFORMANCE MEASURES
 September 2014 Prepared by the Department of Finance & Performance Management 2013 Sub-Regional Report PERFORMANCE MEASURES REGIONAL PERFORMANCE MEASURES RTA staff has undertaken the development of a performance
Sound Transit Operations March 2018 Service Performance Report. Ridership
 March 218 Service Performance Report Ridership Total Boardings by Mode Mar-17 Mar-18 % YTD-17 YTD-18 % ST Express 1,622,116 1,47,79-4.6% 4,499,798 4,428,14-1.6% Sounder 393,33 39,6.% 1,74,96 1,163,76 8.3%
Peer Performance Measurement February 2019 Prepared by the Division of Planning & Market Development
 2017 Regional Peer Review Peer Performance Measurement February 2019 Prepared by the Division of Planning & Market Development CONTENTS EXECUTIVE SUMMARY... 3 SNAPSHOT... 5 PEER SELECTION... 6 NOTES/METHODOLOGY...
YOSEMITE AREA REGIONAL TRANSPORTATION SYSTEM
 YOSEMITE AREA REGIONAL TRANSPORTATION SYSTEM Short Range Transit Plan Prepared for the Merced County Association of Governments/YARTS Prepared by LSC Transportation Consultants, Inc. YOSEMITE AREA REGIONAL
Scorecard Key Performance Indicators
 Scorecard Key Performance Indicators 1 st Quarter 2013 NICE Bus Fixed Route NICE Bus Fixed Route Definitions Scheduled Revenue Hours Full Trip Revenue Hours Lost Runs Missed Revenue Hours Lost Actual Hours
Sound Transit Operations August 2015 Service Performance Report. Ridership
 Ridership Total Boardings by Mode Mode Aug-14 Aug-15 % YTD-14 YTD-15 % ST Express 1,534,241 1,553,492 1.3% 11,742,839 12,354,957 5.2% Sounder 275,403 326,015 18.4% 2,139,086 2,463,422 15.2% Tacoma Link
METROBUS SERVICE GUIDELINES
 METROBUS SERVICE GUIDELINES In the late 1990's when stabilization of bus service was accomplished between WMATA and the local jurisdictional bus systems, the need for service planning processes and procedures
MONTHLY OPERATIONS REPORT DECEMBER 2015
 MONTHLY OPERATIONS REPORT DECEMBER 215 Table of Contents DECEMBER 215 Section Page December Highlights... 3 Strategic Goals Progress Update... 4 Ridership... 6 Revenue... 9 Expenses... 1 System Summary...
Attachment C: 2017/2018 Halifax Transit Year End Performance Report. 2017/2018 Year End Performance Measures Report
 Attachment C: 2017/2018 Halifax Transit Year End Performance Report 2017/2018 Year End Performance Measures Report Contents Annual Key Performance Indicators (KPIs)... 1 Weekday Cost per Passenger... 1
OCTA s ACCESS Service The Way to Go!!!!
 SUMMARY The Orange County Transit Authority (OCTA) is responsible for the public transportation services in Orange County. It provides fixed-route public transportation, rail service, manages the State
LA Metro Rapid - Considerations in Identifying BRT Corridors. Martha Butler LACMTA, Transportation Planning Manager Los Angeles, California
 LA Metro Rapid - Considerations in Identifying BRT Corridors Martha Butler LACMTA, Transportation Planning Manager Los Angeles, California LA Metro Transportation planner/coordinator, designer, builder
MONTHLY OPERATIONS REPORT SEPTEMBER 2015
 MONTHLY OPERATIONS REPORT SEPTEMBER 215 Table of Contents SEPTEMBER 215 Section Page September Highlights... 3 Strategic Goals Progress Update... 4 Ridership... 6 Revenue... 9 Expenses... 1 System Summary...
Annual Route Report Operating Data. Prepared for: Board of Directors. Final 4/26/2018
 Annual Route Report 2017 Operating Data Prepared for: Board of Directors Final 4/26/2018 Upon request, alternative formats of this document will be produced for people with disabilities. Please call 325-6094
ESCAMBIA COUNTY AREA TRANSIT MTAC REPORT
 ESCAMBIA COUNTY AREA TRANSIT MTAC REPORT November 8, 2017 Meeting Escambia County Area Transit 1515 W. Fairfield Drive Pensacola, FL 32501 850-595-3228 INTRODUCTION 2 Summary Background MTAC ECAT Benchmarks
ORANGE COUNTY TRANSPORTATION AUTHORITY. Transit System Study Pilot Project Implementation Plans. Attachment A
 ORANGE COUNTY TRANSPORTATION AUTHORITY Transit System Study Pilot Project Implementation Plans Attachment A ATTACHMENT A 1 Transit System Study Pilot Projects Implementation Plan Report May 25, 2012 Background
2017/2018 Q3 Performance Measures Report. Revised March 22, 2018 Average Daily Boardings Comparison Chart, Page 11 Q3 Boardings figures revised
 2017/2018 Q3 Performance Measures Report Revised March 22, 2018 Average Daily Boardings Comparison Chart, Page 11 Q3 Boardings figures revised Contents Ridership & Revenue... 1 Historical Revenue & Ridership...
Chapter 3. Burke & Company
 Chapter 3 Burke & Company 3. WRTA RIDERSHIP AND RIDERSHIP TRENDS 3.1 Service Overview The Worcester Regional Transit Authority (WRTA) provides transit service to over half a million people. The service
Contents EXECUTIVE SUMMARY... 7 Study Timeframe... 7 Study Organization... 7 Data Analysis... 7 Public Involvement... 7 Recommendations... 7 INTRODUCT
 Page 1 Contents EXECUTIVE SUMMARY... 7 Study Timeframe... 7 Study Organization... 7 Data Analysis... 7 Public Involvement... 7 Recommendations... 7 INTRODUCTION TO PASADENA TRANSIT AND PASADENA DIAL-A-RIDE...
Executive Summary. Introduction. Community Assessment
 Executive Summary Introduction The Red Rose Transit Authority (RRTA) Transit Development Plan provides an evaluation of existing RRTA fixed route services, with the outcome being practical recommendations
Contents EXECUTIVE SUMMARY... 7 Report Timeframe & Data... 7 Study Organization... 7 Data Analysis... 7 Public Involvement... 7 Recommendations... 8 I
 Page 1 Contents EXECUTIVE SUMMARY... 7 Report Timeframe & Data... 7 Study Organization... 7 Data Analysis... 7 Public Involvement... 7 Recommendations... 8 INTRODUCTION TO PASADENA TRANSIT AND PASADENA
List of Figures... 4 List of Maps... 6 Introduction... 7 Data Sources... 8
 SERVICE EVALUATION APRIL 2014 Table of Contents List of Figures... 4 List of Maps... 6 Introduction... 7 Data Sources... 8 Service Overview and Service Fundamentals System Overview... 9 Service Area...
PUBLIC TRANSIT IN KENOSHA, RACINE, AND MILWAUKEE COUNTIES
 PUBLIC TRANSIT IN KENOSHA, RACINE, AND MILWAUKEE COUNTIES #118404v1 Regional Transit Authority June 19, 2006 1 Presentation Overview Existing Public Transit Transit System Peer Comparison Recent Transit
SUB-REGIONAL PERFORMANCE MEASURES
 SUB-REGIONAL PERFORMANCE MEASURES 29 REPORT Overall regional performance is a function of five major areas: Service Coverage - monitors both how much service is available to people in the region (in terms
CHAPTER 5: Operations Plan
 CHAPTER 5: Operations Plan Report Prepared by: Contents 5 OPERATIONS PLAN... 5-1 5.1 Proposed Service Changes... 5-2 5.1.1 Fiscal Year 2017... 5-2 5.1.2 Fiscal Year 2018... 5-6 5.1.3 Fiscal Year 2019...
Sound Transit Operations June 2016 Service Performance Report. Ridership
 Ridership Total Boardings by Mode Mode Jun-15 Jun-16 % YTD-15 YTD-16 % ST Express 1,622,222 1,617,420-0.3% 9,159,934 9,228,211 0.7% Sounder 323,747 361,919 11.8% 1,843,914 2,099,824 13.9% Tacoma Link 75,396
BaltimoreLink Implementation Status Report
 BaltimoreLink Implementation Status Report February 218 Joint Chairmen s Report JH1 Executive Summary BaltimoreLink, implemented on June 18, 217, is the complete overhaul and rebranding of the core transit
DISTRICT EXPRESS LANES ANNUAL REPORT FISCAL YEAR 2017 JULY 1, 2016 JUNE 30, FloridaExpressLanes.com
 DISTRICT EXPRESS LANES ANNUAL REPORT FISCAL YEAR 2017 JULY 1, 2016 JUNE 30, 2017 FloridaExpressLanes.com This page intentionally left blank. TABLE OF CONTENTS List of Figures... ii List of Tables.... ii
Demand-Responsive Transportation in the TCQSM
 Demand-Responsive Transportation in the TCQSM Buffy Ellis KFH Group, Inc. Presentation Overview Brief introduction to the project DRT in the TCQSM, 1st Edition DRT in the TCQSM, 2nd Edition Key Issues
PTN-128 Reporting Manual Data Collection and Performance Reporting
 2016 PTN-128 Reporting Manual Data Collection and Performance Reporting Sponsored by the Texas Department of Transportation Table of Contents PTN-128 WHAT, WHY AND WHO... 6 What is the PTN-128... 13 Why
Operational Performance
 Customer Services, Operations, and Safety Committee Board Action/Information Item III-A January 10, 2008 Operational Washington Metropolitan Area Transportation Authority Board Action/Information Summary
Bus Operations Report
 Third Quarter FY 216 (January 1 - March 31, 216) Wednesday April 27, 216 Operations Ridership: 783,194 passengers used in the third quarter. This represents a 2% increase over the same period in FY 215.
October REGIONAL ROUTE PERFORMANCE ANALYSIS
 October 2018 2017 REGIONAL ROUTE PERFORMANCE ANALYSIS The Council s mission is to foster efficient and economic growth for a prosperous metropolitan region Metropolitan Council Members Alene Tchourumoff
2nd Quarter. AEDC is pleased to present the Anchorage Quarterly Economic Indicators Report for the second quarter of 2010.
 2010 AEDC is pleased to present the Anchorage Quarterly Economic Indicators Report for the second quarter of 2010. This report summarizes recently updated data from the Anchorage Economic Indicators Database,
Fixed-Route Operational and Financial Review
 Chapter II CHAPTER II Fixed-Route Operational and Financial Review Chapter II presents an overview of route operations and financial information for KeyLine Transit. This information will be used to develop
Proposition E: Municipal Transportation Quality Review
 Proposition E: Municipal Transportation Quality Review July 1, 2006 June 30, 2008 FINAL REPORT Nelson Nygaard c o n s u l t i n g a s s o c i a t e s Table of Contents Introduction... 1 Summary... 1 Background...
COLT RECOMMENDED BUSINESS PLAN
 COLT RECOMMENDED BUSINESS PLAN 2008 INTRODUCTION The past decade has been one of change in Lebanon County and this situation is expected to continue in the future. This has included growth in population,
Administrative Operations Report
 Fiscal Year 2017/18 Administrative Operations Report November 1, 2018 Prepared by: El Dorado County Transit Authority 6565 Commerce Way Diamond Springs, CA 95619 (530) 642-5383 www.eldoradotransit.com
FY Transit Needs Assessment. Ventura County Transportation Commission
 FY 18-19 Transit Needs Assessment Ventura County Transportation Commission Contents List of Figures and Appendices.. 2 Appendices... 1 Chapter 1: Introduction What is the Ventura County Transportation
METRO OPERATIONS COMMITTEE
 Los Angeles County Metropolitan Transportation Authority Item 1 CHIEF OPERATIONS OFFICER S S REPORT METRO OPERATIONS COMMITTEE Lonnie Mitchell Chief Operations Officer May 19, 20 1 Employee Recognition
Mobile Farebox Repair Program: Setting Standards & Maximizing Regained Revenue
 Mobile Farebox Repair Program: Setting Standards & Maximizing Regained Revenue Michael J. Walk, Chief Performance Officer Larry Jackson, Directory of Treasury Maryland Transit Administration March 2012
Community Feedback and Survey Participation Topic: ACCESS Paratransit Services
 Community Feedback and Survey Participation Topic: ACCESS Paratransit Services Fall 2014 Valley Regional Transit DEAR SURVEY PARTICIPANT, In summer 2014, staff from Valley Regional Transit and the transportation
Fiscal Management and Control Board. Fare Policy October 16, Draft for Discussion & Policy Purposes Only
 Fiscal Management and Control Board Fare Policy October 16, 2015 1 Components of Fares Fare Level Different types of pricing by: By mode By time of day By distance By rider type (reduced fare) Subscription
Board Box. February Item # Item Staff Page 1. Key Performance Indicators M. Thompson Financial Report for Dec H.
 Board Box February 2016 Item # Item Staff Page 1. Key Performance Indicators M. Thompson 2-8 2. Financial Report for Dec. 2015 H. Rodriguez 9-13 ITEM 1 February 15, 2016 TO: FROM: RE: BOARD OF DIRECTORS
KING STREET TRANSIT PILOT
 KING STREET TRANSIT PILOT Update toronto.ca/kingstreetpilot #kingstreetpilot HIGHLIGHTS TRANSIT RIDERSHIP TRANSIT CAPACITY To respond to this growth in ridership, the TTC has increased the capacity of
DRT Performance Measurement: the U.S. Experience
 DRT Performance Measurement: the U.S. Experience FOR ANYBODY GOING ANYWHER IN LA HABRA International Conference on Demand Responsive Transportation Breckenridge, Colorado September 2016 DRT Performance
National Rail Performance Report - Quarter /14
 A London TravelWatch report The voice of transport users National Rail Performance Report - July 2014 London TravelWatch is the official body set up by Parliament to provide a voice for London s travelling
Mount Pleasant (42, 43) and Connecticut Avenue (L1, L2) Lines Service Evaluation Study Open House Welcome! wmata.com/bus
 and Connecticut Avenue (L1, L2) Lines Service Evaluation Study Open House Welcome! wmata.com/bus") Mount Pleasant (42, 43) and Connecticut Avenue (L1, L2) Lines Service Evaluation Study Open House Welcome! Study Overview and Timeline Phase 1: Collect and Analyze Data Project Kickoff, September 2017
Mount Pleasant (42, 43) and Connecticut Avenue (L1, L2) Lines Service Evaluation Study Open House Welcome! Study Overview and Timeline Phase 1: Collect and Analyze Data Project Kickoff, September 2017
Metro. Board Report. File #: , File Type: Informational Report Agenda Number: 25
 Metro Board Report Los Angeles County Metropolitan Transportation Authority One Gateway Plaza 3rd Floor Board Room Los Angeles, CA File #: 2016-0249, File Type: Informational Report Agenda Number: 25 SYSTEM
1 YORK REGION TRANSIT/ VIVA SYSTEM PERFORMANCE
 Report No. 6 of the Transportation Services Committee Regional Council Meeting of June 23, 2011 1 YORK REGION TRANSIT/ VIVA SYSTEM PERFORMANCE The Transportation Services Committee recommends: 1. Receipt
Norwalk H.S. Norwalk Green Line Station. Lakewood Green Line Station NORWALK. Bellflower H.S. Studebaker Rd. Cerritos College. Gahr H.S.
 Blvd Blvd Blvd EXISTING NETWORK Transit Hills Blue Metro Cabrillo 92 7 76 2 8 82 74 7 6 7 72 Poly 2 2 2 Mall 7s 3 4 4 46 8 s 3 Green Medical 2 2 76 92 73 7 9 9 94 Wilson 3 92 72 2 72 72 73 73 Norwalk Gahr
MONTHLY REPORT SEPTEMBER 2017
 MONTHLY REPORT 2017 SUN SHUTTLE RIDERSHIP ROUTE PASSENGERS: CURRENT YEAR PRIOR YEAR AMOUNT PERCENTAGE BUDGET AMOUNT PERCENTAGE TOTAL PASSENGERS 17,250 20,318 (3,068) -15.1% 18,231 (981) -5.4% CALENDAR
St. Johns County Transit Development Plan Update
 St. Johns County Transit Development Plan Update 2012-2021 Demographic Information Population 190,000 people in 2010 51% increase from 2000 Employment 64% over age 16 in labor force St. Augustine, Ponte
Sound Transit Operations March 2017 Service Performance Report. Ridership. Total Boardings by Mode
 March 217 Service Performance Report Ridership ST Express Sounder Tacoma Link Link Paratransit Mar-16 Mar-17 % 1,83,4 1,621,49 2.4% 37,496 82,631 1,264,47 3,821 Total Boardings by Mode 389,98 87,39 1,89,43,297
SRTA Year End Fixed Route Ridership Analysis: FY 2018
 SRTA Year End Fixed Route Ridership Analysis: FY 2018 2018 Contents Introduction... 1 A. Key Terms Used in this Report... 1 Key Findings... 2 A. Ridership... 2 B. Fare Payment... 4 Performance Analysis
1 DEMAND RESPONSE OVERVIEW
 1 DEMAND RESPONSE OVERVIEW Forty-nine transit agencies in Ohio operate demand response service, not including demand response services operated as part of the transit service provided in conjunction with
Table of Contents. List of Tables
 Table of Contents 1. Introduction... 1 2. Service Recommendations... 1 A. Extend Service on Fort Belvoir to New Post Exchange/Commissary Complex... 1 B. Improve Service Frequencies on Sunday from Current
General Issues Committee Item Transit Operating Budget Ten Year Local Transit Strategy
 General Issues Committee Item 4.1 2017 Transit Operating Budget Ten Year Local Transit Strategy January 27, 2017 Presentation Outline 2017 Operating Budget Overview Ten Year Local Transit Strategy 2 2017
WESTERN EL DORADO COUNTY SHORT AND LONG-RANGE TRANSIT PLAN Executive Summary
 WESTERN EL DORADO COUNTY SHORT AND LONG-RANGE TRANSIT PLAN Executive Summary Prepared for the El Dorado County Transportation Commission Prepared by The El Dorado County Transportation Commission (EDCTC)
Sound Transit Operations January 2018 Service Performance Report. Ridership
 January 218 Service Performance Report Ridership Total Boardings by Mode Jan-17 Jan-18 % YTD-17 YTD-18 % ST Express 1,3,33 1,7,91.3% 1,3,33 1,7,91.3% Sounder 367,33 416,8 13.3% 367,33 416,8 13.3% Tacoma
Sound Transit Operations January 2017 Service Performance Report. Ridership. Total Boardings by Mode
 January 217 Service Performance Report Ridership ST Express Sounder Tacoma Link Link Paratransit Jan-16 Jan-17 % 1,433,7 1,3,33 4.9% 331,27 7,121 98,411 3,633 Total Boardings by Mode 363,6 74,823 1,76,914
Orange County Transportation Authority Fare Integration Project A Regional Approach
 Orange County Transportation Authority Fare Integration Project A Regional Approach APTA Fare Collection Workshop and TransITech Conference March 2012 Agenda Review our Regional Efforts Describe the Southern
Auckland Transport Quarterly Indicators Report 2018/19
 Attachment 1 Auckland Transport ly Indicators Report 218/19 September 218 Table of Contents Page 2. 1. Executive summary 2. External indicators 3. Performance by Key Priority 3.1 Deliver an efficient and
Prior to reviewing the various performances of Red Apple Transit, it is important to point out some key terminology, including:
 CHAPTER IV INTRODUCTION Chapter IV presents an overview of operations and financial information for Red Apple Transit. Information on the current system ridership is also presented. This information was
All Door Boarding Title VI Service Fare Analysis. Appendix P.3
 All Door Boarding Title VI Service Fare Analysis Appendix P.3 Metro Board Report Los Angeles County Metropolitan Transportation Authority One Gateway Plaza 3rd Floor Board Room Los Angeles,
(This page intentionally left blank.)
") Executive Summary (This page intentionally left blank.) Executive Summary INTRODUCTION The Cache Valley Transit District (CVTD) contracted with the team of Transportation Consultants, Inc. () and Fehr
Executive Summary (This page intentionally left blank.) Executive Summary INTRODUCTION The Cache Valley Transit District (CVTD) contracted with the team of Transportation Consultants, Inc. () and Fehr
DEMOGRAPHICS AND EXISTING SERVICE
 EXECUTIVE SUMMARY The Central Corridor light-rail transit (LRT) project will open in 2014 and operate between downtown Minneapolis and downtown St. Paul, serving the University of Minnesota and University
Transport Indicators Report June 2018
 Transport Indicators Report June 2018 Board Meeting 21 August 2018 Recommendation That the Board: i. Receives this report. Executive summary 1. The attached Monthly and Quarterly Indicator Reports provide
Fare Revenue Report 2016 FARE REVENUE REPORT
 FARE REVENUE REPORT Table of Contents Overview 3 Sound Transit Key Operational Milestones 4 Fare Structure 5 ST Express 5 Sounder 5 Link 6 Tacoma Link 7 Farebox Recovery 7 ST Express 7 Sounder 8 Link 8
Appendix A: Regional Fare Policy, SANDAG
 cover Appendix A: Regional Fare Policy, SANDAG BOARD POLICY NO. 029 REGIONAL FARE POLICY AND COMPREHENSIVE FARE ORDINANCE Purpose: To establish guidelines for setting a uniform, fair, and equitable areawide
Memorandum. DATE: May 9, Board of Directors. Jim Derwinski, CEO/Executive Director. Fare Structure Study Fare Pilot Program
 Memorandum DATE: May 9, 2018 TO: FROM: SUBJECT: Board of Directors Jim Derwinski, CEO/Executive Director Fare Structure Study Fare Pilot Program RECOMMENDATION Board action is requested to approve an ordinance
GCTD Technical Advisory Committee (TAC) 10:00 a.m. - Wednesday, July 18, 2018 Gold Coast Transit District - Board Room.
 10:00 a.m. - Wednesday, July 18, 2018 Gold Coast Transit District - Board Room.") GCTD Technical Advisory Committee (TAC) 10:00 a.m. - Wednesday, July 18, 2018 Gold Coast Transit District - Board Room Meeting Summary TAC Members Present: David Fleisch, County of Ventura; Sergio Albarran,
GCTD Technical Advisory Committee (TAC) 10:00 a.m. - Wednesday, July 18, 2018 Gold Coast Transit District - Board Room Meeting Summary TAC Members Present: David Fleisch, County of Ventura; Sergio Albarran,
Regional Fare Change Overview. Nick Eull Senior Manager of Revenue Operations Metro Transit
 Regional Fare Change Overview Nick Eull Senior Manager of Revenue Operations Metro Transit Committee of the Whole April 5 th, 2017 Today s Presentation Fare change goals and considerations Public engagement
Service Plan
 ATTACHMENT A Service Plan 2018-2019 May 2, 2018 Omnitrans 1700 W. Fifth St. San Bernardino, CA 92411 185 (This Page Intentionally Left Blank) i Page 186 TABLE OF CONTENTS Table of Contents... ii List of
SAN MATEO COUNTY TRANSIT DISTRICT STATE OF CALIFORNIA * * * CODIFIED TARIFF
 Adopted May 26, 1976 Revised June 3, 2015 Effective July 1, 2015 SAN MATEO COUNTY TRANSIT DISTRICT STATE OF CALIFORNIA * * * CODIFIED TARIFF I. CLASSIFICATION OF ROUTE SERVICE A. Local Service Transit
Peer Performance Measurement February 2019 Prepared by the Division of Planning & Market Development
 2017 Sub-Regional Peer Review Peer Performance Measurement February 2019 Prepared by the Division of Planning & Market Development CONTENTS EXECUTIVE SUMMARY... 3 NOTES/METHODOLOGY... 6 AGENCIES... 7
MEMORANDUM. Lynn Hayes LSA Associates, Inc.
 MEMORANDUM To: Lynn Hayes LSA Associates, Inc. Date: May 5, 217 From: Zawwar Saiyed, P.E., Senior Transportation Engineer Justin Tucker, Transportation Engineer I Linscott, Law & Greenspan, Engineers LLG
Ozaukee County Transit Development Plan
 Ozaukee County Transit Development Plan Record of Public Comments and Recommended Transit Service Plan June 5, 2018 Kevin Muhs Deputy Director #242846 Status of the Transit Development Plan Existing Conditions