MONTHLY REPORT SEPTEMBER 2017
|
|
|
- Aron Melvin O’Brien’
- 5 years ago
- Views:
Transcription


1 & MONTHLY REPORT SEPTEMBER 2017
2 SECTION Sun Tran & Sun Van Monthly Operations Report Table of Contents September 2017 PAGE I.System Highlights and Accomplishments 3-10 II.Sun Tran a.ridership 11 b.revenue 12 c.pass Sales 13 d.summary of Expenses 14 e.system Summary 15 f.annual Ridership 16 g.performance Indicators h.route Performance Profile 28 i.route Passenger Per Hour Ranking 29 j.customer Satisfaction 30 III.Sun Van a.ridership & Revenue Collection 31 b.summary of Expenses 32 c.system Summary d.annual Ridership 35 e.performance Indicators f.customer Satisfaction 42 IV.Glossaries
3 Sun Tran & Sun Van Strategic Goals Progress Update September 2017 In addition to highlighting major accomplishments and programs each month, this section communicates Sun Tran and Sun Van s ongoing efforts to achieve FY 2018 system goals and objectives. Provide Excellent Customer Service Sun Tran Customer Service Sun Tran s Customer Service Center answered 93.0 percent of the total number of calls received, the same as the previous month and a 2.0 percent increase over September Sun Tran experienced a 58.8 percent decrease in compliments, when compared to the previous month. The number of complaints during the month increased by 2.8 percent when compared to the previous month and increased by 2.0 percent when compared to the same time last year. Customer Service Representatives met the established goal of answering at least 85 percent of total calls, keeping the average ring time at 14 seconds or less and keeping the calls at 90 seconds or less. These goals are to help ensure better service for the thousands of passengers who phone the call center. Sun Van Customer Calls Sun Van s Dispatch answered 87.6 percent of calls received during the month of September, a decrease of 0.7 percent from August 2017, reaching their goal, and a 1.5 percent decrease from September Reservations answered 96.1 percent of calls during the month of September, a decrease of 0.2 percent from August 2017, and a decrease of.54 percent when compared to September Spanish Reservations answered 95.5 percent of the calls received, a 0.4 percent increase from August 2017, and a 1.3 percent decrease from September
4 Sun Tran & Sun Van Strategic Goals Progress Update September 2017 Dispatch answered 15,524 calls. Reservations answered 16,463. Reservations Spanish answered 972 calls. In September 2016, Sun Van staff answered 16,387 in Dispatch, 16,936 in Reservations, and 942 in Spanish Reservations. The percentage of abandoned calls to Dispatch was 3.2 percent, not reaching the goal of less than 2.75 percent. Reservations abandoned calls were 2.0 percent, and Spanish Reservations abandoned calls were 2.4 percent, reaching their goal of 3 percent or less. On-time performance for the month of September 2017 was approximately 93 percent. Special Services Office Activity The Special Services staff assisted approximately 4,800 customers during the month of September. The daily average was 218 customers compared to 234 for the prior month of August The daily average for September 2016 was 241. Staff issued a total of 2,521 SunGO ID & Cards during the month of September 2017, compared to 2,920 issued in August 2017 and 3,006 issued in September 2016 (prior year). Specifically, the cards issued in September 2017 were as follows: 1,839 low-income (468 replacements), 490 disabled (280 replacements), and 192 senior (52 replacements). Agents answered 3,082 calls on the English line or 87.0 percent calls answered, with 410 calls abandoned. The percent calls answered for English in September was lower than the prior month, which was 89.4 percent, and was higher by 0.4 percent from September We continue to monitor staffing needs to improve call statistics and decrease abandoned calls and wait times. Agents also answered 33 calls on the Spanish line with 97.1 percent calls answered with no calls abandoned. The percent calls answered for Spanish in September was higher than the prior month in August 2017, which was 96.1 percent, and lower than in September 2016, which was 100 percent. Ensure an Efficient and Effective Operation Sun Tran Maintenance Goals A total of 139 preventative maintenance inspections of Sun Tran buses were completed, with 100 percent on-time performance. A total of 22 preventative maintenance inspections of support vehicles were completed, with 95.5 percent on-time performance, and 29 A/C inspections of buses were completed, with 100 percent on-time performance. 4
5 Sun Tran & Sun Van Strategic Goals Progress Update September 2017 A total of 17 Quality Assurance Inspections were performed by Maintenance Managers and Supervisors. The active fleet for Garage 1 (South Yard) maintenance shop is 121 buses and the active fleet at Garage 2 (NW Facility) is 125 buses. The total active fleet for the month remains the same as the previous month at 246. Warranty Goal For Fiscal Year 2018, the goal is to reduce cumulative un-recovered warranty by $70,000. The monthly goal is $5, Warranty recovered during the month of September was $8, The cumulative warranty recovered through September was $40, The monthly and cumulative FY 2018 goal was met. Workforce Compliance On 9/8/2017, Sun Tran conducted a conference call with Tucson Transit Management (TTM) to acquire EIN and Tax Numbers for the new management company, as well as to discuss the final transition of employee benefits to TTM. Employee and Labor Relations On 9/5/2017 there was a New Hire orientation class at Sun Van for 11 new Van Operators. On 9/6/2017, Martin Burke, General Manager, held a staff meeting with the HR Department to introduce himself and set expectations. Marty will continue to hold meetings with all department managers and staff. On 9/20/2017, a Pot Luck Luncheon was held at Sun Van for the New Hire Training Class of Van Operators. It was an opportunity for the new class to meet and interact with Sun Van management. PAG Transit Modeling: Sun Tran staff met with PAG computer modeling staff to discuss PAG s transit modeling program which could be used for scheduling and planning. 5
6 Sun Tran & Sun Van Strategic Goals Progress Update September 2017 Remix: Sun Tran staff teleconferenced with Remix to discuss the possibility of incorporating Remix software into scheduling and planning efforts. Cost Saving Measures & Efficient Facilities During the month of September, Sun Tran s Northwest Facility produced 13,840 kwh of electricity from the solar panels. This provides a cost avoidance of approximately $1,384 for the electricity generated and a Tucson Electric Power solar credit reimbursement to the City of Tucson s Department of Transportation of $2,214. Transit Task Force (TTF) The general meeting for the Transit Task Force was postponed in September. Sun Tran staff participated in a Transit Task Force subcommittee meeting to help the group develop a draft vision and mission statement. Improve Safety and Security The safety and security of all employees is a major priority for Sun Tran. Trainings During September, Sun Van s safety manager attended Transit System Security training provided by the Transportation Safety Institute. The training was designed to increase knowledge of Transit System Security and to better understand how it relates to Safety Management Systems (SMS). The primary purposes were to prevent crime and improve customer and employee security. Ten (10) Sun Tran mechanics received Firetrace automatic fire suppression systems maintenance training. They received instruction about the chemicals contained within the unit, plus how to maintain and inspect the fire suppression systems. Two (2) Sun Tran schedulers attended How to Best Serve Customers with Disabilities on Fixed-Route Transportation training. This training was conducted by the Easter Seals Foundation. 6
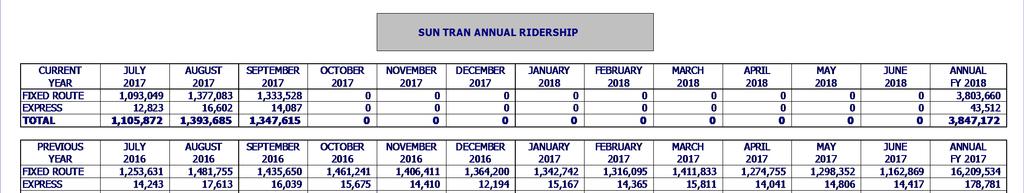
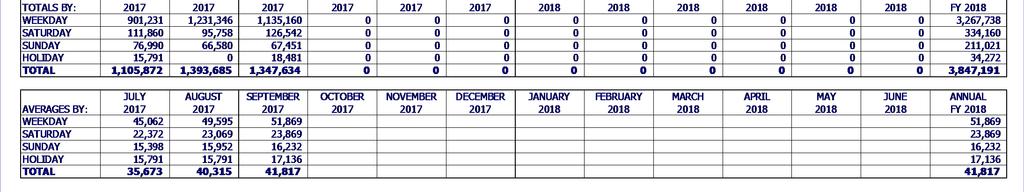
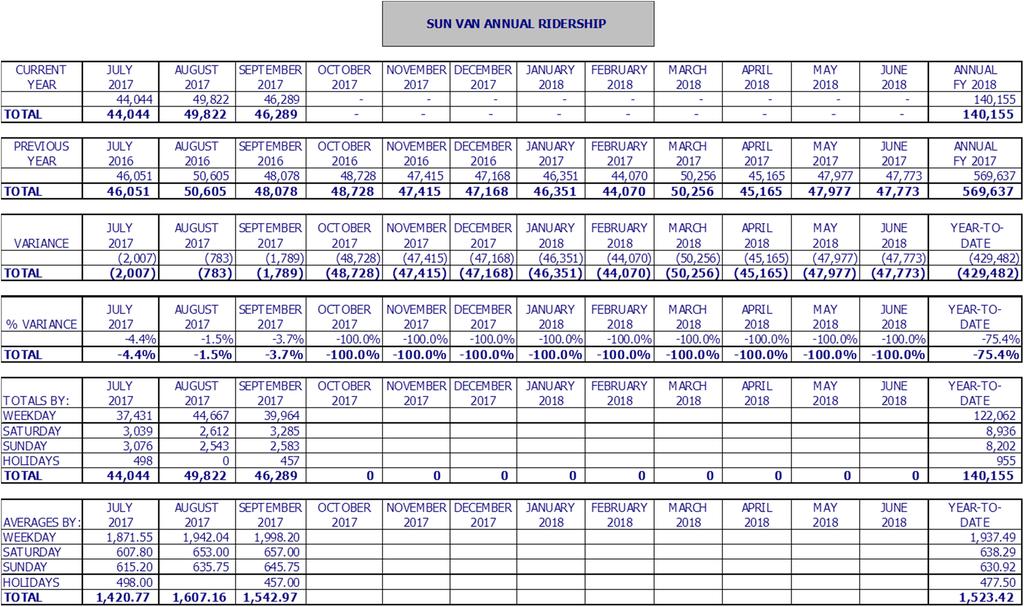
7 Sun Tran & Sun Van Strategic Goals Progress Update September 2017 Increase Ridership Sun Tran Ridership Passenger ridership for September totaled 1,347,634. This is an decrease of 104,055 or 7.2 percent when compared with the prior year and is under the budgeted level by 226,016 or 14.4 percent. Daily ridership shows a decrease when compared to the same time period last year. September Year-to-Date (YTD) passenger ridership was 3,847,191. This is a decrease of 371,740 or 8.8 percent when compared with the prior year and is under the budgeted level by 611,109 or 13.7 percent. YTD daily ridership shows a decrease when compared to the same time period last year. Passenger revenue for September was $918,773. This is a increase of 26,512 or 3 percent when compared to last fiscal year. Also, passenger revenue is below the budgeted level by 171,627 or 15.7 percent. Revenue per passenger boarding in September was $.68 cents compared to $.62 cents last year for the same time period. The overall farebox recovery ratio for September is 18.2 percent, while YTD is 20 percent. Sun Van Ridership Sun Van ridership for September totaled 46,289. This is a decrease of 1,789 or 3.7 percent when compared to September Revenue passengers, excluding Personal Care Attendants (PCA) decreased by 1,910 passengers or 4.2 percent. Total passenger ridership year to date is 140,155. This is a decrease of 4,579 or 3.2 percent when compared to last fiscal year. Revenue passengers, excluding Personal Care Attendants (PCA), decreased by 4,402 passengers or 3.2 percent. Sun Van ridership, ADA and Optional passenger trips for the month of September 2017 were approximately 46,289 trips. This year s trips were approximately 4.0 percent lower when compared to September 2016 ridership. Productivity was 1.73 passengers per hour. 7
8 Sun Tran & Sun Van Strategic Goals Progress Update September 2017 Sun Link Sun Link made final arrangements with the Tucson Roadrunners to create a partnership for the season. Staff sent artwork for a wrap of the Roadrunners Zamboni to make it look like the streetcar. Staff confirmed with the Roadrunners that the Zamboni is wrapped promoting Sun Link. The Zamboni provides high visibility to fans in attendance when it drives around on the hockey rink before games, during the two intermissions, and after the games to smooth out the ice. Sun Tran staff confirmed with Lamar Advertising that the PSA wrap, promoting the use of the streetcar to get to and from hockey games, was installed on a Sun Link vehicle. The Tucson Roadrunners wrap will be on display the entire 7-month hockey season. Staff planned a video shoot for the Tucson Roadrunners on the streetcar. The video will play during intermissions of all home games showing how to ride the streetcar, featuring Dusty the Roadrunners mascot. Staff sent artwork displaying the Sun Link streetcar that will be affixed to the exit doors at Tucson Convention Center closest to the nearest Sun Link stop. Staff from Sun Tran met with representatives from Sun Link and TDOT in communications planning meetings focusing on issues such as the Roadrunners partnership collaboration, Shop Local Day planning, social media planning for large Tucson events, and what to cover in the Marketing Sun Link & Districts Meeting. Marketing campaigns related to Sun Tran and Sun Link ridership Frequent Transit Network: Sun Tran staff began running ads on bus shelters and bus benches to promote commuting on routes of the Frequent Transit Network (FTN). Staff specified advertising locations with AdVision Outdoor at major destinations along routes of the FTN. Staff also created digital ads to run on TucsonNewsNow.com and targeted websites. The digital ads will be served to online users working at specific Travel Reduction Program employers located near FTN routes to encourage commuting by transit, especially on routes of the FTN. U-Pass: Staff created social media posts targeting UA students, staff, and faculty promoting the U-Pass and the GoTucson Transit App for purchasing passes. 3-Day Pass: Sun Tran staff posted fliers at Sun Link stops, and posters in Sun Link and Sun Tran vehicles, and created social media posts promoting the use of the 3-Day Pass. Bulk Sales Discount: Sun Tran staff promoted the bulk sales discount to organizations, answered questions and sold SunGO 1- Day Ticket at a bulk rate discount. 8
9 Sun Tran & Sun Van Strategic Goals Progress Update September 2017 Outreach to hotels: In September, Marketing staff traveled to 49 hotels along Sun Tran and Sun Link routes to speak with staff about transit options for their employees and guests. Staff delivered Sun Link brochures, Frequent Transit Network fliers and GoTucson Transit app stripcards to each hotel. Community Outreach Sun Tran staff held public input meetings throughout the community for proposed Sun Shuttle service changes to Routes 401, 411, 412, 413, and 421. On 9/5/2017 there was a Sun Shuttle Open House with 11 attendees. On 9/7/2017 there was a Sun Shuttle Open House with 2 attendees. On 9/11/2017 there was a Sun Shuttle Open House with 9 attendees. On 9/12/2017 there was a Sun Shuttle Open House with 18 attendees. Staff has, to date, summarized all public input for a report to be presented to the Regional Transportation Authority. Collaborations: Pay for Success program: Sun Tran and TDOT staff met with representatives from Pima County to discuss the Pay for Success program. The program focuses on housing, counseling and transportation for inmates returning from Pima County Jail. Sun Tran staff coordinated with Pima County staff and staff from an organization in Sun Tran s Referral Letter Program to ensure that inmates can quickly receive a SunGO ID & Card to pay the economy fare for transit. AZ Department of Corrections Employment Center: Sun Tran staff met with representatives from TDOT, the Mayor s Office and AZ Department of Corrections to discuss issues returning prisoners face when released from the AZ State Prison. Staff formulated a process which would allow AZ Department of Corrections Employment Center to obtain SunGO ID & Cards 9
10 Sun Tran & Sun Van Strategic Goals Progress Update September 2017 for their inmates prior to release, and to load passes onto inmates cards which would be available on date of release. Southern AZ Transit Advocates: Staff met with Southern AZ Transit Advocates to discuss potential projects for collaboration. Online Passenger Tools Sun Tran s Facebook page had 226 page views. Sun Tran s most popular post, on September 22, was a photo featuring a compliment from a passenger. The post reached 1,071 people, and earned 57 reactions, compared to an average of 343 people reached per post. Sun Tran s Twitter audience is 1,781 followers which is a 0.3 percent increase when compared to the previous month, and a 7.2 percent increase when compared to the same time last year. Sun Tran s Twitter page had 15.3 thousand impressions, a decrease of 64.4 percent when compared to the previous month. The top tweet was for promoting transit to the Greek Festival and earned 1,902 impressions. Sun Tran s website had 128,096 page views, a decrease of 11.5 percent when compared to the previous month. The website had a total of 101,610 unique page views, a decrease of 10.9 percent from the previous month. The average time on a page by a user is 3 minutes 31 seconds, an increase of 3.1 percent from last month. In September, 79.3 percent of sessions were from a mobile device (67,320), and 78,696 users navigated to the Routes & Times page. The Routes & Times page continues to be the most popular page on the Sun Tran website. There were 35,499 new users in September, a decrease of 12.2 percent from the previous month. GoTucson Mobile App The GoTucson mobile app has continued to be promoted during the month of September 2017 through placed advertising, social media and online. The number of individuals utilizing the GoTucson mobile app to ride transit throughout the community was 7,209 compared to 6,749 in August The GoTucson mobile app has continued to be promoted at START sessions, community events, social media and online. 10
 -3.0% 670,730 (128,307) -19.1% EXPRESS FARE 16,781 19,395 (2,614) -13.5% 20,880 (4,099) -19.6% DAY PASS 91,659 86,758 4,901 5.6% 9,090 82,569 908.")
11 SUN TRAN RIDERSHIP SEPTEMBER VARIANCE SEPTEMBER VARIANCE ROUTE PASSENGERS: CURRENT PRIOR AMOUNT PERCENT BUDGET AMOUNT PERCENT FULL FARE 386, ,063 (43,562) -10.1% 497,230 (110,729) -22.3% ECONOMY FARE 542, ,240 (16,817) -3.0% 670,730 (128,307) -19.1% EXPRESS FARE 16,781 19,395 (2,614) -13.5% 20,880 (4,099) -19.6% DAY PASS 91,659 86,758 4, % 9,090 82, % OTHER 71,903 76,175 (4,272) -5.6% 80,960 (9,057) -11.2% ROUTE REVENUE PASSENGERS 1,109,267 1,171,631 (62,364) -5.3% 1,278,890 (169,623) -13.3% TRANSFER PASSENGERS 209, ,134 (39,245) -15.8% 262,210 (52,321) -20.0% CHILDREN =<5 27,660 30,097 (2,437) -8.1% 31,680 (4,020) -12.7% PCA (9) -1.1% 870 (52) -6.0% FREE RIDE DAY % % OTHER ROUTE PASSENGERS 238, ,058 (41,691) -14.9% 294,760 (56,393) -19.1% TOTAL PASSENGERS 1,347,634 1,451,689 (104,055) -7.2% 1,573,650 (226,016) -14.4% (1,347,634) (1,451,689) (1,573,650) CURRENT PRIOR CURRENT Calendar Days School Days Average Route Ridership CURRENT PRIOR Weekdays Weekdays 56,758 59,316 Saturdays Saturday 25,308 28,028 Sundays 4 4 Sunday 16,863 18,633 Holidays 1 1 Holidays 18,481 19,410 Total Total 44,921 48,390 TO DATE SEPTEMBER VARIANCE SEPTEMBER VARIANCE ROUTE PASSENGERS: CURRENT PRIOR AMOUNT PERCENT BUDGET AMOUNT PERCENT FULL FARE 1,042,527 1,176,963 (134,436) -11.4% 1,389,430 (346,903) -25.0% ECONOMY FARE 1,573,583 1,642,918 (69,335) -4.2% 1,826,540 (252,957) -13.8% EXPRESS FARE 49,582 57,687 (8,105) -14.0% 70,830 (21,248) -30.0% DAY PASS 275, ,290 18, % 25, , % OTHER 200, ,934 (21,375) -9.6% 237,530 (36,971) -15.6% ROUTE REVENUE PASSENGERS 3,141,307 3,355,792 (214,485) -6.4% 3,549,870 (408,563) -11.5% TRANSFER PASSENGERS 622, ,672 (148,864) -19.3% 812,170 (189,362) -23.3% CHILDREN =<5 80,553 89,181 (8,628) -9.7% 93,860 (13,307) -14.2% PCA 2,523 2, % 2, % FREE RIDE DAY % % OTHER ROUTE PASSENGERS 705, ,139 (157,255) -18.2% 908,430 (202,546) -22.3% TOTAL PASSENGERS 3,847,191 4,218,931 (371,740) -8.8% 4,458,300 (611,109) -13.7% (3,847,191) (4,218,931) (4,458,300) Calendar Days CURRENT PRIOR School Days Average Route Ridership CURRENT Weekdays CURRENT PRIOR Weekdays 51,869 56,047 Saturdays Saturday 23,869 27,266 Sundays Sunday 16,232 18,505 Holidays 2 2 Holidays 17,136 18,442 PRIOR PRIOR Total Total 41,817 45,858 11
12 SUN TRAN REVENUE SEPTEMBER VARIANCE SEPTEMBER VARIANCE CURRENT PRIOR AMOUNT PERCENT BUDGET AMOUNT PERCENT ROUTE PASSENGER REVENUE: FULL FARE $ 584,941 $ 572,961 $ 11, % $ 724,430 $ (139,489) -19.3% ECONOMY FARE 196, ,281 24, % 197,560 (692) -0.4% EXPRESS FARE 28,063 30,526 (2,463) -8.1% 34,810 (6,747) -19.4% DAY PASS 57,250 53,450 3, % 61,300 (4,051) -6.6% OTHER 51,651 63,042 (11,391) -18.1% 72,300 (20,649) -28.6% TOTAL ROUTE PASSENGER REVENUE $ 918,773 $ 892,260 $ 26, % $ 1,090,400 $ (171,627) -15.7% (918,773) (892,260) $ (1,090,400) TO DATE SEPTEMBER VARIANCE SEPTEMBER VARIANCE CURRENT PRIOR AMOUNT PERCENT BUDGET AMOUNT PERCENT ROUTE PASSENGER REVENUE: FULL FARE $ 1,864,224 $ 1,831,943 $ 32, % $ 2,143,760 $ (279,536) -13.0% ECONOMY FARE 574, ,776 57, % 565,160 9, % EXPRESS FARE 142, ,760 (11,184) -7.3% 168,420 (25,844) -15.3% DAY PASS 167, ,744 35, % 151,000 16, % OTHER 145, ,495 (36,604) -20.1% 209,740 (63,850) -30.4% TOTAL ROUTE PASSENGER REVENUE $ 2,895,131 $ 2,817,717 $ 77, % $ 3,238,080 $ (342,949) -10.6% $ (2,895,131) $ (2,817,717) $ (3,238,080) Notes: YTD Fiscal Year 2017 was adjusted due to formula corrections. YTD pass revenue has been reduced by $89,511 for Sun Link's YTD Fiscal Year 2018 revenue share 89,511 YTD pass revenue has been reduced by $9,119 for Sun Shuttle's YTD Fiscal Year 2018 revenue share 9,119 ` 12
13 SUN TRAN PASSES SOLD AND PASS REVENUE PASSES SOLD PASS REVENUE SEPTEMBER VARIANCE SEPTEMBER VARIANCE CURRENT PRIOR AMOUNT PERCENT CURRENT PRIOR AMOUNT PERCENT MONTHLY 8450 DAY PASS 7,106 5,210 1, % 26,648 18,235 $8, % 8459 DISCOUNTED DAY PASS 15,301 20,123 (4,822) -24.0% 30,602 35,215 ($4,613) -13.1% DAY FULL FARE PASS % 2,065 0 $2, % 8450 FULL FARE 7 DAY % 0 0 $0 0.0% 8450 FULL FARE MONTHLY 4,388 4, % 193, ,944 21, % 8451 ECONOMY MONTHLY 6,744 7,215 (471) -6.5% 119, ,249 13, % 8452 EXPRESS MONTHLY (74) -15.4% 23,709 25,567 (1,857) -7.3% 8455 ANNUAL % 2,500 0 $2, % 8453 COLLEGE PASS (9) -5.6% 13,470 25,340 ($11,869) -46.8% 8453 COLLEGE PASS EXPRESS % 19,551 (228) $19, % 8454 SUMMERGO YOUTH PASS % - - $0 0.0% SUBTOTAL: 34,319 37,398 (3,079) -8.2% $ 432,055 $ 382,322 $ 49, % STORED VALUE 8450 FULL FARE STORED VALUE 33,166 22,735 10, % 49,749 34,103 15, % 8451 ECONOMY STORED VALUE 43,160 56,481 (13,321) -23.6% 25,896 28,241 (2,345) -8.3% 8452 EXPRESS STORED VALUE 969 1,022 (53) -5.2% 2,180 2, % SUBTOTAL: 77,295 80,238 (2,943) -3.7% $ 77,825 $ 64,387 $ 13, % TOTAL 111, ,636 (6,022) -5.1% $ 509, ,709 $ 63, % (509,880) (446,709) (63,172) TO DATE PASSES SOLD PASS REVENUE SEPTEMBER VARIANCE SEPTEMBER VARIANCE CURRENT PRIOR AMOUNT PERCENT CURRENT PRIOR AMOUNT PERCENT MONTHLY 8450 DAY PASS 16,451 10,966 5, % 61,691 38,381 23, % 8459 DISCOUNTED DAY PASS 52,972 53,350 (378) -0.7% 105,944 93,363 12, % DAY FULL FARE PASS % 2, , % 8450 FULL FARE 7 DAY 0 6 (6) % 0 59 (59) % 8450 FULL FARE MONTHLY 12,054 11,053 1, % 527, ,445 77, % 8451 ECONOMY MONTHLY 19,488 21,884 (2,396) -10.9% 345, ,725 22, % 8452 EXPRESS MONTHLY 1,265 1,550 (285) -18.4% 72,877 83,233 (10,356) -12.4% 8455 ANNUAL % 12,009-12, % 8453 COLLEGE PASS 1,262 1,366 (104) -7.6% 106, ,817 (148,435) -58.3% 8453 COLLEGE PASS EXPRESS % 237,723 53, , % 8454 SUMMERGO YOUTH PASS 2 60 (58) -96.7% (1,755) 2,528 (4,283) % SUBTOTAL: 103, ,366 3, % $ 1,470,663 $ 1,299,335 $ 171, % STORED VALUE 103, FULL FARE STORED VALUE 91,116 41,677 49, % 136,674 62,516 74, % 8450 ECONOMY STORED VALUE 120, ,145 (28,196) -18.9% 72,569 74,573 (2,003) -2.7% 8452 EXPRESS STORED VALUE 3,385 3, % 7,616 6,534 1, % SUBTOTAL: 215, ,089 21, % $ 216,860 $ 143,622 $ 73, % (215,450) TOTAL 319, ,455 24, % $ 1,687,522 $ 1,442,957 $ 244, % (1,687,522) 1,442,957 (244,565) Note: FY17 A fare change took effect on January 3,2017 YTD Fiscal Year 2017 was adjusted due to formula corrections. YTD pass revenue has been reduced by $89,511 for Sun Link's YTD Fiscal Year 2018 revenue share 89,511 YTD pass revenue has been reduced by $9,119 for Sun Shuttle's YTD Fiscal Year 2018 revenue share 9,119 13
14 SUMMARY OF EXPENSES SEPTEMBER SEPTEMBER VARIANCE MONTHLY VARIANCE CURRENT PRIOR AMOUNT PERCENT BUDGET AMOUNT PERCENT OPERATOR WAGES $ 1,516,089 $ 1,672,026 $ 155, % $ 1,448,365 $ (67,724) -4.7% MAINTENANCE WAGES 396, ,151 (5,200) -1.3% 392,192 (4,159) -1.1% SALARIES 346, ,798 3, % 350,468 4, % FRINGE BENEFITS 1,134,480 1,048,319 (86,161) -7.6% 1,017,981 (116,499) -11.4% SERVICES 453, ,914 10, % 446,358 (6,890) -1.5% UTILITIES 87,919 76,324 (11,595) -13.2% 64,108 (23,811) -37.1% VEHICLE MAINTENANCE 529, ,772 (178,456) -33.7% 412,191 (117,037) -28.4% MATERIALS AND SUPPLIES 27,465 42,680 15, % 116,221 88, % CNG FUEL 37,766 52,942 15, % 60,808 23, % DIESEL FUEL 359, ,401 97, % 436,308 76, % UNLEADED FUEL 10,045 7,476 (2,569) -25.6% 7,638 (2,407) -31.5% CAPITAL OUTLAY - 134, , % % INSURANCE 147, , , % 160,458 13, % LABOR CREDITS/EXP TRANSFERS (3,031) (5,207) (2,176) 71.8% 59,074 62, % TOTAL EXPENSES $ 5,042,568 $ 5,292,170 $ 249, % $ 4,972,761 $ (69,807) -1.4% SEPTEMBER SEPTEMBER TO DATE CURRENT PRIOR VARIANCE ANNUAL BUDGET BALANCE AMOUNT PERCENT BUDGET AMOUNT PERCENT OPERATOR WAGES $ 4,591,162 $ 4,154,021 $ (437,141) -9.5% $ 17,380,380 $ 12,789, % MAINTENANCE WAGES 1,211,611 1,194,172 (17,439) -1.4% 4,706,300 3,494, % SALARIES 1,133,195 1,022,778 (110,417) -9.7% 4,205,620 3,072, % FRINGE BENEFITS 3,216,494 3,020,805 (195,689) -6.1% 12,215,770 8,999, % SERVICES 989, ,207 (26,793) -2.7% 5,356,290 4,367, % UTILITIES 258, ,857 (52,859) -20.4% 769, , % VEHICLE MAINTENANCE 1,196, ,416 (297,675) -24.9% 4,946,290 3,750, % MATERIALS AND SUPPLIES 171, ,745 (30,442) -17.8% 1,394,650 1,223, % CNG FUEL 121, ,829 30, % 729, , % DIESEL FUEL 1,055, ,803 (140,308) -13.3% 5,235,690 4,180, % UNLEADED FUEL 31,480 22,984 (8,496) -27.0% 91,650 60, % CAPITAL OUTLAY 15, , , % 7,090 (8,164) % INSURANCE 473, ,761 6, % 1,925,500 1,452, % LABOR CREDITS/EXP TRANSFERS (13,355) (13,241) % 708, , % TOTAL EXPENSES $ 14,451,165 $ 13,289,242 $ (1,161,923) -8.7% $ 59,673,120 $ 45,221, % Notes: FY17, there were two events in April which impacted the YTD totals: $117,000 in expenses were included in April MTD but excluded from April YTD $61, in Pcard expenses were posted after April was final and were not included in April MTD or YTD 14
15 SUN TRAN SYSTEM SUMMARY SEPTEMBER VARIANCE SEPTEMBER VARIANCE CURRENT PRIOR AMOUNT PERCENT BUDGET AMOUNT PERCENT RIDERSHIP: TOTAL ROUTE PASSENGERS 1,347,634 1,451,689 (104,055) -7.2% 1,573,650 (226,016) -14.4% REVENUE: TOTAL ROUTE PASSENGER REVENUE $ 918,773 $ 892,260 $ 26, % 1,090,400 (171,627) -15.7% EXPENSES: TOTAL EXPENSES $ 5,042,568 $ 5,292,170 $ 249, % $ 4,972,761 $ (69,807) -1.4% MILES: REVENUE MILES 679, ,288 11, % 678,872 (438) -0.1% DEADHEAD MILES 97,458 98,665 (1,207) -1.2% 95,820 (1,638) -1.7% TOTAL SERVICE MILES 776, ,953 9, % 774,692 (2,076) -0.3% NON-ROUTE MILES 9,494 8,323 1, % 9, % TOTAL MILES 786, ,276 10, % 784,242 (2,020) -0.3% REVENUE HOURS 56,865 54,750 2, % 56, % SERVICE HOURS 61,001 58,758 2, % 61, % TO DATE SEPTEMBER VARIANCE SEPTEMBER VARIANCE CURRENT PRIOR AMOUNT PERCENT BUDGET AMOUNT PERCENT RIDERSHIP: TOTAL ROUTE PASSENGERS 3,847,191 4,218,931 (371,740) -8.8% 4,458,300 (611,109) -13.7% REVENUE: TOTAL ROUTE PASSENGER REVENUE $ 2,895,131 $ 2,817,717 $ 77, % $ 3,238,080 $ (342,949) -10.6% EXPENSES: TOTAL EXPENSES $ 14,451,165 $ 13,289,242 $ (1,161,923) -8.7% $ 14,918,283 $ 467, % MILES: REVENUE MILES 2,096,905 2,043,939 52, % 2,098,364 1, % DEADHEAD MILES 303, ,775 3, % 301,507 (1,759) -0.6% TOTAL SERVICE MILES 2,400,171 2,343,714 56, % 2,399,872 (300) 0.0% NON-ROUTE MILES 31,937 18,511 13, % 26,650 (5,287) -19.8% TOTAL MILES 2,432,108 2,362,225 69, % 2,426,522 (5,586) -0.2% REVENUE HOURS 175, ,171 8, % 175, % SERVICE HOURS 188, ,347 8, % 188, % Notes: Fiscal Year 2017 Miles and Hours were adjusted due to corrections. 15
16 16
17 SUN TRAN PERFORMANCE INDICATORS SEPTEMBER2017 SYSTEM INDICATOR CURRENT MONTH BUDGET AVG YTD 1. RIDERSHIP 1,347,634 1,573,650 1,282, PASSENGER REVENUE $ 918,773 $ 1,090,400 $ 965, PASSENGER PER TOTAL MILE PASSENGER PER HOUR REVENUE PER PASSENGER $ 0.68 $ 0.66 $ REVENUE PER TOTAL MILE $ 1.19 $ 1.23 $ REVENUE PER HOUR $ $ $ FAREBOX RECOVERY RATIO 18.2% 20.2% 20.0% 9. TOTAL COST PER PASSENGER $ 3.74 $ 3.38 $ TOTAL COST PER MILE $ 6.41 $ 6.09 $ TOTAL COST PER SERVICE HOUR $ $ $ MILES BETWEEN ROAD CALLS 11,074 8,200 11, MILES BETWEEN BUS INSPECTION 5,995 6,300 5, TOTAL VEHICLE ACCIDENTS PER 100,000 MILES TOTAL COMPLAINTS PER 100,000 PASSENGER VEHICLES OPERATED IN MAXIMUM SERVICE
18 FY 17 FY 18 Budget Sun Tran Performance Indicators Fiscal Year 2018 Ridership (in millions) Passenger Revenue (in 100 thousands) Jul Aug Sep Oct Nov Dec Jan Feb Mar Apr May Jun 0 Jul Aug Sep Oct Nov Dec Jan Feb Mar Apr May Jun 18
19 FY 17 FY 18 Budget Sun Tran Performance Indicators Fiscal Year 2018 Passengers per Total Mile Passengers per Hour Jul Aug Sep Oct Nov Dec Jan Feb Mar Apr May Jun 0 Jul Aug Sep Oct Nov Dec Jan Feb Mar Apr May Jun 19
20 FY 17 FY 18 Budget Sun Tran Performance Indicators Fiscal Year 2018 Revenue per Passenger Revenue per Total Mile Jul Aug Sep Oct Nov Dec Jan Feb Mar Apr May Jun 0 Jul Aug Sep Oct Nov Dec Jan Feb Mar Apr May Jun 20
21 FY 17 FY 18 Budget Sun Tran Performance Indicators Fiscal Year 2018 Revenue per Hour Farebox Recovery Ratio Jul Aug Sep Oct Nov Dec Jan Feb Mar Apr May Jun 0 Jul Aug Sep Oct Nov Dec Jan Feb Mar Apr May Jun 21
22 FY 17 FY 18 Budget Sun Tran Performance Indicators Fiscal Year 2018 Total Cost per Passenger Total Cost per Mile Jul Aug Sep Oct Nov Dec Jan Feb Mar Apr May Jun Jul Aug Sep Oct Nov Dec Jan Feb Mar Apr May Jun 0 Jul Aug Sep Oct Nov Dec Jan Feb Mar Apr May Jun 22
23 FY 17 FY 18 Budget Sun Tran Performance Indicators Fiscal Year 2018 Total Cost per Mile Total Cost per Service Hour Jul Aug Sep Oct Nov Dec Jan Feb Mar Apr May Jun 0 Jul Aug Sep Oct Nov Dec Jan Feb Mar Apr May Jun 23
24 FY 17 FY 18 Budget Sun Tran Performance Indicators Fiscal Year 2018 Miles Between Road Calls Miles Between Inspections Jul Aug Sep Oct Nov Dec Jan Feb Mar Apr May Jun Revenue vehicle system failures are defined as mechanical problems that cause a vehicle not to complete its scheduled revenue trip, or does not start its next scheduled revenue trip. *Per NTD guidelines Jul Aug Sep Oct Nov Dec Jan Feb Mar Apr May Jun Acceptable range is + or 10% 24
25 FY 17 FY 18 Budget Sun Tran Performance Indicators Fiscal Year 2018 Vehicle Accidents per 100,000 Miles 3.5 Complaints per 100,000 Passengers Jul Aug Sep Oct Nov Dec Jan Feb Mar Apr May Jun 0 Jul Aug Sep Oct Nov Dec Jan Feb Mar Apr May Jun 25
26 Sun Tran Performance Indicators Fiscal Year ,200 2,100 2,000 1,900 1,800 1,700 1,600 1,500 1,400 1,300 1,200 1,100 1, SunGO Issues SunGO Issues Resolved June May April March February January December November October September August July * The SunGO issues are in addition to 29 COM Reports (complaints, inquiries and compliments) that are included in the Sun Tran complaint totals. 26


27 FY 17 FY 18 Sun Tran Performance Indicators Fiscal Year
28 ` SUN TRAN ROUTE PERFORMANCE PROFILE SEPTEMBER 2017 ROUTE TOTAL ROUTE PASSENGERS ROUTE REVENUE TOTAL SERVICE MILES TOTAL SERVICE HOURS TOTAL COST ALLOCATION NET COST PER HOUR PASSENGER PER MILE PASSENGER PER HOUR REVENUE PER MILE REVENUE PER HOUR SUBSIDY PER PASSENGER 1 38,432 $ 26,116 19,800 1,700 $ 135,300 $ $ 1.45 $ $ ,582 15,691 19,969 1, , ,331 46,414 44,250 3, , ,292 73,489 52,647 4, , ,664 15,051 17,269 1, , ,569 33,443 18,608 2, , ,165 48,558 43,178 3, , ,141 77,287 53,628 4, , ,350 36,781 36,817 2, , ,614 19,297 14,282 1,164 94, ,823 59,428 44,841 3, , ,361 21,832 19,049 1, , ,631 23,374 25,493 2, , ,784 69,481 43,310 3, , ,429 44,672 42,724 3, , ,828 55,496 24,191 2, , ,983 19,735 9,212 1,035 74, ,185 8,638 10, , ,850 8,018 9, , ,188 20,955 19,030 1, , ,288 10,086 7, , ,372 26,702 21,924 1, , ,196 13,342 16,537 1,004 93, ,506 15,726 20,860 1, , ,186 23,935 20,421 1, , ,908 40,368 34,692 2, , ,690 12,388 14,515 1,097 92, ,684 8,966 6, , ,515 8,792 11, , TOTAL FIXED ROUTE 1,333, , ,994 58,538 4,770,989 $ $ 1.36 $ $ 2.91 TOTAL ROUTE ROUTE TOTAL SERVICE TOTAL SERVICE TOTAL COST NET COST PASSENGER PASSENGER REVENUE REVENUE SUBSIDY PER ROUTE PASSENGERS REVENUE MILES HOURS ALLOCATION PER HOUR PER MILE PER TRIP PER MILE PER HOUR PASSENGER 101X 1,792 $ 4,569 3, $ 18,208 $ $ 3.14 $ $ X 1,491 3,805 4, , X 831 2,168 1, , X 1,054 2,803 3, , X 1,212 2,954 2, , X 1,464 3,632 9, , X 1,239 3,135 3, , X 591 1,464 3, , X 1,363 3,319 5, , X 548 1,223 3, , X 1,634 3,713 8, , X 865 1,929 5, , TOTAL EXPRESS ROUTE 14,087 34,714 55,651 2, ,579 $ $ 1.10 $ $ TOTAL SERVICE 1,347, , ,645 61,001 5,042,568 $ $ 1.35 $ $ 3.06 Notes: 1) Service miles denotes Scheduled Vehicle Revenue and Deadhead Miles (less Lost Miles) per Route. 2) Effective March 2014: The passenger per hour metric has been replaced with passenger per trip for express route service. Passenger per trip is a better measurement of productivity for express service. 3) Routes 110X is bi-directional express service. 28
29 SUN TRAN RANKING OF ROUTES - ROUTE PASSENGERS PER HOUR SEPTEMBER 2017 RANKING ROUTE NUMBER ROUTE DESCRIPTION PASSENGERS PER HOUR 1 18 S. 6TH AVENUE STONE ORACLE / INA BROADWAY TH AVENUE SPEEDWAY ALVERNON EUCLID/ NORTH FIRST AVENUE FLOWING WELLS TH / 12TH AVENUE GLENN/SWAN S. PARK AVENUE ND STREET TH STREET / WILMOT VALENCIA AJO CRAYCROFT / FT LOWELL COUNTRY CLUB / 29TH STREET BENSON HIGHWAY MISSION ROAD GRANT ROAD PIMA STREET / WEST SPEEDWAY GRANDE WEST CONGRESS / SILVERBELL CHERRYBELL PANTANO CAMPBELL AVENUE LA CHOLLA MIDVALE PARK 14.9 FIXED ROUTE SYSTEM AVERAGE 22.8 RANKING ROUTE NUMBER ROUTE DESCRIPTION PASSENGERS PER TRIP 1 101X GOLF LINKS EXPRESS X INA ROAD EXPRESS X MARANA EXPRESS X BROADWAY EXPRESS X OLDFATHER EXPRESS X SUNRISE EXPRESS X ORO VALLEY/DOWNTOWN EXPRESS X SPEEDWAY/AEROPARK EXPRESS X RITA RANCH/DOWNTOWN EXPRESS X TANQUE VERDE EXPRESS X NW / AEROPARK EXPRESS X ORO VALLEY/AEROPARK EXPRESS 4.6 EXPRESS ROUTE SYSTEM AVERAGE
30 CUSTOMER INFORMATION CENTER The customer service information and call center answered 18,384 phone calls in September That is a 10% decrease from the 20,437 calls answered in August 2017 and a 27% decrease from the 25,316 calls answered in September Sun Tran s website customer feedback response center received 103 s in September That is a 21% decrease over the 130 s received August 2017 and a 43% decrease from the 181 s received in September SERVICE REPORTS COMPARISON SEPTEMBER 2017 SEPTEMBER 2016 % Increase/Decrease Total Service Reports: % Inquiries % Compliments % Complaints % Chargeable SAME Non-chargeable % Pending % Incomplete % SERVICE REPORTS COMPARISON SEPTEMBER 2017 AUGUST 2017 % Increase/Decrease Total Service Reports: % Inquiries % Compliments % Complaints % Chargeable % Non-chargeable % Pending % Incomplete % Notes: 1) Complaints deemed non chargeable were investigated, and the results indicated Sun Tran was not at fault. (Example: bus did not show, bus was early or late, etc.) 2) Incomplete are service reports with incomplete information that did not allow Sun Tran to finish an investigation. 3) Incomplete service reports are held in the event additional facts are provided to finish the investigation. 4) Inquiries are customer questions that are not complaints, but focus on service issues, and are more informational based in the response back to the consumer. 30
31 SUN VAN RIDERSHIP & REVENUE SEPTEMBER VARIANCE SEPTEMBER VARIANCE PASSENGERS: CURRENT PRIOR AMOUNT PERCENT BUDGET AMOUNT PERCENT REGULAR FARE PASSENGERS 11,523 11, % 11,920 (397) -3.3% ECONOMY FARE PASSENGERS 32,397 34,538 (2,141) -6.2% 36,530 (4,133) -11.3% REVENUE PASSENGERS 43,920 45,830 (1,910) -4.2% 48,450 (4,530) -9.3% PERSONAL CARE ATTENDANTS 2,369 2, % 2,470 (101) -4.1% TOTAL PASSENGERS 46,289 48,078 (1,789) -3.7% 50,920 (4,631) -9.1% FARES COLLECTED: REGULAR FARE REVENUE $ 35,541 $ 33,876 $ 1, % $40,560 $ (5,019) -12.4% ECONOMY FARE REVENUE $ 51,086 $ 34,538 $ 16, % $69,535 $ (18,450) -26.5% TOTAL FARES COLLECTED $ 86,627 $ 68,414 $ 18, % $ 110,095 (23,469) -21.3% REVENUE PER PASSENGER $ 1.87 $ 1.42 $ % $ 2.16 $ (0.29) -13.4% Calendar Days: CURRENT PRIOR Average Ridership CURRENT PRIOR Weekdays Weekdays 1,998 2,022 Saturdays 5 4 Saturdays Sundays 4 4 Sundays Holidays 1 1 Holidays Total Total 1,543 1,603 TO DATE SEPTEMBER VARIANCE SEPTEMBER VARIANCE PASSENGERS: CURRENT PRIOR AMOUNT PERCENT BUDGET AMOUNT PERCENT R2 REGULAR FARE PASSENGERS 34,345 32,861 1, % 35,760 (1,415) -4.0% E2 ECONOMY FARE PASSENGERS 98, ,758 (5,886) -5.6% 109,610 (10,738) -9.8% REVENUE PASSENGERS 133, ,619 (4,402) -3.2% 145,370 (12,153) -8.4% P2 PERSONAL CARE ATTENDANTS 6,938 7,115 (177) -2.5% 7,410 (472) -6.4% TOTAL PASSENGERS 140, ,734 (4,579) -3.2% 152,780 (12,625) -8.3% FARES COLLECTED: R2 REGULAR FARE REVENUE $ 105,755 $ 98,583 $ 7, % $121,680 $ (15,925) -13.1% E2 ECONOMY FARE REVENUE $ 155,820 $ 104,758 $ 51, % $208,655 $ (52,835) -25.3% TOTAL FARES COLLECTED $ 261,575 $ 203,341 $ 58, % $ 330,335 (68,760) -20.8% REVENUE PER PASSENGER $ 1.87 $ 1.40 $ % $ 2.16 $ (0.29) -13.4% Calendar Days: CURRENT PRIOR Average Ridership CURRENT PRIOR Weekdays Weekdays 1,937 1,995 Saturdays Saturdays Sundays Sundays Holidays 2 2 Holidays Total Total 1,523 1,573 Notes: FY 2017 correction made due to cancellation 31
32 32
33 SUN VAN SYSTEM SUMMARY RIDERSHIP: SEPTEMBER SEPTEMBER VARIANCE SEPTEMBER VARIANCE CURRENT PRIOR AMOUNT PERCENT BUDGET AMOUNT PERCENT TOTAL DEMAND 60,896 64,587 (3,691) -5.7% 68,810 (7,914) -11.5% DENIALS % % MISSED TRIPS % % CANCELLATIONS 11,271 12,734 (1,463) -11.5% 13,830 (2,559) -18.5% NO SHOWS 3,336 3,775 (439) -11.6% 4,060 (724) -17.8% TOTAL PASSENGERS 46,289 48,078 (1,789) -3.7% 50,920 (4,631) -9.1% ADA PASSENGERS 44,419 43,244 1, % OPTIONAL ADA 1,870 4,834 (2,964) -61.3% PERCENTAGE OF OPTIONAL 4.0% 10.1% TRIPS: ADA TRIPS 41,300 40,285 1, % OPTIONAL ADA TRIPS 1,689 4,538 (2,849) -62.8% TOTAL TRIPS: 42,989 44,823 (1,834) -4.1% 46,850 (3,861) -8.2% EXPENSES: $ 1,254,111 $ 1,318,153 $ 64, % $ 1,287,983 $ (33,872) -2.6% REVENUE HOURS: 22,988 23,589 (601) -2.5% 24,770 (1,782) -7.2% SERVICE HOURS: 26,769 27,540 (771) -2.8% 28,920 (2,151) -7.4% MILES: REVENUE MILES 303, ,318 (15,640) -4.9% 335,300 (31,622) -9.4% DEADHEAD MILES 59,502 65,602 (6,100) -9.3% 68,900 (9,398) -13.6% TOTAL SERVICE MILES 363, ,920 (21,740) -5.6% 404,200 (41,020) -10.1% OTHER MILES 2,410 2, % 4,150 (1,740) -41.9% TOTAL MILES 365, ,952 (21,362) -5.5% 408,350 (42,760) -10.5% Notes: FY 2017 correction made due to cancellation 33
34 SUN VAN SYSTEM SUMMARY TO DATE SEPTEMBER SEPTEMBER VARIANCE SEPTEMBER VARIANCE RIDERSHIP: CURRENT PRIOR AMOUNT PERCENT BUDGET AMOUNT PERCENT TOTAL DEMAND 183, ,903 (10,419) -5.4% 206,460 (22,976) -11.1% DENIALS % % MISSED TRIPS 3 6 (3) -50.0% % CANCELLATIONS 33,622 37,854 (4,232) -11.2% 41,500 (7,878) -19.0% NO SHOWS 9,704 11,309 (1,605) -14.2% 12,180 (2,476) -20.3% TOTAL PASSENGERS 140, ,734 (4,579) -3.2% 152,780 (12,622) -8.3% ADA PASSENGERS 134, ,881 4, % OPTIONAL ADA 5,528 14,853 (9,325) -62.8% PERCENTAGE OF OPTIONAL 3.9% 10.3% TRIPS: ADA TRIPS 125, ,538 4, % OPTIONAL ADA TRIPS 5,000 13,928 (8,928) -64.1% TOTAL TRIPS: 130, ,466 (3,971) -3.0% 140,560 (10,065) -7.2% EXPENSES: $ 3,864,193 $ 3,746,793 $ (117,400) -3.1% $ 3,863,949 $ % REVENUE HOURS: 70,427 70,767 (339) -0.5% 74,310 (3,883) -5.2% SERVICE HOURS: 82,260 82,720 (460) -0.6% 86,860 (4,600) -5.3% MILES: REVENUE MILES 925, ,283 (31,510) -3.3% 1,005,200 (79,427) -7.9% DEADHEAD MILES 185, ,116 (11,760) -6.0% 207,000 (21,644) -10.5% TOTAL SERVICE MILES 1,111,129 1,154,399 (43,270) -3.7% 1,212,200 (101,071) -8.3% OTHER MILES 5,258 6,921 (1,663) -24.0% 12,450 (7,192) -57.8% TOTAL MILES 1,116,387 1,161,320 (44,933) -3.9% 1,224,650 (108,263) -8.8% Notes: FY 2017 correction made due to cancellation 34
35 35
36 36

37 FY 17 FY 18 Budget Sun Van Performance Indicators Fiscal Year

38 FY 17 FY 18 Budget Sun Van Performance Indicators Fiscal Year

39 FY 17 FY 18 Budget Sun Van Performance Indicators Fiscal Year

40 FY 17 FY 18 Budget Sun Van Performance Indicators Fiscal Year


41 FY 17 FY 18 Sun Van Performance Indicators Fiscal Year 2018 * ADA Service only. ** Data does not include same-day requests. 41
42 42
43 Sun Tran Glossary of Terms Ridership (Unlinked Passenger Trips) The number of passengers who board public transportation vehicles. Passengers are counted each time they board vehicles no matter how many vehicles they use to travel from their origin to their destination. Total Cost per Passenger Equals total expenditures divided by total passengers. Passenger per Mile Equals total passengers divided by total miles. Passenger per Service Hour Equals total ridership divided by total service hours. Passenger Revenue Equals revenue collected from passengers (includes farebox revenue and revenue from pass sales). Revenue Miles and Hours The miles and hours that vehicles travel while in revenue service. Vehicle revenue miles and hours (VRM and VRH) include: layover / recovery time. But exclude: deadhead, operator training and maintenance testing, as well as school bus and charter services. Revenue per Mile Equals total passenger revenue divided by total miles. Revenue per Passenger Equals total passenger revenue divided by total passengers Revenue per Service Hour Equals passenger revenue divided by service hours Deadhead Miles and Hours Miles and hours that a vehicle travels when out of revenue service. Deadhead includes: leaving or returning to the garage or yard facility, changing routes, or when there is no expectation of carrying revenue passengers. However, deadhead does not include: charter service, school bus service, operator training, maintenance training. Service Miles and Hours Miles and hours that vehicles travel while in revenue service plus deadhead miles and hours. But exclude: charter and school bus service, operator training, and maintenance testing. Total Cost per Mile Equals total expenditures divided by total miles. Cost per Mile Equals total expenditures less Operating Grant Funds divided by total miles. Cost per Service Hour Equals total expenditures less Operating Grant Funds divided by total service hours. Total Complaints per 100,000 passengers Equals total complaints divided by total passengers times 100,000. On-Time As defined by the Short Range Transit Plan, a bus may be up to 5 minutes late, but less than 1 minute early. Road Calls Equals total chargeable road calls. A road call is defined as a mechanical failure of a bus in revenue service that necessitates removing the bus from service until repairs are made.. 43
44 Sun Van Glossary of Terms Ridership (Unlinked Passenger Trips) - Equals total Passengers actually transported. A one-way trip taken by an ADA Paratransiteligible passenger, a personal care attendant (PCA) or companions from the pick-up point to the destination. Passengers Per Revenue Hour - Equals Ridership divided by Revenue hours. Total Demand - Total number of passenger trips requested. Denial An ADA-eligible trip requested that is not scheduled by Sun Van within the permissible scheduled window of on hour before or one hour after the requested pick-up time. Passengers Per Service Hour - Equals Ridership divided by Service hours. Revenue Per Trip Total Passenger Revenue divided by Trips. Cancellations - Occurs when the passenger or the passenger s representative cancels the reservation two (2) or more hours prior to the beginning of the scheduled pick-up time. Total Cost Per Trip Total Expenses divided by total Trips. No-Shows - Occurs when the passenger does not board the Sun Van vehicle when the vehicle arrives at the pick-up location within the pick up window and the driver waits two (2) minutes, or when the customer does not cancel the reservation within two (2) hours of the reservation. Trip Time - The percentage of ADA Trips with a trip time less than the comparable Sun Tran fixed route trip. Optional ADA Passenger trips beyond the ¾ mile corridors and beyond times available on a Sun Tran fixed route, a same-day request, and will calls. Trip A one-way trip taken by an ADA-Paratransit-eligible passenger from the pick-up point to the destination (excludes PCAs and companions). Revenue Miles All miles operated from pick-up point to destination. Trip Time 110%+5 Minutes Occurs when an ADA trip length exceeds 110% + 5 minutes of the comparable Sun Tran regular fixed route trip. On Time Pick Ups - The number of on time vehicle trips. The van is considered on time if it arrives between 15 minutes before or 15 minutes after the requested pick-up time. Pick Ups before Significantly Late - Pick Ups 30 minutes outside the original pick up window. Deadhead Miles Miles operated not providing specific revenue service. 44
MONTHLY REPORT MAY 2017
 & MONTHLY REPORT MAY 2017 SECTION Sun Tran & Sun Van Monthly Operations Report Table of Contents May 2017 PAGE I.System Highlights and Accomplishments 3-10 II.Sun Tran a.ridership 11 b.revenue 12 c.pass
MONTHLY REPORT AUGUST 2017
 & MONTHLY REPORT AUGUST SECTION Sun Tran & Sun Van Monthly Operations Report Table of Contents August PAGE I.System Highlights and Accomplishments 3-10 II.Sun Tran a.ridership 11 b.revenue 12 c.pass Sales
MONTHLY REPORT JUNE 2017
 & MONTHLY REPORT JUNE 2017 SECTION Sun Tran & Sun Van Monthly Operations Report Table of Contents June 2017 PAGE I.System Highlights and Accomplishments 3-10 II.Sun Tran a.ridership 11 b.revenue 12 c.pass
MONTHLY REPORT OCTOBER 2017
 & MONTHLY REPORT OCTOBER SECTION Sun Tran & Sun Van Monthly Operations Report Table of Contents October PAGE I.System Highlights and Accomplishments 3-11 II.Sun Tran a.ridership 12 b.revenue 13 c.pass
MONTHLY REPORT DECEMBER 2017
 & MONTHLY REPORT DECEMBER 2017 SECTION Sun Tran & Sun Van Monthly Operations Report Table of Contents December 2017 PAGE I.System Highlights and Accomplishments 3-12 II.Sun Tran a.ridership 13 b.revenue
MONTHLY OPERATIONS REPORT SEPTEMBER 2015
 MONTHLY OPERATIONS REPORT SEPTEMBER 215 Table of Contents SEPTEMBER 215 Section Page September Highlights... 3 Strategic Goals Progress Update... 4 Ridership... 6 Revenue... 9 Expenses... 1 System Summary...
MONTHLY REPORT SEPTEMBER 2017
 MONTHLY REPORT 2017 SUN SHUTTLE RIDERSHIP ROUTE PASSENGERS: CURRENT YEAR PRIOR YEAR AMOUNT PERCENTAGE BUDGET AMOUNT PERCENTAGE TOTAL PASSENGERS 17,250 20,318 (3,068) -15.1% 18,231 (981) -5.4% CALENDAR
MONTHLY OPERATIONS REPORT DECEMBER 2015
 MONTHLY OPERATIONS REPORT DECEMBER 215 Table of Contents DECEMBER 215 Section Page December Highlights... 3 Strategic Goals Progress Update... 4 Ridership... 6 Revenue... 9 Expenses... 1 System Summary...
Transit Performance Report FY (JUNE 30, 2007)
") Transit Performance Report FY 2006-2007 (JUNE 30, 2007) J ANUARY 2008 TRANSIT PERFORMANCE REPORT FY 2006 2007 (JUNE 30, 2007) Transit Performance Report I SSUED: JANUARY 2008 The Transit Performance Report
Transit Performance Report FY 2006-2007 (JUNE 30, 2007) J ANUARY 2008 TRANSIT PERFORMANCE REPORT FY 2006 2007 (JUNE 30, 2007) Transit Performance Report I SSUED: JANUARY 2008 The Transit Performance Report
2017/ Q1 Performance Measures Report
 2017/2018 - Q1 Performance Measures Report Contents Ridership & Revenue... 1 Historical Revenue & Ridership... 1 Revenue Actual vs. Planned... 3 Mean Distance Between Failures... 5 Maintenance Cost Quarter
PERFORMANCE REPORT NOVEMBER 2017
 PERFORMANCE REPORT NOVEMBER 2017 Note: New FY2018 Goal/Target/Min or Max incorporated in the Fixed Route and Connection Dashboards. Keith A. Clinkscale Performance Manager INTRODUCTION/BACKGROUND In June
Sound Transit Operations December 2014 Service Performance Report. Ridership
 Ridership Total Boardings by Mode Mode Dec-13 Dec-14 % YTD-13 YTD-14 % ST Express 1,266,130 1,396,787 10.3% 16,605,299 17,661,976 6.4% Sounder 248,710 285,016 14.6% 3,035,735 3,361,317 10.7% Tacoma Link
PERFORMANCE REPORT DECEMBER 2017
 PERFORMANCE REPORT DECEMBER 2017 Note: New FY2018 Goal/Target/Min or Max incorporated in the Fixed Route and Connection Dashboards. Keith A. Clinkscale Performance Manager INTRODUCTION/BACKGROUND Keith
Board Box. October Item # Item Staff Page 1. Key Performance Indicators Sep 2018 M. Mungia Financial Report Aug 2018 H.
 Board Box October 2018 Item # Item Staff Page 1. Key Performance Indicators Sep 2018 M. Mungia 2-10 2. Financial Report Aug 2018 H. Rodriguez 11-15 ITEM 1 October 31, 2018 TO: FROM: RE: BOARD OF DIRECTORS
Board of Directors Information Summary
 Regional Public Transportation Authority 302 N. First Avenue, Suite 700, Phoenix, Arizona 85003 602-262-7433, Fax 602-495-0411 Board of Directors Information Summary Agenda Item #6 Date July 11, 2008 Subject
Sound Transit Operations January 2017 Service Performance Report. Ridership. Total Boardings by Mode
 January 217 Service Performance Report Ridership ST Express Sounder Tacoma Link Link Paratransit Jan-16 Jan-17 % 1,433,7 1,3,33 4.9% 331,27 7,121 98,411 3,633 Total Boardings by Mode 363,6 74,823 1,76,914
Sound Transit Operations January 2014 Service Performance Report. Ridership
 Ridership Total Boardings by Mode Mode Jan-13 Jan-14 % YTD-13 YTD-14 % ST Express 1,343,290 1,426,928 6.2% 1,343,290 1,426,928 6.2% Sounder 245,135 256,775 4.7% 245,135 256,775 4.7% Tacoma Link 86,229
Att. A, AI 46, 11/9/17
 Total s San Diego Metropolitan Transit System POLICY 42 PERFORMANCE MONITORING REPORT Page 1 of 6 Date: 11/8/17 OBJECTIVE Develop a Customer-Focused and Competitive System The following measures of productivity
Sound Transit Operations August 2015 Service Performance Report. Ridership
 Ridership Total Boardings by Mode Mode Aug-14 Aug-15 % YTD-14 YTD-15 % ST Express 1,534,241 1,553,492 1.3% 11,742,839 12,354,957 5.2% Sounder 275,403 326,015 18.4% 2,139,086 2,463,422 15.2% Tacoma Link
RIDERSHIP TRENDS. October 2017
 RIDERSHIP TRENDS October 2017 Prepared by the Division of Strategic Capital Planning December 2017 Table of Contents Executive Summary...1 Ridership...3 Estimated Passenger Trips by Line...3 Estimated
Date: 11/6/15. Total Passengers
 Total San Diego Metropolitan Transit System POLICY 42 PERFORMANCE MONITORING REPORT Page 1 of 6 OBJECTIVE Develop a Customer-Focused and Competitive System The following measures of productivity and service
VCTC Transit Ridership and Performance Measures Quarterly Report
 VCTC Transit Ridership and Performance Measures Quarterly Report Overview Quarter 2 Fiscal Year 2018-2019 This report provides performance measures for VCTC Intercity Bus Service covering the FY 2018-19
Sound Transit Operations March 2018 Service Performance Report. Ridership
 March 218 Service Performance Report Ridership Total Boardings by Mode Mar-17 Mar-18 % YTD-17 YTD-18 % ST Express 1,622,116 1,47,79-4.6% 4,499,798 4,428,14-1.6% Sounder 393,33 39,6.% 1,74,96 1,163,76 8.3%
Performance Measures Year End Updated-
 Performance Measures Year End 2017 -Updated- Priorities and Objectives 1. Earn and Retain the Community s Trust 2. Provide Excellent Customer Service 3. Enable Organizational Success 4. Exemplify Financial
Sound Transit Operations June 2016 Service Performance Report. Ridership
 Ridership Total Boardings by Mode Mode Jun-15 Jun-16 % YTD-15 YTD-16 % ST Express 1,622,222 1,617,420-0.3% 9,159,934 9,228,211 0.7% Sounder 323,747 361,919 11.8% 1,843,914 2,099,824 13.9% Tacoma Link 75,396
PERFORMANCE REPORT JANUARY Keith A. Clinkscale Performance Manager
 PERFORMANCE REPORT JANUARY 2018 Keith A. Clinkscale Performance Manager INTRODUCTION/BACKGROUND Keith A. Clinkscale Performance Manager FIXED ROUTE DASHBOARD JANUARY 2018 Safety Max Target Goal Preventable
Sound Transit Operations March 2017 Service Performance Report. Ridership. Total Boardings by Mode
 March 217 Service Performance Report Ridership ST Express Sounder Tacoma Link Link Paratransit Mar-16 Mar-17 % 1,83,4 1,621,49 2.4% 37,496 82,631 1,264,47 3,821 Total Boardings by Mode 389,98 87,39 1,89,43,297
PERFORMANCE REPORT DECEMBER Performance Management Office
 PERFORMANCE REPORT DECEMBER 2018 Performance Management Office INTRODUCTION/BACKGROUND Performance Management Office FIXED ROUTE DASHBOARD FY 2019 Safety Max Target Goal Preventable Collisions per 100k
Sound Transit Operations January 2018 Service Performance Report. Ridership
 January 218 Service Performance Report Ridership Total Boardings by Mode Jan-17 Jan-18 % YTD-17 YTD-18 % ST Express 1,3,33 1,7,91.3% 1,3,33 1,7,91.3% Sounder 367,33 416,8 13.3% 367,33 416,8 13.3% Tacoma
METRO OPERATIONS COMMITTEE
 Los Angeles County Metropolitan Transportation Authority Item 1 CHIEF OPERATIONS OFFICER S S REPORT METRO OPERATIONS COMMITTEE Lonnie Mitchell Chief Operations Officer May 19, 20 1 Employee Recognition
Board Box. February Item # Item Staff Page 1. Key Performance Indicators M. Thompson Financial Report for Dec H.
 Board Box February 2016 Item # Item Staff Page 1. Key Performance Indicators M. Thompson 2-8 2. Financial Report for Dec. 2015 H. Rodriguez 9-13 ITEM 1 February 15, 2016 TO: FROM: RE: BOARD OF DIRECTORS
Sound Transit Operations February 2018 Service Performance Report. Ridership
 February 218 Service Performance Report Ridership Total Boardings by Mode Feb-17 Feb-18 % YTD-17 YTD-18 % ST Express 1,373,96 1,372,88 -.1% 2,877,294 2,88,719.1% Sounder 314,96 32,187 11.9% 681,923 768,69
Existing Services, Ridership, and Standards Report. June 2018
 Existing Services, Ridership, and Standards Report June 2018 Prepared for: Prepared by: Contents Overview of Existing Conditions... 1 Fixed Route Service... 1 Mobility Bus... 34 Market Analysis... 41 Identification/Description
2017/2018 Q3 Performance Measures Report. Revised March 22, 2018 Average Daily Boardings Comparison Chart, Page 11 Q3 Boardings figures revised
 2017/2018 Q3 Performance Measures Report Revised March 22, 2018 Average Daily Boardings Comparison Chart, Page 11 Q3 Boardings figures revised Contents Ridership & Revenue... 1 Historical Revenue & Ridership...
With the completion of this project, we would like to follow-up on the projections as well as highlight a few other items:
 TO: FROM: Mayor and Council Interim City Manager Rebecca Underhill, Director of Finance DATE: February 28, 2014 SUBJECT: Water Meter Project Analysis On March 28, 2012, Acting City Manager Mike Loftin
TRANSPORTATION SERVICE Actual
 PERFORMANCE REPORT-THIRD QUARTER VISION TO DELIVER REGIONAL MULTI-MODAL TRANSPORTATION SERVICES AND INFRASTRUCTURE IMPROVEMENTS THAT SIGNIFICANTLY AND CONTINUALLY INCREASE TRANSIT MARKET SHARE. MISSION
RIDERSHIP TRENDS. January 2018
 RIDERSHIP TRENDS January 2018 Prepared by the Division of Strategic Capital Planning March 2018 Table of Contents Executive Summary...1 Ridership...3 Estimated Passenger Trips by Line...3 Estimated Passenger
FIXED ROUTE DASHBOARD JULY 2018
 FIXED ROUTE DASHBOARD JULY 2018 Safety Max Target Goal Preventable Collisions per 100k Miles Non-Preventable Collisions per 100k Miles Total Incidents per 10,000 Boardings 1.6 1.3 0.8 2.63 2.1 2.0 1.60
METROBUS SERVICE GUIDELINES
 METROBUS SERVICE GUIDELINES In the late 1990's when stabilization of bus service was accomplished between WMATA and the local jurisdictional bus systems, the need for service planning processes and procedures
RIDERSHIP TRENDS. August 2018
 RIDERSHIP TRENDS August Prepared by the Division of Strategic Capital Planning October Table of Contents Executive Summary...1 Ridership...3 Estimated Passenger Trips by Line...3 Estimated Passenger Trips
Administrative Operations Report
 Fiscal Year 2017/18 Administrative Operations Report November 1, 2018 Prepared by: El Dorado County Transit Authority 6565 Commerce Way Diamond Springs, CA 95619 (530) 642-5383 www.eldoradotransit.com
DRT Performance Measurement: the U.S. Experience
 DRT Performance Measurement: the U.S. Experience FOR ANYBODY GOING ANYWHER IN LA HABRA International Conference on Demand Responsive Transportation Breckenridge, Colorado September 2016 DRT Performance
About This Report GAUGE INDICATOR. Red. Orange. Green. Gold
 ATTACHMENT A About This Report The Orange County Transportation Authority (OCTA) operates a countywide network of local, community, rail connector, and express bus routes serving over 6, bus stops. OCTA
Service Cost Estimate for Route 10 only
 2009-2011 Service Cost Estimate for Route 10 only The City of Ashland buys down the fare on Route 10 for each passenger riding in Ashland, therefore service cost estimates are based on recent ridership
Auckland Transport Quarterly Indicators Report 2018/19
 Attachment 1 Auckland Transport ly Indicators Report 218/19 September 218 Table of Contents Page 2. 1. Executive summary 2. External indicators 3. Performance by Key Priority 3.1 Deliver an efficient and
General Issues Committee Item Transit Operating Budget Ten Year Local Transit Strategy
 General Issues Committee Item 4.1 2017 Transit Operating Budget Ten Year Local Transit Strategy January 27, 2017 Presentation Outline 2017 Operating Budget Overview Ten Year Local Transit Strategy 2 2017
Bristol Virginia Transit
 Bristol Virginia Transit 1 Transit Overview Bristol Virginia Transit (BVT) is a Federally Funded and certified urban area transit system. BVT began operation in its current form in 1982. In Fiscal Year
Factors that Affect Fixed-Route Ridership Frequency Connections and accessibility Travel time Travel cost Service area coverage Reliability
 The transit industry defines ridership as the number of passengers who board public transportation vehicles called unlinked passenger trips. Ridership measures transit utilization at the system, route,
January 2018 Air Traffic Activity Summary
 January 2018 Air Traffic Activity Summary Jan-2018 Jan-2017 CY-2018 CY-2017 Passengers 528,947 505,421 4.7% 528,947 505,421 4.7% Passengers 537,332 515,787 4.2% 537,332 515,787 4.2% Passengers 1,066,279
FY Transit Needs Assessment. Ventura County Transportation Commission
 FY 18-19 Transit Needs Assessment Ventura County Transportation Commission Contents List of Figures and Appendices.. 2 Appendices... 1 Chapter 1: Introduction What is the Ventura County Transportation
Implementation Guidelines and Performance Measures Special Transportation for Seniors and People with Disabilities (Paratransit) Program
 Program") FY 2019-20 FINAL December 2018 Implementation Guidelines and Performance Measures Special Transportation for Seniors and People with Disabilities (Paratransit) Program Implementation Guidelines These guidelines
FY 2019-20 FINAL December 2018 Implementation Guidelines and Performance Measures Special Transportation for Seniors and People with Disabilities (Paratransit) Program Implementation Guidelines These guidelines
Establishes a fare structure for Tacoma Link light rail, to be implemented in September 2014.
 RESOLUTION NO. R2013-24 Establish a Fare Structure and Fare Level for Tacoma Link MEETING: DATE: TYPE OF ACTION: STAFF CONTACT: PHONE: Board 09/26/2013 Final Action Ric Ilgenfritz, Executive Director,
ESCAMBIA COUNTY AREA TRANSIT MTAC REPORT
 ESCAMBIA COUNTY AREA TRANSIT MTAC REPORT November 8, 2017 Meeting Escambia County Area Transit 1515 W. Fairfield Drive Pensacola, FL 32501 850-595-3228 INTRODUCTION 2 Summary Background MTAC ECAT Benchmarks
Bus Operations Report
 Third Quarter FY 216 (January 1 - March 31, 216) Wednesday April 27, 216 Operations Ridership: 783,194 passengers used in the third quarter. This represents a 2% increase over the same period in FY 215.
Scorecard Key Performance Indicators
 Scorecard Key Performance Indicators 1 st Quarter 2013 NICE Bus Fixed Route NICE Bus Fixed Route Definitions Scheduled Revenue Hours Full Trip Revenue Hours Lost Runs Missed Revenue Hours Lost Actual Hours
Quarterly Report Transit Bureau, Local Transit Operations. First Quarter, Fiscal Year 2015 (July 2014 September 2014) ART & STAR
 ART & STAR") Quarterly Report Transit Bureau, Local Transit Operations First Quarter, Fiscal Year 2015 (July 2014 September 2014) ART & STAR A Arlington Transit ART 1) Introduction The purpose of ART is to provide
Quarterly Report Transit Bureau, Local Transit Operations First Quarter, Fiscal Year 2015 (July 2014 September 2014) ART & STAR A Arlington Transit ART 1) Introduction The purpose of ART is to provide
ATTACHMENT A.7. Transit Division Performance Measurements Report Fiscal Year Fourth Quarter
 TTCHMENT.7 Transit Division Performance Measurements Report Fiscal Year 2012-13 Fourth Quarter Introduction The Orange County Transportation uthority (OCT) operates a countywide network of local, community,
PTN-128 Reporting Manual Data Collection and Performance Reporting
 2016 PTN-128 Reporting Manual Data Collection and Performance Reporting Sponsored by the Texas Department of Transportation Table of Contents PTN-128 WHAT, WHY AND WHO... 6 What is the PTN-128... 13 Why
The packet is available on-line by going to choosing the Monthly Calendar, and clicking on Monday, March 16, 2015.
 AGENDA Ingham County Parks & Recreation Commission 121 E. Maple Street, P.O. Box 178, Mason, MI 48854 Telephone: 517.676.2233; Fax: 517.244.7190 The packet is available on-line by going to www.ingham.org,
FIXED ROUTE Operating Statistics For Periods Ending 9/30/2008 & 9/30/2009
 FIXED ROUTE Operating Statistics For Periods Ending 9/30/2008 & 9/30/2009 CURRENT MONTH YEAR TO DATE Actual Actual Variance Actual Actual Variance 2008 2009 2008 to 2009 2008 2009 2008 to 2009 Service
Driving Ridership Strategic Partnerships
 Driving Ridership Strategic Partnerships Feb 29, 2012 Presented by Priya Bhasin-Singh, Strategic Marketing Associate priya.bhasin-singh@edmonton.ca 2012 APTA Marketing & Communications Conference About
September 2014 Prepared by the Department of Finance & Performance Management Sub-Regional Report PERFORMANCE MEASURES
 September 2014 Prepared by the Department of Finance & Performance Management 2013 Sub-Regional Report PERFORMANCE MEASURES REGIONAL PERFORMANCE MEASURES RTA staff has undertaken the development of a performance
Capital Metropolitan Transportation Authority. Monthly Performance Report
 Capital Metropolitan Transportation Authority Monthly Performance Report AUGUST 2010 Ridership Report August 23, 2010 Budget to Actual Ridership Budget Target: 2,290,590 Actual: 2,300,796 Ridership Comparison
Matt Miller, Planning Manager Margaret Heath-Schoep, Paratransit & Special Projects Manager
 DATE May 2, 218 Item #12 TO FROM GCTD Board of Directors Matt Miller, Planning Manager Margaret Heath-Schoep, Paratransit & Special Projects Manager MS SUBJECT I. EXECUTIVE SUMMARY This quarterly report
Peer Performance Measurement February 2019 Prepared by the Division of Planning & Market Development
 2017 Regional Peer Review Peer Performance Measurement February 2019 Prepared by the Division of Planning & Market Development CONTENTS EXECUTIVE SUMMARY... 3 SNAPSHOT... 5 PEER SELECTION... 6 NOTES/METHODOLOGY...
YOSEMITE AREA REGIONAL TRANSPORTATION SYSTEM
 YOSEMITE AREA REGIONAL TRANSPORTATION SYSTEM Short Range Transit Plan Prepared for the Merced County Association of Governments/YARTS Prepared by LSC Transportation Consultants, Inc. YOSEMITE AREA REGIONAL
Metro Transit Annual Report
 Metro Transit 2013 Annual Report 2013 Year in Review In 2013, Metro experienced its second-highest ridership of all time, recording more than 14.7 million rides. This ridership was up 1% compared to 2012,
Transit in Toronto. Chair Adam Giambrone Sunday, October
 Chair Adam Giambrone Sunday, October 19 2008 1 TTC is a City of Toronto Commission Transit in Toronto 2 2 Serving Toronto since 1921 Transit in Toronto 3 3 Canada s largest transit agency Annual customer-trips,
St. Johns County Transit Development Plan Update
 St. Johns County Transit Development Plan Update 2012-2021 Demographic Information Population 190,000 people in 2010 51% increase from 2000 Employment 64% over age 16 in labor force St. Augustine, Ponte
October REGIONAL ROUTE PERFORMANCE ANALYSIS
 October 2018 2017 REGIONAL ROUTE PERFORMANCE ANALYSIS The Council s mission is to foster efficient and economic growth for a prosperous metropolitan region Metropolitan Council Members Alene Tchourumoff
Transit Commission. Tax Supported Programs
 Transit Commission Tax Supported Programs Tabled November 8, 2017 Table of Contents Transit Commission Table of Contents Briefing Note... 1 Operating Resource Requirement... 3 User Fees... 4 Capital Program
Current Operations CHAPTER II INTRODUCTION DESCRIPTION OF TRANSPORTATION SERVICES
 Chapter II CHAPTER II Current Operations INTRODUCTION This chapter provides an overview of Centre Area Transportation Authority (CATA). CATA is a joint municipal authority formed under the Municipal Authorities
JANUARY 2018 BOARD INFORMATION PACKAGE
 JANUARY 2018 BOARD INFORMATION PACKAGE MEMORANDUM TO: Members of the Airport Authority FROM: Lew Bleiweis, Executive Director DATE: January 19, 2018 Financial Report (document) Informational Reports: A.
MERRIMACK VALLEY REGIONAL TRANSIT AUTHORITY (MVRTA) PERFORMANCE MEASURES: FIXED ROUTE
 PERFORMANCE MEASURES: FIXED ROUTE") PERFORMANCE MEASURES: FIXED ROUTE IT IS OUR GOAL TO IMPROVE FIXED ROUTE SERVICE ON ALL LEVELS, ON A CONTINUOUS BASIS. IN ORDER TO DO THIS, WE HAVE ESTABLISHED BENCHMARKS TO MEASURE PERFORMANCE. THIS INFORMATION
PERFORMANCE MEASURES: FIXED ROUTE IT IS OUR GOAL TO IMPROVE FIXED ROUTE SERVICE ON ALL LEVELS, ON A CONTINUOUS BASIS. IN ORDER TO DO THIS, WE HAVE ESTABLISHED BENCHMARKS TO MEASURE PERFORMANCE. THIS INFORMATION
BUSINESS BAROMETER December 2018
 Credit: Chris Orange BUSINESS BAROMETER December Credit: Nigel Moore 1 Contents Summary of findings 3 Annual monthly performance: visitor attractions..4 Visit Herts Team update 5 National context.8 Visitor
CWC LA - Cash Balance (January 2012)
") CWC LA - Cash Balance 2012-13 (January 2012) 1,200,000 Cash Balance 1,000,000 800,000 ($1,000s) 600,000 400,000 200,000 - CWC LA - Actuals/Projected CWC LA - ed (Nov) 1 1 CWC Hollywood - Financial Dashboard
CWC LA - Cash Balance 2012-13 (January 2012) 1,200,000 Cash Balance 1,000,000 800,000 ($1,000s) 600,000 400,000 200,000 - CWC LA - Actuals/Projected CWC LA - ed (Nov) 1 1 CWC Hollywood - Financial Dashboard
SKAGIT COUNTY PUBLIC WORKS DEPARTMENT Ferry Operations Division Ferry Fare Revenue Target Report
 SKAGIT COUNTY PUBLIC WORKS DEPARTMENT Ferry Operations Division 2018 Ferry Fare Revenue Target Report Skagit County Public Works Department 2018 Ferry Fare Revenue Target Report The following report is
JANUARY 2017 BOARD INFORMATION PACKAGE
 JANUARY 2017 BOARD INFORMATION PACKAGE MEMORANDUM TO: Members of the Airport Authority FROM: Lew Bleiweis, Executive Director DATE: January 13, 2017 Financial Report (document) Informational Reports: A.
_VER1 CC_ PC_5000 FA_21500 C </CELL ><CELL> HO_ADJ 2015.P02 GL_6290 _VER1 GL_6010 PC_5000 FA_21500 C
 < EVDRE ID="Head count Roll Forward 001-00001"/>< EVDRE ID="BPC- CYB 004-00001"/>< EVDRE ID="BPC- CYB 001-00001"/>< EVDRE ID="BPC- CYF 004-00001"/>< EVDRE
Metra Board of Directors. Board Meeting November 11, 2011
 Metra Board of Directors Board Meeting November 11, 2011 State of Metra Operations Metra Board of Directors November 11, 2011 Presented by George Hardwidge Deputy Executive Director Operations System On-Time
METRO FLEET FUNDING HUMAN RESOURCES
 2018 FACT SHEET METRO FLEET METRO s overall revenue-producing fleet totals 235 vehicles: 144 large buses and 91 smaller paratransit buses. Some passenger vehicles are equipped with a hydraulic lift to
Public Meeting. December 19 th, 2018
 Public Meeting December 19 th, 2018 AGENDA Welcome Market Analysis Existing Services Peer Evaluation Outreach Summary Recommendations Discussion Next Steps MARKET ANALYSIS 3 Demographics 50% of population
Corporate presentation CIBC Whistler Institutional Investor Conference January 21, 2010
 Corporate presentation CIBC Whistler Institutional Investor Conference January 21, 2010 Forwardlooking statement Certain information in this presentation and statements made during this presentation, including
COMO Bus Service Evaluation DRAFT COA. September 19, 2016
 DRAFT COA September 19, 2016 Chapter 1 Introduction Introduction The City of Columbia Missouri unveiled COMO Connect in 2013 with the goal of changing how public transportation options were delivered in
U.S. DOMESTIC INDUSTRY OVERVIEW FOR MARCH
 Inter-Office Memo Reno-Tahoe Airport Authority Date: April 30, 2009 To: Statistics Recipients From: Krys T. Bart, A.A.E., President/CEO Subject: RENO-TAHOE INTERNATIONAL AIRPORT PASSENGER STATISTICS U.S.
APRIL 2016 BOARD INFORMATION PACKAGE
 APRIL 2016 BOARD INFORMATION PACKAGE MEMORANDUM TO: Members of the Airport Authority FROM: Lew Bleiweis, Executive Director DATE: April 8, 2016 Financial Report (document) Informational Reports: A. February,
Manual vs. Automatic Operation and Operational Restrictions
 Customer Services, Operations, and Safety Committee Board Information Item IV-B March 11, 2010 Manual vs. Automatic Operation and Operational Restrictions Page 81 of 91 Washington Metropolitan Area Transit
D_HO_V ER1 GL_ P03 GL_6030
 < EVDRE ID="BPC- CYB 001-00001"/>< EVDRE ID="BPC- CYF 004-00001"/>< EVDRE ID="BPC- CYF 001-00001"/>< C C_500377 6013-40.00000 00 6018-10.00000
RACINE COUNTY PUBLIC TRANSIT PLAN:
 RACINE COUNTY PUBLIC TRANSIT PLAN: 2013-2017 Recommended Transit Service Improvement Plan NEWSLETTER 3 SEPTEMBER 2013 This newsletter describes the final recommended public transit plan for the City of
2018 Accomplishments
 CY2018 ANNUAL REPORT Vision The Chippewa Valley Regional Airport will provide our users with a safe, efficient and welcoming operation while striving to meet the current and future needs of the community
SAMTRANS TITLE VI STANDARDS AND POLICIES
 SAMTRANS TITLE VI STANDARDS AND POLICIES Adopted March 13, 2013 Federal Title VI requirements of the Civil Rights Act of 1964 were recently updated by the Federal Transit Administration (FTA) and now require
Hard Labor Creek State Park Business Plan. Table of Contents
 Hard Labor Creek State Park Business Plan Table of Contents Georgia State Parks and Historic Sites Executive Summary Site Name Site Manager Region Manager Hard Labor Creek State Park Daniel Schay Eric
Tallulah Gorge State Park Business Plan. Table of Contents
 Tallulah Gorge State Park Business Plan Table of Contents 2 Georgia State Parks and Historic Sites Executive Summary Site Name Tallulah Gorge State Park Site Manager Danny Tatum Region Manager Joe Yeager
* Data for prior months has been updated to reflect error corrections from missing passenger count data
 LANE TRANSIT DISTRICT September 2016 Performance Report * 29-November-2016 Prior Performance Current Year's % Current Previous % Current Prior % Measure Month Month Change Y-T-D Y-T-D Change 12 Month 12
Hertfordshire Business Barometer July 2018
 Hertfordshire Business Barometer July 1 Contents Summary of findings 3 Marketing update 4 Visitor Attractions: monthly performance 6 Serviced Accommodation: monthly performance 10 Other news: national
North Central Regional Transit District. Quick Facts. Our Mission Statement:
 North Central Regional Transit District Our Mission Statement: The mission of the North Central Regional Transit District is to provide safe, secure and effective public transportation within North Central
AGENDA GUEMES ISLAND FERRY OPERATIONS PUBLIC FORUM
 AGENDA GUEMES ISLAND FERRY OPERATIONS PUBLIC FORUM Wednesday, August 17, 211 6: p.m. Guemes Island Community Hall ~ 7549 Guemes Island Road Thank you for attending the second Annual Public Forum in 211.
Hertfordshire Business Barometer April 2018
 Hertfordshire Business Barometer April 1 Contents Summary of findings 3 Marketing update 4 Visitor Attractions: monthly performance 6 Serviced Accommodation: monthly performance 10 Other news: national
Hertfordshire Business Barometer September 2018
 Hertfordshire Business Barometer September 1 Contents Summary of findings 3 Marketing update 4 Visitor Attractions: monthly performance 6 Serviced Accommodation: monthly performance 10 Other news: national
GREATER BOISE AUDITORIUM DISTRICT REGULAR BOARD MEETING OF THE BOARD OF DIRECTORS. AGENDA Revised. September 20, 2016
 GREATER BOISE AUDITORIUM DISTRICT REGULAR BOARD MEETING OF THE BOARD OF DIRECTORS AGENDA Revised September 20, 2016 BOISE CENTRE Willows Room 2:00 p.m. I. Call to Order II. III. IV. Changes or Additions