MONTHLY REPORT MAY 2017
|
|
|
- Norah Ferguson
- 5 years ago
- Views:
Transcription


1 & MONTHLY REPORT MAY 2017
2 SECTION Sun Tran & Sun Van Monthly Operations Report Table of Contents May 2017 PAGE I.System Highlights and Accomplishments 3-10 II.Sun Tran a.ridership 11 b.revenue 12 c.pass Sales 13 d.summary of Expenses 14 e.system Summary 15 f.annual Ridership 16 g.performance Indicators h.route Performance Profile 28 i.route Passenger Per Hour Ranking 29 j.customer Satisfaction 30 III.Sun Van a.ridership & Revenue Collection 31 b.summary of Expenses 32 c.system Summary d.annual Ridership 35 e.performance Indicators f.customer Satisfaction 42 IV.Glossaries
3 Sun Tran & Sun Van Strategic Goals Progress Update May 2017 In addition to highlighting major accomplishments and programs each month, this section communicates Sun Tran and Sun Van s ongoing efforts to achieve FY 2017 system goals and objectives. Provide Excellent Customer Service Sun Tran Customer Service Sun Tran s Customer Service Center answered 95 percent of the total number of calls received, a 1% increase from the previous month and a 2 percent increase from the same time last year. Sun Tran experienced a 29 percent decrease in compliments, when compared to the previous month. The number of complaints during the month decreased by 19 percent when compared to the previous month and increased by 1 percent when compared to the same time last year. Customer Service Representatives met the established goal of answering at least 85 percent of total calls, keeping the average ring time at 14 seconds or less and keeping the calls at 90 seconds or less. These goals are to help ensure better service for the thousands of passengers who phone the call center. Sun Van Customer Calls Sun Van s Dispatch answered 87.7 percent of calls offered, the same as they did the previous month, reaching their goal, and a 1.7 percent increase from May. Reservations answered 96.9 percent of calls during the month of May, a decrease of 0.8 percent when compared to the previous month and increase of 0.5 percent when compared to the same month from last year. Spanish Reservations answered 95.6 percent of the calls, a 0.3 percent decrease from last month and a 1.3 percent increase from the same time last year. 3
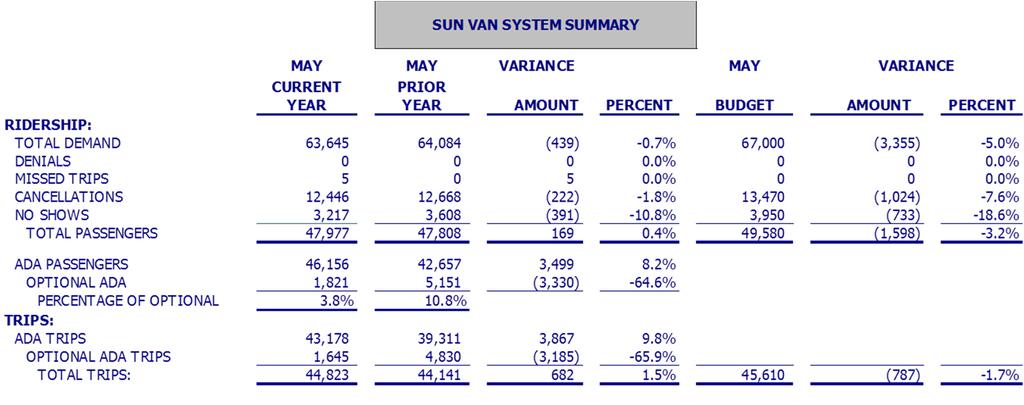
4 Sun Tran & Sun Van Strategic Goals Progress Update May 2017 The percentage of abandoned calls to Dispatch was 2.7 percent, Reservations abandoned calls were 1.7 percent, and Spanish Reservations abandoned calls were 2.1 percent, all reaching their goal of three percent or less. On-time performance for the month of May 2017 was approximately 95.4%, not reaching our goal. Sun Van ridership, ADA and Optional passenger trips for the month of May 2017 were 44,823 trips. This year s trips were approximately 1.5 percent higher when compared to May ridership. Productivity was 1.7 passengers per hour. As of May 31st we received 5 of the 19 vans replacing the 2012 vehicles. Special Services Office Activity The Special Services staff assisted approximately 4,596 customers during the month of May. The daily average was 209 customers compared to 214 for the prior month of April The daily average for May was 184. Staff issued a total of 2,392 SunGO ID & Cards during the month of May 2017, compared to 2,105 issued in April 2017 and 2,240 issued in May (prior year). Specifically, the following numbers of cards were issued in May 2017: 1,718 low-income (454 replacement), 455 disabled (289 replacement), and 219 senior (44 replacement). Agents answered 3,080 calls on the English line or 88.9 percent calls answered, with 383 calls abandoned. The percent calls answered for English in May was higher by 1.2 percent than the prior month, and was higher by 0.9% from May. We continue to monitor staffing needs to improve call statistics and decrease abandoned calls and wait times. Agents also answered 58 calls on the Spanish line with 98.3 percent calls answered with 1 call abandoned. The percent calls answered for Spanish in May was 4.8 percent higher than the prior month in April 2017, and was 2.8 percent higher than in May. 4
5 Ensure an Efficient and Effective Operation Sun Tran & Sun Van Strategic Goals Progress Update May 2017 Sun Tran Maintenance Goals A total of 138 preventative maintenance inspections of Sun Tran buses, 22 preventative maintenance inspections of support vehicles and 38 A/C inspections of buses were completed, all with 100 percent on-time performance. A total of 15 Quality Assurance Inspections were performed by Maintenance Managers and Supervisors. The active fleet for Garage 1 (South Yard) maintenance shop is 121 buses and the active fleet at Garage 2 (NW Facility) is 125 buses. The total active fleet for the month remains the same as the previous month at 246. Warranty Goal For Fiscal Year 2017, the goal is to reduce un-recovered warranty by $74,649. The monthly goal is $6,220 and the cumulative goal is $68,428. Warranty recovered during the month of May was $1,850. The cumulative warranty recovered through May was $78,797, which meets the cumulative goal. Workforce Compliance On 5/1/2017, Sun Rideshare Surveys were distributed to all employees at Sun Tran and Sun Van for their completion. This is required as part of an annual Travel Reduction Program requirement for Pima Association of Governments. On 5/4/2017, a meeting was held with Joe Kroeger of Snell & Wilmer to discuss the implementation of Proposition 206. On 5/5/2017, Human Resources had a conference call with Safeway Stores to plan out this year s Flu Shot Clinics. 5
6 Sun Tran & Sun Van Strategic Goals Progress Update May 2017 On 5/16/2017, a conference call was held with Nancy of Snell & Wilmer to finalize the Sun Tran and Sun Van Tuition Reimbursement Program. On 5/25/2017,a BBQ was held at Sun Tran for all administrative employees. Many employees brought in food for the pot luck luncheon. Employee and Labor Relations On 5/5/2017, a conference call was held with our broker Gallagher to discuss the upcoming benefits open enrollment for Administrative and Bargaining Unit employees. On 5/15/2017, a final conference call was conducting with Gallagher to discuss the July 1, 2017 Open Enrollment for Sun Tran and Sun Van. Cost Saving Measures & Efficient Facilities During the month of April, Sun Tran s Northwest Facility produced 15,250 kwh of electricity from the solar panels. This provides a cost avoidance of approximately $1,525 for the electricity generated and a Tucson Electric Power solar credit reimbursement to the City of Tucson s Department of Transportation of $2,440. Transit Task Force (TTF) There was no Transit Task Force meeting in May due to a lack of quorum. Improve Safety and Security Driver partitions Sun Tran worked with the contractor to mitigate a glare issue related to the driver partitions on 27 Sun Tran vehicles and gathered input from drivers about the effectiveness of the film in reducing the glare. 6
7 Sun Tran & Sun Van Strategic Goals Progress Update May 2017 Trainings Eight Sun Tran and Sun Van employees received Toastmasters training during May. The primary purpose of the Toastmasters program is to empower individuals to become more effective communicators and leaders. The club provides members with opportunities to speak during club meetings, to receive both critical and encouraging feedback, and accept roles and responsibilities before, during and after the meetings. Our club meets twice a month at Sun Tran. New Bus Stop Signs Sun Tran worked with contractor to continue installation of new bus stop signs. Project is on pace to have all signs replaced by end of fiscal year. Increase Ridership Sun Tran Ridership Passenger ridership for May totaled 1,313,158. This is a decrease of 120,428 or 8.4 percent when compared with the prior year and is under the budgeted level by 138,712 or 9.6 percent. YTD passenger ridership is 15,211,029. This is an increase of 798,034 or 5.5 percent when compared with the prior year and is under budgeted level by 1,888,981 or 11 percent. Passenger revenue for May was $915,457. This is an increase of $105,292 or 13 percent when compared to the prior year. YTD passenger revenue is $9,758,125 which is an increase of $1,282,954 or 15.1 percent from the prior year and $662,408 or 6.4 percent under budget. Sun Tran s May pass sales were $499,594 after allocating Sun Link and Sun Shuttle s pass sales revenue share of $9,452 and $3,053 respectively. Current month passenger revenue is over budget by $129,727 or 16.5 percent. 7
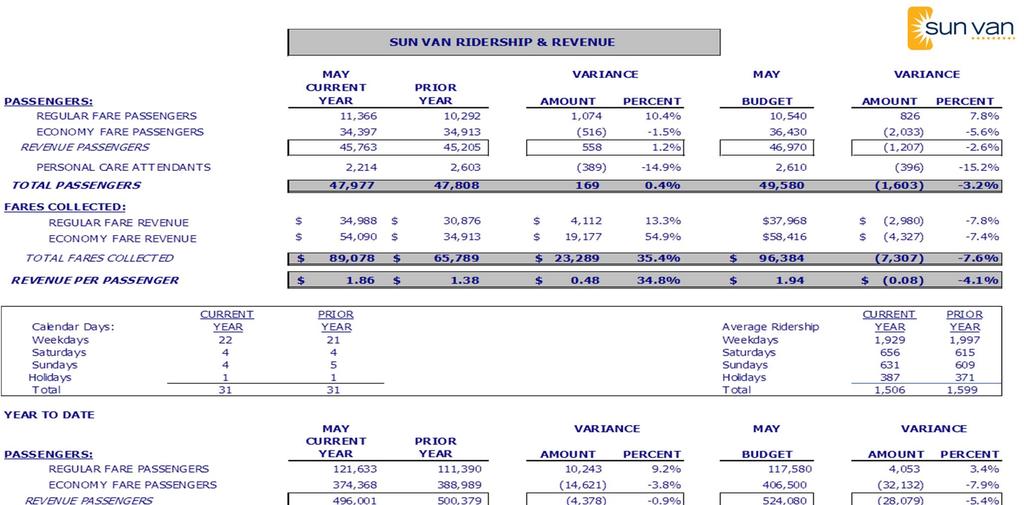
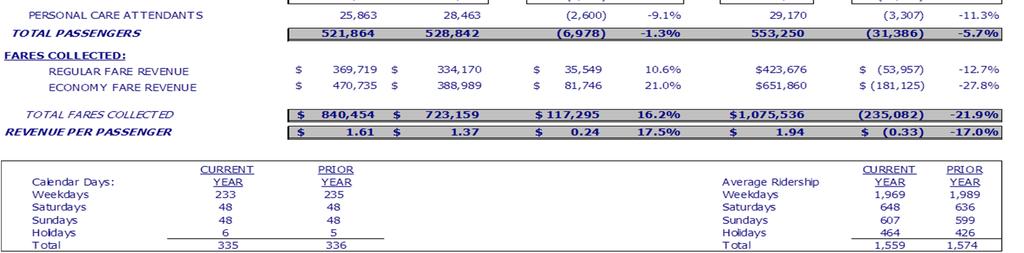
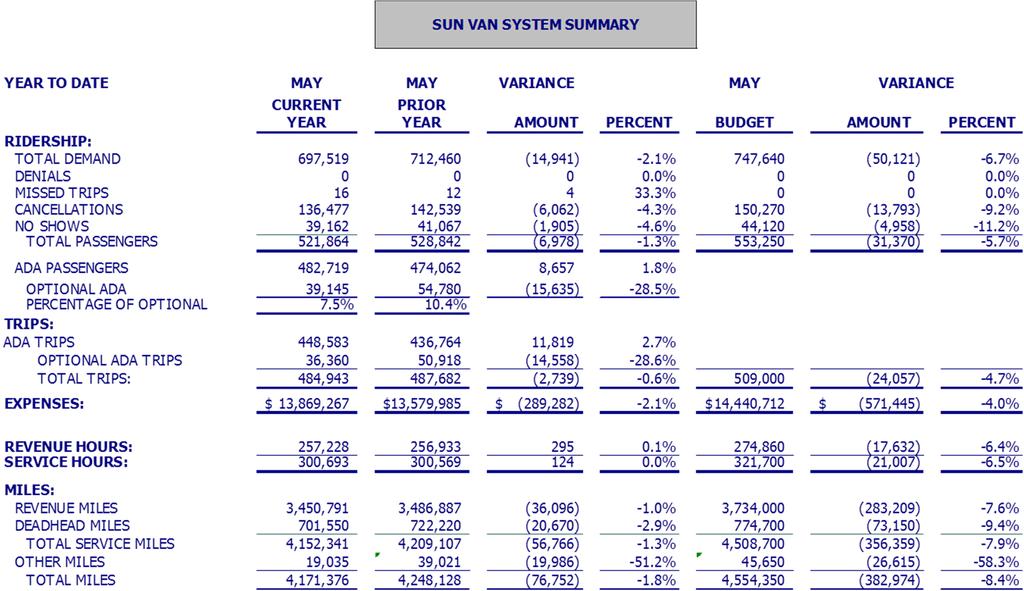
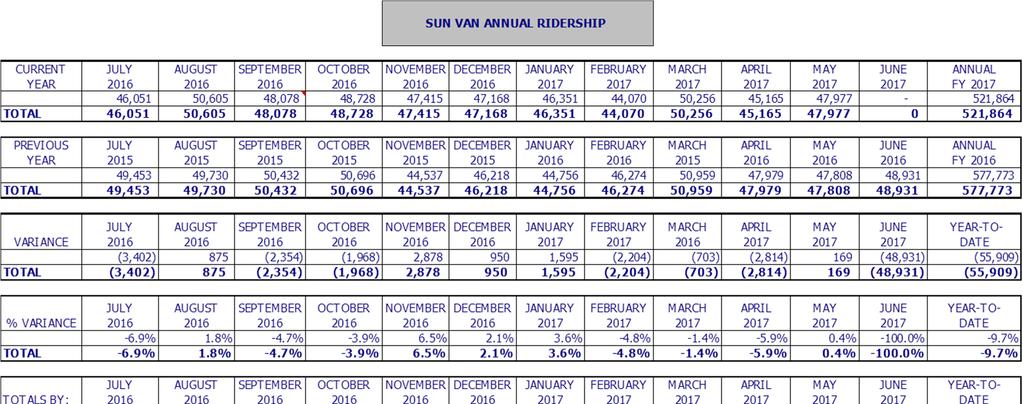
8 Sun Tran & Sun Van Strategic Goals Progress Update May 2017 Revenue per passenger boarding in May was $.70 cents compared to $.59 cents last year for the same time period. The overall farebox recovery ratio for May is 20.6 percent, while YTD average is 19.5 percent. Sun Van Ridership Sun Van ridership for May totaled 47,977. This is an increase of 169 or.4 percent when compared to May. Revenue passengers, excluding Personal Care Attendants (PCA) increased by 558 passengers or 1.2 percent. Total passenger ridership year to date is 521,864. This is a decrease of 6,978 or 1.3 percent when compared to last fiscal year. Revenue passengers, excluding Personal Care Attendants (PCA), decreased by 4,378 passengers or.9 percent. Sun Link Staff from Sun Tran met with Sun Link and TDOT staff to plan the next Sun Link Stakeholders Marketing Meeting. The plan was to discuss an event calendar, summer district events, the Sun Link anniversary and Free Ride Day. Sun Tran staff completed applications for sponsorship to fund $2,500 of the cost for the Free Ride Day from Tucson Electric Power. Marketing campaigns related to Sun Tran ridership A Sun Link ad in the Orientation Guide special edition was created and placed in the AZ Daily Wildcat for New Student Orientations. To promote the Annual Pass, SummerGO Youth Pass and $25 for $20 program, staff created bus posters, sliders on the website, social media posts, e-blasts to the Pass Provider Program, slides at Transit Centers, NewsNet Posts, press releases for each product. Staff sent out additional e-blasts to Sales Outlets for the $25 for $20 program, and additional e-blasts to non-profit organizations and schools for the SummerGO Youth Pass. Communication materials were created and distributed to inform the public about changes in Sun Link service hours for the summer. 8
9 Sun Tran & Sun Van Strategic Goals Progress Update May 2017 Staff began working on Labor Negotiations planning, and developed task lists for initial communications, and categorized routes into different tiers to prioritize routing offered as limited service in the event of a work stoppage. A driver training on the fare payment system was implemented in May. Community Outreach Sun Tran attended the Raytheon Employee Fair. About 300 employees were in attendance. Several Raytheon employees ride one of three Express buses to work. Current riders came by to thank us, and employees that do not ride yet came by for information. It was a fun and busy event. Sun Link teamed up with KXCI radio to offer the Folk Express for the Tucson Folk Festival. The Folk Express featured folk music on the streetcar to get to the Folk Fesitval. About 10 people got on the Folk Express. Mike and Scott, the band sponsored by KXCI, was really talented and very entertaining. Sun Tran staff attended three of the UA New Student Orientations in May. There were roughly 200 people per orientation asking for information. A Learn To Ride event was implemented at the Jacobs YMCA. Twenty-four youth and staff attended the event. Jacobs YMCA had purchased multiple SummerGO Youth Passes, so training was offered so the youth could successfully travel throughout the summer by Sun Tran. Online Passenger Tools Sun Tran s Facebook page had 10,563 sessions with 660 page views. Sun Tran s most popular post was about the SummerGO Youth Pass on May 24, The post reached 1,650 people. 9
10 Sun Tran & Sun Van Strategic Goals Progress Update May 2017 It was shared 72 times and liked 77 times. The average number of people reached per post is , so the reach on this post was dramatically higher than normal. Sun Tran s Twitter audience grew by 10 when compared to the previous month, and 5 percent when compared to the same time last year. Sun Tran s Twitter page had 25.4 thousand impressions, an increase of 0.9 percent when compared to the previous month. The top tweet was Come on board and let us take you on your weekend adventure! #SundayFunDay with 588 impressions. Sun Tran s website had 126,572 page views, an increase of 1 percent when compared to the previous month. The website had a total of 100,665 sessions the period of time a user is actively engaged with the website is one minute and 47 seconds, which is similar to last month. In May, 78 percent of sessions were from a mobile device and 58 percent of page views come from the routes and times page, continuing to be the most popular page on the Sun Tran website. 25,750 new users used the Sun Tran website in May. GoTucson Mobile App The GoTucson mobile app has continued to be promoted during the month of May 2017 through placed advertising, social media and online. The number of individuals utilizing the GoTucson mobile app to ride transit throughout the community was 4,634 compared to 5,374 in April The GO Tucson mobile app has continued to be promoted at START sessions, community events, social media and online. Expansion of SunGO Sales Posters for the $25 for $20 promotion were created and distributed to all the Sales Outlets prior to the program starting on June 1,
11 SUN TRAN RIDERSHIP MAY VARIANCE MAY VARIANCE ROUTE PASSENGERS: CURRENT YEAR PRIOR YEAR AMOUNT PERCENT BUDGET AMOUNT PERCENT FULL FARE 356, ,848 (38,252) -9.7% 447,260 (90,664) -20.3% ECONOMY FARE 564, ,862 (5,384) -0.9% 611,380 (46,902) -7.7% EXPRESS FARE 18,038 19,219 (1,181) -6.1% 18,320 (282) -1.5% DAY PASS 79,083 82,245 (3,162) -3.8% 9,300 69, % OTHER 60,565 73,971 (13,406) -18.1% 60,870 (305) -0.5% ROUTE REVENUE PASSENGERS 1,078,760 1,140,145 (61,385) -5.4% 1,147,130 (68,370) -6.0% TRANSFER PASSENGERS 207, ,362 (55,933) -21.2% 270,830 (63,401) -23.4% CHILDREN =<5 26,209 29,254 (3,045) -10.4% 33,140 (6,931) -20.9% PCA (65) -7.9% 770 (10) -1.3% FREE RIDE DAY % % OTHER ROUTE PASSENGERS 234, ,441 (59,043) -20.1% 304,740 (70,342) -23.1% TOTAL PASSENGERS 1,313,158 1,433,586 (120,428) -8.4% 1,451,870 (138,712) -9.6% 1,313,158 1,433,586 (120,428) (1,451,870) (138,712) Calendar Days CURRENT YEAR PRIOR YEAR Average Route Ridership CURRENT YEAR Weekdays CURRENT YEAR PRIOR YEAR Weekdays 51,663 57,684 Saturdays Saturday 23,657 27,257 Sundays 4 5 Sunday 16,268 18,811 Holidays 1 1 Holidays 16,879 19,133 Total Total 42,360 46,245 YEAR TO DATE MAY VARIANCE MAY VARIANCE ROUTE PASSENGERS: CURRENT YEAR PRIOR YEAR AMOUNT PERCENT BUDGET AMOUNT PERCENT FULL FARE 4,244,302 4,082, , % 5,259,030 (1,014,728) -19.3% ECONOMY FARE 6,170,045 5,656, , % 6,832,990 (662,945) -9.7% EXPRESS FARE 195, ,329 12, % 252,240 (56,751) -22.5% DAY PASS 908, , , % 385, , % OTHER 779, ,430 81, % 835,550 (55,892) -6.7% ROUTE REVENUE PASSENGERS 12,297,507 11,416, , % 13,565,480 (1,267,973) -9.3% TRANSFER PASSENGERS 2,574,208 2,667,886 (93,678) -3.5% 3,111,590 (537,382) -17.3% CHILDREN =<5 331, ,148 9, % 415,910 (84,812) -20.4% PCA 8,216 7, % 7,030 1, % FREE RIDE DAY % 0 0.0% OTHER ROUTE PASSENGERS 2,913,522 2,996,673 (83,151) -2.8% 3,534,530 (621,008) -17.6% TOTAL PASSENGERS 15,211,029 14,412, , % 17,100,010 (1,888,981) -11.0% 15,211,029 14,412, ,034 17,100,010 (1,888,981) Calendar Days CURRENT YEAR PRIOR YEAR School Days School Days Average Route Ridership CURRENT YEAR Weekdays CURRENT YEAR PRIOR YEAR Weekdays 55,753 52,433 Saturdays Saturday 26,135 26,243 Sundays Sunday 17,726 18,969 Holidays 6 4 Holidays 19,190 15,270 Total Total 45,406 44,076 PRIOR YEAR PRIOR YEAR Notes: A correction was made to the reported FY17 Q1 Ridership Budget in FY17 Q2 subsequent to publication. The YTD budget was updated accordingly. FY16 strike ridership was 226,526 for August and 277,338 for September for a total of 503,864 passengers. Due to the strike, August had 3 less Saturdays and 4 less Sundays, while September had 2 less Sundays. 11
12 SUN TRAN REVENUE MAY VARIANCE MAY VARIANCE CURRENT YEAR PRIOR YEAR AMOUNT PERCENT BUDGET AMOUNT PERCENT ROUTE PASSENGER REVENUE: FULL FARE $ 582,498 $ 498,452 $ 84, % $ 519,410 $ 63, % ECONOMY FARE 202, ,291 38, % 180,520 21, % EXPRESS FARE 29,929 31,317 (1,388) -4.4% 17,520 12, % DAY PASS 58,057 54,565 3, % 34,910 23, % OTHER 42,956 62,538 (19,582) -31.3% 33,370 9, % TOTAL ROUTE PASSENGER REVENUE $ 915,457 $ 810,165 $ 105, % $ 785,730 $ 129, % 915,457 $810,165 $ 785, , , YEAR TO DATE MAY VARIANCE MAY VARIANCE CURRENT YEAR PRIOR YEAR AMOUNT PERCENT BUDGET AMOUNT PERCENT ROUTE PASSENGER REVENUE: FULL FARE $ 6,133,820 $ 5,595,540 $ 538, % $ 6,962,040 $ (828,220) -11.9% ECONOMY FARE 2,068, % 1,924, , % EXPRESS FARE 393, % 416,040 (22,948) -5.5% DAY PASS 542, % 448,740 94, % OTHER 620, % 669,710 (49,196) -7.3% TOTAL ROUTE PASSENGER REVENUE $ 9,758,622 $ 8,475,668 $ 1,282, % $ 10,421,030 $ (662,408) -6.4% $ 9,758,622 $ 8,475,668 $ 1,282,954 $ 10,421,030 Notes: $ 0 $ 0 - $ - $ - A correction was made to the reported FY17 Q1 Revenue Budget in FY17 Q2 subsequent to publication. The YTD budget was updated accordingly. Adjustments may impact year-to-date revenue actuals due to the application of credits to sales from a prior month. FY17 A fare change took effect on January 3,2017 FY16 August cash revenue was $205,603 due to the strike FY16 September cash revenue was $312,202 due to the strike YTD pass revenue has been reduced by $213,329 for Sun Link's YTD Fiscal Year 2017 revenue share 213,329 YTD pass revenue has been reduced by $30,241 for Sun Shuttle's YTD Fiscal Year 2017 revenue share 30,241 12
13 SUN TRAN PASSES SOLD AND PASS REVENUE PASSES SOLD PASS REVENUE MAY VARIANCE MAY VARIANCE CURRENT PRIOR AMOUNT PERCENT CURRENT PRIOR AMOUNT PERCENT MONTHLY 8450 DAY PASS 4,420 6,005 (1,585) -26.4% 16,585 21,018 ($4,433) -21.1% 8459 DISCOUNTED DAY PASS 20,736 19,170 1, % 41,472 33,548 $7, % 8450 FULL FARE 7 DAY % 0 0 $0 0.0% 8450 FULL FARE MONTHLY 3,669 2,211 1, % 160,853 90,558 70, % 8451 ECONOMY MONTHLY 6,918 6, % 122,222 98,191 24, % 8452 EXPRESS MONTHLY (36) -7.6% 25,202 25,422 (219) -0.9% 8455 ANNUAL % $ % 8453 COLLEGE PASS % 0 0 $0 0.0% 8453 COLLEGE PASS EXPRESS % 0 0 $0 0.0% 8454 SUMMERGO YOUTH PASS 1,605 1, % 67,424 23,279 $44, % SUBTOTAL: 37,787 35,606 2, % $ 434,169 $ 292,015 $ 142, % STORED VALUE 8450 FULL FARE STORED VALUE 26,259 9,965 16, % 39,389 14,948 24, % 8451 ECONOMY STORED VALUE 38,987 42,431 (3,444) -8.1% 23,392 21,216 2, % 8452 EXPRESS STORED VALUE 1,175 1,261 (86) -6.8% 2,644 2, % SUBTOTAL: 66,421 53,657 12, % $ 65,424 $ 38,685 $ 26, % TOTAL 104,208 89,263 14, % $ 499,594 $ 330,700 $ 168, % , , ,894 YEAR TO DATE PASSES SOLD PASS REVENUE MAY VARIANCE MAY VARIANCE CURRENT PRIOR AMOUNT PERCENT CURRENT PRIOR AMOUNT PERCENT MONTHLY 8450 DAY PASS 54,194 44,044 10, % 196, ,154 42, % 8459 DISCOUNTED DAY PASS 186, ,206 15, % 345, ,861 48, % 8450 FULL FARE 7 DAY (220) -97.3% 59 2,868 (2,809) -97.9% 8450 FULL FARE MONTHLY 39,244 30,651 8, % 1,654,250 1,242, , % 8451 ECONOMY MONTHLY 77,415 60,584 16, % 1,242, , , % 8452 EXPRESS MONTHLY 5,028 4, % 278, ,097 60, % 8455 ANNUAL 2 20 (18) -90.0% ,971 (13,132) -94.0% 8453 COLLEGE PASS 2,087 3,071 (984) -32.0% 345, ,153 28, % 8453 COLLEGE PASS EXPRESS (82) -33.7% 59,696 55,276 4, % 8454 SUMMERGO YOUTH PASS 1,644 1, % 69,049 22,757 46, % SUBTOTAL: 365, ,292 51, % $ 4,192,574 $ 3,215,706 $ 976, % STORED VALUE 8263 FULL FARE STORED VALUE 242, , , % 369, , , % 8450 ECONOMY STORED VALUE 543, , , % 291, , , % 8452 EXPRESS STORED VALUE 11,948 12,525 (577) -4.6% 25,306 25, % SUBTOTAL: 797, , , % $ 686,310 $ 345,937 $ 340, % TOTAL 1,163, , , % $ 4,878,884 $ 3,561,643 $ 1,317, % ,878,884 3,561,643 1,317,241 Note: A correction was made to the reported FY17 Q1 Revenue Budget in FY17 Q2 subsequent to publication. The YTD budget was updated accordingly. FY17 A fare change tool effect on January 3,2017 FY16 August cash revenue was $205,226 due to the strike FY16 September cash revenue was $312,202 due to the strike YTD pass revenue has been reduced by $213,329 for Sun Link's YTD Fiscal Year 2017 revenue share 213,329 YTD pass revenue has been reduced by $30,241 for Sun Shuttle's YTD Fiscal Year 2017 revenue share 30,241 13
14 SUMMARY OF EXPENSES MAY MAY VARIANCE MONTHLY VARIANCE CURRENT YEAR PRIOR YEAR AMOUNT PERCENT BUDGET AMOUNT PERCENT OPERATOR WAGES $ 1,452,048 $ 1,291,604 $ (160,444) -11.0% $ 1,417,023 $ (35,024) -2.5% MAINTENANCE WAGES 360, ,307 60, % 402,108 41, % SALARIES 338, ,213 (12,121) -3.6% 370,938 32, % FRINGE BENEFITS 891, ,780 89, % 1,004, , % SERVICES 375, , , % 451,500 75, % UTILITIES 58,848 56,133 (2,715) -4.6% 69,532 10, % VEHICLE MAINTENANCE 298, , , % 409, , % MATERIALS AND SUPPLIES 166,776 32,924 (133,852) -80.3% 119,950 (46,826) -39.0% CNG FUEL 43,329 61,237 17, % 60,183 16, % DIESEL FUEL 302, ,739 33, % 436, , % UNLEADED FUEL 9,651 7,942 (1,709) -17.7% 7,458 (2,193) -29.4% CAPITAL OUTLAY - 19,370 19, % 22,822 22, % INSURANCE 160, ,944 (17,195) -10.7% 160, % LABOR CREDITS/EXP TRANSFERS (19,992) (9,054) 10, % (14,492) 5, % TOTAL EXPENSES $ 4,438,407 $ 4,634,881 $ 196, % $ 4,918,394 $ 479, % MAY MAY YEAR TO DATE CURRENT PRIOR VARIANCE ANNUAL BUDGET BALANCE YEAR YEAR AMOUNT PERCENT BUDGET AMOUNT PERCENT OPERATOR WAGES $ 15,575,210 $ 15,133,552 $ (441,658) -2.8% $ 17,004,280 $ 1,429, % MAINTENANCE WAGES 4,280,840 4,292,626 11, % 4,825, , % SALARIES 3,855,278 3,888,344 33, % 4,451, , % FRINGE BENEFITS 11,001,643 10,685,861 (315,782) -2.9% 12,053,380 1,051, % SERVICES 3,907,310 4,869, , % 5,418,000 1,510, % UTILITIES 738, ,144 (1,253) -0.2% 834,380 95, % VEHICLE MAINTENANCE 3,635,143 4,059, , % 4,917,230 1,282, % MATERIALS AND SUPPLIES 1,067, ,981 (119,868) -11.2% 1,439, , % CNG FUEL 524, ,186 4, % 722, , % DIESEL FUEL 3,489,143 2,849,244 (639,899) -18.3% 5,240,600 1,751, % UNLEADED FUEL 84,002 71,250 (12,752) -15.2% 89,500 5, % CAPITAL OUTLAY 251,105 47,088 (204,017) -81.2% 273,860 22, % INSURANCE 1,760,149 1,600,008 (160,141) -9.1% 1,925, , % LABOR CREDITS/EXP TRANSFERS (74,118) (125,549) (51,431) 69.4% (173,900) (99,782) 57.4% TOTAL EXPENSES $ 50,095,972 $ 49,585,083 $ (510,889) -1.0% $ 59,020,730 $ 8,924, % There were two events in April which impacted the YTD totals: 1) $117,000 in expenses were included in April MTD but excluded from April YTD 2) $61, in Pcard expenses were posted after April was final and were not included in April MTD or YTD 14
15 SUN TRAN SYSTEM SUMMARY MAY VARIANCE MAY VARIANCE CURRENT YEAR PRIOR YEAR AMOUNT PERCENT BUDGET AMOUNT PERCENT RIDERSHIP: TOTAL ROUTE PASSENGERS 1,313,158 1,433,586 (120,428) -8.4% 1,451,870 (138,712) -9.6% REVENUE: TOTAL ROUTE PASSENGER REVENUE $ 915,457 $ 810,165 $ 105, % 785, , % EXPENSES: TOTAL EXPENSES $ 4,438,407 $ 4,634,882 $ 196, % $ 4,908,098 $ 469, % MILES: REVENUE MILES 717, ,981 24, % 697,000 (20,890) -3.0% DEADHEAD MILES 102, ,126 1, % 103, % TOTAL SERVICE MILES 820, ,107 26, % 800,310 (19,952) -2.5% NON-ROUTE MILES 10,118 (14,159) 24, % 9,550 (568) -6.0% TOTAL MILES 830, ,948 50, % 809,860 (20,520) -2.5% REVENUE HOURS 60,315 56,132 4, % 58,052 (2,263) -3.9% SERVICE HOURS 64,701 60,228 4, % 62,376 (2,325) -3.7% YEAR TO DATE MAY VARIANCE MAY VARIANCE CURRENT YEAR PRIOR YEAR AMOUNT PERCENT BUDGET AMOUNT PERCENT RIDERSHIP: TOTAL ROUTE PASSENGERS 15,211,029 14,412, , % 17,100,010 (1,888,981) -11.0% REVENUE: TOTAL ROUTE PASSENGER REVENUE $ 9,758,622 $ 8,475,668 $ 1,282, % $ 10,421,030 $ (662,408) -6.4% EXPENSES: TOTAL EXPENSES $ 50,095,972 $ 94,776,960 $ 44,680, % $ 54,006,695 $ 3,910, % MILES: REVENUE MILES 7,526,867 6,700, , % 7,493,760 (33,107) -0.4% DEADHEAD MILES 1,088, ,964 99, % 1,110,200 21, % TOTAL SERVICE MILES 8,615,655 7,689, , % 8,603,960 (11,695) -0.1% NON-ROUTE MILES 124,945 67,127 57, % 95,050 (29,895) -31.5% TOTAL MILES 8,740,600 7,756, , % 8,699,010 (41,590) -0.5% REVENUE HOURS 623, ,565 77, % 623,364 (402) -0.1% SERVICE HOURS 669, ,617 80, % 669,566 (34) 0.0% Notes: FY16 August 569,919 miles and 44,210 hours were not run due to the strike. FY16 September 316,251 miles and 24,490 hours were not run due to the strike 15
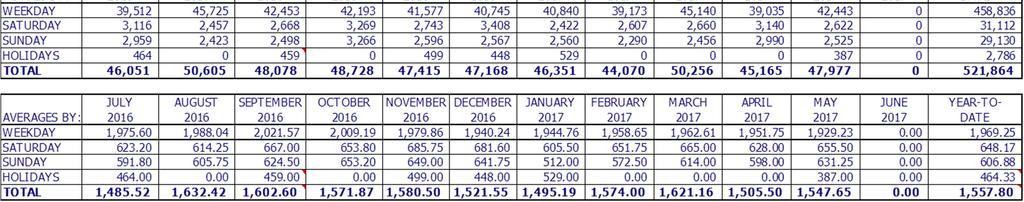
16 SUN TRAN ANNUAL RIDERSHIP CURRENT YEAR JULY AUGUST SEPTEMBER OCTOBER NOVEMBER DECEMBER JANUARY 2017 FEBRUARY 2017 MARCH 2017 APRIL 2017 MAY 2017 JUNE 2017 ANNUAL FY 2017 FIXED ROUTE 1,253,631 1,481,755 1,435,650 1,461,241 1,406,411 1,364,200 1,342,742 1,316,095 1,411,833 1,274,755 1,298,352 15,046,665 EXPRESS 14,243 17,613 16,039 15,675 14,410 12,194 15,167 14,365 15,811 14,041 14, ,364 TOTAL 1,267,874 1,499,368 1,451,689 1,476,916 1,420,821 1,376,394 1,357,909 1,330,460 1,427,644 1,288,796 1,313, ,211,029 PREVIOUS YEAR JULY 2015 AUGUST 2015 SEPTEMBER 2015 OCTOBER 2015 NOVEMBER 2015 DECEMBER 2015 JANUARY FEBRUARY MARCH APRIL MAY JUNE ANNUAL FY FIXED ROUTE 1,483, , ,521 1,463,092 1,382,187 1,408,333 1,392,150 1,470,999 1,476,392 1,452,963 1,417,091 1,314,118 15,569,436 EXPRESS 18,164 2,794 7,249 17,895 14,683 14,080 15,893 16,455 17,147 16,822 16,495 16, ,065 TOTAL 1,502, , ,770 1,480,987 1,396,870 1,422,413 1,408,043 1,487,454 1,493,539 1,469,785 1,433,586 1,330,506 15,743,501 VARIANCE JULY AUGUST SEPTEMBER OCTOBER NOVEMBER DECEMBER JANUARY FEBRUARY MARCH APRIL MAY JUNE YEAR-TO- DATE FIXED ROUTE (230,300) 965, ,129 (1,851) 24,224 (44,133) (49,408) (154,904) (64,559) (178,208) (118,739) (1,314,118) (522,771) EXPRESS (3,921) 14,819 8,790 (2,220) (273) (1,886) (726) (2,090) (1,336) (2,781) (1,689) (16,388) (9,701) TOTAL (234,221) 979, ,919 (4,071) 23,951 (46,019) (50,134) (156,994) (65,895) (180,989) (120,428) (1,330,506) (532,472) % VARIANCE JULY AUGUST SEPTEMBER OCTOBER NOVEMBER DECEMBER JANUARY FEBRUARY MARCH APRIL MAY JUNE YEAR-TO- DATE FIXED ROUTE -15.5% 186.8% 81.4% -0.1% 1.8% -3.1% -3.5% -10.5% -4.4% -12.3% -8.4% % -3.4% EXPRESS -21.6% 530.4% 121.3% -12.4% -1.9% -13.4% -4.6% -12.7% -7.8% -16.5% -10.2% % -5.6% TOTAL -15.6% 188.6% 81.7% -0.3% 1.7% -3.2% -3.6% -10.6% -4.4% -12.3% -8.4% % -3.4% TOTALS BY: JULY AUGUST SEPTEMBER OCTOBER NOVEMBER DECEMBER JANUARY 2017 FEBRUARY 2017 MARCH 2017 APRIL 2017 MAY 2017 JUNE 2017 ANNUAL FY 2017 WEEKDAY 1,025,690 1,315,701 1,245,634 1,239,989 1,224,133 1,159,044 1,153,986 1,154,723 1,252,197 1,082,881 1,136, ,990,557 SATURDAY 133, , , , , ,484 98, , , ,644 94, ,254,489 SUNDAY 91,385 74,643 74,532 96,237 75,351 66,316 81,481 70,712 71,843 83,271 65, ,845 HOLIDAY 17, , ,026 23,550 23, , ,138 TOTAL 1,267,874 1,499,368 1,451,689 1,476,916 1,420,821 1,376,394 1,357,909 1,330,460 1,427,644 1,288,796 1,313, ,211,029 AVERAGES BY: JULY AUGUST SEPTEMBER OCTOBER NOVEMBER DECEMBER JANUARY 2017 FEBRUARY 2017 MARCH 2017 APRIL 2017 MAY 2017 JUNE 2017 ANNUAL FY 2017 WEEKDAY 51,285 57,204 59,316 59,047 58,292 55,193 54,952 57,736 54,443 54,144 51, ,274 SATURDAY 26,665 27,256 28,028 28,138 26,828 25,497 24,661 26,256 25,901 24,529 23, ,415 SUNDAY 18,277 18,661 18,633 19,247 18,838 16,579 16,296 17,678 17,961 16,654 16, ,093 HOLIDAY 17, , ,026 23,550 23,800 16, ,138 TOTAL 40,899 48,367 48,390 47,642 47,361 44,400 43,804 47,516 46,053 42,960 42, ,751 NOTES: 1) There were changes in the number of calendar days for the current year and prior year. The data is not adjusted for the same day comparison. 16
17 SUN TRAN PERFORMANCE INDICATORS MAY 2017 SYSTEM INDICATOR CURRENT MONTH BUDGET AVG YTD 1. RIDERSHIP 1,313,158 1,451,870 1,382, PASSENGER REVENUE $ 915,457 $ 785,730 $ 887, PASSENGER PER TOTAL MILE PASSENGER PER HOUR REVENUE PER PASSENGER $ REVENUE PER TOTAL MILE $ 1.12 $ 1.23 $ REVENUE PER HOUR $ $ $ FAREBOX RECOVERY RATIO 20.6% 19.9% 19.5% 9. TOTAL COST PER PASSENGER $ 3.38 $ 3.19 $ TOTAL COST PER MILE $ 5.35 $ 6.20 $ TOTAL COST PER SERVICE HOUR $ $ $ MILES BETWEEN ROAD CALLS 11,375 8,200 14, MILES BETWEEN BUS INSPECTION 5,901 6,300 5, TOTAL VEHICLE ACCIDENTS PER 100,000 MILES TOTAL COMPLAINTS PER 100,000 PASSENGER VEHICLES OPERATED IN MAXIMUM SERVICE
18 FY 16 FY 17 Budget Sun Tran Performance Indicators Fiscal Year 2017 Ridership (in millions) Passenger Revenue (in 100 thousands) Jul Aug Sep Oct Nov Dec Jan Feb Mar Apr May Jun 0 Jul Aug Sep Oct Nov Dec Jan Feb Mar Apr May Jun Indicators are impacted by the FY16 Strike which occurred from 8/6/15 through 9/16/15 18
19 FY 16 FY 17 Budget Sun Tran Performance Indicators Fiscal Year 2017 Passengers per Total Mile Passengers per Hour Jul Aug Sep Oct Nov Dec Jan Feb Mar Apr May Jun 0 Jul Aug Sep Oct Nov Dec Jan Feb Mar Apr May Jun Indicators are impacted by the FY16 Strike which occurred from 8/6/15 through 9/16/15 19
20 FY 16 FY 17 Budget Sun Tran Performance Indicators Fiscal Year 2017 Revenue per Passenger Revenue per Total Mile Jul Aug Sep Oct Nov Dec Jan Feb Mar Apr May Jun 0 Jul Aug Sep Oct Nov Dec Jan Feb Mar Apr May Jun Indicators are impacted by the FY16 Strike which occurred from 8/6/15 through 9/16/15 20
21 FY 16 FY 17 Budget Sun Tran Performance Indicators Fiscal Year 2017 Revenue per Hour Farebox Recovery Ratio Jul Aug Sep Oct Nov Dec Jan Feb Mar Apr May Jun 0 Jul Aug Sep Oct Nov Dec Jan Feb Mar Apr May Jun Indicators are impacted by the FY16 Strike which occurred from 8/6/15 through 9/16/15 21
22 FY 16 FY 17 Budget Sun Tran Performance Indicators Fiscal Year 2017 Total Cost per Passenger Total Cost per Mile Jul Aug Sep Oct Nov Dec Jan Feb Mar Apr May Jun Jul Aug Sep Oct Nov Dec Jan Feb Mar Apr May Jun 0 Jul Aug Sep Oct Nov Dec Jan Feb Mar Apr May Jun Indicators are impacted by the FY16 Strike which occurred from 8/6/15 through 9/16/15 22
23 FY 16 FY 17 Budget Sun Tran Performance Indicators Fiscal Year 2017 Total Cost per Mile Total Cost per Service Hour Jul Aug Sep Oct Nov Dec Jan Feb Mar Apr May Jun 0 Jul Aug Sep Oct Nov Dec Jan Feb Mar Apr May Jun Indicators are impacted by the FY16 Strike which occurred from 8/6/15 through 9/16/15 23
24 FY 16 FY 17 Budget Sun Tran Performance Indicators Fiscal Year 2017 Miles Between Road Calls Miles Between Inspections Jul Aug Sep Oct Nov Dec Jan Feb Mar Apr May Jun Revenue vehicle system failures are defined as mechanical problems that cause a vehicle not to complete its scheduled revenue trip, or does not start its next scheduled revenue trip. *Per NTD guidelines Jul Aug Sep Oct Nov Dec Jan Feb Mar Apr May Jun Acceptable range is + or 10% Indicators are impacted by the FY16 Strike which occurred from 8/6/15 through 9/16/15 24
25 FY 16 FY 17 Budget Sun Tran Performance Indicators Fiscal Year 2017 Vehicle Accidents per 100,000 Miles 3.5 Complaints per 100,000 Passengers Jul Aug Sep Oct Nov Dec Jan Feb Mar Apr May Jun 0 Jul Aug Sep Oct Nov Dec Jan Feb Mar Apr May Jun Indicators are impacted by the FY16 Strike which occurred from 8/6/15 through 9/16/15 25

26 Sun Tran Performance Indicators Fiscal Year

27 FY 16 FY 17 Sun Tran Performance Indicators Fiscal Year
28 ` SUN TRAN ROUTE PERFORMANCE PROFILE MAY 2017 ROUTE TOTAL ROUTE PASSENGERS ROUTE REVENUE TOTAL SERVICE MILES TOTAL SERVICE HOURS TOTAL COST ALLOCATION NET COST PER HOUR PASSENGER PER MILE PASSENGER PER HOUR REVENUE PER MILE REVENUE PER HOUR SUBSIDY PER PASSENGER 1 35,537 $ 24,632 20,889 1,801 $ 119,100 $ $ 1.28 $ $ ,983 15,987 21,232 1, , ,849 42,114 46,525 3, , ,265 73,918 56,171 4, , ,623 12,899 18,293 1,445 99, ,437 33,122 19,773 2, , ,867 47,427 46,791 3, , ,948 77,936 56,272 4, , ,657 35,588 33,431 2, , ,630 21,111 15,152 1,234 83, ,758 62,510 47,516 3, , ,860 22,511 20,139 1, , ,523 21,726 27,462 2, , ,333 70,112 45,992 4, , ,178 46,773 45,092 3, , ,490 55,547 25,377 2, , ,989 22,381 9,784 1,082 65, ,000 8,603 10, , ,570 8,179 10, , ,901 20,151 20,263 1, , ,921 13,785 7, , ,486 25,665 22,855 1, , ,309 10,773 17,551 1,066 82, ,829 16,014 22,141 1, , ,410 23,068 21,534 1, , ,034 40,621 37,348 3, , ,637 9,708 15,358 1,164 81, ,240 6,955 6, , ,110 7,254 11, , TOTAL FIXED ROUTE 1,298, , ,215 61,809 4,188,093 $ $ 1.28 $ $ 2.55 TOTAL ROUTE ROUTE TOTAL SERVICE TOTAL SERVICE TOTAL COST NET COST PASSENGER PASSENGER REVENUE REVENUE SUBSIDY PER ROUTE PASSENGERS REVENUE MILES HOURS ALLOCATION PER HOUR PER MILE PER TRIP PER MILE PER HOUR PASSENGER 101X 1,891 $ 5,226 3, $ 16,677 $ $ 3.27 $ $ X 1,478 4,182 4, , X 676 1,890 2, , X 1,195 3,396 3, , X 1,237 3,438 3, , X 1,484 3,917 10, , X 1,385 3,837 4, , X 612 1,493 4, , X 1,732 4,677 5, , X 529 1,102 3, , X 1,772 3,602 8, , X 794 1,628 6, , TOTAL EXPRESS ROUTE 14,785 38,388 60,830 2, ,314 $ $ 1.11 $ $ TOTAL SERVICE 1,313, , ,045 64,580 4,438,407 $ $ 1.27 $ $ 2.68 Notes: 1) Service miles denotes Scheduled Vehicle Revenue and Deadhead Miles per Route. 2) Effective March 2014: The passenger per hour metric has been replaced with passenger per trip for express route service. Passenger per trip is a better measurement of productivity for express service. 3) Routes 110X and 312X are bi-directional express service. 28
29 SUN TRAN RANKING OF ROUTES - ROUTE PASSENGERS PER HOUR MAY 2017 RANKING ROUTE NUMBER ROUTE DESCRIPTION PASSENGERS PER HOUR 1 18 S. 6TH AVENUE TH AVENUE STONE FLOWING WELLS ORACLE / INA BROADWAY ALVERNON SPEEDWAY EUCLID/ NORTH FIRST AVENUE TH / 12TH AVENUE S. PARK AVENUE GLENN/SWAN ND STREET COUNTRY CLUB / 29TH STREET VALENCIA CRAYCROFT / FT LOWELL TH STREET / WILMOT GRANT ROAD MISSION ROAD WEST CONGRESS / SILVERBELL CHERRYBELL GRANDE AJO BENSON HIGHWAY MIDVALE PARK CAMPBELL AVENUE PIMA STREET / WEST SPEEDWAY LA CHOLLA PANTANO 11.7 FIXED ROUTE SYSTEM AVERAGE 21.0 RANKING ROUTE NUMBER ROUTE DESCRIPTION PASSENGERS PER TRIP 1 101X GOLF LINKS EXPRESS X INA ROAD EXPRESS X ORO VALLEY/AEROPARK EXPRESS X BROADWAY EXPRESS X MARANA EXPRESS X SUNRISE EXPRESS X RITA RANCH/DOWNTOWN EXPRESS X OLDFATHER EXPRESS X ORO VALLEY/DOWNTOWN EXPRESS X TANQUE VERDE EXPRESS X NORTHWEST-AERO PARK EXPRESS X SPEEDWAY/AEROPARK EXPRESS 1.1 EXPRESS ROUTE SYSTEM AVERAGE
30 CUSTOMER INFORMATION CENTER The customer service information and call center answered 20,063 phone calls in May That is a 2% increase from the 19,640 calls answered in April 2017 and a 17% decrease from the 24,076 calls answered in May. Sun Tran s website customer feedback response center received 103 s in May That is a 2% increase over the 101 s received April 2017 and a 14% decrease from the 120 s received in May. SERVICE REPORTS COMPARISON MAY 2017 MAY % Increase/Decrease Total Service Reports: % Inquiries % Compliments % Complaints % Chargeable % Non-chargeable % Pending % Incomplete % SERVICE REPORTS COMPARISON MAY 2017 APRIL 2017 % Increase/Decrease Total Service Reports: % Inquiries % Compliments % Complaints % Chargeable % Non-chargeable % Pending % Incomplete % Notes: 1) Complaints deemed non chargeable were investigated, and the results indicated Sun Tran was not at fault. (Example: bus did not show, bus was early or late, etc.) 2) Incomplete are service reports with incomplete information that did not allow Sun Tran to finish an investigation. 3) Incomplete service reports are held in the event additional facts are provided to finish the investigation. 4) Inquiries are customer questions that are not complaints, but focus on service issues, and are more informational based in the response back to the consumer. 30
31 31
32 32
33 33
34 34
35 35
36 36

37 FY 16 FY 17 Budget Sun Van Performance Indicators Fiscal Year
38 FY 16 FY 17 Budget Sun Van Performance Indicators Fiscal Year


39 FY 16 FY 17 Budget Sun Van Performance Indicators Fiscal Year

40 FY 16 FY 17 Budget Sun Van Performance Indicators Fiscal Year


41 FY 16 FY 17 Sun Van Performance Indicators Fiscal Year 2017 * ADA Service only. ** Data does not include same-day requests. 41
42 42

43 Sun Tran Glossary of Terms Ridership (Unlinked Passenger Trips) The number of passengers who board public transportation vehicles. Passengers are counted each time they board vehicles no matter how many vehicles they use to travel from their origin to their destination. Total Cost per Passenger Equals total expenditures divided by total passengers. Passenger per Mile Equals total passengers divided by total miles. Passenger per Service Hour Equals total ridership divided by total service hours. Passenger Revenue Equals revenue collected from passengers (includes farebox revenue and revenue from pass sales). Revenue Miles and Hours The miles and hours that vehicles travel while in revenue service. Vehicle revenue miles and hours (VRM and VRH) include: layover / recovery time. But exclude: deadhead, operator training and maintenance testing, as well as school bus and charter services. Revenue per Mile Equals total passenger revenue divided by total miles. Revenue per Passenger Equals total passenger revenue divided by total passengers Revenue per Service Hour Equals passenger revenue divided by service hours Deadhead Miles and Hours Miles and hours that a vehicle travels when out of revenue service. Deadhead includes: leaving or returning to the garage or yard facility, changing routes, or when there is no expectation of carrying revenue passengers. However, deadhead does not include: charter service, school bus service, operator training, maintenance training. Service Miles and Hours Miles and hours that vehicles travel while in revenue service plus deadhead miles and hours. But exclude: charter and school bus service, operator training, and maintenance testing. Total Cost per Mile Equals total expenditures divided by total miles. Cost per Mile Equals total expenditures less Operating Grant Funds divided by total miles. Cost per Service Hour Equals total expenditures less Operating Grant Funds divided by total service hours. Total Complaints per 100,000 passengers Equals total complaints divided by total passengers times 100,000. On-Time As defined by the Short Range Transit Plan, a bus may be up to 5 minutes late, but less than 1 minute early. Road Calls Equals total chargeable road calls. A road call is defined as a mechanical failure of a bus in revenue service that necessitates removing the bus from service until repairs are made.. 43
44 Sun Van Glossary of Terms Ridership (Unlinked Passenger Trips) - Equals total Passengers actually transported. A one-way trip taken by an ADA Paratransiteligible passenger, a personal care attendant (PCA) or companions from the pick-up point to the destination. Passengers Per Revenue Hour - Equals Ridership divided by Revenue hours. Total Demand - Total number of passenger trips requested. Denial An ADA-eligible trip requested that is not scheduled by Sun Van within the permissible scheduled window of on hour before or one hour after the requested pick-up time. Passengers Per Service Hour - Equals Ridership divided by Service hours. Revenue Per Trip Total Passenger Revenue divided by Trips. Cancellations - Occurs when the passenger or the passenger s representative cancels the reservation two (2) or more hours prior to the beginning of the scheduled pick-up time. Total Cost Per Trip Total Expenses divided by total Trips. No-Shows - Occurs when the passenger does not board the Sun Van vehicle when the vehicle arrives at the pick-up location within the pick up window and the driver waits two (2) minutes, or when the customer does not cancel the reservation within two (2) hours of the reservation. Trip Time - The percentage of ADA Trips with a trip time less than the comparable Sun Tran fixed route trip. Optional ADA Passenger trips beyond the ¾ mile corridors and beyond times available on a Sun Tran fixed route, a same-day request, and will calls. Trip A one-way trip taken by an ADA-Paratransit-eligible passenger from the pick-up point to the destination (excludes PCAs and companions). Revenue Miles All miles operated from pick-up point to destination. Trip Time 110%+5 Minutes Occurs when an ADA trip length exceeds 110% + 5 minutes of the comparable Sun Tran regular fixed route trip. On Time Pick Ups - The number of on time vehicle trips. The van is considered on time if it arrives between 15 minutes before or 15 minutes after the requested pick-up time. Pick Ups before Significantly Late - Pick Ups 30 minutes outside the original pick up window. Deadhead Miles Miles operated not providing specific revenue service. 44
MONTHLY REPORT JUNE 2017
 & MONTHLY REPORT JUNE 2017 SECTION Sun Tran & Sun Van Monthly Operations Report Table of Contents June 2017 PAGE I.System Highlights and Accomplishments 3-10 II.Sun Tran a.ridership 11 b.revenue 12 c.pass
MONTHLY REPORT SEPTEMBER 2017
 & MONTHLY REPORT SEPTEMBER 2017 SECTION Sun Tran & Sun Van Monthly Operations Report Table of Contents September 2017 PAGE I.System Highlights and Accomplishments 3-10 II.Sun Tran a.ridership 11 b.revenue
MONTHLY REPORT AUGUST 2017
 & MONTHLY REPORT AUGUST SECTION Sun Tran & Sun Van Monthly Operations Report Table of Contents August PAGE I.System Highlights and Accomplishments 3-10 II.Sun Tran a.ridership 11 b.revenue 12 c.pass Sales
MONTHLY REPORT DECEMBER 2017
 & MONTHLY REPORT DECEMBER 2017 SECTION Sun Tran & Sun Van Monthly Operations Report Table of Contents December 2017 PAGE I.System Highlights and Accomplishments 3-12 II.Sun Tran a.ridership 13 b.revenue
MONTHLY REPORT OCTOBER 2017
 & MONTHLY REPORT OCTOBER SECTION Sun Tran & Sun Van Monthly Operations Report Table of Contents October PAGE I.System Highlights and Accomplishments 3-11 II.Sun Tran a.ridership 12 b.revenue 13 c.pass
MONTHLY OPERATIONS REPORT SEPTEMBER 2015
 MONTHLY OPERATIONS REPORT SEPTEMBER 215 Table of Contents SEPTEMBER 215 Section Page September Highlights... 3 Strategic Goals Progress Update... 4 Ridership... 6 Revenue... 9 Expenses... 1 System Summary...
MONTHLY OPERATIONS REPORT DECEMBER 2015
 MONTHLY OPERATIONS REPORT DECEMBER 215 Table of Contents DECEMBER 215 Section Page December Highlights... 3 Strategic Goals Progress Update... 4 Ridership... 6 Revenue... 9 Expenses... 1 System Summary...
MONTHLY REPORT SEPTEMBER 2017
 MONTHLY REPORT 2017 SUN SHUTTLE RIDERSHIP ROUTE PASSENGERS: CURRENT YEAR PRIOR YEAR AMOUNT PERCENTAGE BUDGET AMOUNT PERCENTAGE TOTAL PASSENGERS 17,250 20,318 (3,068) -15.1% 18,231 (981) -5.4% CALENDAR
PERFORMANCE REPORT DECEMBER 2017
 PERFORMANCE REPORT DECEMBER 2017 Note: New FY2018 Goal/Target/Min or Max incorporated in the Fixed Route and Connection Dashboards. Keith A. Clinkscale Performance Manager INTRODUCTION/BACKGROUND Keith
PERFORMANCE REPORT NOVEMBER 2017
 PERFORMANCE REPORT NOVEMBER 2017 Note: New FY2018 Goal/Target/Min or Max incorporated in the Fixed Route and Connection Dashboards. Keith A. Clinkscale Performance Manager INTRODUCTION/BACKGROUND In June
Transit Performance Report FY (JUNE 30, 2007)
") Transit Performance Report FY 2006-2007 (JUNE 30, 2007) J ANUARY 2008 TRANSIT PERFORMANCE REPORT FY 2006 2007 (JUNE 30, 2007) Transit Performance Report I SSUED: JANUARY 2008 The Transit Performance Report
Transit Performance Report FY 2006-2007 (JUNE 30, 2007) J ANUARY 2008 TRANSIT PERFORMANCE REPORT FY 2006 2007 (JUNE 30, 2007) Transit Performance Report I SSUED: JANUARY 2008 The Transit Performance Report
Sound Transit Operations August 2015 Service Performance Report. Ridership
 Ridership Total Boardings by Mode Mode Aug-14 Aug-15 % YTD-14 YTD-15 % ST Express 1,534,241 1,553,492 1.3% 11,742,839 12,354,957 5.2% Sounder 275,403 326,015 18.4% 2,139,086 2,463,422 15.2% Tacoma Link
Sound Transit Operations January 2014 Service Performance Report. Ridership
 Ridership Total Boardings by Mode Mode Jan-13 Jan-14 % YTD-13 YTD-14 % ST Express 1,343,290 1,426,928 6.2% 1,343,290 1,426,928 6.2% Sounder 245,135 256,775 4.7% 245,135 256,775 4.7% Tacoma Link 86,229
Sound Transit Operations December 2014 Service Performance Report. Ridership
 Ridership Total Boardings by Mode Mode Dec-13 Dec-14 % YTD-13 YTD-14 % ST Express 1,266,130 1,396,787 10.3% 16,605,299 17,661,976 6.4% Sounder 248,710 285,016 14.6% 3,035,735 3,361,317 10.7% Tacoma Link
PERFORMANCE REPORT DECEMBER Performance Management Office
 PERFORMANCE REPORT DECEMBER 2018 Performance Management Office INTRODUCTION/BACKGROUND Performance Management Office FIXED ROUTE DASHBOARD FY 2019 Safety Max Target Goal Preventable Collisions per 100k
RIDERSHIP TRENDS. October 2017
 RIDERSHIP TRENDS October 2017 Prepared by the Division of Strategic Capital Planning December 2017 Table of Contents Executive Summary...1 Ridership...3 Estimated Passenger Trips by Line...3 Estimated
Sound Transit Operations March 2018 Service Performance Report. Ridership
 March 218 Service Performance Report Ridership Total Boardings by Mode Mar-17 Mar-18 % YTD-17 YTD-18 % ST Express 1,622,116 1,47,79-4.6% 4,499,798 4,428,14-1.6% Sounder 393,33 39,6.% 1,74,96 1,163,76 8.3%
Board Box. October Item # Item Staff Page 1. Key Performance Indicators Sep 2018 M. Mungia Financial Report Aug 2018 H.
 Board Box October 2018 Item # Item Staff Page 1. Key Performance Indicators Sep 2018 M. Mungia 2-10 2. Financial Report Aug 2018 H. Rodriguez 11-15 ITEM 1 October 31, 2018 TO: FROM: RE: BOARD OF DIRECTORS
Sound Transit Operations January 2017 Service Performance Report. Ridership. Total Boardings by Mode
 January 217 Service Performance Report Ridership ST Express Sounder Tacoma Link Link Paratransit Jan-16 Jan-17 % 1,433,7 1,3,33 4.9% 331,27 7,121 98,411 3,633 Total Boardings by Mode 363,6 74,823 1,76,914
Board of Directors Information Summary
 Regional Public Transportation Authority 302 N. First Avenue, Suite 700, Phoenix, Arizona 85003 602-262-7433, Fax 602-495-0411 Board of Directors Information Summary Agenda Item #6 Date July 11, 2008 Subject
Att. A, AI 46, 11/9/17
 Total s San Diego Metropolitan Transit System POLICY 42 PERFORMANCE MONITORING REPORT Page 1 of 6 Date: 11/8/17 OBJECTIVE Develop a Customer-Focused and Competitive System The following measures of productivity
Sound Transit Operations January 2018 Service Performance Report. Ridership
 January 218 Service Performance Report Ridership Total Boardings by Mode Jan-17 Jan-18 % YTD-17 YTD-18 % ST Express 1,3,33 1,7,91.3% 1,3,33 1,7,91.3% Sounder 367,33 416,8 13.3% 367,33 416,8 13.3% Tacoma
Sound Transit Operations February 2018 Service Performance Report. Ridership
 February 218 Service Performance Report Ridership Total Boardings by Mode Feb-17 Feb-18 % YTD-17 YTD-18 % ST Express 1,373,96 1,372,88 -.1% 2,877,294 2,88,719.1% Sounder 314,96 32,187 11.9% 681,923 768,69
2017/ Q1 Performance Measures Report
 2017/2018 - Q1 Performance Measures Report Contents Ridership & Revenue... 1 Historical Revenue & Ridership... 1 Revenue Actual vs. Planned... 3 Mean Distance Between Failures... 5 Maintenance Cost Quarter
Date: 11/6/15. Total Passengers
 Total San Diego Metropolitan Transit System POLICY 42 PERFORMANCE MONITORING REPORT Page 1 of 6 OBJECTIVE Develop a Customer-Focused and Competitive System The following measures of productivity and service
RIDERSHIP TRENDS. January 2018
 RIDERSHIP TRENDS January 2018 Prepared by the Division of Strategic Capital Planning March 2018 Table of Contents Executive Summary...1 Ridership...3 Estimated Passenger Trips by Line...3 Estimated Passenger
PERFORMANCE REPORT JANUARY Keith A. Clinkscale Performance Manager
 PERFORMANCE REPORT JANUARY 2018 Keith A. Clinkscale Performance Manager INTRODUCTION/BACKGROUND Keith A. Clinkscale Performance Manager FIXED ROUTE DASHBOARD JANUARY 2018 Safety Max Target Goal Preventable
Sound Transit Operations June 2016 Service Performance Report. Ridership
 Ridership Total Boardings by Mode Mode Jun-15 Jun-16 % YTD-15 YTD-16 % ST Express 1,622,222 1,617,420-0.3% 9,159,934 9,228,211 0.7% Sounder 323,747 361,919 11.8% 1,843,914 2,099,824 13.9% Tacoma Link 75,396
Existing Services, Ridership, and Standards Report. June 2018
 Existing Services, Ridership, and Standards Report June 2018 Prepared for: Prepared by: Contents Overview of Existing Conditions... 1 Fixed Route Service... 1 Mobility Bus... 34 Market Analysis... 41 Identification/Description
Performance Measures Year End Updated-
 Performance Measures Year End 2017 -Updated- Priorities and Objectives 1. Earn and Retain the Community s Trust 2. Provide Excellent Customer Service 3. Enable Organizational Success 4. Exemplify Financial
RIDERSHIP TRENDS. August 2018
 RIDERSHIP TRENDS August Prepared by the Division of Strategic Capital Planning October Table of Contents Executive Summary...1 Ridership...3 Estimated Passenger Trips by Line...3 Estimated Passenger Trips
METRO OPERATIONS COMMITTEE
 Los Angeles County Metropolitan Transportation Authority Item 1 CHIEF OPERATIONS OFFICER S S REPORT METRO OPERATIONS COMMITTEE Lonnie Mitchell Chief Operations Officer May 19, 20 1 Employee Recognition
Board Box. February Item # Item Staff Page 1. Key Performance Indicators M. Thompson Financial Report for Dec H.
 Board Box February 2016 Item # Item Staff Page 1. Key Performance Indicators M. Thompson 2-8 2. Financial Report for Dec. 2015 H. Rodriguez 9-13 ITEM 1 February 15, 2016 TO: FROM: RE: BOARD OF DIRECTORS
FIXED ROUTE DASHBOARD JULY 2018
 FIXED ROUTE DASHBOARD JULY 2018 Safety Max Target Goal Preventable Collisions per 100k Miles Non-Preventable Collisions per 100k Miles Total Incidents per 10,000 Boardings 1.6 1.3 0.8 2.63 2.1 2.0 1.60
Sound Transit Operations March 2017 Service Performance Report. Ridership. Total Boardings by Mode
 March 217 Service Performance Report Ridership ST Express Sounder Tacoma Link Link Paratransit Mar-16 Mar-17 % 1,83,4 1,621,49 2.4% 37,496 82,631 1,264,47 3,821 Total Boardings by Mode 389,98 87,39 1,89,43,297
VCTC Transit Ridership and Performance Measures Quarterly Report
 VCTC Transit Ridership and Performance Measures Quarterly Report Overview Quarter 2 Fiscal Year 2018-2019 This report provides performance measures for VCTC Intercity Bus Service covering the FY 2018-19
With the completion of this project, we would like to follow-up on the projections as well as highlight a few other items:
 TO: FROM: Mayor and Council Interim City Manager Rebecca Underhill, Director of Finance DATE: February 28, 2014 SUBJECT: Water Meter Project Analysis On March 28, 2012, Acting City Manager Mike Loftin
METROBUS SERVICE GUIDELINES
 METROBUS SERVICE GUIDELINES In the late 1990's when stabilization of bus service was accomplished between WMATA and the local jurisdictional bus systems, the need for service planning processes and procedures
Establishes a fare structure for Tacoma Link light rail, to be implemented in September 2014.
 RESOLUTION NO. R2013-24 Establish a Fare Structure and Fare Level for Tacoma Link MEETING: DATE: TYPE OF ACTION: STAFF CONTACT: PHONE: Board 09/26/2013 Final Action Ric Ilgenfritz, Executive Director,
Bristol Virginia Transit
 Bristol Virginia Transit 1 Transit Overview Bristol Virginia Transit (BVT) is a Federally Funded and certified urban area transit system. BVT began operation in its current form in 1982. In Fiscal Year
Quarterly Report Transit Bureau, Local Transit Operations. First Quarter, Fiscal Year 2015 (July 2014 September 2014) ART & STAR
 ART & STAR") Quarterly Report Transit Bureau, Local Transit Operations First Quarter, Fiscal Year 2015 (July 2014 September 2014) ART & STAR A Arlington Transit ART 1) Introduction The purpose of ART is to provide
Quarterly Report Transit Bureau, Local Transit Operations First Quarter, Fiscal Year 2015 (July 2014 September 2014) ART & STAR A Arlington Transit ART 1) Introduction The purpose of ART is to provide
Bus Operations Report
 Third Quarter FY 216 (January 1 - March 31, 216) Wednesday April 27, 216 Operations Ridership: 783,194 passengers used in the third quarter. This represents a 2% increase over the same period in FY 215.
2017/2018 Q3 Performance Measures Report. Revised March 22, 2018 Average Daily Boardings Comparison Chart, Page 11 Q3 Boardings figures revised
 2017/2018 Q3 Performance Measures Report Revised March 22, 2018 Average Daily Boardings Comparison Chart, Page 11 Q3 Boardings figures revised Contents Ridership & Revenue... 1 Historical Revenue & Ridership...
TRANSPORTATION SERVICE Actual
 PERFORMANCE REPORT-THIRD QUARTER VISION TO DELIVER REGIONAL MULTI-MODAL TRANSPORTATION SERVICES AND INFRASTRUCTURE IMPROVEMENTS THAT SIGNIFICANTLY AND CONTINUALLY INCREASE TRANSIT MARKET SHARE. MISSION
Factors that Affect Fixed-Route Ridership Frequency Connections and accessibility Travel time Travel cost Service area coverage Reliability
 The transit industry defines ridership as the number of passengers who board public transportation vehicles called unlinked passenger trips. Ridership measures transit utilization at the system, route,
Administrative Operations Report
 Fiscal Year 2017/18 Administrative Operations Report November 1, 2018 Prepared by: El Dorado County Transit Authority 6565 Commerce Way Diamond Springs, CA 95619 (530) 642-5383 www.eldoradotransit.com
DRT Performance Measurement: the U.S. Experience
 DRT Performance Measurement: the U.S. Experience FOR ANYBODY GOING ANYWHER IN LA HABRA International Conference on Demand Responsive Transportation Breckenridge, Colorado September 2016 DRT Performance
General Issues Committee Item Transit Operating Budget Ten Year Local Transit Strategy
 General Issues Committee Item 4.1 2017 Transit Operating Budget Ten Year Local Transit Strategy January 27, 2017 Presentation Outline 2017 Operating Budget Overview Ten Year Local Transit Strategy 2 2017
ESCAMBIA COUNTY AREA TRANSIT MTAC REPORT
 ESCAMBIA COUNTY AREA TRANSIT MTAC REPORT November 8, 2017 Meeting Escambia County Area Transit 1515 W. Fairfield Drive Pensacola, FL 32501 850-595-3228 INTRODUCTION 2 Summary Background MTAC ECAT Benchmarks
Service Cost Estimate for Route 10 only
 2009-2011 Service Cost Estimate for Route 10 only The City of Ashland buys down the fare on Route 10 for each passenger riding in Ashland, therefore service cost estimates are based on recent ridership
January 2018 Air Traffic Activity Summary
 January 2018 Air Traffic Activity Summary Jan-2018 Jan-2017 CY-2018 CY-2017 Passengers 528,947 505,421 4.7% 528,947 505,421 4.7% Passengers 537,332 515,787 4.2% 537,332 515,787 4.2% Passengers 1,066,279
ATTACHMENT A.7. Transit Division Performance Measurements Report Fiscal Year Fourth Quarter
 TTCHMENT.7 Transit Division Performance Measurements Report Fiscal Year 2012-13 Fourth Quarter Introduction The Orange County Transportation uthority (OCT) operates a countywide network of local, community,
About This Report GAUGE INDICATOR. Red. Orange. Green. Gold
 ATTACHMENT A About This Report The Orange County Transportation Authority (OCTA) operates a countywide network of local, community, rail connector, and express bus routes serving over 6, bus stops. OCTA
September 2014 Prepared by the Department of Finance & Performance Management Sub-Regional Report PERFORMANCE MEASURES
 September 2014 Prepared by the Department of Finance & Performance Management 2013 Sub-Regional Report PERFORMANCE MEASURES REGIONAL PERFORMANCE MEASURES RTA staff has undertaken the development of a performance
YOSEMITE AREA REGIONAL TRANSPORTATION SYSTEM
 YOSEMITE AREA REGIONAL TRANSPORTATION SYSTEM Short Range Transit Plan Prepared for the Merced County Association of Governments/YARTS Prepared by LSC Transportation Consultants, Inc. YOSEMITE AREA REGIONAL
Scorecard Key Performance Indicators
 Scorecard Key Performance Indicators 1 st Quarter 2013 NICE Bus Fixed Route NICE Bus Fixed Route Definitions Scheduled Revenue Hours Full Trip Revenue Hours Lost Runs Missed Revenue Hours Lost Actual Hours
Metra Board of Directors. Board Meeting November 11, 2011
 Metra Board of Directors Board Meeting November 11, 2011 State of Metra Operations Metra Board of Directors November 11, 2011 Presented by George Hardwidge Deputy Executive Director Operations System On-Time
FIXED ROUTE Operating Statistics For Periods Ending 9/30/2008 & 9/30/2009
 FIXED ROUTE Operating Statistics For Periods Ending 9/30/2008 & 9/30/2009 CURRENT MONTH YEAR TO DATE Actual Actual Variance Actual Actual Variance 2008 2009 2008 to 2009 2008 2009 2008 to 2009 Service
Chapter 3. Burke & Company
 Chapter 3 Burke & Company 3. WRTA RIDERSHIP AND RIDERSHIP TRENDS 3.1 Service Overview The Worcester Regional Transit Authority (WRTA) provides transit service to over half a million people. The service
CWC LA - Cash Balance (January 2012)
") CWC LA - Cash Balance 2012-13 (January 2012) 1,200,000 Cash Balance 1,000,000 800,000 ($1,000s) 600,000 400,000 200,000 - CWC LA - Actuals/Projected CWC LA - ed (Nov) 1 1 CWC Hollywood - Financial Dashboard
CWC LA - Cash Balance 2012-13 (January 2012) 1,200,000 Cash Balance 1,000,000 800,000 ($1,000s) 600,000 400,000 200,000 - CWC LA - Actuals/Projected CWC LA - ed (Nov) 1 1 CWC Hollywood - Financial Dashboard
FY Transit Needs Assessment. Ventura County Transportation Commission
 FY 18-19 Transit Needs Assessment Ventura County Transportation Commission Contents List of Figures and Appendices.. 2 Appendices... 1 Chapter 1: Introduction What is the Ventura County Transportation
Current Operations CHAPTER II INTRODUCTION DESCRIPTION OF TRANSPORTATION SERVICES
 Chapter II CHAPTER II Current Operations INTRODUCTION This chapter provides an overview of Centre Area Transportation Authority (CATA). CATA is a joint municipal authority formed under the Municipal Authorities
Peer Performance Measurement February 2019 Prepared by the Division of Planning & Market Development
 2017 Regional Peer Review Peer Performance Measurement February 2019 Prepared by the Division of Planning & Market Development CONTENTS EXECUTIVE SUMMARY... 3 SNAPSHOT... 5 PEER SELECTION... 6 NOTES/METHODOLOGY...
COMO Bus Service Evaluation DRAFT COA. September 19, 2016
 DRAFT COA September 19, 2016 Chapter 1 Introduction Introduction The City of Columbia Missouri unveiled COMO Connect in 2013 with the goal of changing how public transportation options were delivered in
JANUARY 2017 BOARD INFORMATION PACKAGE
 JANUARY 2017 BOARD INFORMATION PACKAGE MEMORANDUM TO: Members of the Airport Authority FROM: Lew Bleiweis, Executive Director DATE: January 13, 2017 Financial Report (document) Informational Reports: A.
JANUARY 2018 BOARD INFORMATION PACKAGE
 JANUARY 2018 BOARD INFORMATION PACKAGE MEMORANDUM TO: Members of the Airport Authority FROM: Lew Bleiweis, Executive Director DATE: January 19, 2018 Financial Report (document) Informational Reports: A.
Analysts and Investors conference call. Q results. 15 May 2013
 Analysts and Investors conference call Q1 2013 results 15 May 2013 Management summary Key messages of Q1 2013 +6% +9% +3.3%p. Q1 2013 operational KPIs are in line with 109.7 116.2 6.5 7.1 82.3 85.6 expectations,
October REGIONAL ROUTE PERFORMANCE ANALYSIS
 October 2018 2017 REGIONAL ROUTE PERFORMANCE ANALYSIS The Council s mission is to foster efficient and economic growth for a prosperous metropolitan region Metropolitan Council Members Alene Tchourumoff
Implementation Guidelines and Performance Measures Special Transportation for Seniors and People with Disabilities (Paratransit) Program
 Program") FY 2019-20 FINAL December 2018 Implementation Guidelines and Performance Measures Special Transportation for Seniors and People with Disabilities (Paratransit) Program Implementation Guidelines These guidelines
FY 2019-20 FINAL December 2018 Implementation Guidelines and Performance Measures Special Transportation for Seniors and People with Disabilities (Paratransit) Program Implementation Guidelines These guidelines
MERRIMACK VALLEY REGIONAL TRANSIT AUTHORITY (MVRTA) PERFORMANCE MEASURES: FIXED ROUTE
 PERFORMANCE MEASURES: FIXED ROUTE") PERFORMANCE MEASURES: FIXED ROUTE IT IS OUR GOAL TO IMPROVE FIXED ROUTE SERVICE ON ALL LEVELS, ON A CONTINUOUS BASIS. IN ORDER TO DO THIS, WE HAVE ESTABLISHED BENCHMARKS TO MEASURE PERFORMANCE. THIS INFORMATION
PERFORMANCE MEASURES: FIXED ROUTE IT IS OUR GOAL TO IMPROVE FIXED ROUTE SERVICE ON ALL LEVELS, ON A CONTINUOUS BASIS. IN ORDER TO DO THIS, WE HAVE ESTABLISHED BENCHMARKS TO MEASURE PERFORMANCE. THIS INFORMATION
Capital Metropolitan Transportation Authority. Monthly Performance Report
 Capital Metropolitan Transportation Authority Monthly Performance Report AUGUST 2010 Ridership Report August 23, 2010 Budget to Actual Ridership Budget Target: 2,290,590 Actual: 2,300,796 Ridership Comparison
PTN-128 Reporting Manual Data Collection and Performance Reporting
 2016 PTN-128 Reporting Manual Data Collection and Performance Reporting Sponsored by the Texas Department of Transportation Table of Contents PTN-128 WHAT, WHY AND WHO... 6 What is the PTN-128... 13 Why
ADA PARATRANSIT PLAN. Twin Cities Area Transportation Authority 275 East Wall Benton Harbor, MI 49022
 ADA PARATRANSIT PLAN Twin Cities Area Transportation Authority 275 East Wall Benton Harbor, MI 49022 Contact person: Veronica Burk Telephone: 269-927-2268 Fax: 269-927-2310 E Mail: Updated 09/11/12 PURPOSE
SAMTRANS SERVICE PLAN
 Agenda Overview Part I: Key Findings Market Assessment Service Evaluation Part II: Service Development Framework Metrics Criteria Part III: Next Steps SAMTRANS SERVICE PLAN Preliminary Analysis and Criteria
SUB-REGIONAL PERFORMANCE MEASURES
 SUB-REGIONAL PERFORMANCE MEASURES 29 REPORT Overall regional performance is a function of five major areas: Service Coverage - monitors both how much service is available to people in the region (in terms
_VER1 CC_ PC_5000 FA_21500 C </CELL ><CELL> HO_ADJ 2015.P02 GL_6290 _VER1 GL_6010 PC_5000 FA_21500 C
 < EVDRE ID="Head count Roll Forward 001-00001"/>< EVDRE ID="BPC- CYB 004-00001"/>< EVDRE ID="BPC- CYB 001-00001"/>< EVDRE ID="BPC- CYF 004-00001"/>< EVDRE
APRIL 2016 BOARD INFORMATION PACKAGE
 APRIL 2016 BOARD INFORMATION PACKAGE MEMORANDUM TO: Members of the Airport Authority FROM: Lew Bleiweis, Executive Director DATE: April 8, 2016 Financial Report (document) Informational Reports: A. February,
PUBLIC NOTICE The Greater Boise Auditorium District will hold a Regular Board Meeting on Thursday, December 20, 2018 at 2 p.m. Boise Centre West Room
 PUBLIC NOTICE The Greater Boise Auditorium District will hold a Regular Board Meeting on Thursday, December 20, 2018 at 2 p.m. Boise Centre West Room 200 GREATER BOISE AUDITORIUM DISTRICT REGULAR BOARD
D_HO_V ER1 GL_ P03 GL_6030
 < EVDRE ID="BPC- CYB 001-00001"/>< EVDRE ID="BPC- CYF 004-00001"/>< EVDRE ID="BPC- CYF 001-00001"/>< C C_500377 6013-40.00000 00 6018-10.00000
BUSINESS BAROMETER December 2018
 Credit: Chris Orange BUSINESS BAROMETER December Credit: Nigel Moore 1 Contents Summary of findings 3 Annual monthly performance: visitor attractions..4 Visit Herts Team update 5 National context.8 Visitor
Cheatham County, TN. Hotel, Restaurant, and Travel Industries: Economic Profile and Business Trends, 2006
 Cheatham County, TN Cheatham County (Kingston Springs & Ashland City areas) Hotel, Restaurant, and Travel Industries: Economic Profile and Business Trends, Steve Morse, Ph.D. Director & Economist Tourism
SAS Group Q Teleconference
 SAS Group Q4 2012 Teleconference December 12, 2012 1 Break-even result in 2012 despite 1.6 bn SEK higher fuel cost 23 MSEK EBT (before non-recurring items) despite 1.6 bn SEK higher fuel cost Positive
AUGUST 2008 MONTHLY PASSENGER AND CARGO STATISTICS
 Inter-Office Memo Reno-Tahoe Airport Authority Date: October 2, 2008 To: Statistics Recipients From: Tom Medland, Director Air Service Business Development Subject: RENO-TAHOE INTERNATIONAL AIRPORT PASSENGER
Driving Ridership Strategic Partnerships
 Driving Ridership Strategic Partnerships Feb 29, 2012 Presented by Priya Bhasin-Singh, Strategic Marketing Associate priya.bhasin-singh@edmonton.ca 2012 APTA Marketing & Communications Conference About
Hertfordshire Business Barometer July 2018
 Hertfordshire Business Barometer July 1 Contents Summary of findings 3 Marketing update 4 Visitor Attractions: monthly performance 6 Serviced Accommodation: monthly performance 10 Other news: national
Aviation Operating Administration/Executive
 Aviation Operating Administration/Executive To provide the executive and administrative support necessary to the Divisions within the Aviation Department to ensure continued efficiencies, effectiveness,
Hertfordshire Business Barometer April 2018
 Hertfordshire Business Barometer April 1 Contents Summary of findings 3 Marketing update 4 Visitor Attractions: monthly performance 6 Serviced Accommodation: monthly performance 10 Other news: national
Regional Fare Change Overview. Nick Eull Senior Manager of Revenue Operations Metro Transit
 Regional Fare Change Overview Nick Eull Senior Manager of Revenue Operations Metro Transit Committee of the Whole April 5 th, 2017 Today s Presentation Fare change goals and considerations Public engagement
Rides Mass Transit District. Jackson County Mass Transit District. FY 2020 Program of Projects (POP) Carbondale UZA
 Carbondale UZA") Rides Mass Transit District Jackson County Mass Transit District FY 2020 Program of Projects (POP) Carbondale UZA General Rides Mass Transit District (RMTD) is the public transportation provider for the
Rides Mass Transit District Jackson County Mass Transit District FY 2020 Program of Projects (POP) Carbondale UZA General Rides Mass Transit District (RMTD) is the public transportation provider for the
U.S. DOMESTIC INDUSTRY OVERVIEW FOR MARCH
 Inter-Office Memo Reno-Tahoe Airport Authority Date: April 30, 2009 To: Statistics Recipients From: Krys T. Bart, A.A.E., President/CEO Subject: RENO-TAHOE INTERNATIONAL AIRPORT PASSENGER STATISTICS U.S.
Loudon County, TN. Hotel, Restaurant, and Travel Industries: Economic Profile and Business Trends, Loudon County (Loudon and Lenoir City areas)
") Loudon County, TN Loudon County (Loudon and Lenoir City areas) Hotel, Restaurant, and Travel Industries: Economic Profile and Business Trends, Steve Morse, Ph.D. Director & Economist Tourism Institute
Loudon County, TN Loudon County (Loudon and Lenoir City areas) Hotel, Restaurant, and Travel Industries: Economic Profile and Business Trends, Steve Morse, Ph.D. Director & Economist Tourism Institute
Management Presentation. March 2016
 Management Presentation March 2016 Forward looking statements This presentation as well as oral statements made by officers or directors of Allegiant Travel Company, its advisors and affiliates (collectively
STAYING TRUE. Scotia Capital Transportation & Aerospace Conference. November 15, 2011
 STAYING TRUE Scotia Capital Transportation & Aerospace Conference November 15, 2011 FORWARD-LOOKING STATEMENT Certain information in this presentation and statements made during this presentation, including
North Central Regional Transit District. Quick Facts. Our Mission Statement:
 North Central Regional Transit District Our Mission Statement: The mission of the North Central Regional Transit District is to provide safe, secure and effective public transportation within North Central
Maury County, TN. Hotel, Restaurant, and Travel Industries: Economic Profile and Business Trends, Maury County (Columbia and Spring Hill area)
") Maury County, TN Maury County (Columbia and Spring Hill area) Hotel, Restaurant, and Travel Industries: Economic Profile and Business Trends, 06 Steve Morse, Ph.D. Director & Economist Tourism Institute
Maury County, TN Maury County (Columbia and Spring Hill area) Hotel, Restaurant, and Travel Industries: Economic Profile and Business Trends, 06 Steve Morse, Ph.D. Director & Economist Tourism Institute
RTA ScoreCard December 2009
 Background and Context RTA ScoreCard December 2009 Chapter 25 of the Acts of 2009 modernized the transportation systems of the Commonwealth and created the new MassDOT. Section 6 of this law established
Montgomery Area Paratransit Guide
 Montgomery Area Paratransit Guide May 2016 Contents Welcome to the MAP Program... 3 Getting more information and assistance... 6 What to expect from MAP service.....7 MAP customer responsibilities...
Transit Peer Comparison
 Transit Peer Comparison October 2016 Based on data from the National Transit Database, US Department of Transportation and the US Census Peer Transit Communities, FY2014 Community County Population Source:
Manual vs. Automatic Operation and Operational Restrictions
 Customer Services, Operations, and Safety Committee Board Information Item IV-B March 11, 2010 Manual vs. Automatic Operation and Operational Restrictions Page 81 of 91 Washington Metropolitan Area Transit
RACINE COUNTY PUBLIC TRANSIT PLAN:
 RACINE COUNTY PUBLIC TRANSIT PLAN: 2013-2017 Recommended Transit Service Improvement Plan NEWSLETTER 3 SEPTEMBER 2013 This newsletter describes the final recommended public transit plan for the City of