MONTHLY REPORT JUNE 2017
|
|
|
- Giles Hodge
- 5 years ago
- Views:
Transcription

1 & MONTHLY REPORT JUNE 2017
2 SECTION Sun Tran & Sun Van Monthly Operations Report Table of Contents June 2017 PAGE I.System Highlights and Accomplishments 3-10 II.Sun Tran a.ridership 11 b.revenue 12 c.pass Sales 13 d.summary of Expenses 14 e.system Summary 15 f.annual Ridership 16 g.performance Indicators h.route Performance Profile 28 i.route Passenger Per Hour Ranking 29 j.customer Satisfaction 30 III.Sun Van a.ridership & Revenue Collection 31 b.summary of Expenses 32 c.system Summary d.annual Ridership 35 e.performance Indicators f.customer Satisfaction 42 IV.Glossaries
3 Sun Tran & Sun Van Strategic Goals Progress Update June 2017 In addition to highlighting major accomplishments and programs each month, this section communicates Sun Tran and Sun Van s ongoing efforts to achieve FY 2017 system goals and objectives. Provide Excellent Customer Service Sun Tran Customer Service Sun Tran s Customer Service Center answered 94 percent of the total number of calls received, a 1 percent decrease from the previous month and a 2 percent increase from the same time last year. Sun Tran experienced a 14 percent increase in compliments, when compared to the previous month. The number of complaints during the month increased by 17 percent when compared to the previous month and increased by 2 percent when compared to the same time last year. Customer Service Representatives met the established goal of answering at least 85 percent of total calls, keeping the average ring time at 14 seconds or less and keeping the calls at 90 seconds or less. These goals are to help ensure better service for the thousands of passengers who phone the call center. Sun Van Customer Calls Sun Van s Dispatch answered 86.9 percent of calls received during the month of June, a decrease of 0.8 percent from May 2017, and a 0.69 percent increase from June. They reached their goal in June. Reservations answered 96.4 percent of calls during the month of June and a decrease of.2 percent when compared to June. Spanish Reservations answered 94.7 percent of the calls received, a 0.9 percent decrease from May 2017 and a 1.5 percent decrease from June. 3
4 Sun Tran & Sun Van Strategic Goals Progress Update June 2017 The percentage of abandoned calls to Dispatch was 2.97 percent, Reservations abandoned calls were 1.9 percent, and Spanish Reservations abandoned calls were 2.4 percent, all reaching their goal of three percent or less. On-time performance for the month of June 2017 was approximately 94.6%, not reaching our goal 96%. Special Services Office Activity The Special Services staff assisted approximately 4,449 customers during the month of June. The daily average was 202 customers compared to 209 for the prior month of May The daily average for June was 187. Staff issued a total of 2,195 SunGO ID & Cards during the month of June 2017, compared to 2,392 issued in May 2017 and 2,335 issued in June (prior year). Specifically, the following numbers of cards were issued in June 2017: 1,531 low-income (474 replacement), 445 disabled (198 replacement), and 188 senior (86 replacement). Agents answered 3,109 calls on the English line or 86.6 percent calls answered, with 414 calls abandoned. The percent calls answered for English in June was higher than the prior month, and was higher by percent from June. We continue to monitor staffing needs to improve call statistics and decrease abandoned calls and wait times. Agents also answered 58 calls on the Spanish line with 96.7 percent calls answered with no calls abandoned. The percent calls answered for Spanish in June was lower than the prior month in May 2017, and same as June. Ensure an Efficient and Effective Operation Sun Tran Maintenance Goals A total of 144 preventative maintenance inspections of Sun Tran buses, 13 preventative maintenance inspections of support vehicles and 37 A/C inspections of buses were completed, all with 100 percent on-time performance. A total of 11 Quality Assurance Inspections were performed by Maintenance Managers and Supervisors. The active fleet for Garage 1 (South Yard) maintenance shop is 121 buses and the active fleet at Garage 2 (NW Facility) is 125 buses. The total active fleet for the month remains the same as the previous month at
5 Sun Tran & Sun Van Strategic Goals Progress Update June 2017 Warranty Goal For Fiscal Year 2017, the goal is to reduce cumulative un-recovered warranty by $74,649. The monthly goal is $6,221. Warranty recovered during the month of June was $15,465. The cumulative warranty recovered through June was $94,263, which meets the cumulative goal. The cumulative FY17 goal was met. Workforce Compliance On 6/14, Negotiations were started with the Teamsters Local 104. On 6/12, a New Hire orientation class was held at Sun Van for eight Van Operators. On 6/27, a New Hire Orientation class of five Coach Operators was conducted at Sun Tran. Employee and Labor Relations On 6/5, Annual Open Enrollment started at Sun Tran and Sun Van, including Bargaining Unit Employees at Sun Van. On 6/16, the Annual Open Enrollment closed for Sun Tran and Sun Van employees. On 6/22, a retirement party was held for Minnie Monje at Sun Tran for 43 years of service. On 6/29, a retirement party was held for Gilbert Gherna at Sun Tran for 33 years of service. Cost Saving Measures & Efficient Facilities During the month of June, Sun Tran s Northwest Facility produced 14,810 kwh of electricity from the solar panels. This provides a cost avoidance of approximately $1,481 for the electricity generated and a Tucson Electric Power solar credit reimbursement to the City of Tucson s Department of Transportation of $2,370. Transit Task Force (TTF) There was one Transit Task Force meeting. Sun Tran presented information about the hours of operation at the Special Services Office. 5
6 Improve Safety and Security Sun Tran & Sun Van Strategic Goals Progress Update June 2017 The safety and security of all employees remains a major priority for Sun Tran. Trainings Sun Tran promoted eight new hire operators into full-time permanent positions during June. We welcomed five more operators who began their Orientation on Tuesday, June 27. This group is currently receiving classroom instruction and participating in behind-the-wheel training. If they continue to do well, then they will transition to route training on July 13. Sun Van welcomed nine new hire operators during June. Like their Sun Tran counterparts, they are receiving classroom instruction and participating in behind-the-wheel training. New Bus Stop Signs Advision has completed the installation of over 2,100 new bus stop signs to replace outdated older Sun Logo bus stop signs on the entire system. This project improves the image of Sun Tran for the passengers and the public. The new signs include the bus stop number and routes served which assist passengers to do online trip planning on a mobile device. Sun Van took delivery of the remaining 15 of 19 Glaval Paratransit Mini Buses in the month of June. These buses replace buses that have outlived their useful service life. Increase Ridership Sun Tran Ridership Passenger ridership for June totaled 1,177,286. This is a decrease of 153,220 or 11.5 percent when compared with the prior year and is under the budgeted level by 274,584 or 18.9 percent. Daily ridership shows an decrease when compared to the same time period last year. 6
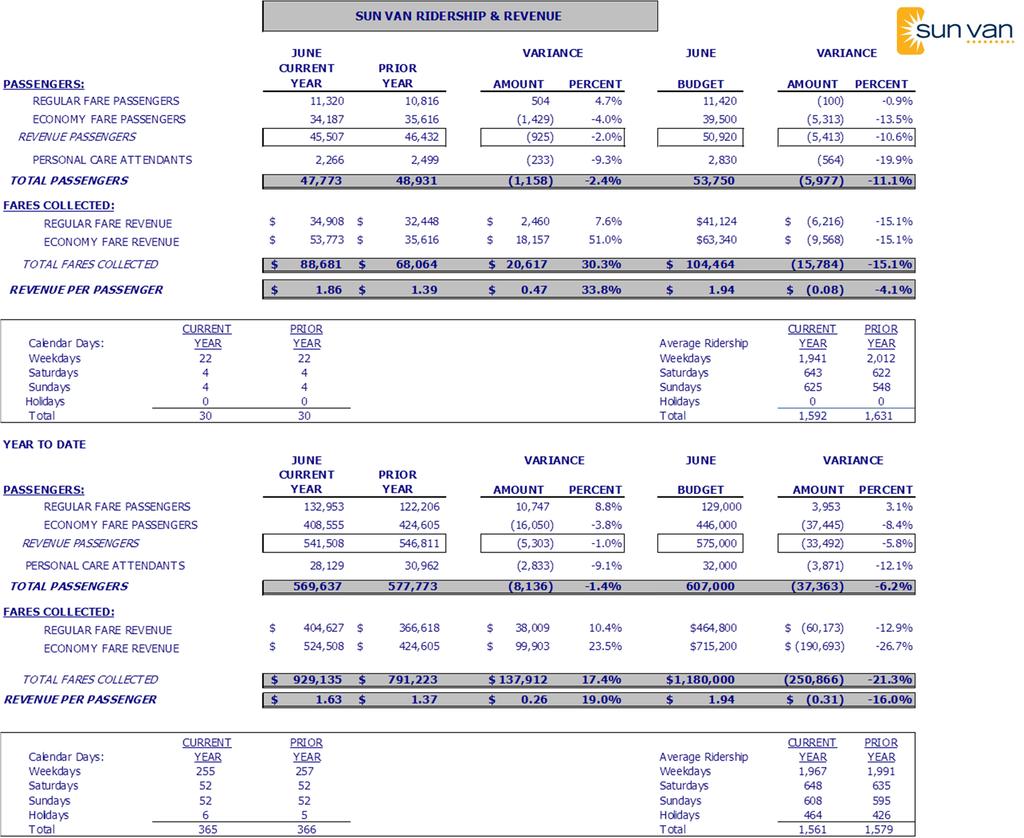
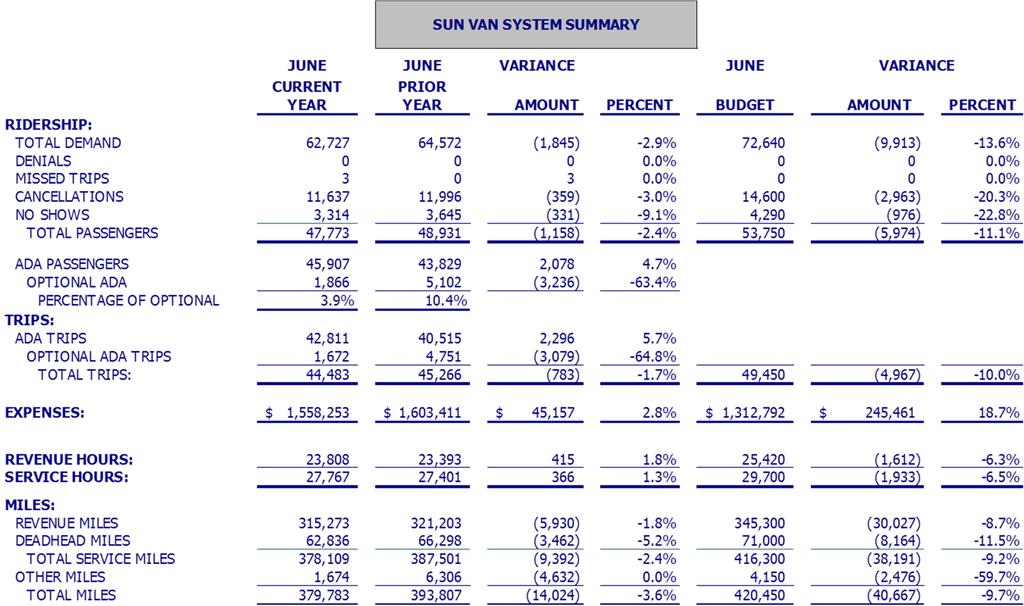
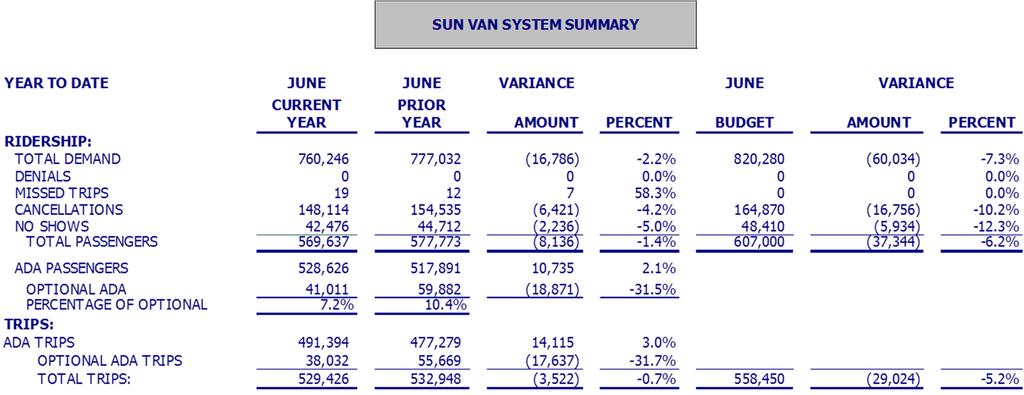
7 Sun Tran & Sun Van Strategic Goals Progress Update June 2017 June Year-to-Date (YTD) passenger ridership was 16,388,315. This is an increase of 644,814 or 4.1 percent when compared with the prior year and is under the budgeted level by 2,092,505 or 11.3 percent. Passenger revenue for June was $697,048. This is a decrease of $82,268 or 10.6 percent when compared to last fiscal year. Also, passenger revenue is below the budgeted level by $132,332 or 16 percent. Revenue per passenger boarding in June was the same as last year s $.59 cents. The overall farebox recovery ratio for June is 13.1 percent, while YTD, is 19.3 percent. Sun Van Ridership Sun Van ridership for June totaled 47, 773. This is a decrease of 1,158 or 2.4 percent when compared to June. Revenue passengers, excluding Personal Care Attendants (PCA) decreased by 925 passengers or 2 percent. Total passenger ridership year to date is 569,637. This is a decrease of 8,136 or 1.4 percent when compared to last fiscal year. Revenue passengers, excluding Personal Care Attendants (PCA), decreased by 5,303 passengers or 1 percent. Sun Link Staff from Sun Tran met with Sun Link and TDOT staff in communications planning meetings focusing on issues such as notification text procedures, 3rd Anniversary and Free-Ride Day, event calendar, summer district events, what to cover in Sun Link Stakeholders Marketing Meeting, and the 3 millionth rider. Sun Tran staff worked to prepare for Sun Link s 3rd Anniversary. On July 22, Sun Link will celebrate its 3rd Anniversary with a Free Ride Day and a concert by Jimmy Carr and the Awkward Moments on-board Sun Link and at Main Gate Square, along with other festivities. 7
8 Sun Tran & Sun Van Strategic Goals Progress Update June 2017 Sun Tran staff completed applications for sponsorship, and received funding for, Sun Link 3rd Anniversary of Sun Link and Free-Ride Day - TEP and TMC (HealthOn Broadway) for $2,500 each. The funds will be used to pay for the Free-Ride Day on July 22. Staff gathered information from all groups related to the 3rd Anniversary and Free-Ride Day to develop promotional materials including posters, fliers and press releases. Staff met with representatives of Wildcats Hockey Team, Roadrunners, Main Gate Square and Downtown Tucson Partnership to move forward on marketing Sun Link and the districts. Staff coordinated and led meeting of marketing and communications staff from Downtown Tucson Partnership, Main Gate Square, University of Arizona, City of Tucson and Sun Tran focusing on moving forward with marketing and communications for Sun Link and the five districts. Marketing campaigns related to Sun Tran ridership Photoshoot for Sun Tran riders: The purpose of the photoshoot was to acquire multiple images of year olds using Sun Tran for their work commute, to be used in subsequent ridership campaigns. New Transit Services Management contract: Sun Tran staff developed internal and external communications related to change in Transit Services Management contract. Ride Guide for August 2017: Sun Tran staff created, reviewed for accuracy, and sent to print new Ride Guide for August 2017 to February 2018, including new cover, ads, information, instructions, schedules, maps, etc. Dump the Pump: Staff sent out media release, slider of website and social media regarding Dump the Pump day. Sent out Why Commute by Transit e-blast to all Get on Board organizations and Travel Reduction Program employers regarding Dump the Pump Day. Labor Negotiations: Staff sent Media Release, e-blast to all Pass Provider Organizations and Sales Outlets, placed posts on the Sun Tran website and social media, and printed and posted posters to communicate to the public that the 2015 labor contract between Sun Tran and Teamsters was ending and the labor negotiations for a new contract were ongoing. 8
9 Sun Tran & Sun Van Strategic Goals Progress Update June 2017 Staff developed drafts of all internal and external communications for each of the following scenarios: (1) no extension, workers continuing without an extension; (2) extension, workers continuing, strike possible; (3) no agreement, strike announcement; (4) contract signed, normal scheduling resumes. For each scenario, Marketing drafted a press release, web posts, social media posts, e-blasts to all organizations in the Pass Provider Program and Sales Outlets, scripts for Customer Service, a new recording for the Front-End Message, a slide for the Transit Center monitors, posters and talking points for the media. Accessibility: Sun Tran staff met with Wesley Derbyshire of the visually impaired community in Tucson to review the accessibility of the Sun Tran website, Sun Tran app and the automatic announcements on the bus. New Pass products: Sun Tran staff participated in the planning related to the upcoming 3-Day Pass and Bulk Pass discounts. SunGO Cards: Because the SunGO system is now four years old, Sun Tran staff sent e-blasts to all Get on Board organizations regarding the expiration of SunGO Cards distributed at the onset of the system. Community Outreach Sun Tran staff attended 9 University of Arizona New Student Orientations in June. There were roughly 200 people in attendance each orientation. There are 4 more that will take place in August. Three START Mobility Trainings took place in June. A total of 83 Seniors or people with disabilities were trained how to ride the bus. The Senior Companion Program through the Pima Council on Aging had 39 Senior Volunteers attend their START Training. The director of the program said that 39 were trained and that those 39 will train all 240 people in the Senior Companion Program. Online Passenger Tools Sun Tran s Facebook page had 1,056 page views. SunTran s most popular post was about the Labor Negotiations on June 30. The post reached over 2,000 people. It was shared 193 times. 9
10 Sun Tran & Sun Van Strategic Goals Progress Update June 2017 The average number of people reached per post is 533, so the reach on this post was dramatically higher than normal. Sun Tran s Twitter audience is 1,748 followers which is a 2% increase than when compared to the previous month, and a 5 percent increase when compared to the same time last year. Sun Tran s Twitter page had 25.4 thousand impressions, an increase of 0.9 percent when compared to the previous month. The top tweet was a Labor Negotiations update. Sun Tran s website had 118,532 page views, a decrease of 6.35 percent when compared to the previous month. The website had a total of 93,723 unique visitors. The period of time a user is actively engaged with the website is one minute and 3 minutes 29 seconds, which is a large increase in time spent on website from last month. In June, 79 percent of sessions were from a mobile device (61,380) and 71,688 users used the routes and times page. The Routes & Times page continues to be the most popular page on the Sun Tran website. There were 33,218 new sessions in June. GoTucson Mobile App The number of individuals utilizing the GoTucson mobile app to ride transit throughout the community was 3,982 compared to 4,634 in May The GO Tucson mobile app has continued to be promoted at START sessions, community events, social media and online. Information to SunGO Sales Outlets Posters for the $25 for $20 promotion were created and distributed to all the Sales Outlets prior to the program starting on June 1, E-Blasts were sent as well to all Sales Outlets, announcing the change. 10
 -4.7% 611,380 (107,834) -17.6% EXPRESS FARE 16,366 19,007 (2,641) -13.9% 18,320 (1,954) -10.7% DAY PASS 80,622 84,955 (4,333) -5.1% 9,300 71,322 766.")
11 SUN TRAN RIDERSHIP JUNE VARIANCE JUNE VARIANCE ROUTE PASSENGERS: CURRENT YEAR PRIOR YEAR AMOUNT PERCENT BUDGET AMOUNT PERCENT FULL FARE 299, ,123 (55,298) -15.6% 447,260 (147,435) -33.0% ECONOMY FARE 503, ,540 (24,994) -4.7% 611,380 (107,834) -17.6% EXPRESS FARE 16,366 19,007 (2,641) -13.9% 18,320 (1,954) -10.7% DAY PASS 80,622 84,955 (4,333) -5.1% 9,300 71, % OTHER 59,508 68,142 (8,634) -12.7% 60,870 (1,362) -2.2% ROUTE REVENUE PASSENGERS 959,867 1,055,767 (95,900) -9.1% 1,147,130 (187,263) -16.3% TRANSFER PASSENGERS 194, ,071 (54,004) -21.8% 270,830 (76,763) -28.3% CHILDREN =<5 22,617 25,879 (3,262) -12.6% 33,140 (10,523) -31.8% PCA (54) -6.8% 770 (35) -4.5% FREE RIDE DAY % % OTHER ROUTE PASSENGERS 217, ,739 (57,320) -20.9% 304,740 (87,321) -28.7% TOTAL PASSENGERS 1,177,286 1,330,506 (153,220) -11.5% 1,451,870 (274,584) -18.9% 1,177,286 1,330,506 (153,220) (1,451,870) (274,584) CURRENT YEAR PRIOR YEAR CURRENT YEAR Calendar Days School Days Average Route Ridership CURRENT PRIOR Weekdays YEAR YEAR Weekdays 46,549 52,582 Saturdays Saturday 22,676 25,826 Sundays 4 4 Sunday 15,628 17,601 Holidays 0 0 Holidays 0 0 Total Total 39,243 44,350 YEAR TO DATE JUNE VARIANCE JUNE VARIANCE ROUTE PASSENGERS: CURRENT YEAR PRIOR YEAR AMOUNT PERCENT BUDGET AMOUNT PERCENT FULL FARE 4,544,127 4,437, , % 5,665,330 (1,121,203) -19.8% ECONOMY FARE 6,673,591 6,184, , % 7,403,200 (729,609) -9.9% EXPRESS FARE 211, ,336 9, % 288,630 (76,775) -26.6% DAY PASS 988, , , % 395, , % OTHER 839, ,572 72, % 899,910 (60,744) -6.8% ROUTE REVENUE PASSENGERS 13,257,374 12,472, , % 14,652,320 (1,394,946) -9.5% TRANSFER PASSENGERS 2,768,275 2,915,957 (147,682) -5.1% 3,376,180 (607,905) -18.0% CHILDREN =<5 353, ,027 6, % 444,660 (90,945) -20.5% PCA 8,951 8, % 7,660 1, % FREE RIDE DAY % 0 0.0% OTHER ROUTE PASSENGERS 3,130,941 3,271,412 (140,471) -4.3% 3,828,500 (697,559) -18.2% TOTAL PASSENGERS 16,388,315 15,743, , % 18,480,820 (2,092,505) -11.3% 16,388,315 15,743, ,814 18,480,820 (2,092,505) Calendar Days CURRENT YEAR PRIOR YEAR School Days Average Route Ridership CURRENT YEAR Weekdays CURRENT YEAR PRIOR YEAR Weekdays 54,959 52,446 Saturdays Saturday 25,869 26,209 Sundays Sunday 17,565 18,850 Holidays 6 4 Holidays 19,190 15,270 Total Total 44,899 44,099 PRIOR YEAR PRIOR YEAR Notes: A correction was made to the reported FY17 Q1 Ridership Budget in FY17 Q2 subsequent to publication. The YTD budget was updated accordingly. FY16 strike ridership was 226,526 for August and 277,338 for September for a total of 503,864 passengers. Due to the strike, August had 3 less Saturdays and 4 less Sundays, while September had 2 less Sundays. 11
12 SUN TRAN REVENUE JUNE VARIANCE JUNE VARIANCE CURRENT YEAR PRIOR YEAR AMOUNT PERCENT BUDGET AMOUNT PERCENT ROUTE PASSENGER REVENUE: FULL FARE $ 385,622 $ 488,917 $ (103,295) -21.1% $ 537,210 $ (151,588) -28.2% ECONOMY FARE $ 186, ,900 26, % 152,330 34, % EXPRESS FARE $ 28,914 31,464 (2,550) -8.1% 34,160 (5,246) -15.4% DAY PASS $ 52,236 46,340 5, % 47,260 4, % OTHER $ 43,604 52,696 (9,092) -17.3% 58,420 (14,816) -25.4% TOTAL ROUTE PASSENGER REVENUE $ 697,048 $ 779,317 $ (82,268) -10.6% $ 829,380 $ (132,332) -16.0% $ 697,048 $779,317 $ 829,380 $ 0 YEAR TO DATE JUNE VARIANCE JUNE VARIANCE CURRENT YEAR PRIOR YEAR AMOUNT PERCENT BUDGET AMOUNT PERCENT ROUTE PASSENGER REVENUE: FULL FARE $ 6,731,519 $ 6,084, , % $ 6,962,040 $ (230,521) -3.3% ECONOMY FARE 2,283,828 1,686, , % 1,924, , % EXPRESS FARE 444, ,886 80, % 416,040 28, % DAY PASS 587, ,355 89, % 448, , % OTHER 664, ,705 43, % 669,710 (4,846) -0.7% TOTAL ROUTE PASSENGER REVENUE $ 10,712,521 $ 9,254,985 1,457, % $ 10,421,030 $ 291, % $ 10,712,521 $ 9,254,985 1,457,536 $ 10,421,030 Notes: A correction was made to the reported FY17 Q1 Revenue Budget in FY17 Q2 subsequent to publication. The YTD budget was updated accordingly. Adjustments may impact year-to-date revenue actuals due to the application of credits to sales from a prior month. FY17 A fare change took effect on January 3,2017 FY16 August cash revenue was $205,603 due to the strike FY16 September cash revenue was $312,202 due to the strike YTD pass revenue has been reduced by $233,054 for Sun Link's YTD Fiscal Year 2017 revenue share 233,054 YTD pass revenue has been reduced by $33,146 for Sun Shuttle's YTD Fiscal Year 2017 revenue share 33,146 12
13 SUN TRAN PASSES SOLD AND PASS REVENUE PASSES SOLD PASS REVENUE JUNE VARIANCE JUNE VARIANCE CURRENT PRIOR AMOUNT PERCENT CURRENT PRIOR AMOUNT PERCENT MONTHLY 8450 DAY PASS 4,682 5,415 (733) -13.5% 17,558 18,953 ($1,395) -7.4% 8459 DISCOUNTED DAY PASS 17,339 15,650 1, % 34,678 27,388 $7, % 8450 FULL FARE 7 DAY % 0 0 $0 0.0% 8450 FULL FARE MONTHLY 2,097 3,142 (1,045) -33.3% 90, ,373 (35,500) -28.1% 8451 ECONOMY MONTHLY 6,476 6,734 (258) -3.8% 114,556 99,178 15, % 8452 EXPRESS MONTHLY (69) -14.3% 23,909 25,865 (1,956) -7.6% 8455 ANNUAL % 2,130 0 $2, % 8453 COLLEGE PASS % 0 0 $0 0.0% 8453 COLLEGE PASS EXPRESS % 0 0 $0 0.0% 8454 SUMMERGO YOUTH PASS (594) 174 (768) % (25,039) 7,390 ($32,429) % SUBTOTAL: 30,420 31,599 (1,179) -3.7% $ 258,665 $ 305,147 $ (46,481) -15.2% STORED VALUE 8450 FULL FARE STORED VALUE 23,949 8,372 15, % 35,924 12,558 23, % 8451 ECONOMY STORED VALUE 35,452 39,290 (3,838) -9.8% 21,271 19,645 1, % 8452 EXPRESS STORED VALUE 1,150 1,169 (19) -1.6% 2,588 6,079 (3,491) -57.4% SUBTOTAL: 60,551 48,831 11, % $ 59,782 $ 38,282 $ 21, % TOTAM 90,971 80,430 10, % $ 318,448 $ 343,428 $ (24,981) -7.3% , ,428 (24,981) YEAR TO DATE PASSES SOLD PASS REVENUE JUNE VARIANCE JUNE VARIANCE CURRENT PRIOR AMOUNT PERCENT CURRENT PRIOR AMOUNT PERCENT MONTHLY 8450 DAY PASS 58,896 49,459 9, % 214, ,107 40, % 8459 DISCOUNTED DAY PASS 200, ,856 14, % 373, ,248 48, % 8450 FULL FARE 7 DAY (220) -97.3% 59 2,868 (2,809) -97.9% 8450 FULL FARE MONTHLY 41,768 33,793 7, % 1,762,360 1,369, , % 8451 ECONOMY MONTHLY 85,563 67,318 18, % 1,381, , , % 8452 EXPRESS MONTHLY 5,522 4, % 306, ,962 62, % 8455 ANNUAL 7 20 (13) -65.0% 14,519 13, % 8453 COLLEGE PASS 3,082 3, % 534, , , % 8453 COLLEGE PASS EXPRESS (23) -9.5% 68,539 55,276 13, % 8454 SUMMERGO YOUTH PASS 1,050 1,297 (247) -19.0% 41,030 30,147 10, % SUBTOTAL: 396, ,891 50, % $ 4,697,603 $ 3,520,853 $ 1,176, % STORED VALUE 8263 FULL FARE STORED VALUE 266, , , % 405, , , % 8450 ECONOMY STORED VALUE 579, , , % 312, , , % 8452 EXPRESS STORED VALUE 13,098 13,694 (596) -4.4% 27,894 31,129 (3,235) -10.4% SUBTOTAL: 858, , , % $ 746,092 $ 384,219 $ 361, % TOTAL 1,254, , , % $ 5,443,695 $ 3,905,072 $ 1,538, % ,443,695 3,905,072 1,538,624 Note: FY17 A fare change took effect on January 3,2017 FY16 August cash revenue was $205,226 due to the strike FY16 September cash revenue was $312,202 due to the strike FY16 Actuals were adjusted after June MOR was published YTD pass revenue has been reduced by $233,054 for Sun Link's YTD Fiscal Year 2017 revenue share 233,054 YTD pass revenue has been reduced by $33,146 for Sun Shuttle's YTD Fiscal Year 2017 revenue share 33,146 13
14 SUMMARY OF EXPENSES JUNE JUNE VARIANCE MONTHLY VARIANCE CURRENT PRIOR YEAR YEAR AMOUNT PERCENT BUDGET AMOUNT PERCENT OPERATOR WAGES $ 1,468,887 $ 1,405,476 $ (63,411) -4.3% $ 1,417,023 $ (51,864) -3.7% MAINTENANCE WAGES $ 390, ,998 (19,284) -4.9% 402,108 11, % SALARIES $ 374, ,781 (35,699) -9.5% 370,938 (3,542) -1.0% FRINGE BENEFITS $ 1,357,388 1,080,070 (277,318) -20.4% 1,004,448 (352,940) -35.1% SERVICES $ 477, ,248 24, % 451,500 (25,730) -5.7% UTILITIES $ 63,821 62,156 (1,665) -2.6% 69,532 5, % VEHICLE MAINTENANCE $ 583, , , % 409,769 (174,010) -42.5% MATERIALS AND SUPPLIES $ 25, , , % 119,950 93, % CNG FUEL $ 46,706 94,675 47, % 60,183 13, % DIESEL FUEL $ 367, ,695 (78,042) -21.2% 436,717 68, % UNLEADED FUEL $ - 7,640 7, % 7,458 7, % CAPITAL OUTLAY $ 12, , , % 22,822 10, % INSURANCE $ 160, ,411 66, % 160, % LABOR CREDITS/EXP TRANSFERS $ (13,508) (22,713) (9,205) 68.1% (14,492) (984) 6.8% TOTAL EXPENSES $ 5,315,048 $ 5,422,922 $ 107, % $ 4,918,394 $ (396,654) -8.1% JUNE JUNE YEAR TO DATE CURRENT PRIOR VARIANCE ANNUAL BUDGET BALANCE YEAR YEAR AMOUNT PERCENT BUDGET AMOUNT PERCENT OPERATOR WAGES $ 17,044,097 $ 16,539,029 $ (505,068) -3.0% $ 17,004,280 $ (39,817) -0.2% MAINTENANCE WAGES $ 4,687,385 4,663,623 (23,762) -0.5% 4,825, , % SALARIES $ 4,229,758 4,227,126 (2,632) -0.1% 4,451, , % FRINGE BENEFITS $ 12,365,396 11,765,931 (599,465) -4.8% 12,053,380 (312,016) -2.6% SERVICES $ 4,898,402 5,370, , % 5,418, , % UTILITIES $ 802, ,300 (2,917) -0.4% 834,380 32, % VEHICLE MAINTENANCE $ 4,218,922 4,783, , % 4,917, , % MATERIALS AND SUPPLIES $ 1,105,733 1,078,373 (27,360) -2.5% 1,439, , % CNG FUEL $ 570, ,861 52, % 722, , % DIESEL FUEL $ 3,856,879 3,138,939 (717,940) -18.6% 5,240,600 1,383, % UNLEADED FUEL $ 91,483 78,890 (12,593) -13.8% 89,500 (1,983) -2.2% CAPITAL OUTLAY $ 263, ,327 (1,905) -0.7% 273,860 10, % INSURANCE $ 1,920,288 1,826,419 (93,869) -4.9% 1,925,250 4, % LABOR CREDITS/EXP TRANSFERS $ (87,626) (148,263) (60,637) 69.2% (173,900) (86,274) 49.6% TOTAL EXPENSES $ 55,966,895 $ 55,008,006 $ (958,889) -1.7% $ 59,020,730 $ 3,053, % There were two events in April which impacted the YTD totals: 1) $117,000 in expenses were included in April MTD but excluded from April YTD 2) $61, in Pcard expenses were posted after April was final and were not included in April MTD or YTD 14
15 SUN TRAN SYSTEM SUMMARY JUNE VARIANCE JUNE VARIANCE CURRENT YEAR PRIOR YEAR AMOUNT PERCENT BUDGET AMOUNT PERCENT RIDERSHIP: TOTAL ROUTE PASSENGERS 1,177,286 1,330,506 (153,220) -11.5% 1,451,870 (274,584) -18.9% REVENUE: TOTAL ROUTE PASSENGER REVENUE $ 697,048 $ 779,317 $ (82,269) -10.6% 829,380 (132,332) -16.0% EXPENSES: TOTAL EXPENSES $ 5,315,048 $ 5,682,469 $ 367, % $ 4,918,394 $ (396,654) -8.1% MILES: REVENUE MILES 706, ,120 7, % 686,920 (19,451) -2.8% DEADHEAD MILES 102, , % 102,010 (858) -0.8% TOTAL SERVICE MILES 809, ,060 8, % 788,930 (20,308) -2.6% NON-ROUTE MILES 7,394 (7,182) 14, % 7,060 (334) -4.7% TOTAL MILES 816, ,878 22, % 795,990 (20,642) -2.6% REVENUE HOURS 59,616 56,622 2, % 57,200 (2,416) -4.2% SERVICE HOURS 63,880 60,790 3, % 61,469 (2,412) -3.9% YEAR TO DATE JUNE VARIANCE JUNE VARIANCE CURRENT YEAR PRIOR YEAR AMOUNT PERCENT BUDGET AMOUNT PERCENT RIDERSHIP: TOTAL ROUTE PASSENGERS 16,388,315 15,743, , % 18,480,820 (2,092,505) -11.3% REVENUE: TOTAL ROUTE PASSENGER REVENUE $ 10,712,521 $ 9,254,985 $ 1,457, % $ 10,421,030 $ 291, % EXPENSES: TOTAL EXPENSES $ 55,411,020 $ 100,199,883 $ 44,788, % $ 54,006,695 $ (1,404,325) -2.6% MILES: REVENUE MILES 8,233,238 7,399, , % 8,180,680 (52,558) -0.6% DEADHEAD MILES 1,191,655 1,090, , % 1,212,210 20, % TOTAL SERVICE MILES 9,424,893 8,490, , % 9,392,890 (32,003) -0.3% NON-ROUTE MILES 132,339 59,945 72, % 102,110 (30,229) -29.6% TOTAL MILES 9,557,232 8,550,042 1,007, % 9,495,000 (62,232) -0.7% REVENUE HOURS 683, ,187 80, % 680,564 (2,819) -0.4% SERVICE HOURS 733, ,407 84, % 731,035 (2,446) -0.3% Notes: FY16 August 569,919 miles and 44,210 hours were not run due to the strike. FY16 September 316,251 miles and 24,490 hours were not run due to the strike 15
16 SUN TRAN ANNUAL RIDERSHIP CURRENT YEAR JULY AUGUST SEPTEMBER OCTOBER NOVEMBER DECEMBER JANUARY 2017 FEBRUARY 2017 MARCH 2017 APRIL 2017 MAY 2017 JUNE 2017 ANNUAL FY 2017 FIXED ROUTE 1,253,631 1,481,755 1,435,650 1,461,241 1,406,411 1,364,200 1,342,742 1,316,095 1,411,833 1,274,755 1,298,352 1,162,869 16,209,534 EXPRESS 14,243 17,613 16,039 15,675 14,410 12,194 15,167 14,365 15,811 14,041 14,806 14, ,781 TOTAL 1,267,874 1,499,368 1,451,689 1,476,916 1,420,821 1,376,394 1,357,909 1,330,460 1,427,644 1,288,796 1,313,158 1,177,286 16,388,315 PREVIOUS YEAR JULY 2015 AUGUST 2015 SEPTEMBER 2015 OCTOBER 2015 NOVEMBER 2015 DECEMBER 2015 JANUARY FEBRUARY MARCH APRIL MAY JUNE ANNUAL FY FIXED ROUTE 1,483, , ,521 1,463,092 1,382,187 1,408,333 1,392,150 1,470,999 1,476,392 1,452,963 1,417,091 1,314,118 15,569,436 EXPRESS 18,164 2,794 7,249 17,895 14,683 14,080 15,893 16,455 17,147 16,822 16,495 16, ,065 TOTAL 1,502, , ,770 1,480,987 1,396,870 1,422,413 1,408,043 1,487,454 1,493,539 1,469,785 1,433,586 1,330,506 15,743,501 VARIANCE JULY AUGUST SEPTEMBER OCTOBER NOVEMBER DECEMBER JANUARY FEBRUARY MARCH APRIL MAY JUNE YEAR-TO- DATE FIXED ROUTE (230,300) 965, ,129 (1,851) 24,224 (44,133) (49,408) (154,904) (64,559) (178,208) (118,739) (151,249) 640,098 EXPRESS (3,921) 14,819 8,790 (2,220) (273) (1,886) (726) (2,090) (1,336) (2,781) (1,689) (1,971) 4,716 TOTAL (234,221) 979, ,919 (4,071) 23,951 (46,019) (50,134) (156,994) (65,895) (180,989) (120,428) (153,220) 644,814 % VARIANCE JULY AUGUST SEPTEMBER OCTOBER NOVEMBER DECEMBER JANUARY FEBRUARY MARCH APRIL MAY JUNE YEAR-TO- DATE FIXED ROUTE -15.5% 186.8% 81.4% -0.1% 1.8% -3.1% -3.5% -10.5% -4.4% -12.3% -8.4% -11.5% 4.1% EXPRESS -21.6% 530.4% 121.3% -12.4% -1.9% -13.4% -4.6% -12.7% -7.8% -16.5% -10.2% -12.0% 2.7% TOTAL -15.6% 188.6% 81.7% -0.3% 1.7% -3.2% -3.6% -10.6% -4.4% -12.3% -8.4% -11.5% 4.1% TOTALS BY: JULY AUGUST SEPTEMBER OCTOBER NOVEMBER DECEMBER JANUARY 2017 FEBRUARY 2017 MARCH 2017 APRIL 2017 MAY 2017 JUNE 2017 ANNUAL FY 2017 WEEKDAY 1,025,690 1,315,701 1,245,634 1,239,989 1,224,133 1,159,044 1,153,986 1,154,723 1,252,197 1,082,881 1,136,578 1,024,068 14,014,625 SATURDAY 133, , , , , ,484 98, , , ,644 94,627 90,705 1,345,194 SUNDAY 91,385 74,643 74,532 96,237 75,351 66,316 81,481 70,712 71,843 83,271 65,074 62, ,358 HOLIDAY 17, , ,026 23,550 23, , ,138 TOTAL 1,267,874 1,499,368 1,451,689 1,476,916 1,420,821 1,376,394 1,357,909 1,330,460 1,427,644 1,288,796 1,313,158 1,177,286 16,388,315 AVERAGES BY: JULY AUGUST SEPTEMBER OCTOBER NOVEMBER DECEMBER JANUARY 2017 FEBRUARY 2017 MARCH 2017 APRIL 2017 MAY 2017 JUNE 2017 ANNUAL FY 2017 WEEKDAY 51,285 57,204 59,316 59,047 58,292 55,193 54,952 57,736 54,443 54,144 51,663 46, ,823 SATURDAY 26,665 27,256 28,028 28,138 26,828 25,497 24,661 26,256 25,901 24,529 23,657 22, ,091 SUNDAY 18,277 18,661 18,633 19,247 18,838 16,579 16,296 17,678 17,961 16,654 16,268 15, ,721 HOLIDAY 17, , ,026 23,550 23,800 16, ,138 TOTAL 40,899 48,367 48,390 47,642 47,361 44,400 43,804 47,516 46,053 42,960 42,360 39, ,994 NOTES: 1) There were changes in the number of calendar days for the current year and prior year. The data is not adjusted for the same day comparison. 16
17 SUN TRAN PERFORMANCE INDICATORS JUNE 2017 SYSTEM INDICATOR CURRENT MONTH BUDGET AVG YTD 1. RIDERSHIP 1,177,286 1,380,810 1,382, PASSENGER REVENUE $ 697,048 $ 829,380 $ 910, PASSENGER PER TOTAL MILE PASSENGER PER HOUR REVENUE PER PASSENGER $ REVENUE PER TOTAL MILE $ 0.86 $ 1.23 $ REVENUE PER HOUR $ $ $ FAREBOX RECOVERY RATIO 13.1% 19.9% 19.3% 9. TOTAL COST PER PASSENGER $ 4.51 $ 3.19 $ TOTAL COST PER MILE $ 6.51 $ 6.20 $ TOTAL COST PER SERVICE HOUR $ $ $ MILES BETWEEN ROAD CALLS 10,745 8,200 13, MILES BETWEEN BUS INSPECTION 5,861 6,300 5, TOTAL VEHICLE ACCIDENTS PER 100,000 MILES TOTAL COMPLAINTS PER 100,000 PASSENGER VEHICLES OPERATED IN MAXIMUM SERVICE
18 FY 16 FY 17 Budget Sun Tran Performance Indicators Fiscal Year 2017 Ridership (in millions) Passenger Revenue (in 100 thousands) Jul Aug Sep Oct Nov Dec Jan Feb Mar Apr May Jun 0 Jul Aug Sep Oct Nov Dec Jan Feb Mar Apr May Jun Indicators are impacted by the FY16 Strike which occurred from 8/6/15 through 9/16/15 18
19 FY 16 FY 17 Budget Sun Tran Performance Indicators Fiscal Year 2017 Passengers per Total Mile Passengers per Hour Jul Aug Sep Oct Nov Dec Jan Feb Mar Apr May Jun 0 Jul Aug Sep Oct Nov Dec Jan Feb Mar Apr May Jun Indicators are impacted by the FY16 Strike which occurred from 8/6/15 through 9/16/15 19
20 FY 16 FY 17 Budget Sun Tran Performance Indicators Fiscal Year 2017 Revenue per Passenger Revenue per Total Mile Jul Aug Sep Oct Nov Dec Jan Feb Mar Apr May Jun 0 Jul Aug Sep Oct Nov Dec Jan Feb Mar Apr May Jun Indicators are impacted by the FY16 Strike which occurred from 8/6/15 through 9/16/15 20
21 FY 16 FY 17 Budget Sun Tran Performance Indicators Fiscal Year 2017 Revenue per Hour Farebox Recovery Ratio Jul Aug Sep Oct Nov Dec Jan Feb Mar Apr May Jun 0 Jul Aug Sep Oct Nov Dec Jan Feb Mar Apr May Jun Indicators are impacted by the FY16 Strike which occurred from 8/6/15 through 9/16/15 21
22 FY 16 FY 17 Budget Sun Tran Performance Indicators Fiscal Year 2017 Total Cost per Passenger Total Cost per Mile Jul Aug Sep Oct Nov Dec Jan Feb Mar Apr May Jun Jul Aug Sep Oct Nov Dec Jan Feb Mar Apr May Jun 0 Jul Aug Sep Oct Nov Dec Jan Feb Mar Apr May Jun Indicators are impacted by the FY16 Strike which occurred from 8/6/15 through 9/16/15 22
23 FY 16 FY 17 Budget Sun Tran Performance Indicators Fiscal Year 2017 Total Cost per Mile Total Cost per Service Hour Jul Aug Sep Oct Nov Dec Jan Feb Mar Apr May Jun 0 Jul Aug Sep Oct Nov Dec Jan Feb Mar Apr May Jun Indicators are impacted by the FY16 Strike which occurred from 8/6/15 through 9/16/15 23
24 FY 16 FY 17 Budget Sun Tran Performance Indicators Fiscal Year 2017 Miles Between Road Calls Miles Between Inspections Jul Aug Sep Oct Nov Dec Jan Feb Mar Apr May Jun Revenue vehicle system failures are defined as mechanical problems that cause a vehicle not to complete its scheduled revenue trip, or does not start its next scheduled revenue trip. *Per NTD guidelines Jul Aug Sep Oct Nov Dec Jan Feb Mar Apr May Jun Acceptable range is + or 10% Indicators are impacted by the FY16 Strike which occurred from 8/6/15 through 9/16/15 24
25 FY 16 FY 17 Budget Sun Tran Performance Indicators Fiscal Year 2017 Vehicle Accidents per 100,000 Miles 3.5 Complaints per 100,000 Passengers Jul Aug Sep Oct Nov Dec Jan Feb Mar Apr May Jun 0 Jul Aug Sep Oct Nov Dec Jan Feb Mar Apr May Jun Indicators are impacted by the FY16 Strike which occurred from 8/6/15 through 9/16/15 25
26 Sun Tran Performance Indicators Fiscal Year ,600 1,500 1,400 1,300 1,200 1,100 1, July August September October November December January February March April May June SunGO Issues SunGO Issues Resolved * The SunGO issues are in addition to 23 COM Reports (complaints, inquiries and compliments) that are included in the Sun Tran complaint totals. 26

27 FY 16 FY 17 Sun Tran Performance Indicators Fiscal Year
28 ` SUN TRAN ROUTE PERFORMANCE PROFILE JUNE 2017 ROUTE TOTAL ROUTE PASSENGERS ROUTE REVENUE TOTAL SERVICE MILES TOTAL SERVICE HOURS TOTAL COST ALLOCATION NET COST PER HOUR PASSENGER PER MILE PASSENGER PER HOUR REVENUE PER MILE REVENUE PER HOUR SUBSIDY PER PASSENGER 1 32,394 $ 18,392 20,128 1,750 $ 140,154 $ $ 0.98 $ $ ,206 11,994 20,938 1, , ,499 28,640 44,195 3, , ,775 55,595 55,413 4, , ,586 8,855 17,944 1, , ,521 25,045 19,607 2, , ,110 32,345 46,330 3, , ,651 56,627 55,302 4, , ,789 26,551 33,090 2, , ,888 15,369 14,892 1,212 99, ,879 47,299 46,748 3, , ,634 16,941 19,808 1, , ,453 15,363 27,192 2, , ,091 53,971 45,288 3, , ,392 37,114 44,404 3, , ,506 42,466 25,010 2, , ,851 14,780 9,626 1,067 77, ,705 6,413 10, , ,507 5,815 10, , ,600 15,066 19,922 1, , ,019 10,025 7, , ,518 20,845 22,455 1, , ,074 8,589 17,294 1,048 98, ,710 12,427 21,770 1, , ,692 18,550 21,145 1, , ,414 31,606 36,965 3, , ,506 6,565 15,129 1,143 97, ,044 6,117 6, , ,856 6,401 11, , TOTAL FIXED ROUTE 1,162, , ,045 60,788 5,005,019 $ $ 0.97 $ $ 3.74 ROUTE TOTAL ROUTE PASSENGERS ROUTE REVENUE TOTAL SERVICE MILES TOTAL SERVICE HOURS TOTAL COST ALLOCATION NET COST PER HOUR PASSENGER PER MILE PASSENGER PER TRIP REVENUE PER MILE REVENUE PER HOUR SUBSIDY PER PASSENGER 101X 2,219 $ 5,731 3, $ 20,263 $ $ 3.59 $ $ X 1,307 3,355 5, , X 576 1,450 2, , X 917 2,390 3, , X 1,152 2,950 4, , X 1,503 3,431 10, , X 1,446 3,741 4, , X 588 1,313 4, , X 1,710 4,175 5, , X 574 3,160 3, , X 1,734 9,541 8, , X , , TOTAL EXPRESS ROUTE 14,417 41,281 63,332 2, ,029 $ $ 1.19 $ $ TOTAL SERVICE 1,177, , ,377 63,534 5,315,048 $ $ 0.99 $ $ 3.92 Notes: 1) Service miles denotes Scheduled Vehicle Revenue and Deadhead Miles per Route. 2) Effective March 2014: The passenger per hour metric has been replaced with passenger per trip for express route service. Passenger per trip is a better measurement of productivity for express service. 3) Routes 110X and 312X are bi-directional express service. 28
29 SUN TRAN RANKING OF ROUTES - ROUTE PASSENGERS PER HOUR JUNE 2017 RANKING ROUTE NUMBER ROUTE DESCRIPTION PASSENGERS PER HOUR 1 18 S. 6TH AVENUE TH AVENUE STONE ORACLE / INA FLOWING WELLS BROADWAY ALVERNON SPEEDWAY EUCLID/ NORTH FIRST AVENUE TH / 12TH AVENUE S. PARK AVENUE GLENN/SWAN COUNTRY CLUB / 29TH STREET VALENCIA CRAYCROFT / FT LOWELL GRANT ROAD AJO ND STREET TH STREET / WILMOT MISSION ROAD WEST CONGRESS / SILVERBELL CHERRYBELL BENSON HIGHWAY LA CHOLLA MIDVALE PARK GRANDE CAMPBELL AVENUE PIMA STREET / WEST SPEEDWAY PANTANO 9.2 FIXED ROUTE SYSTEM AVERAGE 19.1 RANKING ROUTE NUMBER ROUTE DESCRIPTION PASSENGERS PER TRIP 1 101X GOLF LINKS EXPRESS X INA ROAD EXPRESS X ORO VALLEY/AEROPARK EXPRESS X BROADWAY EXPRESS X SUNRISE EXPRESS X RITA RANCH/DOWNTOWN EXPRESS X MARANA EXPRESS X OLDFATHER EXPRESS X ORO VALLEY/DOWNTOWN EXPRESS X TANQUE VERDE EXPRESS X NORTHWEST-AERO PARK EXPRESS X SPEEDWAY/AEROPARK EXPRESS 1.4 EXPRESS ROUTE SYSTEM AVERAGE
30 CUSTOMER INFORMATION CENTER The customer service information and call center answered 19,443 phone calls in June That is a 1% decrease from the 19,640 calls answered in May 2017 and a 14% decrease from the 22,608 calls answered in June. Sun Tran s website customer feedback response center received 86 s in June That is a 17% decrease over the 103 s received May 2017 and a 17% decrease from the 103 s received in June. SERVICE REPORTS COMPARISON JUNE 2017 JUNE % Increase/Decrease Total Service Reports: % Inquiries % Compliments % Complaints % Chargeable % Non-chargeable % Pending % Incomplete % SERVICE REPORTS COMPARISON JUNE 2017 MAY 2017 % Increase/Decrease Total Service Reports: % Inquiries % Compliments % Complaints % Chargeable % Non-chargeable % Pending % Incomplete 5 5 SAME Notes: 1) Complaints deemed non chargeable were investigated, and the results indicated Sun Tran was not at fault. (Example: bus did not show, bus was early or late, etc.) 2) Incomplete are service reports with incomplete information that did not allow Sun Tran to finish an investigation. 3) Incomplete service reports are held in the event additional facts are provided to finish the investigation. 4) Inquiries are customer questions that are not complaints, but focus on service issues, and are more informational based in the response back to the consumer. 30
31 31
32 32
33 33
34 34
35 35
36 36

37 FY 16 FY 17 Budget Sun Van Performance Indicators Fiscal Year

38 FY 16 FY 17 Budget Sun Van Performance Indicators Fiscal Year


39 FY 16 FY 17 Budget Sun Van Performance Indicators Fiscal Year


40 FY 16 FY 17 Budget Sun Van Performance Indicators Fiscal Year


41 FY 16 FY 17 Sun Van Performance Indicators Fiscal Year 2017 * ADA Service only. ** Data does not include same-day requests. 41
42 42
43 Sun Tran Glossary of Terms Ridership (Unlinked Passenger Trips) The number of passengers who board public transportation vehicles. Passengers are counted each time they board vehicles no matter how many vehicles they use to travel from their origin to their destination. Total Cost per Passenger Equals total expenditures divided by total passengers. Passenger per Mile Equals total passengers divided by total miles. Passenger per Service Hour Equals total ridership divided by total service hours. Passenger Revenue Equals revenue collected from passengers (includes farebox revenue and revenue from pass sales). Revenue Miles and Hours The miles and hours that vehicles travel while in revenue service. Vehicle revenue miles and hours (VRM and VRH) include: layover / recovery time. But exclude: deadhead, operator training and maintenance testing, as well as school bus and charter services. Revenue per Mile Equals total passenger revenue divided by total miles. Revenue per Passenger Equals total passenger revenue divided by total passengers Revenue per Service Hour Equals passenger revenue divided by service hours Deadhead Miles and Hours Miles and hours that a vehicle travels when out of revenue service. Deadhead includes: leaving or returning to the garage or yard facility, changing routes, or when there is no expectation of carrying revenue passengers. However, deadhead does not include: charter service, school bus service, operator training, maintenance training. Service Miles and Hours Miles and hours that vehicles travel while in revenue service plus deadhead miles and hours. But exclude: charter and school bus service, operator training, and maintenance testing. Total Cost per Mile Equals total expenditures divided by total miles. Cost per Mile Equals total expenditures less Operating Grant Funds divided by total miles. Cost per Service Hour Equals total expenditures less Operating Grant Funds divided by total service hours. Total Complaints per 100,000 passengers Equals total complaints divided by total passengers times 100,000. On-Time As defined by the Short Range Transit Plan, a bus may be up to 5 minutes late, but less than 1 minute early. Road Calls Equals total chargeable road calls. A road call is defined as a mechanical failure of a bus in revenue service that necessitates removing the bus from service until repairs are made.. 43
44 Sun Van Glossary of Terms Ridership (Unlinked Passenger Trips) - Equals total Passengers actually transported. A one-way trip taken by an ADA Paratransiteligible passenger, a personal care attendant (PCA) or companions from the pick-up point to the destination. Passengers Per Revenue Hour - Equals Ridership divided by Revenue hours. Total Demand - Total number of passenger trips requested. Denial An ADA-eligible trip requested that is not scheduled by Sun Van within the permissible scheduled window of on hour before or one hour after the requested pick-up time. Passengers Per Service Hour - Equals Ridership divided by Service hours. Revenue Per Trip Total Passenger Revenue divided by Trips. Cancellations - Occurs when the passenger or the passenger s representative cancels the reservation two (2) or more hours prior to the beginning of the scheduled pick-up time. Total Cost Per Trip Total Expenses divided by total Trips. No-Shows - Occurs when the passenger does not board the Sun Van vehicle when the vehicle arrives at the pick-up location within the pick up window and the driver waits two (2) minutes, or when the customer does not cancel the reservation within two (2) hours of the reservation. Trip Time - The percentage of ADA Trips with a trip time less than the comparable Sun Tran fixed route trip. Optional ADA Passenger trips beyond the ¾ mile corridors and beyond times available on a Sun Tran fixed route, a same-day request, and will calls. Trip A one-way trip taken by an ADA-Paratransit-eligible passenger from the pick-up point to the destination (excludes PCAs and companions). Revenue Miles All miles operated from pick-up point to destination. Trip Time 110%+5 Minutes Occurs when an ADA trip length exceeds 110% + 5 minutes of the comparable Sun Tran regular fixed route trip. On Time Pick Ups - The number of on time vehicle trips. The van is considered on time if it arrives between 15 minutes before or 15 minutes after the requested pick-up time. Pick Ups before Significantly Late - Pick Ups 30 minutes outside the original pick up window. Deadhead Miles Miles operated not providing specific revenue service. 44
MONTHLY REPORT MAY 2017
 & MONTHLY REPORT MAY 2017 SECTION Sun Tran & Sun Van Monthly Operations Report Table of Contents May 2017 PAGE I.System Highlights and Accomplishments 3-10 II.Sun Tran a.ridership 11 b.revenue 12 c.pass
MONTHLY REPORT SEPTEMBER 2017
 & MONTHLY REPORT SEPTEMBER 2017 SECTION Sun Tran & Sun Van Monthly Operations Report Table of Contents September 2017 PAGE I.System Highlights and Accomplishments 3-10 II.Sun Tran a.ridership 11 b.revenue
MONTHLY REPORT AUGUST 2017
 & MONTHLY REPORT AUGUST SECTION Sun Tran & Sun Van Monthly Operations Report Table of Contents August PAGE I.System Highlights and Accomplishments 3-10 II.Sun Tran a.ridership 11 b.revenue 12 c.pass Sales
MONTHLY REPORT DECEMBER 2017
 & MONTHLY REPORT DECEMBER 2017 SECTION Sun Tran & Sun Van Monthly Operations Report Table of Contents December 2017 PAGE I.System Highlights and Accomplishments 3-12 II.Sun Tran a.ridership 13 b.revenue
MONTHLY REPORT OCTOBER 2017
 & MONTHLY REPORT OCTOBER SECTION Sun Tran & Sun Van Monthly Operations Report Table of Contents October PAGE I.System Highlights and Accomplishments 3-11 II.Sun Tran a.ridership 12 b.revenue 13 c.pass
MONTHLY OPERATIONS REPORT SEPTEMBER 2015
 MONTHLY OPERATIONS REPORT SEPTEMBER 215 Table of Contents SEPTEMBER 215 Section Page September Highlights... 3 Strategic Goals Progress Update... 4 Ridership... 6 Revenue... 9 Expenses... 1 System Summary...
MONTHLY OPERATIONS REPORT DECEMBER 2015
 MONTHLY OPERATIONS REPORT DECEMBER 215 Table of Contents DECEMBER 215 Section Page December Highlights... 3 Strategic Goals Progress Update... 4 Ridership... 6 Revenue... 9 Expenses... 1 System Summary...
MONTHLY REPORT SEPTEMBER 2017
 MONTHLY REPORT 2017 SUN SHUTTLE RIDERSHIP ROUTE PASSENGERS: CURRENT YEAR PRIOR YEAR AMOUNT PERCENTAGE BUDGET AMOUNT PERCENTAGE TOTAL PASSENGERS 17,250 20,318 (3,068) -15.1% 18,231 (981) -5.4% CALENDAR
Sound Transit Operations December 2014 Service Performance Report. Ridership
 Ridership Total Boardings by Mode Mode Dec-13 Dec-14 % YTD-13 YTD-14 % ST Express 1,266,130 1,396,787 10.3% 16,605,299 17,661,976 6.4% Sounder 248,710 285,016 14.6% 3,035,735 3,361,317 10.7% Tacoma Link
PERFORMANCE REPORT NOVEMBER 2017
 PERFORMANCE REPORT NOVEMBER 2017 Note: New FY2018 Goal/Target/Min or Max incorporated in the Fixed Route and Connection Dashboards. Keith A. Clinkscale Performance Manager INTRODUCTION/BACKGROUND In June
2017/ Q1 Performance Measures Report
 2017/2018 - Q1 Performance Measures Report Contents Ridership & Revenue... 1 Historical Revenue & Ridership... 1 Revenue Actual vs. Planned... 3 Mean Distance Between Failures... 5 Maintenance Cost Quarter
PERFORMANCE REPORT DECEMBER 2017
 PERFORMANCE REPORT DECEMBER 2017 Note: New FY2018 Goal/Target/Min or Max incorporated in the Fixed Route and Connection Dashboards. Keith A. Clinkscale Performance Manager INTRODUCTION/BACKGROUND Keith
Sound Transit Operations January 2017 Service Performance Report. Ridership. Total Boardings by Mode
 January 217 Service Performance Report Ridership ST Express Sounder Tacoma Link Link Paratransit Jan-16 Jan-17 % 1,433,7 1,3,33 4.9% 331,27 7,121 98,411 3,633 Total Boardings by Mode 363,6 74,823 1,76,914
Sound Transit Operations January 2014 Service Performance Report. Ridership
 Ridership Total Boardings by Mode Mode Jan-13 Jan-14 % YTD-13 YTD-14 % ST Express 1,343,290 1,426,928 6.2% 1,343,290 1,426,928 6.2% Sounder 245,135 256,775 4.7% 245,135 256,775 4.7% Tacoma Link 86,229
Sound Transit Operations August 2015 Service Performance Report. Ridership
 Ridership Total Boardings by Mode Mode Aug-14 Aug-15 % YTD-14 YTD-15 % ST Express 1,534,241 1,553,492 1.3% 11,742,839 12,354,957 5.2% Sounder 275,403 326,015 18.4% 2,139,086 2,463,422 15.2% Tacoma Link
Board of Directors Information Summary
 Regional Public Transportation Authority 302 N. First Avenue, Suite 700, Phoenix, Arizona 85003 602-262-7433, Fax 602-495-0411 Board of Directors Information Summary Agenda Item #6 Date July 11, 2008 Subject
Board Box. October Item # Item Staff Page 1. Key Performance Indicators Sep 2018 M. Mungia Financial Report Aug 2018 H.
 Board Box October 2018 Item # Item Staff Page 1. Key Performance Indicators Sep 2018 M. Mungia 2-10 2. Financial Report Aug 2018 H. Rodriguez 11-15 ITEM 1 October 31, 2018 TO: FROM: RE: BOARD OF DIRECTORS
METRO OPERATIONS COMMITTEE
 Los Angeles County Metropolitan Transportation Authority Item 1 CHIEF OPERATIONS OFFICER S S REPORT METRO OPERATIONS COMMITTEE Lonnie Mitchell Chief Operations Officer May 19, 20 1 Employee Recognition
RIDERSHIP TRENDS. October 2017
 RIDERSHIP TRENDS October 2017 Prepared by the Division of Strategic Capital Planning December 2017 Table of Contents Executive Summary...1 Ridership...3 Estimated Passenger Trips by Line...3 Estimated
Date: 11/6/15. Total Passengers
 Total San Diego Metropolitan Transit System POLICY 42 PERFORMANCE MONITORING REPORT Page 1 of 6 OBJECTIVE Develop a Customer-Focused and Competitive System The following measures of productivity and service
Att. A, AI 46, 11/9/17
 Total s San Diego Metropolitan Transit System POLICY 42 PERFORMANCE MONITORING REPORT Page 1 of 6 Date: 11/8/17 OBJECTIVE Develop a Customer-Focused and Competitive System The following measures of productivity
Sound Transit Operations March 2018 Service Performance Report. Ridership
 March 218 Service Performance Report Ridership Total Boardings by Mode Mar-17 Mar-18 % YTD-17 YTD-18 % ST Express 1,622,116 1,47,79-4.6% 4,499,798 4,428,14-1.6% Sounder 393,33 39,6.% 1,74,96 1,163,76 8.3%
Performance Measures Year End Updated-
 Performance Measures Year End 2017 -Updated- Priorities and Objectives 1. Earn and Retain the Community s Trust 2. Provide Excellent Customer Service 3. Enable Organizational Success 4. Exemplify Financial
Transit Performance Report FY (JUNE 30, 2007)
") Transit Performance Report FY 2006-2007 (JUNE 30, 2007) J ANUARY 2008 TRANSIT PERFORMANCE REPORT FY 2006 2007 (JUNE 30, 2007) Transit Performance Report I SSUED: JANUARY 2008 The Transit Performance Report
Transit Performance Report FY 2006-2007 (JUNE 30, 2007) J ANUARY 2008 TRANSIT PERFORMANCE REPORT FY 2006 2007 (JUNE 30, 2007) Transit Performance Report I SSUED: JANUARY 2008 The Transit Performance Report
PERFORMANCE REPORT DECEMBER Performance Management Office
 PERFORMANCE REPORT DECEMBER 2018 Performance Management Office INTRODUCTION/BACKGROUND Performance Management Office FIXED ROUTE DASHBOARD FY 2019 Safety Max Target Goal Preventable Collisions per 100k
VCTC Transit Ridership and Performance Measures Quarterly Report
 VCTC Transit Ridership and Performance Measures Quarterly Report Overview Quarter 2 Fiscal Year 2018-2019 This report provides performance measures for VCTC Intercity Bus Service covering the FY 2018-19
Board Box. February Item # Item Staff Page 1. Key Performance Indicators M. Thompson Financial Report for Dec H.
 Board Box February 2016 Item # Item Staff Page 1. Key Performance Indicators M. Thompson 2-8 2. Financial Report for Dec. 2015 H. Rodriguez 9-13 ITEM 1 February 15, 2016 TO: FROM: RE: BOARD OF DIRECTORS
Sound Transit Operations January 2018 Service Performance Report. Ridership
 January 218 Service Performance Report Ridership Total Boardings by Mode Jan-17 Jan-18 % YTD-17 YTD-18 % ST Express 1,3,33 1,7,91.3% 1,3,33 1,7,91.3% Sounder 367,33 416,8 13.3% 367,33 416,8 13.3% Tacoma
Sound Transit Operations March 2017 Service Performance Report. Ridership. Total Boardings by Mode
 March 217 Service Performance Report Ridership ST Express Sounder Tacoma Link Link Paratransit Mar-16 Mar-17 % 1,83,4 1,621,49 2.4% 37,496 82,631 1,264,47 3,821 Total Boardings by Mode 389,98 87,39 1,89,43,297
Quarterly Report Transit Bureau, Local Transit Operations. First Quarter, Fiscal Year 2015 (July 2014 September 2014) ART & STAR
 ART & STAR") Quarterly Report Transit Bureau, Local Transit Operations First Quarter, Fiscal Year 2015 (July 2014 September 2014) ART & STAR A Arlington Transit ART 1) Introduction The purpose of ART is to provide
Quarterly Report Transit Bureau, Local Transit Operations First Quarter, Fiscal Year 2015 (July 2014 September 2014) ART & STAR A Arlington Transit ART 1) Introduction The purpose of ART is to provide
Sound Transit Operations June 2016 Service Performance Report. Ridership
 Ridership Total Boardings by Mode Mode Jun-15 Jun-16 % YTD-15 YTD-16 % ST Express 1,622,222 1,617,420-0.3% 9,159,934 9,228,211 0.7% Sounder 323,747 361,919 11.8% 1,843,914 2,099,824 13.9% Tacoma Link 75,396
RIDERSHIP TRENDS. August 2018
 RIDERSHIP TRENDS August Prepared by the Division of Strategic Capital Planning October Table of Contents Executive Summary...1 Ridership...3 Estimated Passenger Trips by Line...3 Estimated Passenger Trips
PERFORMANCE REPORT JANUARY Keith A. Clinkscale Performance Manager
 PERFORMANCE REPORT JANUARY 2018 Keith A. Clinkscale Performance Manager INTRODUCTION/BACKGROUND Keith A. Clinkscale Performance Manager FIXED ROUTE DASHBOARD JANUARY 2018 Safety Max Target Goal Preventable
2017/2018 Q3 Performance Measures Report. Revised March 22, 2018 Average Daily Boardings Comparison Chart, Page 11 Q3 Boardings figures revised
 2017/2018 Q3 Performance Measures Report Revised March 22, 2018 Average Daily Boardings Comparison Chart, Page 11 Q3 Boardings figures revised Contents Ridership & Revenue... 1 Historical Revenue & Ridership...
RIDERSHIP TRENDS. January 2018
 RIDERSHIP TRENDS January 2018 Prepared by the Division of Strategic Capital Planning March 2018 Table of Contents Executive Summary...1 Ridership...3 Estimated Passenger Trips by Line...3 Estimated Passenger
Existing Services, Ridership, and Standards Report. June 2018
 Existing Services, Ridership, and Standards Report June 2018 Prepared for: Prepared by: Contents Overview of Existing Conditions... 1 Fixed Route Service... 1 Mobility Bus... 34 Market Analysis... 41 Identification/Description
Sound Transit Operations February 2018 Service Performance Report. Ridership
 February 218 Service Performance Report Ridership Total Boardings by Mode Feb-17 Feb-18 % YTD-17 YTD-18 % ST Express 1,373,96 1,372,88 -.1% 2,877,294 2,88,719.1% Sounder 314,96 32,187 11.9% 681,923 768,69
METROBUS SERVICE GUIDELINES
 METROBUS SERVICE GUIDELINES In the late 1990's when stabilization of bus service was accomplished between WMATA and the local jurisdictional bus systems, the need for service planning processes and procedures
With the completion of this project, we would like to follow-up on the projections as well as highlight a few other items:
 TO: FROM: Mayor and Council Interim City Manager Rebecca Underhill, Director of Finance DATE: February 28, 2014 SUBJECT: Water Meter Project Analysis On March 28, 2012, Acting City Manager Mike Loftin
Service Cost Estimate for Route 10 only
 2009-2011 Service Cost Estimate for Route 10 only The City of Ashland buys down the fare on Route 10 for each passenger riding in Ashland, therefore service cost estimates are based on recent ridership
FIXED ROUTE DASHBOARD JULY 2018
 FIXED ROUTE DASHBOARD JULY 2018 Safety Max Target Goal Preventable Collisions per 100k Miles Non-Preventable Collisions per 100k Miles Total Incidents per 10,000 Boardings 1.6 1.3 0.8 2.63 2.1 2.0 1.60
Administrative Operations Report
 Fiscal Year 2017/18 Administrative Operations Report November 1, 2018 Prepared by: El Dorado County Transit Authority 6565 Commerce Way Diamond Springs, CA 95619 (530) 642-5383 www.eldoradotransit.com
Establishes a fare structure for Tacoma Link light rail, to be implemented in September 2014.
 RESOLUTION NO. R2013-24 Establish a Fare Structure and Fare Level for Tacoma Link MEETING: DATE: TYPE OF ACTION: STAFF CONTACT: PHONE: Board 09/26/2013 Final Action Ric Ilgenfritz, Executive Director,
Bristol Virginia Transit
 Bristol Virginia Transit 1 Transit Overview Bristol Virginia Transit (BVT) is a Federally Funded and certified urban area transit system. BVT began operation in its current form in 1982. In Fiscal Year
About This Report GAUGE INDICATOR. Red. Orange. Green. Gold
 ATTACHMENT A About This Report The Orange County Transportation Authority (OCTA) operates a countywide network of local, community, rail connector, and express bus routes serving over 6, bus stops. OCTA
Factors that Affect Fixed-Route Ridership Frequency Connections and accessibility Travel time Travel cost Service area coverage Reliability
 The transit industry defines ridership as the number of passengers who board public transportation vehicles called unlinked passenger trips. Ridership measures transit utilization at the system, route,
General Issues Committee Item Transit Operating Budget Ten Year Local Transit Strategy
 General Issues Committee Item 4.1 2017 Transit Operating Budget Ten Year Local Transit Strategy January 27, 2017 Presentation Outline 2017 Operating Budget Overview Ten Year Local Transit Strategy 2 2017
DRT Performance Measurement: the U.S. Experience
 DRT Performance Measurement: the U.S. Experience FOR ANYBODY GOING ANYWHER IN LA HABRA International Conference on Demand Responsive Transportation Breckenridge, Colorado September 2016 DRT Performance
ATTACHMENT A.7. Transit Division Performance Measurements Report Fiscal Year Fourth Quarter
 TTCHMENT.7 Transit Division Performance Measurements Report Fiscal Year 2012-13 Fourth Quarter Introduction The Orange County Transportation uthority (OCT) operates a countywide network of local, community,
September 2014 Prepared by the Department of Finance & Performance Management Sub-Regional Report PERFORMANCE MEASURES
 September 2014 Prepared by the Department of Finance & Performance Management 2013 Sub-Regional Report PERFORMANCE MEASURES REGIONAL PERFORMANCE MEASURES RTA staff has undertaken the development of a performance
Metra Board of Directors. Board Meeting November 11, 2011
 Metra Board of Directors Board Meeting November 11, 2011 State of Metra Operations Metra Board of Directors November 11, 2011 Presented by George Hardwidge Deputy Executive Director Operations System On-Time
January 2018 Air Traffic Activity Summary
 January 2018 Air Traffic Activity Summary Jan-2018 Jan-2017 CY-2018 CY-2017 Passengers 528,947 505,421 4.7% 528,947 505,421 4.7% Passengers 537,332 515,787 4.2% 537,332 515,787 4.2% Passengers 1,066,279
TRANSPORTATION SERVICE Actual
 PERFORMANCE REPORT-THIRD QUARTER VISION TO DELIVER REGIONAL MULTI-MODAL TRANSPORTATION SERVICES AND INFRASTRUCTURE IMPROVEMENTS THAT SIGNIFICANTLY AND CONTINUALLY INCREASE TRANSIT MARKET SHARE. MISSION
ESCAMBIA COUNTY AREA TRANSIT MTAC REPORT
 ESCAMBIA COUNTY AREA TRANSIT MTAC REPORT November 8, 2017 Meeting Escambia County Area Transit 1515 W. Fairfield Drive Pensacola, FL 32501 850-595-3228 INTRODUCTION 2 Summary Background MTAC ECAT Benchmarks
METRO FLEET FUNDING HUMAN RESOURCES
 2018 FACT SHEET METRO FLEET METRO s overall revenue-producing fleet totals 235 vehicles: 144 large buses and 91 smaller paratransit buses. Some passenger vehicles are equipped with a hydraulic lift to
Bus Operations Report
 Third Quarter FY 216 (January 1 - March 31, 216) Wednesday April 27, 216 Operations Ridership: 783,194 passengers used in the third quarter. This represents a 2% increase over the same period in FY 215.
Scorecard Key Performance Indicators
 Scorecard Key Performance Indicators 1 st Quarter 2013 NICE Bus Fixed Route NICE Bus Fixed Route Definitions Scheduled Revenue Hours Full Trip Revenue Hours Lost Runs Missed Revenue Hours Lost Actual Hours
Current Operations CHAPTER II INTRODUCTION DESCRIPTION OF TRANSPORTATION SERVICES
 Chapter II CHAPTER II Current Operations INTRODUCTION This chapter provides an overview of Centre Area Transportation Authority (CATA). CATA is a joint municipal authority formed under the Municipal Authorities
Peer Performance Measurement February 2019 Prepared by the Division of Planning & Market Development
 2017 Regional Peer Review Peer Performance Measurement February 2019 Prepared by the Division of Planning & Market Development CONTENTS EXECUTIVE SUMMARY... 3 SNAPSHOT... 5 PEER SELECTION... 6 NOTES/METHODOLOGY...
Capital Metropolitan Transportation Authority. Monthly Performance Report
 Capital Metropolitan Transportation Authority Monthly Performance Report AUGUST 2010 Ridership Report August 23, 2010 Budget to Actual Ridership Budget Target: 2,290,590 Actual: 2,300,796 Ridership Comparison
YOSEMITE AREA REGIONAL TRANSPORTATION SYSTEM
 YOSEMITE AREA REGIONAL TRANSPORTATION SYSTEM Short Range Transit Plan Prepared for the Merced County Association of Governments/YARTS Prepared by LSC Transportation Consultants, Inc. YOSEMITE AREA REGIONAL
Implementation Guidelines and Performance Measures Special Transportation for Seniors and People with Disabilities (Paratransit) Program
 Program") FY 2019-20 FINAL December 2018 Implementation Guidelines and Performance Measures Special Transportation for Seniors and People with Disabilities (Paratransit) Program Implementation Guidelines These guidelines
FY 2019-20 FINAL December 2018 Implementation Guidelines and Performance Measures Special Transportation for Seniors and People with Disabilities (Paratransit) Program Implementation Guidelines These guidelines
FY Transit Needs Assessment. Ventura County Transportation Commission
 FY 18-19 Transit Needs Assessment Ventura County Transportation Commission Contents List of Figures and Appendices.. 2 Appendices... 1 Chapter 1: Introduction What is the Ventura County Transportation
SUB-REGIONAL PERFORMANCE MEASURES
 SUB-REGIONAL PERFORMANCE MEASURES 29 REPORT Overall regional performance is a function of five major areas: Service Coverage - monitors both how much service is available to people in the region (in terms
PTN-128 Reporting Manual Data Collection and Performance Reporting
 2016 PTN-128 Reporting Manual Data Collection and Performance Reporting Sponsored by the Texas Department of Transportation Table of Contents PTN-128 WHAT, WHY AND WHO... 6 What is the PTN-128... 13 Why
Analysts and Investors conference call. Q results. 15 May 2013
 Analysts and Investors conference call Q1 2013 results 15 May 2013 Management summary Key messages of Q1 2013 +6% +9% +3.3%p. Q1 2013 operational KPIs are in line with 109.7 116.2 6.5 7.1 82.3 85.6 expectations,
FIXED ROUTE Operating Statistics For Periods Ending 9/30/2008 & 9/30/2009
 FIXED ROUTE Operating Statistics For Periods Ending 9/30/2008 & 9/30/2009 CURRENT MONTH YEAR TO DATE Actual Actual Variance Actual Actual Variance 2008 2009 2008 to 2009 2008 2009 2008 to 2009 Service
Driving Ridership Strategic Partnerships
 Driving Ridership Strategic Partnerships Feb 29, 2012 Presented by Priya Bhasin-Singh, Strategic Marketing Associate priya.bhasin-singh@edmonton.ca 2012 APTA Marketing & Communications Conference About
Chapter 3. Burke & Company
 Chapter 3 Burke & Company 3. WRTA RIDERSHIP AND RIDERSHIP TRENDS 3.1 Service Overview The Worcester Regional Transit Authority (WRTA) provides transit service to over half a million people. The service
Montgomery Area Paratransit Guide
 Montgomery Area Paratransit Guide May 2016 Contents Welcome to the MAP Program... 3 Getting more information and assistance... 6 What to expect from MAP service.....7 MAP customer responsibilities...
RACINE COUNTY PUBLIC TRANSIT PLAN:
 RACINE COUNTY PUBLIC TRANSIT PLAN: 2013-2017 Recommended Transit Service Improvement Plan NEWSLETTER 3 SEPTEMBER 2013 This newsletter describes the final recommended public transit plan for the City of
COLTS Complementary ADA Paratransit Service. Special Efforts Accessibility Transportation Service (SEATS) SEATS Trip Tips (570)
 SEATS Trip Tips (570)") COLTS Complementary ADA Paratransit Service Special Efforts Accessibility Transportation Service (SEATS) SEATS Trip Tips (570) 963-6795 June, 2016 1 Welcome to SEATS!!! COLTS provides Complementary ADA
COLTS Complementary ADA Paratransit Service Special Efforts Accessibility Transportation Service (SEATS) SEATS Trip Tips (570) 963-6795 June, 2016 1 Welcome to SEATS!!! COLTS provides Complementary ADA
PUBLIC NOTICE The Greater Boise Auditorium District will hold a Regular Board Meeting on Thursday, December 20, 2018 at 2 p.m. Boise Centre West Room
 PUBLIC NOTICE The Greater Boise Auditorium District will hold a Regular Board Meeting on Thursday, December 20, 2018 at 2 p.m. Boise Centre West Room 200 GREATER BOISE AUDITORIUM DISTRICT REGULAR BOARD
SAMTRANS SERVICE PLAN
 Agenda Overview Part I: Key Findings Market Assessment Service Evaluation Part II: Service Development Framework Metrics Criteria Part III: Next Steps SAMTRANS SERVICE PLAN Preliminary Analysis and Criteria
Corporate presentation CIBC Whistler Institutional Investor Conference January 21, 2010
 Corporate presentation CIBC Whistler Institutional Investor Conference January 21, 2010 Forwardlooking statement Certain information in this presentation and statements made during this presentation, including
JANUARY 2017 BOARD INFORMATION PACKAGE
 JANUARY 2017 BOARD INFORMATION PACKAGE MEMORANDUM TO: Members of the Airport Authority FROM: Lew Bleiweis, Executive Director DATE: January 13, 2017 Financial Report (document) Informational Reports: A.
COMO Bus Service Evaluation DRAFT COA. September 19, 2016
 DRAFT COA September 19, 2016 Chapter 1 Introduction Introduction The City of Columbia Missouri unveiled COMO Connect in 2013 with the goal of changing how public transportation options were delivered in
MERRIMACK VALLEY REGIONAL TRANSIT AUTHORITY (MVRTA) PERFORMANCE MEASURES: FIXED ROUTE
 PERFORMANCE MEASURES: FIXED ROUTE") PERFORMANCE MEASURES: FIXED ROUTE IT IS OUR GOAL TO IMPROVE FIXED ROUTE SERVICE ON ALL LEVELS, ON A CONTINUOUS BASIS. IN ORDER TO DO THIS, WE HAVE ESTABLISHED BENCHMARKS TO MEASURE PERFORMANCE. THIS INFORMATION
PERFORMANCE MEASURES: FIXED ROUTE IT IS OUR GOAL TO IMPROVE FIXED ROUTE SERVICE ON ALL LEVELS, ON A CONTINUOUS BASIS. IN ORDER TO DO THIS, WE HAVE ESTABLISHED BENCHMARKS TO MEASURE PERFORMANCE. THIS INFORMATION
October REGIONAL ROUTE PERFORMANCE ANALYSIS
 October 2018 2017 REGIONAL ROUTE PERFORMANCE ANALYSIS The Council s mission is to foster efficient and economic growth for a prosperous metropolitan region Metropolitan Council Members Alene Tchourumoff
CWC LA - Cash Balance (January 2012)
") CWC LA - Cash Balance 2012-13 (January 2012) 1,200,000 Cash Balance 1,000,000 800,000 ($1,000s) 600,000 400,000 200,000 - CWC LA - Actuals/Projected CWC LA - ed (Nov) 1 1 CWC Hollywood - Financial Dashboard
CWC LA - Cash Balance 2012-13 (January 2012) 1,200,000 Cash Balance 1,000,000 800,000 ($1,000s) 600,000 400,000 200,000 - CWC LA - Actuals/Projected CWC LA - ed (Nov) 1 1 CWC Hollywood - Financial Dashboard
Auckland Transport Quarterly Indicators Report 2018/19
 Attachment 1 Auckland Transport ly Indicators Report 218/19 September 218 Table of Contents Page 2. 1. Executive summary 2. External indicators 3. Performance by Key Priority 3.1 Deliver an efficient and
St. Johns County Transit Development Plan Update
 St. Johns County Transit Development Plan Update 2012-2021 Demographic Information Population 190,000 people in 2010 51% increase from 2000 Employment 64% over age 16 in labor force St. Augustine, Ponte
* Data for prior months has been updated to reflect error corrections from missing passenger count data
 LANE TRANSIT DISTRICT September 2016 Performance Report * 29-November-2016 Prior Performance Current Year's % Current Previous % Current Prior % Measure Month Month Change Y-T-D Y-T-D Change 12 Month 12
BUSINESS BAROMETER December 2018
 Credit: Chris Orange BUSINESS BAROMETER December Credit: Nigel Moore 1 Contents Summary of findings 3 Annual monthly performance: visitor attractions..4 Visit Herts Team update 5 National context.8 Visitor
WESTERN EL DORADO COUNTY SHORT AND LONG-RANGE TRANSIT PLAN Executive Summary
 WESTERN EL DORADO COUNTY SHORT AND LONG-RANGE TRANSIT PLAN Executive Summary Prepared for the El Dorado County Transportation Commission Prepared by The El Dorado County Transportation Commission (EDCTC)
APRIL 2016 BOARD INFORMATION PACKAGE
 APRIL 2016 BOARD INFORMATION PACKAGE MEMORANDUM TO: Members of the Airport Authority FROM: Lew Bleiweis, Executive Director DATE: April 8, 2016 Financial Report (document) Informational Reports: A. February,
North Central Regional Transit District. Quick Facts. Our Mission Statement:
 North Central Regional Transit District Our Mission Statement: The mission of the North Central Regional Transit District is to provide safe, secure and effective public transportation within North Central
Annual Transit Ridership Monitoring Report Fiscal Year
 Annual Transit Monitoring Report Fiscal Year 214-15 May 2, 216 Metropolitan Transportation Planning Organization for the Gainesville Urbanized Area Annual Transit Monitoring Report Fiscal Year 214-15
Transit Commission. Tax Supported Programs
 Transit Commission Tax Supported Programs Tabled November 8, 2017 Table of Contents Transit Commission Table of Contents Briefing Note... 1 Operating Resource Requirement... 3 User Fees... 4 Capital Program
Matt Miller, Planning Manager Margaret Heath-Schoep, Paratransit & Special Projects Manager
 DATE May 2, 218 Item #12 TO FROM GCTD Board of Directors Matt Miller, Planning Manager Margaret Heath-Schoep, Paratransit & Special Projects Manager MS SUBJECT I. EXECUTIVE SUMMARY This quarterly report
GREATER BOISE AUDITORIUM DISTRICT REGULAR BOARD MEETING OF THE BOARD OF DIRECTORS. AGENDA Revised. September 20, 2016
 GREATER BOISE AUDITORIUM DISTRICT REGULAR BOARD MEETING OF THE BOARD OF DIRECTORS AGENDA Revised September 20, 2016 BOISE CENTRE Willows Room 2:00 p.m. I. Call to Order II. III. IV. Changes or Additions
U.S. DOMESTIC INDUSTRY OVERVIEW FOR MARCH
 Inter-Office Memo Reno-Tahoe Airport Authority Date: April 30, 2009 To: Statistics Recipients From: Krys T. Bart, A.A.E., President/CEO Subject: RENO-TAHOE INTERNATIONAL AIRPORT PASSENGER STATISTICS U.S.
Greater Portland Transit District
 Greater Portland Transit District TO: FROM: Freeport Town Council Greg Jordan - Metro General Manager DATE: September 10, 2014 SUBJECT: Metro Request to Pursue Grant Funding for Trial Express Bus Service
Manual vs. Automatic Operation and Operational Restrictions
 Customer Services, Operations, and Safety Committee Board Information Item IV-B March 11, 2010 Manual vs. Automatic Operation and Operational Restrictions Page 81 of 91 Washington Metropolitan Area Transit
Paratransit Bus Services Guide
 Roseville Transit 1 Paratransit Bus Services Guide Effective November 19, 2014 About Roseville Americans with Disabilities Act (ADA) Paratransit Service Roseville ADA Paratransit service operates as a
SOUTHEASTERN PENNSYLVANIA TRANSPORTATION AUTHORITY
 SOUTHEASTERN PENNSYLVANIA TRANSPORTATION AUTHORITY CUSTOMIZED COMMUNITY TRANSPORTATION CCT CONNECT SERVICE TARIFF NO. 229 SUPPLEMENT NO. 10 LOCAL RATES OF FARE AND REGULATIONS GOVERNING THE FURNISHING
The packet is available on-line by going to choosing the Monthly Calendar, and clicking on Monday, March 16, 2015.
 AGENDA Ingham County Parks & Recreation Commission 121 E. Maple Street, P.O. Box 178, Mason, MI 48854 Telephone: 517.676.2233; Fax: 517.244.7190 The packet is available on-line by going to www.ingham.org,
IT IS CITILINK S MISSION TO PROVIDE SAFE, COURTEOUS AND DEPENDABLE PUBLIC TRANSPORTATION AT THE MOST REASONABLE COST TO OUR COMMUNITY.
 ACCESS RIDE GUIDE 1 IT IS CITILINK S MISSION TO PROVIDE SAFE, COURTEOUS AND DEPENDABLE PUBLIC TRANSPORTATION AT THE MOST REASONABLE COST TO OUR COMMUNITY. Citilink Access serves the needs of customers
(This page intentionally left blank.)
") Executive Summary (This page intentionally left blank.) Executive Summary INTRODUCTION The Cache Valley Transit District (CVTD) contracted with the team of Transportation Consultants, Inc. () and Fehr
Executive Summary (This page intentionally left blank.) Executive Summary INTRODUCTION The Cache Valley Transit District (CVTD) contracted with the team of Transportation Consultants, Inc. () and Fehr
Management Presentation. March 2016
 Management Presentation March 2016 Forward looking statements This presentation as well as oral statements made by officers or directors of Allegiant Travel Company, its advisors and affiliates (collectively