St. Johns County Transit Development Plan Update
|
|
|
- Sharon Underwood
- 6 years ago
- Views:
Transcription

1 St. Johns County Transit Development Plan Update

2 Demographic Information Population 190,000 people in % increase from 2000 Employment 64% over age 16 in labor force St. Augustine, Ponte Vedra, WGV Income 2009 Median HH income = $64k Significantly higher than Florida Journey to Work Average commute time = 25 min. 62% work in St. Johns 35% work in Duval 3% work in Clay, Putnam, Flagler 2

3 Current System and Ridership Fixed-Route 57,000 trips in ,000 trips in 2010 Demand Response 130,000 in ,000 in
4 Public Involvement Summary On-Board Survey 124 responses 70% ride primarily because they don t drive or no car is available 60% ride at least 4 days a week 60% of trips are within City, 25% within County Overall satisfaction with system 4.5 (1 to 5 scale) Value of bus fare (service for $) 4.8 (1 to 5 scale) 1 st choice 34% more frequency, 33% Sunday, 18% later evenings 2 nd choice 27% Sunday, 24% later evenings, 19% more frequency Telephone survey 150 responses 90% awareness of Sunshine Bus and St. Johns COA 80% felt Sunshine Bus was a very good or good value 90% agreed that public transportation is an important service 52% agreed that taxpayer funding for transit should be increased 4
5 Public Involvement Summary Stakeholder and Agency Meetings Sunshine Bus Company staff and bus operators Council on Aging staff Commissioner Ken Bryan (Disadvantage Coordinating Board) WorkSource St. Johns County Planning staff St. Johns County Public Works staff City of St. Augustine staff City of St. Augustine Beach staff FDOT District Two staff Jacksonville Transportation Authority (JTA) staff 5
6 Peer Review of Similar Systems 9 peer city systems reviewed (5 in Florida, 4 in southeast) Pensacola, Ft. Walton Beach, Vero Beach, Fort Pierce, and Brooksville Huntsville (AL), Greenville (SC), Hagerstown (MD), Johnson City (TN) Comparisons made for fixed-route and demand response Service area Passenger statistics Revenue statistics Bus fleet data Fare information Operation and Maintenance Costs Farebox Recovery 6


7 Peer Review (Fixed-Route) Relatively low ridership w/ room to grow Second-longest average trip length Passenger Trips Per Capita Johnson City, TN Hagerstown, MD Pensacola, FL Vero Beach, FL Greenville, SC Huntsville, AL Fort Walton Beach, FL St. Augustine, FL Brooksville, FL Fort Pierce, FL Average Passenger Trip Length Fort Pierce, FL St. Augustine, FL Huntsville, AL Pensacola, FL Fort Walton Beach, FL Brooksville, FL Vero Beach, FL Greenville, SC Johnson City, TN Hagerstown, MD


8 Peer Review (Fixed-Route) Lowest operating expenses per capita Reasonable value Operating Expense per Capita Johnson City, TN Hagerstown, MD Pensacola, FL Huntsville, AL Vero Beach, FL Brooksville, FL Fort Walton Beach, FL Greenville, SC Fort Pierce, FL St. Augustine, FL $0 $5 $10 $15 $20 $25 Hagerstown, MD Greenville, SC Brooksville, FL Fort Walton Beach, FL Fort Pierce, FL St. Augustine, FL Huntsville, AL Pensacola, FL Johnson City, TN Vero Beach, FL Average Fare $0.00 $0.20 $0.40 $0.60 $0.80 8


9 Peer Review (Demand Response) Passengers Trips per capita similar to others Second-lowest operating expenses Passenger Trips Per Capita Johnson City, TN Huntsville, AL St. Augustine, FL Fort Walton Beach, FL Fort Pierce, FL Vero Beach, FL Hagerstown, MD Brooksville, FL Greenville, SC Operating Expense per Capita Johnson City, TN Vero Beach, FL Fort Walton Beach, FL Huntsville, AL Fort Pierce, FL Hagerstown, MD Brooksville, FL St. Augustine, FL Greenville, SC $0 $5 $10 $15 $20 9
10 Mission and Goals Define mobility market needs and design feasible service plans Maintain and continuously improve customer focused service and products Provide an efficient and effective transportation system Enhance and improve multi-modal connectivity throughout the region Support community s vision for Quality of Life issues including recreation, growth management, and overall mobility and accessibility Communicate the role of transit in St. Johns County Continue the cooperative culture between the County, Council on Aging, and other mobility service partners which values respect, integrity, accomplishments, and open communication Establish the appropriate infrastructure necessary to maintain and expand fixed-route and paratransit services in the future 10
11 Proposed Fixed-Route Service Enhancements Modify Purple Route to serve US 1 corridor 2012 Add new route serving Outlet Mall area 2012 Add new route serving Vilano Beach area 2013 Add new route serving South Augustine area 2014 Add limited Sunday service 2015 Streamline remaining routes to improve headways 2015 Every 2 hours Mon-Sat on Green, Red, Blue, Orange, Vilano, S. Aug. Every hour Mon-Sat on Connector route 11

12 Proposed Fixed-Route System Service expanded to: Vilano Beach South Augustine World Golf Village Nocatee 12
13 Proposed Fixed-Route Capital Enhancements Purchase 15 buses (28 passenger) for existing and new service Shared parking at Depot, Kmart, & US 1 South Food Lion Construct 3 intermodal centers Depot 2013 Kmart 2015 Amtrak Station (US 1) Construct 2 Park & Ride lots Government Center 2015 US 1 / Racetrack Rd 2018 Install 20 bus shelters from 2012 to 2016 (+ 14 identified in 2011) Install 50 additional signs designating stops (30 w/ seating) 13

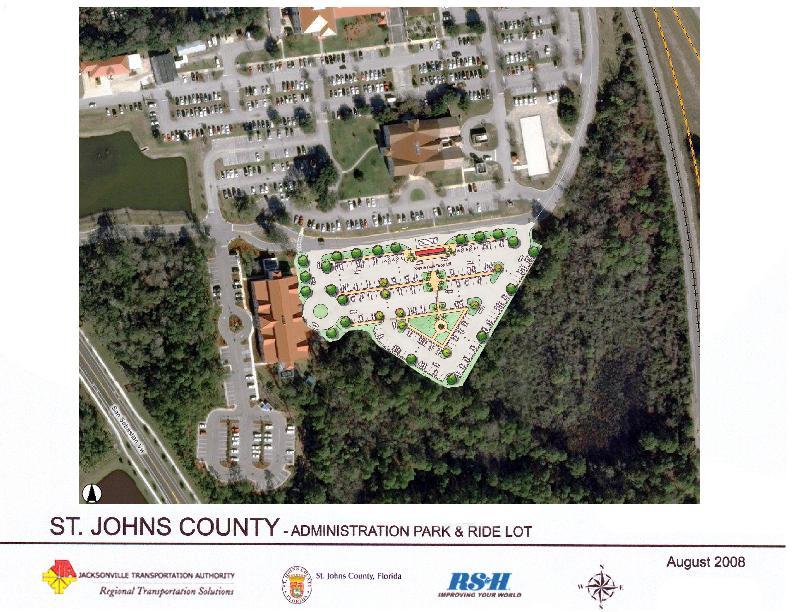
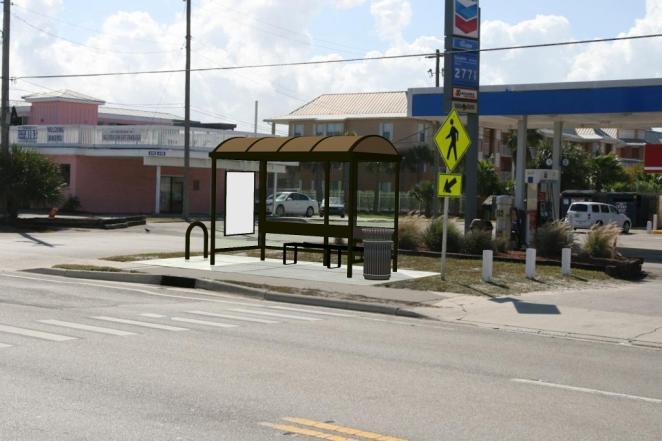
14 Proposed Capital Enhancements 14

15 Projected Fixed-Route Ridership TBEST software used Slight increase (5%) over 10 years w/out enhancements Ridership more than doubles w/ enhancements 15
16 Summary of Projected Costs Operating Costs for Fixed Route Service Maintain existing service - $9.8 million Extra cost for new / enhanced service - $5.8 million Capital Costs for Fixed Route Service Existing service - $15.8 million (includes new facilities) New / Enhanced Service - $1.4 million Operating Costs for Demand Response Service Maintain existing service - $21.7 million Savings w/ streamlined service - $2.1 million Capital Costs for Demand Response Service Existing Service - $2.6 million (replacement buses) 16
17 Summary of Projected Revenues Total Costs - $55 million Total Revenues - $55 million Federal - $18.8 million State - $27.7 million Local - $6 million Farebox - $2.5 million Federal State Local Farebox 17
18 Projected Farebox Revenues Projected revenue of $178,000 in FY 2012 Fixed-Route = $115,000 Demand Response = $63,000 Fare increase assumed for FY 2013 One-Way Increase from $1.00 to $1.25 ($0.50 to $0.65 for discount) Daily Increase from $3.00 to $3.75 ($1.50 to $1.90 for discount) Monthly Increase from $25 to $30 ($12.50 to $15.00 for discount) Fare increase assumed for FY 2018 (Fixed-Route only) One-Way Increase from $1.25 to $1.50 ($0.65 to $0.75 for discount) Daily Increase from $3.75 to $4.50 ($1.90 to $2.25 for discount) Monthly Increase from $30 to $36 ($15.00 to $18.00 for discount) Projected revenue of $299,000 in FY
19 TDP Update Next Steps Public Meeting June 2011 Draft Report July 2011 BOCC Adoption August 2011 Transmit to FDOT for approval by September 1, 2011 View document at Comments must be received by July 5 th Gary Mackey (St. Johns County Planning) gmackey@sjcfl.us Lisa Love (Council on Aging) llove@stjohnscoa.com Wiatt Bowers (Atkins) wiatt.bowers@atkinsglbal.com 19
20 St. Johns County Transit Development Plan Update
(This page intentionally left blank.)
") Executive Summary (This page intentionally left blank.) Executive Summary INTRODUCTION The Cache Valley Transit District (CVTD) contracted with the team of Transportation Consultants, Inc. () and Fehr
Executive Summary (This page intentionally left blank.) Executive Summary INTRODUCTION The Cache Valley Transit District (CVTD) contracted with the team of Transportation Consultants, Inc. () and Fehr
New System. New Routes. New Way. May 20, 2014
 Route Optimization I N I T I A T I V E New System. New Routes. New Way. May 20, 2014 1 Welcome Blueprint for Transportation Excellence (BTE) 20 year strategic plan Blueprint 2020 JTA s five-year plan for
APPENDIX B COMMUTER BUS FAREBOX POLICY PEER REVIEW
 APPENDIX B COMMUTER BUS FAREBOX POLICY PEER REVIEW APPENDIX B COMMUTER BUS FAREBOX POLICY PEER REVIEW The following pages are excerpts from a DRAFT-version Fare Analysis report conducted by Nelson\Nygaard
Existing Services, Ridership, and Standards Report. June 2018
 Existing Services, Ridership, and Standards Report June 2018 Prepared for: Prepared by: Contents Overview of Existing Conditions... 1 Fixed Route Service... 1 Mobility Bus... 34 Market Analysis... 41 Identification/Description
INDIAN RIVER COUNTY METROPOLITAN PLANNING ORGANIZATION th Street, Vero Beach, Florida, 32960
 Indian River County Transit Development Plan 2014 Annual Update Prepared By: INDIAN RIVER COUNTY METROPOLITAN PLANNING ORGANIZATION 1801 27th Street, Vero Beach, Florida, 32960 Tel (772)226 1672, Fax (772)
APPENDIX B. Arlington Transit Peer Review Technical Memorandum
 APPENDIX B Arlington Transit Peer Review Technical Memorandum Arlington County Appendix B December 2010 Table of Contents 1.0 OVERVIEW OF PEER ANALYSIS PROCESS... 2 1.1 National Transit Database...2 1.2
City of Murfreesboro. Transit Service and Management Alternatives
 City of Murfreesboro Transit Service and Management Alternatives May, 2005 Table of Contents 1. Introduction... 1 2. Transit Needs... 2 2.1 Demographics...2 2.2 Existing Transit Services...2 2.3 Focus
Executive Summary. Introduction. Community Assessment
 Executive Summary Introduction The Red Rose Transit Authority (RRTA) Transit Development Plan provides an evaluation of existing RRTA fixed route services, with the outcome being practical recommendations
Presentation to the Southeast Corridor High-Performance Transit Alternative Study Public Forum. Overview of MTA. presented by
 Presentation to the Southeast Corridor High-Performance Transit Alternative Study Public Forum Overview of MTA presented by Marian Ott, MTA Board Chair, Planning and Marketing Committee SEPTEMBER 2004
Florida Passenger Rail Vision Plan (2006)
") AMTRAK / FEC CORRIDOR PROJECT OVERVIEW & STATUS The East Coast of Florida is Paradise Regained (slogan from Florida East Coast Railway advertising poster, 1898) FLORIDA STATEWIDE PASSENGER RAIL COMMISSION
AMTRAK / FEC CORRIDOR PROJECT OVERVIEW & STATUS The East Coast of Florida is Paradise Regained (slogan from Florida East Coast Railway advertising poster, 1898) FLORIDA STATEWIDE PASSENGER RAIL COMMISSION
Title VI Service Equity Analysis
 Pierce Transit Title VI Service Equity Analysis Pursuant to FTA Circular 4702.1B September 2013 Service Change February 2013 Page intentionally left blank PIERCE TRANSIT TITLE VI SERVICE EQUITY ANALYSIS
WESTERN EL DORADO COUNTY SHORT AND LONG-RANGE TRANSIT PLAN Executive Summary
 WESTERN EL DORADO COUNTY SHORT AND LONG-RANGE TRANSIT PLAN Executive Summary Prepared for the El Dorado County Transportation Commission Prepared by The El Dorado County Transportation Commission (EDCTC)
REGIONAL TRANSIT CONNECTIONS. Baker Clay Duval Nassau Putnam St. Johns & More!
 REGIONAL TRANSIT CONNECTIONS Baker Clay Duval Nassau Putnam St. Johns & More! Operated by the Baker County Council on Aging www.bakertransit.org (904) 259-9315 Clay Transit Operated by the Clay County
Community Transit Solutions for the Suburbs CTAA Expo June 2014
 Community Transit Solutions for the Suburbs CTAA Expo June 2014 New Suburban Challenges Lower density development patterns Where is the funding to compete with urban and suburban commuter needs? Increased
Sound Transit Operations June 2016 Service Performance Report. Ridership
 Ridership Total Boardings by Mode Mode Jun-15 Jun-16 % YTD-15 YTD-16 % ST Express 1,622,222 1,617,420-0.3% 9,159,934 9,228,211 0.7% Sounder 323,747 361,919 11.8% 1,843,914 2,099,824 13.9% Tacoma Link 75,396
Sound Transit Operations March 2018 Service Performance Report. Ridership
 March 218 Service Performance Report Ridership Total Boardings by Mode Mar-17 Mar-18 % YTD-17 YTD-18 % ST Express 1,622,116 1,47,79-4.6% 4,499,798 4,428,14-1.6% Sounder 393,33 39,6.% 1,74,96 1,163,76 8.3%
Western Placer County Transit Operators Short Range Transit Plan Updates FY to FY Project Update and Alternatives Discussion
 Western Placer County Transit Operators Short Range Transit Plan Updates FY 2018-19 to FY 2024-25 Project Update and Alternatives Discussion Public Workshop Purpose Present various transit service, capital
Transit Peer Comparison
 Transit Peer Comparison October 2016 Based on data from the National Transit Database, US Department of Transportation and the US Census Peer Transit Communities, FY2014 Community County Population Source:
Sound Transit Operations August 2015 Service Performance Report. Ridership
 Ridership Total Boardings by Mode Mode Aug-14 Aug-15 % YTD-14 YTD-15 % ST Express 1,534,241 1,553,492 1.3% 11,742,839 12,354,957 5.2% Sounder 275,403 326,015 18.4% 2,139,086 2,463,422 15.2% Tacoma Link
Sound Transit Operations December 2014 Service Performance Report. Ridership
 Ridership Total Boardings by Mode Mode Dec-13 Dec-14 % YTD-13 YTD-14 % ST Express 1,266,130 1,396,787 10.3% 16,605,299 17,661,976 6.4% Sounder 248,710 285,016 14.6% 3,035,735 3,361,317 10.7% Tacoma Link
Sound Transit Operations January 2018 Service Performance Report. Ridership
 January 218 Service Performance Report Ridership Total Boardings by Mode Jan-17 Jan-18 % YTD-17 YTD-18 % ST Express 1,3,33 1,7,91.3% 1,3,33 1,7,91.3% Sounder 367,33 416,8 13.3% 367,33 416,8 13.3% Tacoma
Public Meeting. December 19 th, 2018
 Public Meeting December 19 th, 2018 AGENDA Welcome Market Analysis Existing Services Peer Evaluation Outreach Summary Recommendations Discussion Next Steps MARKET ANALYSIS 3 Demographics 50% of population
DRT Performance Measurement: the U.S. Experience
 DRT Performance Measurement: the U.S. Experience FOR ANYBODY GOING ANYWHER IN LA HABRA International Conference on Demand Responsive Transportation Breckenridge, Colorado September 2016 DRT Performance
ESCAMBIA COUNTY AREA TRANSIT MTAC REPORT
 ESCAMBIA COUNTY AREA TRANSIT MTAC REPORT November 8, 2017 Meeting Escambia County Area Transit 1515 W. Fairfield Drive Pensacola, FL 32501 850-595-3228 INTRODUCTION 2 Summary Background MTAC ECAT Benchmarks
Minutes of the Third Meeting THE WASHINGTON COUNTY TRANSIT DEVELOPMENT PLAN ADVISORY COMMITTEE
 Minutes of the Third Meeting THE WASHINGTON COUNTY TRANSIT DEVELOPMENT PLAN ADVISORY COMMITTEE Date: May 8, 2013 Time: 9:30 a.m. Place: Conference Room 249 Washington Highway Department 900 Lang Street
TRANSPORTATION SERVICE Actual
 PERFORMANCE REPORT-THIRD QUARTER VISION TO DELIVER REGIONAL MULTI-MODAL TRANSPORTATION SERVICES AND INFRASTRUCTURE IMPROVEMENTS THAT SIGNIFICANTLY AND CONTINUALLY INCREASE TRANSIT MARKET SHARE. MISSION
Date: 11/6/15. Total Passengers
 Total San Diego Metropolitan Transit System POLICY 42 PERFORMANCE MONITORING REPORT Page 1 of 6 OBJECTIVE Develop a Customer-Focused and Competitive System The following measures of productivity and service
STEP ALTERNATIVES RANKING TABLE
 ALTERNATIVES RANKING TABLE Priority Ranking 0 = Lowest Priority 1 2 3 4 5 = Highest Priority Abbreviations TD = Transportation Disadvantaged PWD = People with Disabilities I. Existing Enhancements Increase
Why we re here: For educational purposes only
 Transportation 2050 Why we re here: For educational purposes only Transportation 2050 Bus Elements PUBLIC TRANSIT DEPARTMENT City of Phoenix Citizens Committee on the Future of Phoenix Transportation (CCFPT)
PERFORMANCE REPORT NOVEMBER 2017
 PERFORMANCE REPORT NOVEMBER 2017 Note: New FY2018 Goal/Target/Min or Max incorporated in the Fixed Route and Connection Dashboards. Keith A. Clinkscale Performance Manager INTRODUCTION/BACKGROUND In June
Bristol Virginia Transit
 Bristol Virginia Transit 1 Transit Overview Bristol Virginia Transit (BVT) is a Federally Funded and certified urban area transit system. BVT began operation in its current form in 1982. In Fiscal Year
PREFACE. Service frequency; Hours of service; Service coverage; Passenger loading; Reliability, and Transit vs. auto travel time.
 PREFACE The Florida Department of Transportation (FDOT) has embarked upon a statewide evaluation of transit system performance. The outcome of this evaluation is a benchmark of transit performance that
SAMTRANS TITLE VI STANDARDS AND POLICIES
 SAMTRANS TITLE VI STANDARDS AND POLICIES Adopted March 13, 2013 Federal Title VI requirements of the Civil Rights Act of 1964 were recently updated by the Federal Transit Administration (FTA) and now require
Peer Performance Measurement February 2019 Prepared by the Division of Planning & Market Development
 2017 Regional Peer Review Peer Performance Measurement February 2019 Prepared by the Division of Planning & Market Development CONTENTS EXECUTIVE SUMMARY... 3 SNAPSHOT... 5 PEER SELECTION... 6 NOTES/METHODOLOGY...
PLEASE READ Proposal for Sustainable Service
 IMPORTANT PLEASE READ 019 Proposal for Sustainable Service 019 Service Change Proposal IMPLEMENT A SUSTAINABLE NETWORK Everett Transit completed its Long Range Plan in May, and the plan was adopted by
Sound Transit Operations February 2018 Service Performance Report. Ridership
 February 218 Service Performance Report Ridership Total Boardings by Mode Feb-17 Feb-18 % YTD-17 YTD-18 % ST Express 1,373,96 1,372,88 -.1% 2,877,294 2,88,719.1% Sounder 314,96 32,187 11.9% 681,923 768,69
DRAFT Service Implementation Plan
 2017 Service Implementation Plan October 2016 SECTION NAME 2017 Service Implementation Plan October 2016 2017 SERVICE IMPLEMENTATION PLAN TABLE OF CONTENTS Table of Contents... I List of Tables... III
CRYSTAL BEACH EMERALD COAST PKWY, DESTIN, FL 32541
 RETAIL SPACE AVAILABLE PROPERTY SUMMARY Available SF: Space Type: Property Size: Building Size: 1,495 SF Retail (NNN) 9.5 Acres 57,714 SF PROPERTY OVERVIEW The Crystal Beach Plaza is strategically located
Central Oregon Intergovernmental Council
 Central Oregon Intergovernmental Council Regional Transit Master Plan (RTMP) Technical Advisory Committee March 8, 2013 Agenda Introductions (5 min) Project Update (5 min) Updated Demand Estimates (5 min)
Ridership Growth Strategy (RGS) Status Update
 Status Update") For Information Ridership Growth Strategy (RGS) Status Update Date: July 10, 2018 To: TTC Board From: Deputy Chief Executive Officer Summary The TTC s Ridership Growth Strategy (RGS), with all its components,
For Information Ridership Growth Strategy (RGS) Status Update Date: July 10, 2018 To: TTC Board From: Deputy Chief Executive Officer Summary The TTC s Ridership Growth Strategy (RGS), with all its components,
Bus Operations Report
 Third Quarter FY 216 (January 1 - March 31, 216) Wednesday April 27, 216 Operations Ridership: 783,194 passengers used in the third quarter. This represents a 2% increase over the same period in FY 215.
Moving Forward: SFRTA Projects & Initiatives. ULI Southeast Florida/Caribbean Infrastructure Committee July 27, 2011
 Moving Forward: SFRTA Projects & Initiatives ULI Southeast Florida/Caribbean Infrastructure Committee July 27, 2011 What is SFRTA? A body politic and agency of the state. Created on July 1, 2003, by an
Ozaukee County Transit Development Plan
 Ozaukee County Transit Development Plan Record of Public Comments and Recommended Transit Service Plan June 5, 2018 Kevin Muhs Deputy Director #242846 Status of the Transit Development Plan Existing Conditions
981 U.S 98, DESTIN, FL // FOR LEASE 98 PALMS 981 U.S 98, DESTIN, FL HARRY BELL Broker Associate D
 981 U.S 98, DESTIN, FL // PROPERTY SUMMARY Available SF: Lease Rate: Space Type: Building Size: Cross Streets: Traffic Count: 2,800 SF $19/SF(NNN) Retail 84,682 SF Holiday Isle & Emerald Coast Pkwy 60,000
About This Report GAUGE INDICATOR. Red. Orange. Green. Gold
 ATTACHMENT A About This Report The Orange County Transportation Authority (OCTA) operates a countywide network of local, community, rail connector, and express bus routes serving over 6, bus stops. OCTA
Caroline County / King George County Transit Studies. Meeting November 1, 2017
 Caroline County / King George County Transit Studies Meeting November 1, 2017 1 FRED Routes C1 and C2 C1 C2 Caroline County Total FRED Total Ridership (FY 2017) 4,527 2,870 7,397 377,042 Revenue Hours
Att. A, AI 46, 11/9/17
 Total s San Diego Metropolitan Transit System POLICY 42 PERFORMANCE MONITORING REPORT Page 1 of 6 Date: 11/8/17 OBJECTIVE Develop a Customer-Focused and Competitive System The following measures of productivity
Sound Transit Operations January 2017 Service Performance Report. Ridership. Total Boardings by Mode
 January 217 Service Performance Report Ridership ST Express Sounder Tacoma Link Link Paratransit Jan-16 Jan-17 % 1,433,7 1,3,33 4.9% 331,27 7,121 98,411 3,633 Total Boardings by Mode 363,6 74,823 1,76,914
Creating Sustainable Communities Through Public Transportation
 Creating Sustainable Communities Through Public Transportation 21 st Transportation Committee January 16, 2008 Keith T. Parker Chief Executive Officer Charlotte Area Transit System (CATS) Charlotte Mecklenburg
FY Transit Needs Assessment. Ventura County Transportation Commission
 FY 18-19 Transit Needs Assessment Ventura County Transportation Commission Contents List of Figures and Appendices.. 2 Appendices... 1 Chapter 1: Introduction What is the Ventura County Transportation
CHAPTER 5: Operations Plan
 CHAPTER 5: Operations Plan Report Prepared by: Contents 5 OPERATIONS PLAN... 5-1 5.1 Proposed Service Changes... 5-2 5.1.1 Fiscal Year 2017... 5-2 5.1.2 Fiscal Year 2018... 5-6 5.1.3 Fiscal Year 2019...
General Issues Committee Item Transit Operating Budget Ten Year Local Transit Strategy
 General Issues Committee Item 4.1 2017 Transit Operating Budget Ten Year Local Transit Strategy January 27, 2017 Presentation Outline 2017 Operating Budget Overview Ten Year Local Transit Strategy 2 2017
Sound Transit Operations March 2017 Service Performance Report. Ridership. Total Boardings by Mode
 March 217 Service Performance Report Ridership ST Express Sounder Tacoma Link Link Paratransit Mar-16 Mar-17 % 1,83,4 1,621,49 2.4% 37,496 82,631 1,264,47 3,821 Total Boardings by Mode 389,98 87,39 1,89,43,297
2 YORK REGION TRANSIT MOBILITY PLUS 2004 SYSTEM PERFORMANCE REVIEW
 2 YORK REGION TRANSIT MOBILITY PLUS 2004 SYSTEM PERFORMANCE REVIEW The Joint Transit Committee and Rapid Transit Public/Private Partnership Steering Committee recommends the adoption of the recommendation
Development of SH119 BRT Route Pattern Alternatives for Tier 2 - Service Level and BRT Route Pattern Alternatives
 Development of SH119 BRT Route Pattern Alternatives for Tier 2 - Service Level and BRT Route Pattern Alternatives June 1, 2018 Development of SH119 BRT Route Pattern Alternatives for Tier 2 - Service Level
Sound Transit Operations January 2014 Service Performance Report. Ridership
 Ridership Total Boardings by Mode Mode Jan-13 Jan-14 % YTD-13 YTD-14 % ST Express 1,343,290 1,426,928 6.2% 1,343,290 1,426,928 6.2% Sounder 245,135 256,775 4.7% 245,135 256,775 4.7% Tacoma Link 86,229
CURRENT SHORT-RANGE TRANSIT PLANNING PRACTICE. 1. SRTP -- Definition & Introduction 2. Measures and Standards
 CURRENT SHORT-RANGE TRANSIT PLANNING PRACTICE Outline 1. SRTP -- Definition & Introduction 2. Measures and Standards 3. Current Practice in SRTP & Critique 1 Public Transport Planning A. Long Range (>
The Importance of Service Frequency to Attracting Ridership: The Cases of Brampton and York
 The Importance of Service Frequency to Attracting Ridership: The Cases of Brampton and York Jonathan English Columbia University CUTA Conference May 2016 Introduction Is density the most important determinant
COLT RECOMMENDED BUSINESS PLAN
 COLT RECOMMENDED BUSINESS PLAN 2008 INTRODUCTION The past decade has been one of change in Lebanon County and this situation is expected to continue in the future. This has included growth in population,
Presentation to the DRCOG Board August 16, 2017
 Presentation to the DRCOG Board August 16, 2017 Systemwide FY 2015-2016 July June FY 2016-2017 July June Riders 102,577 155,864 Revenue $1,014,781 $1,551,435 Fare Recovery FY = State Fiscal Year. 38% 53%
Fare Policy Discussion Background and History
 Fare Policy Discussion Background and History Transportation Committee Nick Eull Senior Manager of Revenue Operations February 27 th, 2017 2013 Fare Policy Analysis Report Cross-functional group comprised
PUBLIC TRANSIT IN KENOSHA, RACINE, AND MILWAUKEE COUNTIES
 PUBLIC TRANSIT IN KENOSHA, RACINE, AND MILWAUKEE COUNTIES #118404v1 Regional Transit Authority June 19, 2006 1 Presentation Overview Existing Public Transit Transit System Peer Comparison Recent Transit
COUNCIL AGENDA REPORT
 COUNCIL AGENDA REPORT Meeting Date: 6 June 2016 Subject: Boards Routed Through: 2017 Airdrie Transit s Community Services Advisory Board Date: 9 May 2016 Issue: Council is being asked to endorse the 2017
Terrace Regional Transit System CITY OF TERRACE COMMITTEE OF THE WHOLE SEPTEMBER 13, 2017
 Terrace Regional Transit System CITY OF TERRACE COMMITTEE OF THE WHOLE SEPTEMBER 13, 2017 1 Purpose To update Council on the system performance of the Terrace Regional Transit System Presentation Topics
AUGUST 5, 2010 UPDATE # 3 AMTRAK/FEC PROJECT: STATION LOCATIONS AND CONCEPTUAL DRAWINGS
 AUGUST 5, 2010 UPDATE # 3 AMTRAK/FEC PROJECT: STATION LOCATIONS AND CONCEPTUAL DRAWINGS The Summer of 2010 has been a time of tremendous progress for the Amtrak/FEC Corridor project and its goal of restoring
Washington Metropolitan Area Transit Authority Services Utilization Study
 Washington Metropolitan Area Transit Authority Services Utilization Study Maryland House Bill 300 Table of Contents Page 2 Executive Summary Slide 3 Notes Slide 4 Metro Systemwide Fact Sheet Slide 5 How
Monthly Economic Data Summary South Region
 Monthly Economic Data Summary South Region December 2018 Regions Bank Economics Division Richard F. Moody Chief Economist Greg McAtee Senior Economist Economics Division Nonfarm Employment, ths % change
DISTRICT EXPRESS LANES ANNUAL REPORT FISCAL YEAR 2017 JULY 1, 2016 JUNE 30, FloridaExpressLanes.com
 DISTRICT EXPRESS LANES ANNUAL REPORT FISCAL YEAR 2017 JULY 1, 2016 JUNE 30, 2017 FloridaExpressLanes.com This page intentionally left blank. TABLE OF CONTENTS List of Figures... ii List of Tables.... ii
Update of the 2016 TDP and Community Involvement. HART Board Meeting September 14, 2015
 Update of the 2016 TDP and Community Involvement HART Board Meeting September 14, 2015 Transit Development Plan (TDP) 10-year business plan FDOT requirement Major update every 5 years FY2012 major update
TTI REVIEW OF FARE POLICY: PRELIMINARY FINDINGS
 TTI REVIEW OF FARE POLICY: PRELIMINARY FINDINGS December 2014 STATUS: TTI REVIEW OF FARE POLICY Goal: Identify and evaluate different options for a revised fare structure, including pricing strategies
Maryland Department of Transportation The Secretary's Office
 December 13, 2013 Maryland Department of Transportation The Secretary's Office Martin O'Malley Govemor Anthony G. Brown Lt. Govemor James T. Smith, Jr. Secretary The Honorable Edward J. Kasemeyer Chair,
Sarasota County Area Transit Express Bus and North Port Park and Ride
 Sarasota County Area Transit Express Bus and North Port Park and Ride City of North Port Commission and Sarasota County Commissioners Joint Meeting March 20, 2010 SCAT Update for North Port Park and Ride
A1A North Corridor Multi-Use Trail. Vilano to Ponte Vedra Beach
 A1A North Corridor Multi-Use Trail Vilano to Ponte Vedra Beach The A1A North Corridor Community Area comprised of five unincorporated areas: Porpoise Point Vilano Beach Surfside Beach North Beach South
Score. Category. Access Aesthetics Community Resources
 NO BUILD ALTERNATIVE The No Build Alternative is the do nothing option that is used for comparison to the build alternatives. The screening assumes no new facilities are constructed as part of the I-93
Valley Transit Strategic Plan
 Valley Transit Strategic Plan Task 1 - Existing Conditions Technical Memo Final City of Appleton, Valley Transit May 2014 Table of Contents Executive Summary... 1 Community Characteristics... 1 Overview
Title VI Service Equity Analysis
 Pierce Transit Title VI Service Equity Analysis Pursuant to FTA Circular 4702.1B NE Tacoma Service May 2016 Pierce Transit Transit Development Dept. PIERCE TRANSIT TITLE VI SERVICE EQUITY ANALYSIS TABLE
YOSEMITE AREA REGIONAL TRANSPORTATION SYSTEM
 YOSEMITE AREA REGIONAL TRANSPORTATION SYSTEM Short Range Transit Plan Prepared for the Merced County Association of Governments/YARTS Prepared by LSC Transportation Consultants, Inc. YOSEMITE AREA REGIONAL
Pinellas Suncoast Transit Authority Community Bus Plan
 Pinellas Suncoast Transit Authority Community Bus Plan FINAL REPORT JANUARY 2014 Prepared by: TABLE OF CONTENTS Executive Summary... 2 Community Bus Plan Introduction... 22 Previous Studies... 25 Market
Welcome. Sign in Pick up comment form Visit stations to learn more Submit your comment form
 PROPOSED FARE CHANGES Welcome Sign in Pick up comment form Visit stations to learn more Submit your comment form We re considering a new fare policy The Sound Transit Board of Directors is considering
METROPOLITAN EVANSVILLE TRANSIT SYSTEM Part I: Comprehensive Operations Analysis Overview July 9 th, 2015 Public Information Meeting
 METROPOLITAN EVANSVILLE TRANSIT SYSTEM Part I: Comprehensive Operations Analysis Overview July 9 th, 2015 Public Information Meeting AGENDA 5:30 5:40 Open House 5:40 6:30 Presentation Comprehensive Operations
SARASOTA COUNTY GOVERNMENT CITIZENS ADVISORY COMMITTEE FOR PUBLIC TRANSPORTATION MINUTES THURSDAY, January 8, 2015
 Administration Center Training Room 1 st Floor Committee Members Present Dorothy Hudson, Chair Frederic Bigio, Vice Chair Scott Whiterell Steve Bruegger Ronald Collins SCAT Personnel Present Rocky Burke,
Board of Directors Information Summary
 Regional Public Transportation Authority 302 N. First Avenue, Suite 700, Phoenix, Arizona 85003 602-262-7433, Fax 602-495-0411 Board of Directors Information Summary Agenda Item #6 Date July 11, 2008 Subject
Quarterly Report Transit Bureau, Local Transit Operations. First Quarter, Fiscal Year 2015 (July 2014 September 2014) ART & STAR
 ART & STAR") Quarterly Report Transit Bureau, Local Transit Operations First Quarter, Fiscal Year 2015 (July 2014 September 2014) ART & STAR A Arlington Transit ART 1) Introduction The purpose of ART is to provide
Quarterly Report Transit Bureau, Local Transit Operations First Quarter, Fiscal Year 2015 (July 2014 September 2014) ART & STAR A Arlington Transit ART 1) Introduction The purpose of ART is to provide
FY Year End Performance Report
 Overall Ridership Big Blue Bus carried 18,748,869 passengers in FY2014-2015, a 0.3% reduction from the year prior. This negligible reduction in ridership represents the beginnings of a reversal from a
Transportation Development Plan Janesville Transit System
 Transportation Development Plan Janesville Transit System Final Report Prepared for City of Janesville Janesville Transit System Janesville Metropolitan Planning Organization Prepared by Urbitran Associates,
St. Augustine Aquarium Outparcel Available
 FOR SALE > LAND St. Augustine Aquarium Outparcel Available.62± ACRES Available St. Augustine Outlet Mall Stat e Ro ad 1 6 OUTPARCEL AVAILABLE FUTURE SITE OF ST. AUGUSTINE AQUARIUM Listing Comments >> Outparcel
Matt Miller, Planning Manager Margaret Heath-Schoep, Paratransit & Special Projects Manager
 DATE May 2, 218 Item #12 TO FROM GCTD Board of Directors Matt Miller, Planning Manager Margaret Heath-Schoep, Paratransit & Special Projects Manager MS SUBJECT I. EXECUTIVE SUMMARY This quarterly report
Chapter 3. Burke & Company
 Chapter 3 Burke & Company 3. WRTA RIDERSHIP AND RIDERSHIP TRENDS 3.1 Service Overview The Worcester Regional Transit Authority (WRTA) provides transit service to over half a million people. The service
Table of Contents. TRANSIT DEVELOPMENT PLAN UPDATE i
 Table of Contents Chapter 1. Introduction... 1 Chapter 2. Financial Review... 3 2.1 Operating Costs... 3 2.2 Capital Costs... 3 2.3 Revenues... 4 2.4 Overall Funding Implications... 4 Chapter 3. Service
Greater Portland Transit District
 Greater Portland Transit District TO: FROM: Freeport Town Council Greg Jordan - Metro General Manager DATE: September 10, 2014 SUBJECT: Metro Request to Pursue Grant Funding for Trial Express Bus Service
PERFORMANCE REPORT JANUARY Keith A. Clinkscale Performance Manager
 PERFORMANCE REPORT JANUARY 2018 Keith A. Clinkscale Performance Manager INTRODUCTION/BACKGROUND Keith A. Clinkscale Performance Manager FIXED ROUTE DASHBOARD JANUARY 2018 Safety Max Target Goal Preventable
PERFORMANCE REPORT DECEMBER 2017
 PERFORMANCE REPORT DECEMBER 2017 Note: New FY2018 Goal/Target/Min or Max incorporated in the Fixed Route and Connection Dashboards. Keith A. Clinkscale Performance Manager INTRODUCTION/BACKGROUND Keith
VCTC Intercity Five-Year Service Plan
 VENTURA COUNTY SHORT RANGE TRANSIT PLAN VCTC Intercity Five-Year Service Plan June 2015 Table of Contents Page 1 Executive Summary...1-1 Introduction... 1-1 Plan Development... 1-1 2 Service Evaluation...2-1
Potomac River Commuter Ferry Feasibility Study & RPE Results
 1.1 Introduction The Prince William County Department of Transportation conducted a route proving exercise (RPE) and feasibility study of a proposed commuter ferry service on the Potomac River between
LODI CITY COUNCIL Carnegie Forum 305 West Pine Street, Lodi
 TM LODI CITY COUNCIL Carnegie Forum 305 West Pine Street, Lodi "SHIRTSLEEVE" SESSION Date: March 26, 2019 Time: 7:00 a.m. *and via conference call: 1311 Midvale Road Lodi, CA 95240 For information regarding
Aviation Operating Administration/Executive
 Aviation Operating Administration/Executive To provide the executive and administrative support necessary to the Divisions within the Aviation Department to ensure continued efficiencies, effectiveness,
Fare Revenue Report 2016 FARE REVENUE REPORT
 FARE REVENUE REPORT Table of Contents Overview 3 Sound Transit Key Operational Milestones 4 Fare Structure 5 ST Express 5 Sounder 5 Link 6 Tacoma Link 7 Farebox Recovery 7 ST Express 7 Sounder 8 Link 8
RTA ScoreCard December 2009
 Background and Context RTA ScoreCard December 2009 Chapter 25 of the Acts of 2009 modernized the transportation systems of the Commonwealth and created the new MassDOT. Section 6 of this law established
Sarasota County Area Transit
 Sarasota County Area Transit AL EXECUTIVE SUMMARY The purpose and intent of this project is to perform an organizational evaluation of Sarasota County Area Transit to provide a baseline from which to evaluate
MONTHLY REPORT SEPTEMBER 2017
 MONTHLY REPORT 2017 SUN SHUTTLE RIDERSHIP ROUTE PASSENGERS: CURRENT YEAR PRIOR YEAR AMOUNT PERCENTAGE BUDGET AMOUNT PERCENTAGE TOTAL PASSENGERS 17,250 20,318 (3,068) -15.1% 18,231 (981) -5.4% CALENDAR