Valley Transit Strategic Plan
|
|
|
- Darcy Neal
- 5 years ago
- Views:
Transcription

1 Valley Transit Strategic Plan Task 1 - Existing Conditions Technical Memo Final City of Appleton, Valley Transit May 2014
2 Table of Contents Executive Summary... 1 Community Characteristics... 1 Overview of Valley Transit Service... 2 Organization and Staffing... 2 Operational Efficiency... 3 Funding... 3 Summary... 3 Valley Transit Community Characteristics... 4 Population Density... 4 Automobile Ownership... 4 Senior Population... 7 Income... 7 Employment... 8 Transit Oriented Development Overview of Valley Transit Fixed Route Service Paratransit The Connector Call-A-Ride Fleet and Facilities Fleet Operations Facility Transfer Facilities Level of Service Assessment Service Coverage Service Frequency Service Span Operating Characteristics Existing Conditions i Valley Transit
3 Valley Transit Rider Profile (2014 On-Board Survey) Organization and Staffing Management Support Functions Functional Areas Budgeting Purchasing and Contracting Revenue Handling Personnel Supervision Planning Peer System Assessment Performance Measures Cost Effectiveness Service Efficiency Service Effectiveness Market Penetration Service Availability Revenue Effectiveness Transit Funding Public Transit Operating Aids: Wisconsin Department of Transportation Chapter and Federal Transit Administration Section Wisconsin Chapter Specialized Transportation Assistance for Counties Other Human Service Transportation Programs Title XIX Non-Emergency Medical Transportation Program Publicly Funded Long-term Care Programs Federal Transit Administration Section 5339 Bus and Bus Facilities Program Local Funding Sources Local Share of Operating Assistance Passenger Fares and Other Revenues Existing Conditions ii Valley Transit
4 Appendix A: Recommendations from Previous Plans Market/Customer Research Consumer Telephone Survey (2008) Transit Development Plan (2009) Comprehensive Operations Analysis (2010) Transit System Management Performance Review (2012) Community Perception Project (2013) On-Board Survey (2014) Existing Conditions iii Valley Transit
5 Executive Summary Valley Transit provides transit service to the Fox Cities area, including the City of Appleton, City of Kaukauna, City of Menasha, City of Neenah, Town of Buchanan, Town of Grand Chute, Town of Harrison, Town of Menasha, Village of Kimberly, Village of Little Chute, Calumet County, Outagamie County, and Winnebago County. The service area covers 117 square miles on the north end of Lake Winnebago and serves a population of roughly 188,000. A review of existing information, data and previously completed plans was conducted to provide a framework for discussion for the Transit Strategic Plan. Previously completed plans that were reviewed include: 2008 Valley Transit Market and Customer Telephone Survey, 2009 Transit Development Plan, 2010 Comprehensive Operations Analysis, 2012 System Management Performance Review, 2013 Focus Group/Interview Report, and the 2014 On-Board Rider Survey. The review included a high-level summary and assessment of the following areas: Community characteristics Overview of Valley Transit Service Organization and Staffing Operational Efficiency (Peer System Assessment) Transit Funding Highlights of this review are described in the following sections. Community Characteristics Several demographic factors were studied to help identify trends that may impact transit use. These factors include, population and employment density, automobile ownership, income, and age. Valley Transit provides fixed-route transit to the highest population and employment areas; however, there are some areas in the northwestern part of the city, Neenah, Little Chute, and Kaukauna, and the Town of Greenville that have areas with densities that could support future transit service. Appleton is an attractor of area-wide work trips. Almost 48,000 workers commute into Appleton, while nearly 21,000 workers commute outward. When looking at population and employment density, Valley Transit currently serves approximately 74 percent of the transitsupportive areas within the service area. According to 2012 American Community Survey data, about one percent of commuters with trip origins in Appleton commute via public transportation. This indicates that a large number of residents in the Fox Cities use automobiles more than transit. In the Fox Cities, Existing Conditions 1 Valley Transit
6 the average percentage of households that do not have access to an automobile is 4.5 percent. Opportunity for dramatic mode-shift is limited due to the dominance of the automobile, but improvements can be made to increase ridership and improve the experience for core users. Overview of Valley Transit Service Valley Transit s core service consists of 18 fixed bus routes with service from 5:45 a.m. to 10:30 p.m. on weekdays and 7:45 a.m. to 10:30 p.m. on Saturdays. Most routes operate with headways of 30 minutes during peak periods and 60 minutes during off-peak period. No Sunday service is provided. Paratransit and demand response services are also provided. Previous plans and studies have identified areas in the Fox Cities for potential expansion of the Valley Transit service area. This includes circulator routes in Kaukauna and Grand Chute and other services in the region. There is also an opportunity to build up service in the core of Appleton by adding frequency. There are also opportunities to strengthen connections to other regional providers in Green Bay and Oshkosh. Consideration should be given to adding service on Sundays as well. In early 2014, a rider survey was conducted to collect data on the customers of Valley Transit, identify transit use patterns, and assess satisfaction with current transit service. The survey revealed that most Valley Transit riders, 58 percent, rely on transit in that they have neither a vehicle nor a license to drive. Over half (54 percent) of all Valley Transit trips are going to and from work. The majority of riders (96 percent) are satisfied with current Valley Transit service. Organization and Staffing Valley Transit is a department of the City of Appleton. It is overseen by a transit commission comprised of nine seats with eight current members who meet twice a month. Commission members include two elected Aldermen from the City of Appleton, three citizens of Appleton, and one member each from Heart of the Valley (rotates between Kaukauna, Kimberly, Buchanan), one seat alternates between Neenah and Menasha, and one seat alternates between Grand Chute and Town of Menasha. The ninth seat is reserved for a member from the County, but has remained vacant in recent years. Valley Transit is managed by six full-time management employees: the General Manager, the Assistant General Manager, the Administrative Services Manager, the Operations Supervisor, the Paratransit Coordinator/Relief Operations Supervisor and the Maintenance Supervisor. Valley Transit has a total staff of approximately 54 full-time equivalents. Recent studies have not indicated any issues with the administrative structure of Valley Transit. Existing Conditions 2 Valley Transit
7 Operational Efficiency Recent performance reviews have not indicated any critical issues with the efficiency of the fixed route service. There are some indicators of increasing cost and mileage, but revenues are also steadily higher than national peers. Land use patterns and urbanization in the Fox Cities will continue to stretch the resources of Valley Transit as transit is most efficient when it serves areas of high population density. Valley Transit provided about 1.3 million rides last year, and the overwhelming majority of that service was provided via fixed route bus. The level of rides generated per capita is low compared to peers, but the trend over the past five years has been improving. The amount of service provided on a per capita basis is also low compared to peers, but that also has been improving over the last five years. Significant administrative resources are devoted to various demand-responses and contracted transit operations that serve a comparatively small segment of the ridership. In developing the Strategic Plan, these services (which are less efficient than the fixed route) will be evaluated as they relate to Valley Transit s strengths and opportunities. Funding Valley Transit is supported by various funding sources, including assistance programs from the FTA, the State of Wisconsin, local support from the ten municipalities, three counties and eight non-profits/private companies in the Valley Transit service area, and user fares. Currently the local share of funding is primarily built up from local government contributions via property tax revenue. A dedicated sales tax has been pursued in the past through RTA legislation at the state level; however this type of authority has not been passed for the Appleton area. An RTA would provide a stable funding source for both capital and operating aids, as would other forms of partnerships that have been established in peer communities. Like many mid-sized and small bus systems, Valley Transit faces a challenge of not having any dedicated funding source for capital items such as vehicles or facility improvements. Its bus fleet is aging, and federal funding for vehicle replacement has declined significantly. The current facilities serve the transit system well, however the cost to maintain and upgrade these items is an area of future concern. Summary The review of existing information, data and previously completed plans found that there are no major issues with the current Valley Transit system. The Valley Transit system is a wellfunctioning system; however, to grow ridership and improve service for existing riders, some modifications should be considered. The Transit Strategic Plan will help identify growth areas and opportunities for Valley Transit based on stakeholder and public input. Existing Conditions 3 Valley Transit
8 Valley Transit Community Characteristics Valley Transit provides transit service to the Fox Cities area, including the City of Appleton, City of Kaukauna, City of Menasha, City of Neenah, Town of Buchanan, Town of Grand Chute, Town of Harrison, Town of Menasha, Village of Kimberly, Village of Little Chute, Calumet County, Outagamie County, and Winnebago County. The service area covers 117 square miles on the north end of Lake Winnebago and serves a population of roughly 188,000. It is important to understand the demographic indicators of these communities to better recognize how they may impact the transit market. These indicators are explained in the following sections. Population Density The population density of the Fox Cities, presented in persons per square mile is presented in Figure 1. Areas with the highest densities are in darker colors. Most of the high density areas are served by fixed route transit with the exception of some areas in the City of Appleton north of Highway 41, portions of the City of Kaukauna, and portions of the Town of Harrison. Automobile Ownership Automobile ownership is indicative of transit reliance. In this section, each portion of the Valley Transit service area is compared by two measures: households with zero vehicles and households with one vehicle. Households that have no automobiles rely on transit, walking, ridesharing, or bicycling to meet mobility needs. Residents of these households are often the core of a transit market in a mid-sized urban area. Additionally, households with only one vehicle benefit from the flexibility that transit offers. Transit can allow a household with multiple members to save money by only paying to own and maintain one car, and allow for people to have meaningful job access if commute patterns change. In Table 1 a summary of vehicle ownership in the Valley Transit service area is presented. Existing Conditions 4 Valley Transit
9 Table 1. Regional Vehicle Ownership Zero Vehicle Households (% of Population) Single Vehicle Households (% of Population) City of Appleton 6.6% 33.8% City of Neenah 6.5% 34.5% City of Menasha 4.2% 39.0% City of Kaukauna 7.3% 28.5% Town of Buchanan 1.5% 17.2% Town of Harrison 1.2% 14.6% Town of Menasha 5.2% 33.5% Town of Grand Chute 5.4% 39.4% Village of Combined Locks 0.4% 16.7% Village of Kimberly 7.9% 37.4% TRI-COUNTY AVERAGE 4.5% 28.8% WISCONSIN AVERAGE 7.0% 32.2% In Calumet, Outagamie, and Winnebago Counties, the average percentage of households that do not have access to an automobile is 4.5 percent. This is below the State of Wisconsin average which is 7.0 percent. The City of Kaukauna and the Village of Kimberly have the greatest percentage of households with zero vehicles, with 7.3 percent and 7.9 percent respectively. Appleton, Neenah, the City of Menasha, the Town of Menasha, Grand Chute, and Kimberly all have above average percentages of households with only one vehicle. Existing Conditions 5 Valley Transit

10 Figure 1. Population Density Existing Conditions 6 Valley Transit
11 Senior Population The senior population is a core component of a transit market. In Table 2, the senior population (adults over 65) of each community in the Valley Transit service area is presented. The average senior population for the region is approximately 12.2 percent. Most communities in the service area are consistent with that average. The communities with the lowest percentage of people over the age of 65 are the Towns of Buchanan and Harrison, while those with the highest percentage of individuals over the age of 65 are the Villages of Combined Locks and Kimberly. Table 2. Senior Population Percent Senior Population City of Appleton 12.0% City of Neenah 12.3% City of Menasha 12.7% City of Kaukauna 12.2% Town of Buchanan 5.9% Town of Harrison 8.1% Town of Little Chute 12.5% Town of Menasha 14.3% Town of Grand Chute 14.2% Village of Combined Locks 15.8% Village of Kimberly 16.7% TRI-COUNTY AVERAGE 12.2% WISCONSIN AVERAGE 13.8% Income Income and poverty status are also indicators of transit use. In Table 3, economic characteristics such as median household income and percent of households that are below the poverty level are shown. The regional average for poverty status is approximately 7.1 percent, which is below the State average of 12.5 percent. The community with the lowest median household income and highest incidence of poverty is the City of Menasha. Conversely, the most affluent communities are the Town of Buchanan, with a median household income of over $85,000 and the Village of Combined locks with a less than one percent poverty rate. Existing Conditions 7 Valley Transit
12 Table 3. Regional Income Median Household Income Percent in Poverty Status City of Appleton $51, % City of Neenah $51, % City of Menasha $41, % City of Kaukauna $53, % Town of Buchanan $85, % Town of Little Chute $57, % Town of Harrison $83, % Town of Menasha $55, % Town of Grand Chute $52, % Village of Combined Locks $72, % Village of Kimberly $44, % TRI-COUNTY AVERAGE $58, % WISCONSIN AVERAGE $51, % Employment Employment density within the Fox Cities is shown, measured in jobs per square mile, in Figure 2. This shows where the concentrations of jobs are in the region. The highest concentrations of employment are located in downtown Appleton and Neenah, with additional regional centers in outlying parts of Appleton along major highway corridors (Highway 41 and Highway 441), and Grand Chute. Figure 3 shows some of the Fox Cities regionally significant destinations. Valley Transit s expansive service area is a characteristic that sets it apart from some of its peer systems. The service area includes multiple counties, as well as many cities, towns, and villages from Neenah to Kaukauna that make up the Appleton Urbanized Area. A market where there may be latent demand is workforce transportation. In addition to Appleton Proper, Menasha, Grand Chute, Kaukauna, and businesses along the Highway 41 Corridor make up major concentrations of employment in the region. According to recent Census data, 47,709 workers commute into Appleton from points outside of the city, and 20,719 Appleton residents commute to a workplace outside of Appleton each day, as shown in Figure 4. Existing Conditions 8 Valley Transit

13 Figure 2. Employment Density Existing Conditions 9 Valley Transit

14 Figure 3. Community Characteristics Existing Conditions 10 Valley Transit
.")
15 Figure 4. Appleton Commute Patterns According to 2012 American Community Survey data, about one percent of commuters with trip origins in Appleton commute via public transit. In that same data set, the transit mode share for work trips is approximately 0.6 percent of the population of the Appleton Metropolitan Statistical Area (region). Transit Oriented Development Downtown redevelopment at higher densities in Appleton is one example of land use that supports a system of multi-modal travel options. Most existing routes concentrate in the downtown area. Combined with a strong downtown pedestrian network and a good bicycle network, transit provides the third mode choice that will be used by young adults and others who are willing to change travel behaviors. As downtowns in Appleton, Neenah, Menasha, and the Heart of the Valley experience redevelopment and become stronger commercial hubs, and add population, Valley Transit has the opportunity to capture a significant share of the local travel market with a focused investment in additional bus service. Existing Conditions 11 Valley Transit
16 Overview of Valley Transit The City of Appleton has operated public transit service since its acquisition of Fox River Bus Lines in January The following sections provide an overview of existing transit service in the Fox Cities. Fixed Route Service Valley Transit s core service consists of 17 fixed bus routes with service from 5:45 a.m. to 10:30 p.m. on weekdays and 7:45 a.m. to 10:30 p.m. on Saturdays. Most routes operate with headways of 30 minutes during peak periods and 60 minutes during off-peak period. Valley Transit also provides three limited service school tripper routes. These routes operate from September through June with a single a.m. and single p.m. trip each. The peak vehicle requirement for all service is 21 vehicles with the tripper service and 18 vehicles without. Figure 2 shows the current Valley Transit system map. The fare structure for fixed-route service is outlined in Table 4. Table 4. Fixed Route Fare Structure Fare Category Cash Unlimited Day Pass 10-Ride Ticket 30-Day Pass Basic $1.80 $5.00 $15.00 $56.00 Senior (65+)/Disabled $ $9.00 $40.00 Children (4 and under) FREE Kids on the Go (under 18; chaperoned groups of 6-28) $ Existing Conditions 12 Valley Transit

17 Figure 5. Valley Transit System Map Existing Conditions 13 Valley Transit
18 Paratransit Valley Transit s paratransit service, complimentary to the fixed-route service per guidelines in the Americans with Disabilities Act (ADA), is known as by Valley Transit II. The program is administered by Valley Transit with service provided through a contract with Running, Inc., headquartered in Viroqua, WI. The service is available to ADA certified customers in the Cities of Appleton, Kaukauna, Menasha, Neenah, Grand Chute, Buchanan, Harrison; the Villages of Kimberly, Little Chute; the Town of Menasha; and areas within ¾-miles of fixed route service who cannot use existing fixed route service. Service is also provided to seniors, aged 60 and over, living in Outagamie or Calumet Counties. Valley Transit II operates service for ADA passengers from 5:30 a.m. to 10:30 p.m. Monday- Friday, and 7:30 a.m. to 10:30 p.m. Saturday. Additional demand response service is provided on Sunday from 7:30 a.m. to 2:00 p.m. Service for non-ada older adults is provided 9:00 a.m. to 5:00 p.m. Monday-Friday. Two types of paratransit service are provided at different fare levels: Basic refers to door-todoor service; Premium refers to service that requires the driver to leave the vehicle unattended or out of sight, or when assistance is required beyond the first doorway. The fare structure for this service is shown in Table 5. Table 5. Valley Transit II Fare Structure Fare Category Cash 10-Ride Pass Basic, Monday-Saturday $3.60 $36.00 Premium, Monday-Saturday $6.00 $60.00 Sunday $ The Connector The Connector is a demand response service that extends service beyond the fixed route boundaries. The Connector s service area is bounded by Highway JJ to the north, Harwood Road to the east, County Road G to the south, and Highway 76 to the west and excludes areas within ¼-mile of existing fixed route service. It also excludes the Towns of Buchanan and Harrison, which provide service through the Call-A-Ride program. Service is provided from areas within the Connecter service area to other areas in the service area, or to the nearest of six transfer points on the fixed route system. The fixed route system is then used for the remainder of the trip. Trips must be scheduled up to two hours in advance. The fare structure of this service is shown in Table 6. Fares shown are for oneway trips only. The Connector service is available 20 hours a day Monday through Saturday from 4:00 a.m. to 12:00 a.m. Existing Conditions 14 Valley Transit
19 Table 6. The Connector Fare Structure Fare Category Cash Within Connector Zone $5.00 To/From Connector Zone $ Fixed Route Fare Call-A-Ride Valley Transit s Call-A-Ride is a taxi service available to the general public which provides service between the Appleton Transit Center and the towns of Buchanan and Harrison. The service is provided under contract with Fox Valley Cab. Fares are $2.50 each way, or $1.25 with a valid Valley Transit transfer. Free transfers can be made to Valley Transit fixed route service. Call-a-Ride service is available Monday through Saturday from 7:00 a.m. to 7:00 p.m. Passengers must make a reservation for this service at least two hours in advance by directly contacting the taxi service. Fleet and Facilities Fleet The Valley Transit fixed-route revenue fleet consists of seven 1994 Orion V buses, Orion VII buses, four 2005 Orion VII buses, and two 2010 ARBOC buses. Table 7. Fixed-Route Fleet Vehicle #s Quantity Year Make Seating Capacity Age Orion V Orion V Orion VII Orion VII , ARBOC 20 2 Total/Average The average age of the fleet (as of 2012) is 9.3 years. Five buses are older than 12 years, which is the standard bus life used by the Federal Transit Administration (FTA). The spare percentage (spare buses as a percent of peak bus requirements) is 29 percent based on a peak requirement of 21 vehicles and a total fleet of 27 vehicles. The peak vehicle requirement is 21 vehicles with tripper service, and 18 vehicles without. The allowable FTA percentage is 20 percent. However, this guideline is intended for systems operating with an active fleet of 50 or more revenue vehicles. This percentage is also based on vehicles operating within their useful lives 12 years for the Valley Transit buses. Although the Valley Transit spare ratio is high, it is not unusual given the small size of the systems and the age of its fleet. Existing Conditions 15 Valley Transit


20 Valley Transit II service is provided using a fleet of 26 vehicles, primarily Dodge Grand Caravans and Ford E-250s. The average age of the paratransit fleet is 4.8 years. A sample of the fixed route and paratransit fleet is pictured in Figure 6. Figure 6. Vehicles Clockwise from top left: Orion #451; Orion #412; ARBOC #502; Valley Transit II vehicles. Operations Facility The Valley Transit operations facility is located at 801 S. Whitman Avenue. All transit functions, including administration, vehicle storage, and maintenance, are housed in this facility. Transfer Facilities Valley Transit has two heated transfer facilities. The primary Valley Transit transfer center, pictured in Figure 7, is located in downtown Appleton at 100 E. Washington Street. A secondary transfer center, pictured in Figure 8, is located in Neenah at the corner of W. Doty Avenue and Church Street. All even numbered bus routes are scheduled to depart their Existing Conditions 16 Valley Transit


21 main transfer center 1 at 45 minutes past the hour while all odd number bus routes are scheduled to depart their main transfer center at 15 minutes past the hour. Routes providing service at 30 minutes headways in the peak depart at both 15 and 45 minutes past the hour. At the Appleton Transfer Center buses line up at posted route signs on each side of the facility. Passenger amenities consist of a heated waiting area, ticket purchase window, automatic ticket vending machine, public restrooms, food and drink vending machines, system map and schedules, benches, litter receptacles, lighting, and a courtesy phone connected directly to the Valley Transit administrative office. This facility also houses the local Greyhound bus office with daily service to Madison, Milwaukee, Chicago, Minneapolis, Green Bay, and Wausau. Figure 7. Appleton Transfer Center 1 Routes 31, 32, and 41 use the Neenah Transfer Center as their main transfer points. All other routes use the Appleton Transfer Center as their main transfer point. Existing Conditions 17 Valley Transit


22 Figure 8. Neenah Transfer Center Level of Service Assessment A level of service (LOS) assessment was completed to gauge the system s performance relative to a set of national benchmarks. Transit systems typically use the LOS assessment to guide planning for future improvements. Each quality-of-service factor measured in this analysis is important to Valley Transit s operations, as each directly influences how passengers perceive the quality of a transit trip. Levels of service are graded on an A-F scale according to a traveler s point of view, with A representing an optimum condition and F representing an undesirable condition. Generally, a goal of improving the LOS one grade for the weakest areas produces the greatest result for future investment. The levels of service and methodologies employed in this analysis are derived from the Transit Capacity and Quality of Service Manual (TCQSM), TCRP Report 100. It is important to note that the LOS assessment is not a definitive rating of the system s performance and local decision makers should employ their own locally developed standards to rate service. LOS assessments are often used to measure year-to-year improvements in the service provided. For this assessment, service coverage, frequency, and span were analyzed. Other LOS measures were not analyzed due to limited data availability. Service Coverage Service coverage measures the area within walking distance of transit stops. The more area covered by transit, the greater the geographic availability of transit. Industry standard minimum densities are used in this analysis. A residential density of three housing units per gross acre is considered the minimum density capable of supporting a basic level of transit service (at 60-minute headways). An employment density of four or more jobs per acre is also considered capable of supporting the basic level of service. Places that meet this threshold are referred to as transit-supportive Existing Conditions 18 Valley Transit
23 areas (TSAs) in this analysis. Areas within ¼ mile of bus routes are considered covered by transit service. As displayed in Figure 1, the TSA s in Appleton are fairly well covered, however there are some areas in the northwestern part of the city, Neenah, Little Chute, Kaukauna, and the Town of Greenville that have areas with densities that could support future transit service. When assessing the TSA s in the region, approximately 74 percent of that area is covered by Valley Transit s fixed route service. This is classified as LOS C, shown in Table 8. Table 8. Fixed Route Service Coverage LOS Assessment LOS % TSA Covered Comments A % Virtually all major origins & destinations served B % Most major origins & destinations served C % About ¾ of higher-density areas served D % About two-thirds of higher-density areas served E % At least ½ of the higher-density areas served F <50.0% Less than ½ of higher-density areas served Existing Conditions 19 Valley Transit

24 Figure 9. Transit Supportive Areas Existing Conditions 20 Valley Transit
25 Service Frequency Service frequency is a measure of how many times an hour a user has access to bus service, given reasonable service coverage and hours of service that make a transit trip possible. Table 9 lists the frequencies of each weekday route (excluding express routes and school trippers), which can be categorized as an LOS E, as listed in Table 10. Table 9. Service Frequency by Route Scheduled Headway (Minutes) Vehicles/Hour Routes , 2, 3, 4, 5, 8, 9, , 11, 12, 15, 19, 20, 30, 31, 32, 41 Source: Valley Transit Table 10. Frequency LOS Assessment LOS Average Headway (min) Vehicles/Hour Comments A <10 >6 Passengers do not need schedules B Frequent service, passengers consult schedules C Maximum desirable time to wait if bus/train missed D Service unattractive to choice riders E Service available during the hour F >60 <1 Service unattractive to all riders Source: Transit Cooperative Research Program Transit Capacity and Quality of Service Manual (Report 100) Valley Transit currently has an LOS of E. Most routes run at 60 minute frequencies midday. Improving service to 30 minute intervals will improve the level of service, make the system more understandable to prospective passengers, and provide an increase in ridership. In the Valley Transit service area, with a focus on transit supportive areas, improving the frequency LOS would produce the best return on investment. Existing Conditions 21 Valley Transit
26 Service Span Hours of service, or service span, is a measure of the number of hours during the day when a customer could potentially make a trip using the bus. As shown in Table 11, Valley Transit performs between an LOS of B and C. Table 11. Hours of Service LOS Assessment LOS Hours of Service Comments A Night or owl service provided B Late evening service provided C Early evening service provided D Daytime service provided E 4 11 Peak hour service only or limited midday service F 0 3 Very limited or no service Source: Transit Cooperative Research Program Transit Capacity and Quality of Service Manual (Report 100) Operating Characteristics In 2012 Valley Transit provided nearly 1.1 million rides on its fixed-route services. On its contracted demand response services, Valley Transit oversaw the provision of approximately 143,043 rides. This does not include the Connector service. From 2007 to 2012 fixed-route ridership has grown approximately 15 percent. During the same period demand response ridership grew approximately 3 percent. Demand response service provision also grew significantly from 2007 to 2012 with a 44 percent increase in the amount of revenue miles. Trends in these subject areas are shown in Figure 10 and Figure 11. Existing Conditions 22 Valley Transit
27 Figure 10. Fox Cities Transit Ridership Valley Transit Ridership Passenger Trips Fixed Route Ridership Demand Repsonse Ridership Figure 11. Fox Cities Transit Revenue Miles Valley Transit Revenue Miles Revenue Miles Fixed Route Revenue Miles Demand Response Revenue Miles Existing Conditions 23 Valley Transit
28 Valley Transit Rider Profile (2014 On-Board Survey) In early 2014, a rider survey was conducted to collect data on the customers of Valley Transit, identify transit use patterns, and assess satisfaction with current transit service. Appendix A contains a full summary of the 2014 Rider Survey. Rider sentiment was fairly positive, with the only criticism being in regards to on-time performance. Some key highlights from the survey are presented below. 54 percent of all Valley Transit are going to and from work. Shopping makes up the second-most common trip purpose with 17 percent of all trips, and middle and high school education makes up 11 percent of all trips. The majority of Valley Transit riders (59 percent) use the service five or more days per week. 28 percent of Valley Transit riders are relatively new in that they have been using the service for less than a year. Most riders, 66 percent, live within one or two blocks of the bus stop they used the day of the survey, while another 20 percent came from three to five blocks. And 14 percent transferred from another bus quite a low rate of transferring compared to larger systems. If Valley Transit were unavailable, 25 percent of riders said they would not have made the trip at all. However the balance, said they would have found another mode. Only 11 percent of the latter group, however, said they would drive. The reason is that very few transit users have a vehicle. While we can assume that most riders today have a mobile phone, 45 percent say they have a smartphone, while 55 percent said they do not have a smartphone. 75 percent of users have a phone that can receive text messages. Most Valley Transit riders, 58 percent, rely on transit in that they have neither a vehicle nor a license to drive. 25 percent indicate that they are licensed drivers but have no vehicle available. The majority of riders, 96 percent, are satisfied with current Valley Transit service. Existing Conditions 24 Valley Transit
29 Organization and Staffing Valley Transit is a city department. It is overseen by a transit commission comprised of nine seats with eight current members who meet monthly. Commission members include two elected Aldermen from the City of Appleton, three citizens of Appleton, and one member each from Kaukauna, Neenah, and Grand Chute. The ninth seat is reserved for a member from the County, but has remained vacant in recent years. Recent transit commission items of business include ridership and revenue reports, review of financial statements, and updates on recent legislative issues. As a department of the city, Valley Transit is funded through the City of Appleton budget and also receives funding from other municipalities that is serves. Valley Transit maintains a depreciation reserve fund, but all excess annual funding must be returned to the municipalities. Figure 12. Valley Transit Organizational Chart Mayor Valley Transit General Manager Community Relations Specialist (1) Transit Administrative Services Manager (1) Assistant General Manager (1) Communication Technicians (3.5) Operations/ Maintenance Supervisor (3) Transit Operations Supervisor (1.0) Opearations/ Maintenance Supervisor (0.7) Paratransit Coordinator/ Relief Operations Supervisor (1) Mechanic I (1) Bus Driver (36 full time and 3 part time) Mechanic II (3) Part Time Service Person (4 at 0.4 fte) Existing Conditions 25 Valley Transit
30 Management Valley Transit is managed by six full-time management employees: the General Manager, the Assistant General Manager, the Administrative Services Manager, the Operations Supervisor, the Paratransit Coordinator/Relief Operations Supervisor and the Maintenance Supervisor. Valley Transit has a total staff of approximately 54 full-time equivalents. The General Manager, Assistant General Manager, Operations Supervisors, and Administrative Services Manager are responsible for the day to day operation of the bus system including providing input on staffing, administering discipline, hearing grievances, and negotiating labor contracts with assistance from the City of Appleton Human Resource Department. The capital and operating budgets are prepared by the General Manager and the Administrative Services Manager. Management staff meetings are held bi-weekly, or more often as needed. Support Functions Valley Transit receives support from the City of Appleton in a number of areas, including human resources, IT, facilities maintenance, finance, and legal. Valley Transit is not charged for human resources, legal, financial, and IT professional staff time. NTD reporting standards require the reporting of all services provided to the transit agency. Valley Transit receiving support services at no charge may not show the full costs of transit service for NTD reporting purposes. Functional Areas As a unit of city government, Valley Transit uses the City of Appleton s systems for the majority of financial functions. Accounts payable are tracked electronically using finance software. Valley Transit maintains petty cash in the amount of $300. Receipts for items purchased with petty cash are submitted to the city for reimbursement. Financial functions at Valley Transit are monitored using an external audit that is separate from the city s financial audit. Financial audits are completed annually in the first quarter of the year to analyze the previous year s financial operations. The most recent financial audit was completed in early Budgeting Valley Transit s fiscal year follows the same calendar year cycle as the rest of the city departments. The Valley Transit budget is prepared by the General Manager and the Administrative Services Manager with input from other management staff. The budget also receives input from the City of Appleton Finance department before being submitted for review. The budget process begins in June. The annual operating assistance application to WisDOT is prepared by the Administrative Services Manager and is reviewed by the General Manager. Existing Conditions 26 Valley Transit
31 Valley Transit also maintains a depreciation reserve which is funded by all municipal funding partners. This fund allows them to take advantage of federal funding opportunities by having the local funding match readily available. Purchasing and Contracting The majority of purchasing and contracting activities are handled by Valley Transit with assistance from the City of Appleton. Valley Transit is responsible for purchasing office supplies as well as computer equipment and software. Valley Transit has a Disadvantaged Business Enterprise (DBE) participation goal of 2.1 percent, but this has not been met in each of the past five years due to a small number of DBE-qualified businesses in the area. WisDOT and FTA are available for technical assistance with meeting DBE goals. All purchase contracts require board approval. City policies state that purchases of over $25,000 require a bidding process, and purchases over $5,000 require quotes before receiving approval. Revenue Handling Valley Transit has revised its fare revenue handling procedures after installing GFI registering fareboxes. It has not yet updated its written procedures to reflect this. Fareboxes are removed from buses daily and the cash is placed in a secure vault. The cash is then counted by a Communication Technician in a secure room under video surveillance. The Administrative Services Manager generates an expected cash revenue amount based on a tally of ridership by fare type and compares this value to the amount of cash counted by the Communication Technicians. The daily bank deposits are then made by either the Communication Technician or management staff. The dollar value of these deposits is typically around $1,000. Personnel All bus drivers, mechanics, and communication technicians are affiliated with Teamsters Local 662. Labor contract negotiations on the part of Valley Transit are primarily conducted by the City of Appleton Human Resource Director with assistance from the General Manager, Assistant General Manager, Administrative Services Manager, and Operations Supervisor. This same group of Valley Transit management staff is also responsible for the first two steps of hearing employee grievances. The third step in the grievance process is directed to the Human Resources Director. The number of grievances totaled 25 in 2010 and 7 in Existing Conditions 27 Valley Transit
32 Supervision Oversight of the transportation function at Valley Transit is the primary responsibility of the Assistant General Manager and the Operations Supervisor. Approximately 70 percent of the Maintenance Supervisor s time is also spent supervising the transportation function. Not all hours of service are covered by these supervisor shifts. However, supervisors remain on-call when not on-duty. During the hours for which they are not present, service is monitored by the Communication Technicians through their dispatching role. Planning Valley Transit does not have any staff dedicated to the service planning function. All planning functions are accomplished by the operations management staff. A consultant was also hired to complete an operations analysis in Route and service changes generally occur no more than once per year. The effectiveness of service changes is currently measured primarily through customer and driver feedback. Valley Transit conducts customer surveys to gain additional feedback. The most recent survey was conducted in early The results of that survey are included in Appendix A. With the recent implementation of an AVL system, day-to-day monitoring of route and system performance is being modified to use the automated data provided by the system. Valley Transit is currently beginning to use the system to measure on-time performance and to collect data on boardings by stop location. Existing Conditions 28 Valley Transit
33 Peer System Assessment Since there are no recognized industry standards for most measures of transit system performance, common practice is to compare the performance of a system to the average values of a peer group of systems. The selection of the peer group for Valley Transit is based on a review of urbanized systems in the National Transit Database (NTD). The NTD was used because its data are readily available and consistently reported. National peer systems were selected based on the following criteria: Mode operated. Systems that operated fixed-route services were considered. Population density. Density is a gross measure of potential service effectiveness as measured by an indicator like passengers per revenue hour. The potential for group riding increases with population density. Population served. Population is a gross measure of market potential as measured by total population. Less emphasis was placed on this criterion because population density has a stronger impact on service effectiveness and efficiency. Climate. Only systems that experience cold weather and snowy winters were considered. The national peer group (Table 12) includes systems in Iowa, Illinois, Kansas, Maryland, Michigan, Montana, Ohio, and Tennessee. Table 12. National Peer Group Peer System Population Land Area (sq. mi) Population density (persons/sq. mi) Battle Creek, MI 83, Bay City, MI 110, Billings, MT 100, ,941 Cedar Rapids, IA 97, ,442 Chattanooga, TN 155, Dubuque, IA 58, ,231 Decatur, IL 86, ,624 Peoria, IL 207, ,979 Muskegon, MI 170, Saginaw, MI 127, ,016 Sioux City, IA 102, ,016 Canton, OH 378, Existing Conditions 29 Valley Transit
34 Topeka, KS 122, ,110 Frederick Co., MD 60, ,342 Youngstown, OH 288, Wichita, KS 386, ,591 National Peer Average 158, ,783 Valley Transit (Fox Cities) 187, ,604 % of Average 119% 64% 90% *2010 NTD data Performance Measures The peer analysis is this section compares Valley Transit to its peers for five objectives using seven specific measures, as organized in Figure 13. Figure 13. Performance Objectives and Performance Measures Cost effectiveness Operating expense per passenger Service efficiency Operating expense per revenue hour Service effectiveness Passengers per revenue hour Market penetration Passengers per capita Service availability Revenue hours per capita Passenger revenue effectiveness Passenger revenue per passenger Passenger revenue per operating expense Each measure is used to assess Valley Transit s performance in two ways: Comparison to peer average for most current year. Year 2010 NTD data is used. This is the most recent year for which NTD data is available. Consistent with the WisDOT approach to measuring performance, performance will be considered satisfactory within one standard deviation of the peer average 2 (arithmetic mean). 2 In order to be consistent with previous performance reviews, this analysis identified performance measures as Better than Average if a measure was better than the peer group average and Satisfactory if a measure was worse than average, but within one standard deviation. It is recommended that future performance reviews identify all measures within one Existing Conditions 30 Valley Transit
35 The system s performance is considered significantly worse than the average if it falls more than one standard deviation outside the mean. Comparison to peer average for annual rate of change. The average annual rate of change from 2006 to 2010 is calculated as follows. NTD data from reporting years 2006 to 2010 is used. Annual rate of change= (Value 2010 / Value 2006 ) ¼ -1 For the trend analysis, the system s annual rate of change is analyzed alongside the peer average rates of change for context. Cost Effectiveness Cost effectiveness addresses transit use in relation to the level of resources expended. It is key measure that should be considered by decision makers and funding agencies. The primary measure for comparison under this area is operating expense per passenger. The average operating expense of providing a single passenger trip on Valley Transit fixed route service is $4.93. Compared to the national peers, Valley Transit s cost per passenger is lower than the average of $5.18 (Figure 14). Valley Transit s cost effectiveness is better than the national peer average. A trend analysis shows that over the five-year span, Valley Transit s per-passenger expenses have increased at an average annual rate of 2.5 percent. Valley Transit s operating expense per passenger trip has increased slower than both the national peer average of 3.0 percent and the Wisconsin peer average of 4.8 percent. Service efficiency and service effectiveness affect cost effectiveness. These measures are assessed in the next sections. standard deviation of the average as Satisfactory, and measures better than average and beyond one standard deviation of the average as Significantly Better. Existing Conditions 31 Valley Transit
36 Figure 14. National Peers Operating Expense per Passenger Trip Nat'l Avg. = $5.18 Nat'l Avg + Std. Dev. = $6.59 $10 $9 $8 $7 $6 $5 $4 $3 $2 $1 $0 $3.20 $3.65 $3.95 $4.32 $4.36 $4.66 $4.84 $4.93 $5.04 $5.04 $5.10 Sioux City $5.24 Decatur $5.58 Muskegon $5.67 Topeka $6.39 Wichita $6.55 Canton $9.24 Dubuque Appleton Billings Chattanooga Operating Expense Per Passenger Trip Battle Creek Saginaw Frederick Co. Cedar Rapids Youngstown Peoria Bay City Service Efficiency Service efficiency examines the amount of service produced relative to resources expended. Operating expense per revenue hour is the measure used to assess how efficiently a system delivers service. The cost of providing one hour of revenue service on Valley Transit s fixed routes is $ Compared to the national peers, Valley Transit s cost per passenger is lower than the average of $86.91 (Figure 15). Valley Transit s service efficiency is better than the national peer average. A trend analysis shows that over the five-year span, Valley Transit s operating cost per revenue hour has increased at an average annual rate of 1.8 percent. Relative to its peers, Valley Transit s hourly operating expense per revenue hour has increased at a slower rate than the national average rate of 3.5 percent and the Wisconsin peer average rate of 3.0 percent. The cost of providing one hour of revenue service on Valley Transit s fixed routes is $ Existing Conditions 32 Valley Transit
37 Figure 15. National Peers Operating Expense per Revenue Hour $180 Nat'l Avg. = $86.91 Nat'l Avg + Std. Dev. = $ $160 $140 $120 $100 $80 $60 $40 $20 $0 $54.79 $66.55 $66.96 $68.00 $70.07 $79.37 $80.28 $80.44 $81.12 $82.13 $88.55 $89.16 Dubuque $89.88 Decatur $92.60 Frederick Co. $93.91 Canton $ Muskegon $ Topeka Sioux City Appleton Chattanooga Operating Expense/Revenue Hour Billings Wichita Cedar Rapids Bay City Youngstown Battle Creek Saginaw Peoria Service Effectiveness Service effectiveness is a measure of the consumption of transit service in relation to the amount of service available. Passengers per revenue hour is the measure used to assess service effectiveness. Valley Transit carries an average of 16.3 passengers per hour on its fixed route service. Compared to the national peers, Valley Transit s passengers per revenue hour value is less than the average of 17.3, but within the acceptable range (Figure 16). Valley Transit s service effectiveness is satisfactory compared to the national peer average. A trend analysis shows that over the five-year span, Valley Transit s passengers per revenue hour value has decreased at an average annual rate of -0.8 percent. Relative to its peers, Valley Transit s passengers per revenue hour has decreased faster than the national peer average, which is increasing at a rate of 0.9 percent, but is within the acceptable range. The value is decreasing slower than the Wisconsin peer average rate of -1.6 percent. Existing Conditions 33 Valley Transit
38 Figure 16. National Peer Group -- Passengers per Revenue Hour 30 Nat'l Peer Avg = 17.3 Nat'l Avg - Std. Dev. = Peoria 11.3 Sioux City 9.7 Saginaw Wichita Battle Creek Topeka Passengers Per Revenue Hour Decatur Muskegon Appleton Billings Chattanooga Cedar Rapids Canton Youngstown Frederick Co. Dubuque Bay City Market Penetration Passengers per capita is a measure of market penetration of current services. In 2010, Valley Transit carried 5.1 passengers per capita. In other words, the average resident of the Valley Transit service area boarded the bus 5.1 times during Compared to the national peers, Valley Transit s passengers per capita is less than the average of 8.6, but just within the acceptable range (Figure 17). Valley Transit s market penetration is satisfactory compared to the national peer average. A trend analysis shows that over the five-year span, Valley Transit s passengers per capita value has increased at an average annual rate of 0.5 percent. The passengers per capita for the national peer average has increased at an average annual rate of 0.7 percent, while the Wisconsin peer average value has decreased at a rate of -2.4 percent. Existing Conditions 34 Valley Transit
39 Figure 17. National Peer Group -- Passengers Per Capita Nat'l Peer Avg = 8.6 Nat'l Avg - Std. Dev. = Chattanooga 5.2 Decatur 5.1 Peoria 4.9 Frederick Co. 3.9 Sioux City 3.7 Cedar Rapids Topeka Saginaw Billings Passengers Per Capita Battle Creek Wichita Dubuque Canton Appleton Bay City Youngstown Muskegon Service Availability Revenue hours per capita is the performance measure used to assess service availability. In 2010, Valley Transit provided 0.31 revenue hours annually for each person in its service area. Compared to the national peers, Valley Transit s revenue hours per capita is less than the average of 0.51, but within the acceptable range (Figure 18). Valley transit s service availability is satisfactory compared to the national peer average. A trend analysis shows that over the five-year span, Valley Transit s revenue hours per capita have increased at an average annual rate of 1.3 percent. Relative to its peers, Valley Transit s revenue hours per capita have increased faster than both the national average, which has remained nearly constant, and the Wisconsin peer average, which has decreased at a rate of percent. Existing Conditions 35 Valley Transit
40 Figure 18. National Peer Group -- Revenue Hours Per Capita 1.2 Nat'l Peer Avg = 0.51 Nat'l Avg - Std. Dev. = Chattanooga 0.27 Frederick Co Decatur Cedar Rapids Topeka Peoria Revenue Hours Per Capita Bay City Dubuque Sioux City Billings Canton Saginaw Battle Creek Appleton Wichita Youngstown Muskegon Revenue Effectiveness Passenger revenue per passenger, or average fare, measures the amount each passenger is paying to use the service. In 2010, the average Valley Transit fixed route passenger paid $0.81 for a ride. Compared to the national peers, Valley Transit s passenger revenue per passenger is higher than the average of $0.67 (Figure 19). Valley Transit s passenger revenue effectiveness is better than the national peer average. A trend analysis shows that over the five-year span, Valley transit s passenger revenue per passenger has increased at an average annual rate of 2.9 percent. Relative to its peers, Valley Transit s passenger revenue per passenger has increased more slowly than the national average of 4.8 percent and the Wisconsin average of 7.2 percent, but is within the acceptable range for both. Existing Conditions 36 Valley Transit
41 Figure 19. National Peer Group -- Passenger Revenue per Passenger $1.40 Nat'l Avg. = $0.67 Nat'l Avg - Std. Dev. = $0.47 $1.20 $1.00 $0.80 $0.60 $0.40 $0.20 $0.00 $1.31 $0.82 $0.81 $0.77 $0.74 $0.72 $0.67 $0.66 $0.66 $0.66 $0.64 $0.63 $0.62 Bay City $0.58 Saginaw $0.51 Appleton $0.51 Muskegon $0.31 Frederick Co. Topeka Canton Passenger Revenue Per Passenger Chattanooga Wichita Sioux City Cedar Rapids Peoria Battle Creek Youngstown Billings Dubuque Decatur Passenger revenue to operating expense measures the level of operating expenses that are recovered through passenger fare payment. This measure is also referred to as the operating ratio. In 2010, Valley Transit collected 16 cents in passenger revenue for every dollar of operating expense; in other words, the system recovered 16 percent of its operating expense through the farebox. Compared to the national peers, Valley Transit s operating ratio is higher than the average of 13 percent (Figure 20). Valley Transit s operating ratio is better than the national peer average. A trend analysis shows that over the five-year span, Valley Transit s operating ratio has increased at an average annual rate of 0.4 percent. The operating ratio for the national peer average has increased at a rate of 2.0 percent, while the Wisconsin peer average has increased at a rate of 2.3 percent. The rate of change in Valley Transit s operating ratio is within the acceptable range for both peer groups. Existing Conditions 37 Valley Transit
42 Figure 20. National Peer Group -- Passenger Revenue per Operating Expense 25% Nat'l Peer Avg = 13% Nat'l Avg - Std. Dev. = 10% 20% 15% 10% 5% 0% 21% 19% 17% 16% 16% 15% 14% 14% 13% 13% 12% 11% 10% 10% 10% 9% Sioux City 8% Muskegon Topeka Appleton Saginaw Operating Ratio Wichita Canton Bay City Frederick Co. Chattanooga Battle Creek Cedar Rapids Dubuque Billings Peoria Youngstown Decatur Case Studies After initial public input and stakeholder engagement, it is expected that there will be practices and strategies that need to be investigated in several of the transit system s functional areas. Case studies will be developed in later stages of the project based on input from the public and stakeholder engagement. Potential peer systems to research for best practices are listed in the following section. CR Transit -- Cedar Rapids, IA The City of Cedar Rapids, IA was identified as a national peer in the 2012 Transit System Management Performance Review conducted by WisDOT. The Cedar Rapids region is similar to the Fox Cities in terms of the level of transit service provided and in various demographic and socio-economic data. CR Transit is a transit system to which Valley Transit and consultant staff would look for operations, funding strategies, and transit service development. MetroLINK Rock Island, IL MetroLink in Rock Island, IL is another system that serves a community with similar characteristics to that of the Fox Cities. The transit system also makes connections to three other transit providers in the Quad-Cities, IA-IL Region. Rabbit Transit York, PA Rabbit Transit in York, PA is a transit system that, when reviewing the National Transit Database, has several like performance characteristics to Valley Transit. It serves a metropolitan area of a similar size to Appleton, and also has a fleet size of fewer than 100 Existing Conditions 38 Valley Transit
43 buses. York, PA has also recently undergone a strategic planning process for its transit system. The Rapid Grand Rapids, MI The Rapid in Grand Rapids, MI represents a system that serves a larger population than that of Appleton, WI; however it has some characteristics of a fully developed transit system in a mid-sized urban area. This includes a robust marketing program, a newly developed bus rapid transit line, and a high frequency local bus network. Particular best practices that are in place in Grand Rapids can be assessed for their application in the Fox Cities. Rochester Genesee Transit Authority (RGRTA) Rochester, NY RGRTA, like The Rapid, serves a larger population than Appleton, WI; however they have received national accolades in the areas or marketing, private sector participation, and revenue generation in their transit system. In these areas, policies and practices can be reviewed for their applicability in the Valley Transit service area. Existing Conditions 39 Valley Transit
44 Transit Funding Valley Transit is supported by various funding sources, including assistance programs from the FTA, the State of Wisconsin, local support from the thirteen municipalities in the Valley Transit service area, and user subsidies from transit passengers. Each funding source is defined and summarized in this section along with the eligibility and management requirements for each. Public Transit Operating Aids: Wisconsin Department of Transportation Chapter and Federal Transit Administration Section 5307 In Wisconsin, bus systems in communities with populations that are greater than 50,000 but with operating budgets less than that of Madison and Milwaukee fall under the funding category of Tier B. The State of Wisconsin sets an equalized percent share of state and federal funds that consists of Wisconsin Department of Transportation (WisDOT) urban mass transit operating assistance and the Appleton urbanized area s FTA Section 5307 funding. Annually the goal is to cover 60 percent of operating expenses, but the State has fallen short of this goal in recent years and typically funds closer to 55 percent of operating expenses. This program can be distributed to local governments, and all projects must benefit residents in small urban areas. WisDOT has oversight authority on the program, and manages the application process and distribution of these funds through statute and administrative rules Trans 4 and Trans 6. Each year local governments that operate public transit can apply for funding under this program funds supplement the non-federal share of operating expenses. Wisconsin Chapter Specialized Transportation Assistance for Counties The program is a grant that is made to each county in the State of Wisconsin to support the mobility needs of the elderly and disabled. Generally, each county is allocated a share of the annual state appropriation proportionate to its share of the total statewide population of elderly persons and persons with disabilities. However, these amounts are adjusted to ensure that each county receives not less than 0.5 percent of the total annual program appropriation. Each county must provide a 20 percent match of these funds. Up to $80,000 of funding can be held in a trust for future projects. Typical uses of funding include providing transportation to medical activities, nutritional activities, and work-related activities funded projects can serve the general public on a space available basis. The funding can also be used to leverage FTA funds as non-federal share. In Outagamie County this funding is passed through to Valley Transit to support paratransit and rural transit for older adults and individuals with disabilities. Additionally, the local share of Route 9 (The Link) is funded by the program as it connects senior housing to key Existing Conditions 40 Valley Transit
45 destinations in downtown Appleton. Valley Transit is the operator of this service, and also makes use of subcontractors Other Human Service Transportation Programs There are several human service programs for which Valley Transit can bill care providers on an agency fare basis. These services are typically operated on a contractual basis via the purchase of fare media for the Valley Transit fixed route, Americans with Disabilities Act (ADA) complimentary paratransit service, or service on behalf of Calumet, Outagamie, and Winnebago Counties. Title XIX Non-Emergency Medical Transportation Program Non-Emergency Medical Transportation (NEMT) is a passenger transportation benefit of the Medicaid program. States are required in their Title XIX State plans to ensure necessary transportation of Medicaid beneficiaries to and from health care providers. Expenditures for transportation may be claimed as administrative costs of the State plan. The State may elect to include transportation as medical assistance under its State Medicaid plan, but use a direct vendor payment system consistent with applicable regulations. There are various ways in which a State can construct the network by which these rides are provided to the users. Statewide, regional, or local provider networks are typical. In Wisconsin, a statewide brokerage is in place to manage a network of local providers. This is managed by MTM, Incorporated and NEMT providers are comprised of both public and private agencies. Publicly Funded Long-term Care Programs Family Care Family Care is a program overseen by the Wisconsin Department of Health Services that creates a single flexible benefit that includes a large number of health and long-term care services that otherwise would be available through separate programs. A member of a Managed Care Organization (MCO) has access to a large number of specific health services offered by Medicaid, as well as the long-term care services in the Home and Community- Based Waivers and the very flexible state-funded Community Options Program. In order to assure access to services, MCOs develop and manage a comprehensive network of long-term care services and support, either through contracts with providers, or by direct service provision by MCO employees. Transportation benefits are one component of this program. MCOs receive a monthly per person payment to manage and purchase care for their members, who may be living in their own homes, group living situations, or nursing facilities. Family Care has two major organizational components: 1) Aging and disability resource centers (ADRCs), designed to be a single entry point where older people and people with disabilities and their families can get information and advice about a wide range of resources Existing Conditions 41 Valley Transit
46 available to them in their local communities, and 2) MCO s which manage and deliver the new Family Care benefit, which combines funding and services from a variety of existing programs into one flexible long-term care benefit, tailored to each individual s needs, circumstances and preferences. Institutions in the Valley Transit service area include: ADRC of Calumet, Outagamie, and Waupaca Counties ADRC of Winnebago County Lakeland Care District (MCO in Winnebago County) Community Care, Inc. (Outagamie and Calumet Counties) Family care organizations contract with Valley Transit to provide transportation services for people with disabilities to employment and job training. Valley Transit subcontracts this service to private operators. I.R.I.S. IRIS stands for Include, Respect, I Self Direct. IRIS is a publicly funded, long-term care program in which the participant chooses to self-direct their care plan and services. A participant will work with an independent consultant in determining monthly budget for purchasing services. Transit benefits are included as a purchased service. Federal Transit Administration Section 5339 Bus and Bus Facilities Program This program is the primary program for federal transit capital assistance available to Valley Transit. The Bus and Bus Facilities Program is a federally-funded capital grant program contained within the Moving Ahead for Progress in the 21st Century (MAP-21) authorization bill that provides capital funding to replace, rehabilitate, and purchase buses and related equipment and to construct bus-related facilities. The Appleton urbanized area receives an annual apportionment of FTA Section 5339 funding. In 2013, Valley Transit received $273,039 as the designated recipient of the funds that was used toward the purchase of a new vehicle. In addition to the funding that Valley Transit receives directly from FTA, there is a statewide apportionment of funds. WisDOT awarded the capital grants to urban systems in 2014 based on the percentage of 5307 money each received compared to the total received by all systems in the state. In 2013, Valley Transit s portion of the WisDOT apportionment was $65,136.. Existing Conditions 42 Valley Transit


47 Local Funding Sources Local Share of Operating Assistance Valley Transit receives direct operating assistance from several local governments. This serves as match to FTA Section 5307 and WisDOT Chapter funding. Three counties Outagamie, Calumet, and Winnebago supply their contributions from WisDOT Chapter funding. Total local share for Valley Transit is approximately $1.85 million. Nine additional cities, towns, and villages contribute local share. The breakdown of these sources is shown in Figure 21. This funding category consists of approximately 22 percent of the transit system s operating expenses. Passenger Fares and Other Revenues In 2013 Valley Transit collected $1.54 million in passenger fares. In addition to individual customers that pay cash for bus fare and purchase passes, Valley Transit sells fare media and has revenue generating agreements with the Appleton Area School District, human service organizations (Community Care, Lakeland Care District, IRIS), United Way Fox Cities, Menasha Corporation, and Thrivent Financial for Lutherans. Also, Valley Transit receives about $55,000 in advertising revenue, building rental and concessions, and investment income. Altogether, revenue generating funding sources account for about 20 percent of operating expenses. Figure 21. Local Share of Valley Transit Funding Locally Sourced Operating Assistance Counties (85.21) 50% City of Appleton 31% Town of Grand Chute 7% City of Kaukauna 1% Town of Buchanan 1% City of Neenah 4% Town of Menasha 2% Village of Kimberly Village 1% of Little Chute City of Menasha 1% 2% Existing Conditions 43 Valley Transit
48 Appendix A: Recommendations from Previous Plans Market/Customer Research Consumer Telephone Survey (2008) In 2008 Valley Transit partnered with The Dieringer Research Group, Inc. to conduct a research study with residents of the Fox Cities market to determine the overall perception of Valley Transit. Agency objectives include: Identify opportunities to increase revenue through both increased ridership and community support o Increased ridership Ensure high satisfaction levels among current riders Identify opportunities to attract non-riders o Increased community support Identify opportunities to improve their image Create baseline metrics that can be used to measure changes in market perceptions and the effectiveness of marketing or product programs Summary of Findings Awareness of Valley Transit in the Fox Cities area is high. Almost two thirds of respondents were aware without prompting. When prompted almost all survey respondents were aware. Conversely usage of Valley Transit over the past year was low, and future usage appears to be similarly low, as residents of the Fox Cities tend to rely on personal vehicles. Most are unlikely to use Valley Transit bus services in the upcoming 12 months. Satisfaction of Valley Transit is very high among current users, over half are extremely satisfied. Valley Transit enjoys positive perceptions within the community, particularly as a service available to others. People feel it is a necessary service in the community, and people feel safe taking the bus. 20 percent of survey respondents could not recommend any changes to the Valley Transit system, however others suggested more routes, stops, better locations of stops, more direct routes, and more frequent buses. As an alternative to a primary mode of transportation, the bus is more frequently considered a second or third option behind relying on friends or family for transportation. Existing Conditions 44 Valley Transit
49 Transit Development Plan (2009) The most recent Transit Development Plan (TDP) was completed by the East-Central Wisconsin Regional Planning Commission in This plan provides a set of recommendations for the development of the Valley Transit system over a five year time frame. Developing these recommendations involved a multi-disciplinary planning process that included multiple public input sessions, the use of a transit demand model, surveys, and input from technical experts. Consolidation of Route 3 and Route 4 A single route was designed that replaces route 3 and route 4, which have had steady declines in ridership the years leading up to the TDP. The route was designed to include the major attractions within the area served by Routes 3 and 4, as well as areas where the populations of transit dependent individuals are concentrated. The final route was extended in the north to include a section of Capitol Drive. The bus cycle time based on congested travel time was estimated to be 25 minutes. A headway of 30 minutes was assumed for a.m. (6:00 a.m.- 9:00 a.m.), 50 minutes for Mid-Day (9:00 a.m p.m.) and 30 minutes for p.m. (3:00 p.m.- 6:00 p.m.). Consolidation of the Route 3 and Route 4 would present a net gain of 0.2 percent ridership across the Valley Transit system, and an operational cost savings resulting from running fewer buses to serve an equivalent area. Wisconsin Avenue Route A new route was proposed to provide better connectivity to the Fox River Mall to and from northeastern Appleton. The route would primarily serve the Wisconsin Avenue corridor, and also connect to the Evergreen and Ballard Park-and-Ride, Appleton North High School, the Thrivent Financial campus, and ThedaCare Hospital. Cycle time for the route is 50 minutes, and it would be operated with one bus. Service to Town of Greenville The Town of Greenville is the home to a regionally significant industrial park and the Outagamie County Airport. Should the Town of Greenville contribute local share to the Valley Transit system, a circulator route in the Town of Greenville could be developed. The Greenville Route would connect to the Valley Transit Routes 41 and 12 at Wal-Mart and operate in a one way loop through the town. The route would have a cycle time of 35 minutes and be operated by one bus. Increased Frequency There are several routes in the Valley Transit system that would benefit from increased frequency. Higher frequency routes provide easier connections and improve mobility by offering more transit options. Based on existing strong demand for transit and service area characteristics, the following routes would benefit from further investment and improved frequency: Route 1: Midway Existing Conditions 45 Valley Transit
50 Route 7: Ballard Route 30: Neenah/Menasha Route 31: East Neenah Route 32: West Neenah Additional Route Changes Route1: Midway Extend route to better serve UW Fox Valley, major medical clinics, and major retail centers (Piggly Wiggly, ShopKo, etc.). Route 11: East College Buchanan Evaluate re-routing to increase access to Village of Kimberly, the Town of Buchanan, and newly developing commercial areas in eastern Appleton and the Town of Buchanan Route 12: Fox Valley Technical College Alter route direction to serve Sam s Club on the inbound trip rather than the outbound trip Adjust time points at Fox Valley Technical College to the :00 of the hour, and at Appleton West High School to the :35 of the hour Route 20: Heart of the Valley Adjust route to serve inner Kaukauna Route 41: West Fox Valley Adjust schedules for better connections with the GO Transit Route 10 coming from Oshkosh Extend the route to serve newly developed areas along West American Drive Other System Recommendations Conducting a cost-benefit analysis of operating Valley Transit II (ADA paratransit) in house. Reduce route lengths where boarding and alighting counts are low to nonexistent decrease residential service and increase arterial service. Eliminate areas of duplicated service between Call-A-Ride/Dial-A-Ride/Connector. Extend peak hour service in the afternoons/increase frequency. Reduce travel and transfer times. Cover more area instead of backtracking on routes. Existing Conditions 46 Valley Transit
51 Review and adjust routes more frequently than annually. Flexible routes that can be adjusted based on bad weather/traffic/etc. Initiate discussions with Green Bay Metro on examining intercity bus transportation. Service to Fox Cities Stadium for games. Renew discussions with Combined Locks for service. Development of multiple transit centers/transfer centers throughout the service area. Serve businesses on Grand Market Drive west of McCarthy Road. Make a connection to the VA Milwaukee shuttle at 7:00 am. Examine ways to incorporate recent service requests into service areas without major changes: o Affinity Pediatrics in Neenah o Intersection of Racine Street and Midway Road o Evergreen Drive and Ballard Road Medical offices/park and Ride o Railroad Street and Kimberly Avenue in Kimberly o Later service to Wal-Mart in Neenah o Park-and-Ride lot in Greenville o Indoor Skate Park in Kimberly o Time Warner Cable on Plank Road Comprehensive Operations Analysis (2010) Building on the TDP that was completed in 2009, the Valley Transit completed a comprehensive operations analysis of the transit system. This study added elements of cost, budgeting, and performance measures to recommendations commensurate with a TDP. The purpose of the study was to assist Valley Transit and the Fox Cities area in adapting transit services to the changing economy and the changing federal revenue streams available to the region. In the short term ( ), the focus was to take a detailed look at the existing services, including some updated ride check counts, and to suggest performance improvements effectiveness, efficiency, or both. In the longer term ( ), the study provided information for service enhancements and possible service expansion if and when the economy improves enough to allow it. Proposed Service Changes The comprehensive operations analysis recommended adjustments to nearly every route in the Valley Transit system, as well as the development of new routes. Short-Term Route Adjustments Route 1: The route is changed to travel north and south on Oneida between downtown and Midway, and to extend the route to serve the eastern portions of the City of Menasha and provide a Existing Conditions 47 Valley Transit
52 second connection to Neenah. The outbound segment west of Oneida will be replaced by changes to Route 30. Route 3: Eliminate route. Route 4: Eliminate the segment of the route on Ridgeview Drive north of the Northland Mall, decreasing running time on the route and improve the on-time performance Route 5 The route will travel outbound and inbound on Oneida except for the outbound segment on Morrison and an inbound segment on Division Street. The segment on Division Street north of Wisconsin Avenue has relatively low demand and potential passengers along Division are four blocks from either Route 5 on Oneida or Route 4 on Richmond. The other segment which is dropped from this route is the northern segment of the loop on Capitol. This area will be served by the new proposed Route 16. Route 6 Restructure the loop of this route to shorten the running time and provide more convenient access to passengers. Route 12 Eliminate portions of the route that deviate into parking lots. Route 15 Eliminate Woodman Drive segment of this route during the afternoon peak time. Route 20 Two changes are proposed for Route 20 to serve Jack s Frozen Pizza and the Little Chute High School and Middle School and eliminate the larger loop in Kaukauna. This area in Kaukauna will be served by the proposed Kaukauna Circulator. Route 30 The northern segment of Route 30 will pick up areas dropped from Route 1 along Southwood, Calumet, and Valley. The eastern loop serving Elizabeth Court apartments is eliminated as that area will be served by the proposed changes on Route 1. Existing Conditions 48 Valley Transit
53 Route 31 The bus will no longer enter the Theda Clark Medical Center, but will be at the end of the block. Traffic congestion within the center impacts the ability of this route to run on time, and this change will improve the on-time performance. Route 32 Eliminate portions of the route that deviate into parking lots. Short-Term New Routes (Years 1-3) Route 16 This is a new route proposed to serve Evergreen Drive, Northland Avenue, and the Fox Valley Mall. The route will provide new service to areas which are currently unserved, but have experienced development and increasing demand. This route also provides an east-west connection on the north side of Appleton. Segments of the current Route 3 which have demand will be served by this route as well. Kaukauna Circulator A circulator service is proposed for Kaukauna. This route will replace segments of Route 20 that will be eliminated and extend service south to the high school and north to the industrial park. The circulator will also provide local mobility within Kaukauna. The circulator is proposed as a demand-response service. Span of Service Adjustments Changes are proposed for evening service. The proposal for weekdays is to maintain Routes 12, 15, 20, and 30 as fixed routes operating hourly after 6:45 p.m. Other areas of the community will be served by either deviated fixed-route or demand-response. Based on the level of demand, the destinations of the four routes could be served by three vehicles operating in zones. This proposal will result in a cost savings of $170,000 to help offset some of the costs of the increased services proposed. On Saturdays, the proposal is to stop Route 12 in the evening and operate two vehicles in demand-response service to reach the other destinations. A route map reflecting recommendations is show in Figure 22. Existing Conditions 49 Valley Transit

54 Figure 22. Recommended Route Map, Comprehensive Operations Analysis Existing Conditions 50 Valley Transit
55 Long-Term Service Changes (Years 4-5) Grand Chute and Greenville Circulator There is growing demand for service in the areas west of Fox Valley Mall. The circulator route would operate during peak hours to provide access to employment. The route will be scheduled for timed transfers at the Fox Valley Mall. The proposed route alignment is based on current origins and destinations for The Connector in this area. Prior to implementation, the origin-destination patterns should be reviewed to determine a final alignment for this circulator Route 21 A future connection from downtown to Kaukauna via East College and County Road will provide an additional connection to Kaukauna and gives Kaukauna residents a direct route to Walmart and the surrounding retail area. Downtown Circulator There are several proposed development projects in the downtown area and along the river front. The circulator will provide connections to several of these developments which are not easily served by the other routes. Final route alignment should be determined as the development plans are reviewed and approved. Valley Transit should provide input in the review process for these developments to ensure that transit access can be provided. Regional Service This recommendation is to restore the connection of Route 10 with the Valley Transit system. The current schedule does not provide for convenient transfer throughout most of the day. Valley Transit should work with Oshkosh to revise the schedule so that transfers can occur throughout the day. This may require Valley Transit to take over operation of this connector. Also, there is growing demand for a commuter service between Appleton and Green Bay. The proposed service is to implement this route initially as a commuter service with peak trips to meet commuter demand. As demand grows for the service, additional trip times could be added to the schedule. Performance Monitoring In addition to recommending service changes for Valley Transit, the comprehensive operations analysis recommended a performance monitoring program for Valley Transit to adopt to determine how well community goals are being achieved, and whether service provided is effective and efficient. Monitoring of service should continue on a daily basis, with some recommendations for how to change specific data collection procedures. Data collection is essential to evaluate the service performance and to determine if changes should be made in the service delivery. This section provides information on data collection, Existing Conditions 51 Valley Transit
56 databases, and standard reports which should be prepared. Data to be collected fall into three basic categories ridership data, on-time performance, and financial. Transit performance measures serve as a guide to find out how a transit system performs. Performance measures define the types of data to be collected and give the tools necessary to identify transit system deficiencies and opportunities. Performance Measures Passengers per hour Cost per trip Subsidy per trip Late trips and missed trips Service and road calls Accidents per 1000 miles Fleet age Cost per revenue hour Transit System Management Performance Review (2012) The Wisconsin Department of Transportation (WisDOT) is required by Wisconsin Statute to conduct a management performance audit of all urban transit systems receiving state aid at least once every five years. This report summarizes the 2012 Management Performance Review for Valley Transit. The Management Performance Review process consisted of three main activities: performance analysis, written questionnaire completion, and an on-site interview and facility review. The review team conducted a performance analysis in spring 2012 to inform the areas of focus for the questionnaire and on-site interview. The on-site interview and facility review was conducted on July 9-10, Existing Conditions 52 Valley Transit

57 Table 13. Status of Previous Recommendations This audit quantitatively evaluates Valley Transit s performance through a peer group analysis in which the system is measured against a group of transit systems with similar service area characteristics. The peer analysis compares Valley Transit to its peers using seven specific performance measures, evaluating performance in the most recent year for which data is available (2010). Consistent with the WisDOT approach to measuring performance, performance is considered satisfactory within one standard deviation of the peer average (arithmetic mean). The time trend analysis compares Valley Transit s change over time from 2006 to 2010 to the peer average rate of change during that period. Valley Transit s performance was generally in the satisfactory range for most measures. In the past five years, Valley Transit has been aggressive in ensuring that passenger fare revenues continue to pay a reasonable portion of operating expenses. As a result, Valley Transit has a significantly higher average fare and operating ratio than the average systems in the national and Wisconsin peer groups. Valley Transit also performs satisfactory or significantly worse than the peers for market penetration. Part of the reason for this comparatively worse performance is that Valley Transit serves a less dense area than does the average Wisconsin peer system. Another factor is that service provided per capita is much lower than other systems. Detailed peer analysis is summarized in Table 14. Existing Conditions 53 Valley Transit


58 Table 14. Valley Transit System Performance Based on review of current structures and processes, the policy and decision making process is evaluated for effectiveness. Table 15 summarizes the extent to which Valley Transit satisfies the four effectiveness criteria used in this audit to assess the system s policyand decision making process. Table 15. Policy and Decision Making Performance This review addressed ten functional areas of small urban transit systems. The review s assessment of each functional area is presented in Table 16. Assessment ratings are based on Existing Conditions 54 Valley Transit

59 the degree to which the function s structures and procedures are conducive to continued effective operations. Table 16. Functional Area Performance The recommendations presented in the Management Performance Review are summarized by level of priority in Table 17. Existing Conditions 55 Valley Transit

60 Table 17. Recommendations Valley Transit operates an efficient transit system that is near the norm for most performance indicators. The management of the system is effective and has established many good practices for a variety of transit management issues. Valley Transit is a leader in transit marketing through the creative use of current social media products as well as traditional marketing techniques. Stronger oversight and involvement with the paratransit contractor will fill in the only weakness within the overall transit management in the Appleton area. Community Perception Project (2013) In 2013 Valley Transit partnered with Willems Marketing to conduct a set of focus groups and personal interviews to engage constituents and obtain feedback to inform strategic growth and maintenance of funding sources. Key Findings of Focus Groups Need education program to support RTA not many people truly understand the concept and what it means for the area. Develop education program to increase usage overall. Feel schedules and routes are not convenient for users. Existing Conditions 56 Valley Transit
61 These groups most in-tune with VT services from a user standpoint, so provided most insight and ideas for change. Focused attention on user experience and possible reasons for not using VT many good points made that will be useful when developing strategies to address misperceptions. Key Findings of Interviews with Business Leaders Most concerned with benefits to employer/employee dynamic. Not as well-versed in service, operational or logistic details, but still support VT efforts. Feels there is strong economic value to community providing mass transit options, but difficult to define that value. Two interesting concepts came from this group: one person feels that without concentrated vertical industry and vertical housing close to each other mass transit in Fox Cities will always be costly and difficult to manage due to our sprawled industry and economic centers and city spread; two others feel government should completely subsidize mass transit. RTA: mostly in support, but with many questions and checkpoints built in to financial structure. Feel that Fox Cities residents won t change driving/travel habits until gas reaches extremely high cost that residents are too comfortable and reliant on personal vehicles to ride the bus if they don t have to. Key Findings of Interviews with Municipal Officials Provided different insight (vs. other two interview groups) from a funding and budgeting standpoint They receive feedback from their constituents regarding routes and their own community needs (i.e.: VT should communicate detour routes, have heard about bus shelters being removed) This group most knowledgeable about routes and VT funding sources. Overall support for RTA, but with a focus to get employees to jobs (specifically to industrial parks and areas of big business) Mixed reactions on if they would support property tax cap and help fund future transportation costs through local sales tax. Smaller communities fear their board would not be able to support funds if state and federal dollars are pulled from VT. Voiced concern about transit funds being shifted from highway funds to general purpose Existing Conditions 57 Valley Transit
62 revenue that this could be the first step to underfunding VT. Some are very troubled that state legislature has not given VT the authority to at least explore RTA as a referendum. Municipal levies prevent communities form increasing taxes, so would be very concerned I this was the expectation. Strong supporter of educating general public about how/why public transportation works and how it benefits the community feel that even people who would not be the typical VT user should understand how it impacts our overall vitality and growth of our communities. Feel that VT leadership exhausts every opportunity for funding, but should continue to lobby government for RTA status as there is only so much that can be done through other measures (fuel-efficient buses, increased rider rates, bus advertising, or other innovative ideas). Existing Conditions 58 Valley Transit

63 On-Board Survey (2014) Existing Conditions 59 Valley Transit

64 Existing Conditions 60 Valley Transit


65 Existing Conditions 61 Valley Transit
66 Existing Conditions 62 Valley Transit

67 Existing Conditions 63 Valley Transit

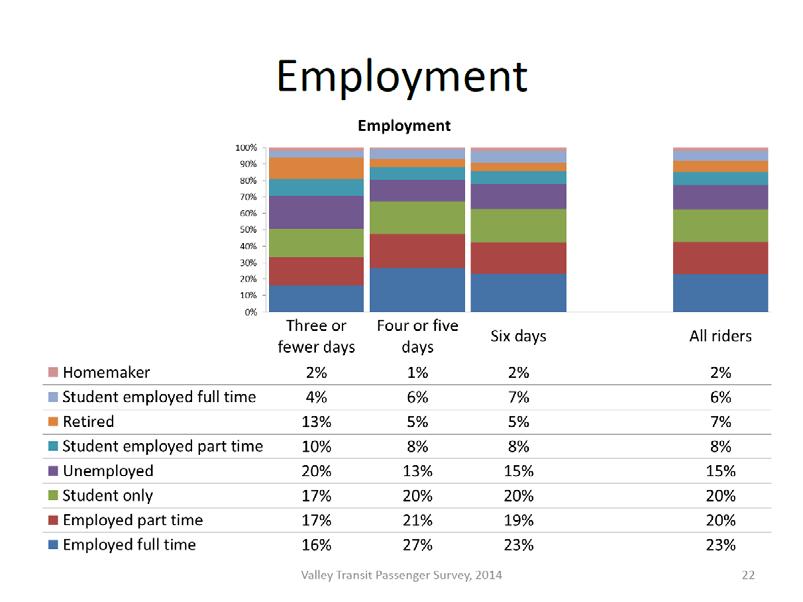
68 Existing Conditions 64 Valley Transit

69 Existing Conditions 65 Valley Transit
PUBLIC TRANSIT IN KENOSHA, RACINE, AND MILWAUKEE COUNTIES
 PUBLIC TRANSIT IN KENOSHA, RACINE, AND MILWAUKEE COUNTIES #118404v1 Regional Transit Authority June 19, 2006 1 Presentation Overview Existing Public Transit Transit System Peer Comparison Recent Transit
SAMTRANS TITLE VI STANDARDS AND POLICIES
 SAMTRANS TITLE VI STANDARDS AND POLICIES Adopted March 13, 2013 Federal Title VI requirements of the Civil Rights Act of 1964 were recently updated by the Federal Transit Administration (FTA) and now require
Existing Services, Ridership, and Standards Report. June 2018
 Existing Services, Ridership, and Standards Report June 2018 Prepared for: Prepared by: Contents Overview of Existing Conditions... 1 Fixed Route Service... 1 Mobility Bus... 34 Market Analysis... 41 Identification/Description
APPENDIX B COMMUTER BUS FAREBOX POLICY PEER REVIEW
 APPENDIX B COMMUTER BUS FAREBOX POLICY PEER REVIEW APPENDIX B COMMUTER BUS FAREBOX POLICY PEER REVIEW The following pages are excerpts from a DRAFT-version Fare Analysis report conducted by Nelson\Nygaard
Att. A, AI 46, 11/9/17
 Total s San Diego Metropolitan Transit System POLICY 42 PERFORMANCE MONITORING REPORT Page 1 of 6 Date: 11/8/17 OBJECTIVE Develop a Customer-Focused and Competitive System The following measures of productivity
APPENDIX B. Arlington Transit Peer Review Technical Memorandum
 APPENDIX B Arlington Transit Peer Review Technical Memorandum Arlington County Appendix B December 2010 Table of Contents 1.0 OVERVIEW OF PEER ANALYSIS PROCESS... 2 1.1 National Transit Database...2 1.2
METROBUS SERVICE GUIDELINES
 METROBUS SERVICE GUIDELINES In the late 1990's when stabilization of bus service was accomplished between WMATA and the local jurisdictional bus systems, the need for service planning processes and procedures
RACINE COUNTY PUBLIC TRANSIT PLAN:
 RACINE COUNTY PUBLIC TRANSIT PLAN: 2013-2017 Recommended Transit Service Improvement Plan NEWSLETTER 3 SEPTEMBER 2013 This newsletter describes the final recommended public transit plan for the City of
Fixed-Route Operational and Financial Review
 Chapter II CHAPTER II Fixed-Route Operational and Financial Review Chapter II presents an overview of route operations and financial information for KeyLine Transit. This information will be used to develop
Date: 11/6/15. Total Passengers
 Total San Diego Metropolitan Transit System POLICY 42 PERFORMANCE MONITORING REPORT Page 1 of 6 OBJECTIVE Develop a Customer-Focused and Competitive System The following measures of productivity and service
Peer Performance Measurement February 2019 Prepared by the Division of Planning & Market Development
 2017 Regional Peer Review Peer Performance Measurement February 2019 Prepared by the Division of Planning & Market Development CONTENTS EXECUTIVE SUMMARY... 3 SNAPSHOT... 5 PEER SELECTION... 6 NOTES/METHODOLOGY...
Establishes a fare structure for Tacoma Link light rail, to be implemented in September 2014.
 RESOLUTION NO. R2013-24 Establish a Fare Structure and Fare Level for Tacoma Link MEETING: DATE: TYPE OF ACTION: STAFF CONTACT: PHONE: Board 09/26/2013 Final Action Ric Ilgenfritz, Executive Director,
PREFACE. Service frequency; Hours of service; Service coverage; Passenger loading; Reliability, and Transit vs. auto travel time.
 PREFACE The Florida Department of Transportation (FDOT) has embarked upon a statewide evaluation of transit system performance. The outcome of this evaluation is a benchmark of transit performance that
Chapter 3. Burke & Company
 Chapter 3 Burke & Company 3. WRTA RIDERSHIP AND RIDERSHIP TRENDS 3.1 Service Overview The Worcester Regional Transit Authority (WRTA) provides transit service to over half a million people. The service
Executive Summary. Introduction. Community Assessment
 Executive Summary Introduction The Red Rose Transit Authority (RRTA) Transit Development Plan provides an evaluation of existing RRTA fixed route services, with the outcome being practical recommendations
1 DEMAND RESPONSE OVERVIEW
 1 DEMAND RESPONSE OVERVIEW Forty-nine transit agencies in Ohio operate demand response service, not including demand response services operated as part of the transit service provided in conjunction with
New System. New Routes. New Way. May 20, 2014
 Route Optimization I N I T I A T I V E New System. New Routes. New Way. May 20, 2014 1 Welcome Blueprint for Transportation Excellence (BTE) 20 year strategic plan Blueprint 2020 JTA s five-year plan for
DEMOGRAPHICS AND EXISTING SERVICE
 EXECUTIVE SUMMARY The Central Corridor light-rail transit (LRT) project will open in 2014 and operate between downtown Minneapolis and downtown St. Paul, serving the University of Minnesota and University
JATA Market Research Study Passenger Survey Results
 JATA Market Research Study Passenger Survey Results Prepared for the Jackson Area Transportation Authority (JATA) April, 2015 3131 South Dixie Hwy. Suite 545 Dayton, OH 45439 937.299.5007 www.rlsandassoc.com
Bristol Virginia Transit
 Bristol Virginia Transit 1 Transit Overview Bristol Virginia Transit (BVT) is a Federally Funded and certified urban area transit system. BVT began operation in its current form in 1982. In Fiscal Year
Title VI Service Equity Analysis
 Pierce Transit Title VI Service Equity Analysis Pursuant to FTA Circular 4702.1B NE Tacoma Service May 2016 Pierce Transit Transit Development Dept. PIERCE TRANSIT TITLE VI SERVICE EQUITY ANALYSIS TABLE
Mount Pleasant (42, 43) and Connecticut Avenue (L1, L2) Lines Service Evaluation Study Open House Welcome! wmata.com/bus
 and Connecticut Avenue (L1, L2) Lines Service Evaluation Study Open House Welcome! wmata.com/bus") Mount Pleasant (42, 43) and Connecticut Avenue (L1, L2) Lines Service Evaluation Study Open House Welcome! Study Overview and Timeline Phase 1: Collect and Analyze Data Project Kickoff, September 2017
Mount Pleasant (42, 43) and Connecticut Avenue (L1, L2) Lines Service Evaluation Study Open House Welcome! Study Overview and Timeline Phase 1: Collect and Analyze Data Project Kickoff, September 2017
All Door Boarding Title VI Service Fare Analysis. Appendix P.3
 All Door Boarding Title VI Service Fare Analysis Appendix P.3 Metro Board Report Los Angeles County Metropolitan Transportation Authority One Gateway Plaza 3rd Floor Board Room Los Angeles,
DRAFT Service Implementation Plan
 2017 Service Implementation Plan October 2016 SECTION NAME 2017 Service Implementation Plan October 2016 2017 SERVICE IMPLEMENTATION PLAN TABLE OF CONTENTS Table of Contents... I List of Tables... III
MUSKEGON AREA TRANSIT SYSTEM PROPOSAL FOR FARE AND SERVICE ADJUSTMENTS TO BE PHASED IN BEGINNING JANUARY 1, 2018
 MUSKEGON AREA TRANSIT SYSTEM PROPOSAL FOR FARE AND SERVICE ADJUSTMENTS TO BE PHASED IN BEGINNING JANUARY 1, 2018 The Muskegon Area Transit System is proposing a series of System Adjustments to be implemented
3. Proposed Midwest Regional Rail System
 3. Proposed Midwest Regional Rail System 3.1 Introduction The proposed Midwest Regional Rail System (MWRRS) will operate in nine states, encompass approximately 3,000 route miles and operate on eight corridors.
September 2014 Prepared by the Department of Finance & Performance Management Sub-Regional Report PERFORMANCE MEASURES
 September 2014 Prepared by the Department of Finance & Performance Management 2013 Sub-Regional Report PERFORMANCE MEASURES REGIONAL PERFORMANCE MEASURES RTA staff has undertaken the development of a performance
Business Growth (as of mid 2002)
") Page 1 of 6 Planning FHWA > HEP > Planning > Econ Dev < Previous Contents Next > Business Growth (as of mid 2002) Data from two business directories was used to analyze the change in the number of businesses
Page 1 of 6 Planning FHWA > HEP > Planning > Econ Dev < Previous Contents Next > Business Growth (as of mid 2002) Data from two business directories was used to analyze the change in the number of businesses
St. Johns County Transit Development Plan Update
 St. Johns County Transit Development Plan Update 2012-2021 Demographic Information Population 190,000 people in 2010 51% increase from 2000 Employment 64% over age 16 in labor force St. Augustine, Ponte
CURRENT SHORT-RANGE TRANSIT PLANNING PRACTICE. 1. SRTP -- Definition & Introduction 2. Measures and Standards
 CURRENT SHORT-RANGE TRANSIT PLANNING PRACTICE Outline 1. SRTP -- Definition & Introduction 2. Measures and Standards 3. Current Practice in SRTP & Critique 1 Public Transport Planning A. Long Range (>
CHAPTER 5: Operations Plan
 CHAPTER 5: Operations Plan Report Prepared by: Contents 5 OPERATIONS PLAN... 5-1 5.1 Proposed Service Changes... 5-2 5.1.1 Fiscal Year 2017... 5-2 5.1.2 Fiscal Year 2018... 5-6 5.1.3 Fiscal Year 2019...
General Issues Committee Item Transit Operating Budget Ten Year Local Transit Strategy
 General Issues Committee Item 4.1 2017 Transit Operating Budget Ten Year Local Transit Strategy January 27, 2017 Presentation Outline 2017 Operating Budget Overview Ten Year Local Transit Strategy 2 2017
FY Transit Needs Assessment. Ventura County Transportation Commission
 FY 18-19 Transit Needs Assessment Ventura County Transportation Commission Contents List of Figures and Appendices.. 2 Appendices... 1 Chapter 1: Introduction What is the Ventura County Transportation
SRTA Year End Fixed Route Ridership Analysis: FY 2018
 SRTA Year End Fixed Route Ridership Analysis: FY 2018 2018 Contents Introduction... 1 A. Key Terms Used in this Report... 1 Key Findings... 2 A. Ridership... 2 B. Fare Payment... 4 Performance Analysis
City of Murfreesboro. Transit Service and Management Alternatives
 City of Murfreesboro Transit Service and Management Alternatives May, 2005 Table of Contents 1. Introduction... 1 2. Transit Needs... 2 2.1 Demographics...2 2.2 Existing Transit Services...2 2.3 Focus
Like many transit service providers, the Port Authority of Allegheny County (Port Authority) uses a set of service level guidelines to determine
 uses a set of service level guidelines to determine") Transit service consists of two fundamental elements: frequency (how often service operates) and service span (how long service runs during the day). Combined, these two factors measure how much service
Transit service consists of two fundamental elements: frequency (how often service operates) and service span (how long service runs during the day). Combined, these two factors measure how much service
Public Meeting. December 19 th, 2018
 Public Meeting December 19 th, 2018 AGENDA Welcome Market Analysis Existing Services Peer Evaluation Outreach Summary Recommendations Discussion Next Steps MARKET ANALYSIS 3 Demographics 50% of population
2 YORK REGION TRANSIT MOBILITY PLUS 2004 SYSTEM PERFORMANCE REVIEW
 2 YORK REGION TRANSIT MOBILITY PLUS 2004 SYSTEM PERFORMANCE REVIEW The Joint Transit Committee and Rapid Transit Public/Private Partnership Steering Committee recommends the adoption of the recommendation
Analysis of Transit Fare Evasion in the Rose Quarter
 Analysis of Transit Fare Evasion in the Rose Quarter Shimon A. Israel James G. Strathman February 2002 Center for Urban Studies College of Urban and Public Affairs Portland State University Portland, OR
Board of Directors Information Summary
 Regional Public Transportation Authority 302 N. First Avenue, Suite 700, Phoenix, Arizona 85003 602-262-7433, Fax 602-495-0411 Board of Directors Information Summary Agenda Item #6 Date July 11, 2008 Subject
Public Transit Services on NH 120 Claremont - Lebanon
 Public Transit Services on NH 120 Claremont - Lebanon Overview of Preferred Alternative April 12, 2011 Presentation Overview Study Goals Quick Review Methodology and Approach Key Findings Results of Public
Demand-Responsive Transportation in the TCQSM
 Demand-Responsive Transportation in the TCQSM Buffy Ellis KFH Group, Inc. Presentation Overview Brief introduction to the project DRT in the TCQSM, 1st Edition DRT in the TCQSM, 2nd Edition Key Issues
Ozaukee County Transit Development Plan
 Ozaukee County Transit Development Plan Record of Public Comments and Recommended Transit Service Plan June 5, 2018 Kevin Muhs Deputy Director #242846 Status of the Transit Development Plan Existing Conditions
A COMPARISON OF THE MILWAUKEE METROPOLITAN AREA TO ITS PEERS
 KRY/WJS/EDL #222377 (PDF: #223479) 1/30/15 PRELIMINARY DRAFT Memorandum Report A COMPARISON OF THE MILWAUKEE METROPOLITAN AREA TO ITS PEERS EXECUTIVE SUMMARY This memorandum report provides a statistical
LA Metro Rapid - Considerations in Identifying BRT Corridors. Martha Butler LACMTA, Transportation Planning Manager Los Angeles, California
 LA Metro Rapid - Considerations in Identifying BRT Corridors Martha Butler LACMTA, Transportation Planning Manager Los Angeles, California LA Metro Transportation planner/coordinator, designer, builder
Word Count: 3,565 Number of Tables: 4 Number of Figures: 6 Number of Photographs: 0. Word Limit: 7,500 Tables/Figures Word Count = 2,250
 Katherine F. Turnbull, Ken Buckeye, Nick Thompson 1 Corresponding Author Katherine F. Turnbull Executive Associate Director Texas Transportation Institute Texas A&M University System 3135 TAMU College
EL PASO COUNTY REGIONAL TRANSIT INSTITUTIONAL OPTIONS ASSESSMENT STUDY
 EL PASO COUNTY REGIONAL TRANSIT INSTITUTIONAL OPTIONS ASSESSMENT STUDY Sponsored by: El Paso County Funding Support: Texas Department of Transportation Technical Assistance to the County: Texas A&M Transportation
Memorandum. DATE: May 9, Board of Directors. Jim Derwinski, CEO/Executive Director. Fare Structure Study Fare Pilot Program
 Memorandum DATE: May 9, 2018 TO: FROM: SUBJECT: Board of Directors Jim Derwinski, CEO/Executive Director Fare Structure Study Fare Pilot Program RECOMMENDATION Board action is requested to approve an ordinance
Chapel Hill Transit: Short Range Transit Plan. Preferred Alternative DRAFT
 : Short Range Transit Plan Preferred Alternative August 2018 Table of Contents Executive Summary... 1 Preferred Alternative... 3 Best Practices for Route Design... 3 Project Goals... 4 Preferred Alternative...
State of the Shared Vacation Ownership Industry. ARDA International Foundation (AIF)
") State of the Shared Vacation Ownership Industry ARDA International Foundation (AIF) This paper includes a high-level overview of the timeshare industry with a core focus on financial growth, owner demographics
State of the Shared Vacation Ownership Industry ARDA International Foundation (AIF) This paper includes a high-level overview of the timeshare industry with a core focus on financial growth, owner demographics
TRANSPORTATION SERVICE Actual
 PERFORMANCE REPORT-THIRD QUARTER VISION TO DELIVER REGIONAL MULTI-MODAL TRANSPORTATION SERVICES AND INFRASTRUCTURE IMPROVEMENTS THAT SIGNIFICANTLY AND CONTINUALLY INCREASE TRANSIT MARKET SHARE. MISSION
Transportation Development Plan Janesville Transit System
 Transportation Development Plan Janesville Transit System Final Report Prepared for City of Janesville Janesville Transit System Janesville Metropolitan Planning Organization Prepared by Urbitran Associates,
The 15-day comment period will run from Thursday, April 4, 2019 to 4pm on Wednesday April 18, 2019.
 Proposed Service Standards-Title VI Program Update 2019 April 3, 2019 The Cape Ann Transportation Authority is seeking input on service standards and service policies proposed as part of the Title VI Program
2015 Independence Day Travel Overview U.S. Intercity Bus Industry
 2015 Independence Day Travel Overview U.S. Intercity Bus Industry Chaddick Institute for Metropolitan Development, DePaul University June 25, 2015 This Intercity Bus Briefing summarizes the Chaddick Institute
STEP ALTERNATIVES RANKING TABLE
 ALTERNATIVES RANKING TABLE Priority Ranking 0 = Lowest Priority 1 2 3 4 5 = Highest Priority Abbreviations TD = Transportation Disadvantaged PWD = People with Disabilities I. Existing Enhancements Increase
The Importance of Service Frequency to Attracting Ridership: The Cases of Brampton and York
 The Importance of Service Frequency to Attracting Ridership: The Cases of Brampton and York Jonathan English Columbia University CUTA Conference May 2016 Introduction Is density the most important determinant
RIDERSHIP TRENDS. October 2017
 RIDERSHIP TRENDS October 2017 Prepared by the Division of Strategic Capital Planning December 2017 Table of Contents Executive Summary...1 Ridership...3 Estimated Passenger Trips by Line...3 Estimated
Madison Metro Transit System
 Madison Metro Transit System 1101 East Washington Avenue Madison, Wisconsin, 53703 Administrative Office: 608 266 4904 Fax: 608 267 8778 TO: FROM: SUBJECT: Plan Commission Timothy Sobota, Transit Planner,
Table of Contents. TRANSIT DEVELOPMENT PLAN UPDATE i
 Table of Contents Chapter 1. Introduction... 1 Chapter 2. Financial Review... 3 2.1 Operating Costs... 3 2.2 Capital Costs... 3 2.3 Revenues... 4 2.4 Overall Funding Implications... 4 Chapter 3. Service
REVIEW OF SUN METRO LIFT SERVICES
 REVIEW OF SUN METRO LIFT SERVICES Prepared for Review by Linda Cherrington, Research Scientist Suzie Edrington, Associate Research Scientist Zachary Elgart, Associate Transportation Researcher Shuman Tan,
METROPOLITAN EVANSVILLE TRANSIT SYSTEM Part I: Comprehensive Operations Analysis Overview July 9 th, 2015 Public Information Meeting
 METROPOLITAN EVANSVILLE TRANSIT SYSTEM Part I: Comprehensive Operations Analysis Overview July 9 th, 2015 Public Information Meeting AGENDA 5:30 5:40 Open House 5:40 6:30 Presentation Comprehensive Operations
Potomac River Commuter Ferry Feasibility Study & RPE Results
 1.1 Introduction The Prince William County Department of Transportation conducted a route proving exercise (RPE) and feasibility study of a proposed commuter ferry service on the Potomac River between
COLT RECOMMENDED BUSINESS PLAN
 COLT RECOMMENDED BUSINESS PLAN 2008 INTRODUCTION The past decade has been one of change in Lebanon County and this situation is expected to continue in the future. This has included growth in population,
PERFORMANCE REPORT NOVEMBER 2017
 PERFORMANCE REPORT NOVEMBER 2017 Note: New FY2018 Goal/Target/Min or Max incorporated in the Fixed Route and Connection Dashboards. Keith A. Clinkscale Performance Manager INTRODUCTION/BACKGROUND In June
Airport Planning Area
 PLANNING AREA POLICIES l AIRPORT Airport Planning Area LOCATION AND CONTEXT The Airport Planning Area ( Airport area ) is a key part of Boise s economy and transportation network; it features a multi-purpose
Quarterly Report Transit Bureau, Local Transit Operations. First Quarter, Fiscal Year 2015 (July 2014 September 2014) ART & STAR
 ART & STAR") Quarterly Report Transit Bureau, Local Transit Operations First Quarter, Fiscal Year 2015 (July 2014 September 2014) ART & STAR A Arlington Transit ART 1) Introduction The purpose of ART is to provide
Quarterly Report Transit Bureau, Local Transit Operations First Quarter, Fiscal Year 2015 (July 2014 September 2014) ART & STAR A Arlington Transit ART 1) Introduction The purpose of ART is to provide
SUB-REGIONAL PERFORMANCE MEASURES
 SUB-REGIONAL PERFORMANCE MEASURES 29 REPORT Overall regional performance is a function of five major areas: Service Coverage - monitors both how much service is available to people in the region (in terms
PUBLIC TRANSPORTATION INTRODUCTION
 PUBLIC TRANSPORTATION INTRODUCTION 1 OUTLINE Current Status and Recent Trends Significant Influences A Critical Assessment Arguments Supporting Public Transport Future Influences Ingredients for Future
THIRTEENTH AIR NAVIGATION CONFERENCE
 International Civil Aviation Organization AN-Conf/13-WP/22 14/6/18 WORKING PAPER THIRTEENTH AIR NAVIGATION CONFERENCE Agenda Item 1: Air navigation global strategy 1.4: Air navigation business cases Montréal,
RIDERSHIP TRENDS. August 2018
 RIDERSHIP TRENDS August Prepared by the Division of Strategic Capital Planning October Table of Contents Executive Summary...1 Ridership...3 Estimated Passenger Trips by Line...3 Estimated Passenger Trips
Economic Impact of Kalamazoo-Battle Creek International Airport
 Reports Upjohn Research home page 2008 Economic Impact of Kalamazoo-Battle Creek International Airport George A. Erickcek W.E. Upjohn Institute, erickcek@upjohn.org Brad R. Watts W.E. Upjohn Institute
Washington Metropolitan Area Transit Authority Services Utilization Study
 Washington Metropolitan Area Transit Authority Services Utilization Study Maryland House Bill 300 Table of Contents Page 2 Executive Summary Slide 3 Notes Slide 4 Metro Systemwide Fact Sheet Slide 5 How
A COMPARISON OF THE MILWAUKEE METROPOLITAN AREA TO ITS PEERS
 KRY/WJS/EDL #222377 v4 (PDF: #223479v2) 4/1/15 APPENDIX D REVISED DRAFT Memorandum Report A COMPARISON OF THE MILWAUKEE METROPOLITAN AREA TO ITS PEERS EXECUTIVE SUMMARY This report provides a statistical
TransAction Overview. Introduction. Vision. NVTA Jurisdictions
 Introduction Vision NVTA Jurisdictions In the 21 st century, Northern Virginia will develop and sustain a multimodal transportation system that enhances quality of life and supports economic growth. Investments
Other Principle Arterials Minor Arterial Major Collector Minor Collector Local
 CHAPTER 10 TRANSPORTATION Introduction The system of public roads in East Pikeland Township is decidedly rural in character. Since the 1984, the road network has remained much the same, with the addition
Minutes of the Third Meeting THE WASHINGTON COUNTY TRANSIT DEVELOPMENT PLAN ADVISORY COMMITTEE
 Minutes of the Third Meeting THE WASHINGTON COUNTY TRANSIT DEVELOPMENT PLAN ADVISORY COMMITTEE Date: May 8, 2013 Time: 9:30 a.m. Place: Conference Room 249 Washington Highway Department 900 Lang Street
WESTERN EL DORADO COUNTY SHORT AND LONG-RANGE TRANSIT PLAN Executive Summary
 WESTERN EL DORADO COUNTY SHORT AND LONG-RANGE TRANSIT PLAN Executive Summary Prepared for the El Dorado County Transportation Commission Prepared by The El Dorado County Transportation Commission (EDCTC)
Title VI Service Equity Analysis
 Pierce Transit Title VI Service Equity Analysis Pursuant to FTA Circular 4702.1B September 2013 Service Change February 2013 Page intentionally left blank PIERCE TRANSIT TITLE VI SERVICE EQUITY ANALYSIS
RIDERSHIP TRENDS. January 2018
 RIDERSHIP TRENDS January 2018 Prepared by the Division of Strategic Capital Planning March 2018 Table of Contents Executive Summary...1 Ridership...3 Estimated Passenger Trips by Line...3 Estimated Passenger
Working Draft: Time-share Revenue Recognition Implementation Issue. Financial Reporting Center Revenue Recognition
 March 1, 2017 Financial Reporting Center Revenue Recognition Working Draft: Time-share Revenue Recognition Implementation Issue Issue #16-6: Recognition of Revenue Management Fees Expected Overall Level
Development of SH119 BRT Route Pattern Alternatives for Tier 2 - Service Level and BRT Route Pattern Alternatives
 Development of SH119 BRT Route Pattern Alternatives for Tier 2 - Service Level and BRT Route Pattern Alternatives June 1, 2018 Development of SH119 BRT Route Pattern Alternatives for Tier 2 - Service Level
Summary of Proposed NH 120 Service
 Proposed NH 120 Bus Route Moody Building Etna Road Summary of Proposed NH 120 Service The Upper Valley Lake Sunapee Regional Planning Commission (UVLSRPC) working together with a Steering Committee comprised
About This Report GAUGE INDICATOR. Red. Orange. Green. Gold
 ATTACHMENT A About This Report The Orange County Transportation Authority (OCTA) operates a countywide network of local, community, rail connector, and express bus routes serving over 6, bus stops. OCTA
Central Oregon Intergovernmental Council
 Central Oregon Intergovernmental Council Regional Transit Master Plan (RTMP) Technical Advisory Committee March 8, 2013 Agenda Introductions (5 min) Project Update (5 min) Updated Demand Estimates (5 min)
DRT Performance Measurement: the U.S. Experience
 DRT Performance Measurement: the U.S. Experience FOR ANYBODY GOING ANYWHER IN LA HABRA International Conference on Demand Responsive Transportation Breckenridge, Colorado September 2016 DRT Performance
APPENDIX 2 TORONTO TRANSIT COMMISSION SERVICE STANDARDS AND DECISION RULES FOR PLANNING TRANSIT SERVICE
 APPENDIX 2 TORONTO TRANSIT COMMISSION SERVICE STANDARDS AND DECISION RULES FOR PLANNING TRANSIT SERVICE Contents 1 Introduction... 1 2 Network Design Standards... 2 2.1 Transit Service Classifications...
Mobile Farebox Repair Program: Setting Standards & Maximizing Regained Revenue
 Mobile Farebox Repair Program: Setting Standards & Maximizing Regained Revenue Michael J. Walk, Chief Performance Officer Larry Jackson, Directory of Treasury Maryland Transit Administration March 2012
SAN LUIS OBISPO TRANSIT + SAN LUIS OBISPO RTA JOINT SHORT RANGE TRANSIT PLANS: SERVICE STRATEGIES. Presented by: Gordon Shaw, PE, AICP; Principal
 SAN LUIS OBISPO TRANSIT + SAN LUIS OBISPO RTA JOINT SHORT RANGE TRANSIT PLANS: SERVICE STRATEGIES Presented by: Gordon Shaw, PE, AICP; Principal Project Status Review of existing services and setting complete
The Economic Impact of Tourism in Maryland. Tourism Satellite Account Calendar Year 2015
 The Economic Impact of Tourism in Maryland Tourism Satellite Account Calendar Year 2015 MD tourism economy reaches new peaks The Maryland visitor economy continued to grow in 2015; tourism industry sales
Evaluating Lodging Opportunities
 Evaluating Lodging Opportunities This section explores market opportunities for new lodging accommodations in the downtown area. It will help you understand travel and visitation trends, existing competition,
Silver Line Operating Plan
 Customer Service and Operations Committee Information Item IV-A December 6, 2012 Silver Line Operating Plan Washington Metropolitan Area Transit Authority Board Action/Information Summary Action Information
Interstate 90 and Mercer Island Mobility Study APRIL Commissioned by. Prepared by
 Interstate 90 and Mercer Island Mobility Study APRIL 2017 Commissioned by Prepared by Interstate 90 and Mercer Island Mobility Study Commissioned by: Sound Transit Prepared by: April 2017 Contents Section
(This page intentionally left blank.)
") Executive Summary (This page intentionally left blank.) Executive Summary INTRODUCTION The Cache Valley Transit District (CVTD) contracted with the team of Transportation Consultants, Inc. () and Fehr
Executive Summary (This page intentionally left blank.) Executive Summary INTRODUCTION The Cache Valley Transit District (CVTD) contracted with the team of Transportation Consultants, Inc. () and Fehr
CARSON CITY TRANSIT DEVELOPMENT PLAN
 CARSON CITY TRANSIT DEVELOPMENT PLAN FOR FY 2014 2018 Prepared by: Carson Area Metropolitan Planning Organization Table of Contents Chapter 1 Introduction... 1 Chapter 2 Existing System... 2 History and
Ridership Growth Strategy (RGS) Status Update
 Status Update") For Information Ridership Growth Strategy (RGS) Status Update Date: July 10, 2018 To: TTC Board From: Deputy Chief Executive Officer Summary The TTC s Ridership Growth Strategy (RGS), with all its components,
For Information Ridership Growth Strategy (RGS) Status Update Date: July 10, 2018 To: TTC Board From: Deputy Chief Executive Officer Summary The TTC s Ridership Growth Strategy (RGS), with all its components,
Dial-A-Ride Focus Group Final Report
 Dial-A-Ride Focus Group Final Report Prepared by: April 5, 2018 El Dorado County Transit Authority 6565 Commerce Way Diamond Springs, CA 95619 (530) 642-5383 www.eldoradotransit.com DIAL-A-RIDE FOCUS GROUP
Presentation to the Southeast Corridor High-Performance Transit Alternative Study Public Forum. Overview of MTA. presented by
 Presentation to the Southeast Corridor High-Performance Transit Alternative Study Public Forum Overview of MTA presented by Marian Ott, MTA Board Chair, Planning and Marketing Committee SEPTEMBER 2004
2004 SOUTH DAKOTA MOTEL AND CAMPGROUND OCCUPANCY REPORT and INTERNATIONAL VISITOR SURVEY
 2004 SOUTH DAKOTA MOTEL AND CAMPGROUND OCCUPANCY REPORT and INTERNATIONAL VISITOR SURVEY Prepared By: Center for Tourism Research Black Hills State University Spearfish, South Dakota Commissioned by: South
Transit Fare Review Phase 2 Discussion Guide
 Transit Fare Review Phase 2 Discussion Guide January 2017 translink.ca Table of Contents How should we determine transit fares in Metro Vancouver? 1 Varying fares by distance travelled 2 Varying fares
Chapter 1 Introduction
 Chapter 1 Introduction Purpose of the Report This report provides a Strategic Transit Master Plan for public transportation on behalf of the Metropolitan Transit Authority (MTA) and the Nashville Metropolitan