Capital Metropolitan Transportation Authority. Monthly Performance Report
|
|
|
- Justin West
- 5 years ago
- Views:
Transcription


1 Capital Metropolitan Transportation Authority Monthly Performance Report SEPTEMBER 2010

2 Ridership Report
3 Budget to Actual Ridership Budget Target: 2,335,906 Actual: 2,291,235

4 Ridership Comparison Fiscal Year 2009 vs. Fiscal Year 2010 FY 2009 FY 2010
5 Operations Performance Report
6 CUSTOMER SATISFACTION INDICATORS
7 STARTRAN July Goal Actual Performance Measure Score 4.74 StarTran Customer Satisfaction Composite Index 90% 90.4 On Time Performance Vehicle Accidents Passenger Accidents Miles Between Road Calls Complaints per 100,000 Passengers Goal Actual Performance Measure 90% 88.4% On Time Performance StarTran Performance Year To Vehicle Accidents Date Passenger Accidents Score , Miles Between Road Calls Complaints per Passengers
8 VEOLIA July Goal Actual Performance Measure Score 6.01 Veolia Customer Satisfaction Composite Index 90% 89.7% On Time Performance Vehicle Accidents Passenger Accidents Miles Between Road Calls Complaints per 100,000 Passengers Goal Actual Performance Measure Score 4.49 Veolia Performance Year To Date 90% 88.7% On Time Performance Vehicle Accidents Passenger Accidents Miles Between Road Calls Complaints per 100,000 Passengers
9 FIRST TRANSIT July Score 5.89 Goal Actual Performance Measure Passenger Accidents First Transit Customer Vehicle Accidents Satisfaction Composite Miles Between Road Index Calls 90% 97.3% On Time Performance Complaints per 100,000 Passengers First Transit Performance Year to Date Goal Actual Performance Measure Passenger Accidents Vehicle Accidents ,387 Miles Between Road Calls Score % 95.4% On Time Performance Complaints per 100,000 Passengers
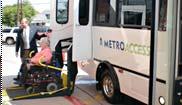
10 July Goal METROACCESS Actual Performance Measure 90% 95.4 On Time Performance 8% 6.06 No Shows MetroAccess Customer Satisfaction Composite Index 5% 5.62% Abandoned Call Rate 2:00.47 Call Wait Time Vehicle Accidents Score Passenger Accidents Road Calls Customer Complaints/10,000 Passengers Goal Actual Performance Measure 90% 91.9 On Time Performance 8% 6.38% No Shows 5% 8.52% Abandoned Call Rate MetroAccess Performance 2:00 Year to Date Call Wait Time Vehicle Accidents Passenger Accidents Score Road Calls Customer Complaints/10,000 Passengers
11 Score 8.18 July MetroRail Customer Satisfaction Composite Index Goal METRORAIL Actual 96% Performance Measure On Time Performance 0 0 Vehicle Accidents Passenger Accidents Customer Complaints/20,000 Miles Between Road Calls Score 7.77 MetroRail Performance Year to Date (4 months) Goal Actual 96% 98.14% Performance Measure On Time Performance 0 0 Vehicle Accidents Passenger Accidents Customer Complaints/20,000 Miles Between Road Calls
12 OVERALL CUSTOMER SATISFACTION July Score 5.71 Overall Customer Satisfaction Index Actual Service Type StarTran Fixed Route Customer Satisfaction Composite Index Veolia Customer Satisfaction Composite Index First Transit Customer Service Composite Index MetroAccess Customer Satisfaction Composite Index MetroRail Customer Satisfaction Composite Index Actual Service Type Score 4.66 Overall Performance Year to Date StarTran Fixed Route Customer Satisfaction Composite Index Veolia Customer Satisfaction Composite Index First Transit Customer Service Composite Index MetroAccess Customer Satisfaction Composite Index MetroRail Customer Satisfaction Composite Index
13 Operations Capital MetroRail Passenger Service September 24, 2010
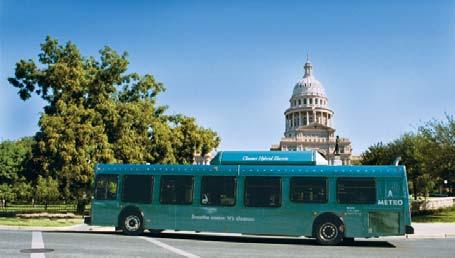
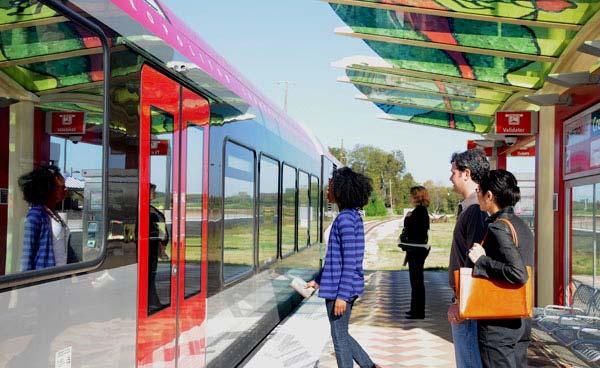
14 Capital MetroRail Passenger Service Passenger Service Completed 6 months of passenger service (began March 22) Ridership averaged ~872 passengers per day in August July Ridership ~ 817 Trains continue to operate generally within 3 minutes of schedule in August 98.54% on time performance 1 Security Incident, 3 mechanical issues, 1 track slow order affected on time performance
15 Capital MetroRail Passenger Service September 8 Interruption of Service Service cancelled due to flooding, track washout from Parmer Lane west Herzog maintenance staff restored track to Lakeline Station September 9 Interruption of Service Full Service restored Service restored from Lakeline to Downtown Leader customers assisted with making connection to Lakeline, etc. Herzog maintenance staff restored track to Leander Station September 10: Full Service restored
16 Capital MetroRail Improvements Ridership Initiatives Schedule adjustments Rail Committee recommending» Peak Service Adjustments» Mid-day Service (1hour frequency)» Friday Evening Service (4 pilot Fridays)» Saturday Service (3 special event Saturdays) Fare adjustments Improved bus connections Marketing Phase 1- Awareness and Direct to Home Phase 2- Business to Business Phase 3- Promotion of new fares and frequencies Outreach
17 Capital MetroRail Improvements Infrastructure Bridge Improvement Plan Update to Rail Committee, September 22 Gilleland Creek Bridge Replacement Construction complete Manor Road Crossing October 2010 target completion Rail R.O.W. clean up underway October 2010 target completion
18 Federal Railroad Administration FRA Waiver Temporal Separation Plan modified to allow segmenting of rail system Awaiting approval from FRA Regional Office APTA Safety Audit (required by FRA Waiver Pre-Audit completed August 31-September 1 APTA complimented MetroRail on System Safety Program Plan; provided comments for additional improvements APTA Full Audit tentatively scheduled for March 2011 FRA Site Visits September 9: FRA inspector cited defect for Herzog Hazmat Training Herzog completed Hazmat Training September 15 FRA, TxDOT Signal Inspectors on-site week of September 20 Positive Train Control Positive Train Control Implementation Plan revisions submitted to FRA; awaiting response
19 Freight Rail Freight Car Movement FY 2010 August 2010 total: 4,192 cars October 2009 total: 31,800 cars Freight Rail Advantages 31,000 frieght cars is equivalent to 127,200 tractor trailer trips (one-way) that were taken off of area highways Freight Rail Transport saves >75 gallons of fuel per rail car * Per ton cargo, trucks emit ~3 times more nitrogen oxide and particulates than freight trains ** * US Federal Railroad Administration ** US Environmental Protection Agency
20 Finance
21 Year-to-Date Sales Tax Revenues $140,000 $120,000 $100,000 $80,000 $60,000 $40,000 $20,000 $0 Jan. Feb. Mar. Apr. May June July Aug. Sept. Budget Actual Year-to-date sales tax receipts total $117.6 million through the July allocation, about $5.6 million more than the budget forecast for yearto-date sales tax revenues.
22 President / CEO Items of Interest September 24, 2010
23 Items of Interest Employee Recognition Terry Garcia-Crews John Hodges Thank You to Sponsors of CEO Reception APT, Austin Chamber, AARO, Downtown Austin Alliance, Envision Central Texas, Hispanic Chamber, RECA, TTA, SWATA Sunset Community Progress Report Community Update on September 30 th Significant Progress on Sunset Report Recommendations
Capital Metropolitan Transportation Authority. Monthly Performance Report
 Capital Metropolitan Transportation Authority Monthly Performance Report AUGUST 2010 Ridership Report August 23, 2010 Budget to Actual Ridership Budget Target: 2,290,590 Actual: 2,300,796 Ridership Comparison
Operational Performance
 Customer Services, Operations, and Safety Committee Board Action/Information Item III-A January 10, 2008 Operational Washington Metropolitan Area Transportation Authority Board Action/Information Summary
Sound Transit Operations December 2014 Service Performance Report. Ridership
 Ridership Total Boardings by Mode Mode Dec-13 Dec-14 % YTD-13 YTD-14 % ST Express 1,266,130 1,396,787 10.3% 16,605,299 17,661,976 6.4% Sounder 248,710 285,016 14.6% 3,035,735 3,361,317 10.7% Tacoma Link
Bus Operations Report
 Third Quarter FY 216 (January 1 - March 31, 216) Wednesday April 27, 216 Operations Ridership: 783,194 passengers used in the third quarter. This represents a 2% increase over the same period in FY 215.
Metra Board of Directors. Board Meeting November 11, 2011
 Metra Board of Directors Board Meeting November 11, 2011 State of Metra Operations Metra Board of Directors November 11, 2011 Presented by George Hardwidge Deputy Executive Director Operations System On-Time
PERFORMANCE REPORT JANUARY Keith A. Clinkscale Performance Manager
 PERFORMANCE REPORT JANUARY 2018 Keith A. Clinkscale Performance Manager INTRODUCTION/BACKGROUND Keith A. Clinkscale Performance Manager FIXED ROUTE DASHBOARD JANUARY 2018 Safety Max Target Goal Preventable
PERFORMANCE REPORT DECEMBER Performance Management Office
 PERFORMANCE REPORT DECEMBER 2018 Performance Management Office INTRODUCTION/BACKGROUND Performance Management Office FIXED ROUTE DASHBOARD FY 2019 Safety Max Target Goal Preventable Collisions per 100k
PERFORMANCE REPORT DECEMBER 2017
 PERFORMANCE REPORT DECEMBER 2017 Note: New FY2018 Goal/Target/Min or Max incorporated in the Fixed Route and Connection Dashboards. Keith A. Clinkscale Performance Manager INTRODUCTION/BACKGROUND Keith
Sound Transit Operations January 2014 Service Performance Report. Ridership
 Ridership Total Boardings by Mode Mode Jan-13 Jan-14 % YTD-13 YTD-14 % ST Express 1,343,290 1,426,928 6.2% 1,343,290 1,426,928 6.2% Sounder 245,135 256,775 4.7% 245,135 256,775 4.7% Tacoma Link 86,229
Why we re here: For educational purposes only
 Transportation 2050 Why we re here: For educational purposes only Transportation 2050 Bus Elements PUBLIC TRANSIT DEPARTMENT City of Phoenix Citizens Committee on the Future of Phoenix Transportation (CCFPT)
FIXED ROUTE DASHBOARD JULY 2018
 FIXED ROUTE DASHBOARD JULY 2018 Safety Max Target Goal Preventable Collisions per 100k Miles Non-Preventable Collisions per 100k Miles Total Incidents per 10,000 Boardings 1.6 1.3 0.8 2.63 2.1 2.0 1.60
Follow-up to Proposed Fare Changes for FY2013
 Finance & Administration Committee Information Item I-A January 19, 2012 Follow-up to Proposed Fare Changes for FY2013 1 of 22 Washington Metropolitan Area Transit Authority Board Action/Information Summary
Sound Transit Operations June 2016 Service Performance Report. Ridership
 Ridership Total Boardings by Mode Mode Jun-15 Jun-16 % YTD-15 YTD-16 % ST Express 1,622,222 1,617,420-0.3% 9,159,934 9,228,211 0.7% Sounder 323,747 361,919 11.8% 1,843,914 2,099,824 13.9% Tacoma Link 75,396
Sound Transit Operations March 2018 Service Performance Report. Ridership
 March 218 Service Performance Report Ridership Total Boardings by Mode Mar-17 Mar-18 % YTD-17 YTD-18 % ST Express 1,622,116 1,47,79-4.6% 4,499,798 4,428,14-1.6% Sounder 393,33 39,6.% 1,74,96 1,163,76 8.3%
Manual vs. Automatic Operation and Operational Restrictions
 Customer Services, Operations, and Safety Committee Board Information Item IV-B March 11, 2010 Manual vs. Automatic Operation and Operational Restrictions Page 81 of 91 Washington Metropolitan Area Transit
Greater Portland Transit District
 Greater Portland Transit District TO: FROM: Freeport Town Council Greg Jordan - Metro General Manager DATE: September 10, 2014 SUBJECT: Metro Request to Pursue Grant Funding for Trial Express Bus Service
PERFORMANCE REPORT NOVEMBER 2017
 PERFORMANCE REPORT NOVEMBER 2017 Note: New FY2018 Goal/Target/Min or Max incorporated in the Fixed Route and Connection Dashboards. Keith A. Clinkscale Performance Manager INTRODUCTION/BACKGROUND In June
METRO OPERATIONS COMMITTEE
 Los Angeles County Metropolitan Transportation Authority Item 1 CHIEF OPERATIONS OFFICER S S REPORT METRO OPERATIONS COMMITTEE Lonnie Mitchell Chief Operations Officer May 19, 20 1 Employee Recognition
2017/2018 Q3 Performance Measures Report. Revised March 22, 2018 Average Daily Boardings Comparison Chart, Page 11 Q3 Boardings figures revised
 2017/2018 Q3 Performance Measures Report Revised March 22, 2018 Average Daily Boardings Comparison Chart, Page 11 Q3 Boardings figures revised Contents Ridership & Revenue... 1 Historical Revenue & Ridership...
Sound Transit Operations March 2017 Service Performance Report. Ridership. Total Boardings by Mode
 March 217 Service Performance Report Ridership ST Express Sounder Tacoma Link Link Paratransit Mar-16 Mar-17 % 1,83,4 1,621,49 2.4% 37,496 82,631 1,264,47 3,821 Total Boardings by Mode 389,98 87,39 1,89,43,297
Sound Transit Operations February 2018 Service Performance Report. Ridership
 February 218 Service Performance Report Ridership Total Boardings by Mode Feb-17 Feb-18 % YTD-17 YTD-18 % ST Express 1,373,96 1,372,88 -.1% 2,877,294 2,88,719.1% Sounder 314,96 32,187 11.9% 681,923 768,69
Sound Transit Operations January 2018 Service Performance Report. Ridership
 January 218 Service Performance Report Ridership Total Boardings by Mode Jan-17 Jan-18 % YTD-17 YTD-18 % ST Express 1,3,33 1,7,91.3% 1,3,33 1,7,91.3% Sounder 367,33 416,8 13.3% 367,33 416,8 13.3% Tacoma
Quarterly Report Transit Bureau, Local Transit Operations. First Quarter, Fiscal Year 2015 (July 2014 September 2014) ART & STAR
 ART & STAR") Quarterly Report Transit Bureau, Local Transit Operations First Quarter, Fiscal Year 2015 (July 2014 September 2014) ART & STAR A Arlington Transit ART 1) Introduction The purpose of ART is to provide
Quarterly Report Transit Bureau, Local Transit Operations First Quarter, Fiscal Year 2015 (July 2014 September 2014) ART & STAR A Arlington Transit ART 1) Introduction The purpose of ART is to provide
ARLINGTON COUNTY, VIRGINIA. County Board Agenda Item Meeting of February 22, 2014
 ARLINGTON COUNTY, VIRGINIA County Board Agenda Item Meeting of February 22, 2014 DATE: January 23, 2014 SUBJECT: Request to authorize advertisement of a public hearing to consider an ordinance amending
MONTHLY OPERATIONS REPORT SEPTEMBER 2015
 MONTHLY OPERATIONS REPORT SEPTEMBER 215 Table of Contents SEPTEMBER 215 Section Page September Highlights... 3 Strategic Goals Progress Update... 4 Ridership... 6 Revenue... 9 Expenses... 1 System Summary...
MONTHLY OPERATIONS REPORT DECEMBER 2015
 MONTHLY OPERATIONS REPORT DECEMBER 215 Table of Contents DECEMBER 215 Section Page December Highlights... 3 Strategic Goals Progress Update... 4 Ridership... 6 Revenue... 9 Expenses... 1 System Summary...
2017/ Q1 Performance Measures Report
 2017/2018 - Q1 Performance Measures Report Contents Ridership & Revenue... 1 Historical Revenue & Ridership... 1 Revenue Actual vs. Planned... 3 Mean Distance Between Failures... 5 Maintenance Cost Quarter
FY Year End Performance Report
 Overall Ridership Big Blue Bus carried 18,748,869 passengers in FY2014-2015, a 0.3% reduction from the year prior. This negligible reduction in ridership represents the beginnings of a reversal from a
Performance Measures Year End Updated-
 Performance Measures Year End 2017 -Updated- Priorities and Objectives 1. Earn and Retain the Community s Trust 2. Provide Excellent Customer Service 3. Enable Organizational Success 4. Exemplify Financial
Sound Transit Operations August 2015 Service Performance Report. Ridership
 Ridership Total Boardings by Mode Mode Aug-14 Aug-15 % YTD-14 YTD-15 % ST Express 1,534,241 1,553,492 1.3% 11,742,839 12,354,957 5.2% Sounder 275,403 326,015 18.4% 2,139,086 2,463,422 15.2% Tacoma Link
Board of Directors Information Summary
 Regional Public Transportation Authority 302 N. First Avenue, Suite 700, Phoenix, Arizona 85003 602-262-7433, Fax 602-495-0411 Board of Directors Information Summary Agenda Item #6 Date July 11, 2008 Subject
Att. A, AI 46, 11/9/17
 Total s San Diego Metropolitan Transit System POLICY 42 PERFORMANCE MONITORING REPORT Page 1 of 6 Date: 11/8/17 OBJECTIVE Develop a Customer-Focused and Competitive System The following measures of productivity
Update of MDX Open Road Tolling
 Update of MDX Open Road Tolling Citizens Transportation Advisory Committee September 11, 2013 About MDX MDX is an agency of the state created by the State Legislature and the County Commission to assure
North Central Regional Transit District. Quick Facts. Our Mission Statement:
 North Central Regional Transit District Our Mission Statement: The mission of the North Central Regional Transit District is to provide safe, secure and effective public transportation within North Central
AUGUST 2008 MONTHLY PASSENGER AND CARGO STATISTICS
 Inter-Office Memo Reno-Tahoe Airport Authority Date: October 2, 2008 To: Statistics Recipients From: Tom Medland, Director Air Service Business Development Subject: RENO-TAHOE INTERNATIONAL AIRPORT PASSENGER
Feb 6 th, 2007 Japan Airlines Corporation
 Feb 6 th, 2007 Japan Airlines Corporation 0 Table of Contents JAL Group Q3 AccountSettlement For FY2006. Q3 Account Settlement For FY2006 Outline of the Consolidated Financial StatemeP3 Revision of Revenue
Board Box. October Item # Item Staff Page 1. Key Performance Indicators Sep 2018 M. Mungia Financial Report Aug 2018 H.
 Board Box October 2018 Item # Item Staff Page 1. Key Performance Indicators Sep 2018 M. Mungia 2-10 2. Financial Report Aug 2018 H. Rodriguez 11-15 ITEM 1 October 31, 2018 TO: FROM: RE: BOARD OF DIRECTORS
YOSEMITE AREA REGIONAL TRANSPORTATION SYSTEM
 YOSEMITE AREA REGIONAL TRANSPORTATION SYSTEM Short Range Transit Plan Prepared for the Merced County Association of Governments/YARTS Prepared by LSC Transportation Consultants, Inc. YOSEMITE AREA REGIONAL
Sound Transit Operations January 2017 Service Performance Report. Ridership. Total Boardings by Mode
 January 217 Service Performance Report Ridership ST Express Sounder Tacoma Link Link Paratransit Jan-16 Jan-17 % 1,433,7 1,3,33 4.9% 331,27 7,121 98,411 3,633 Total Boardings by Mode 363,6 74,823 1,76,914
Bristol Virginia Transit
 Bristol Virginia Transit 1 Transit Overview Bristol Virginia Transit (BVT) is a Federally Funded and certified urban area transit system. BVT began operation in its current form in 1982. In Fiscal Year
HOTEL INDUSTRY OVERVIEW. Texas
 HOTEL INDUSTRY OVERVIEW Texas DEMAND GROWTH STRONG BALANCED OCC & ADR GROWTH % Change Room Supply* 149M 1.3% Room Demand* 92M 5.6% Occupancy 61.6% 4.3% A.D.R. $90 4.4% RevPAR $55 8.9% Room Revenue* $8.3B
PUBLIC TRANSIT IN KENOSHA, RACINE, AND MILWAUKEE COUNTIES
 PUBLIC TRANSIT IN KENOSHA, RACINE, AND MILWAUKEE COUNTIES #118404v1 Regional Transit Authority June 19, 2006 1 Presentation Overview Existing Public Transit Transit System Peer Comparison Recent Transit
Date: 11/6/15. Total Passengers
 Total San Diego Metropolitan Transit System POLICY 42 PERFORMANCE MONITORING REPORT Page 1 of 6 OBJECTIVE Develop a Customer-Focused and Competitive System The following measures of productivity and service
September 2010 Brian Pearce To represent, lead and serve the airline industry
 Cycle turns up but risks and structural challenges remain September 2010 Brian Pearce www.iata.org/economics To represent, lead and serve the airline industry Confidence was still high in July survey Airline
With the completion of this project, we would like to follow-up on the projections as well as highlight a few other items:
 TO: FROM: Mayor and Council Interim City Manager Rebecca Underhill, Director of Finance DATE: February 28, 2014 SUBJECT: Water Meter Project Analysis On March 28, 2012, Acting City Manager Mike Loftin
Presentation to the Southeast Corridor High-Performance Transit Alternative Study Public Forum. Overview of MTA. presented by
 Presentation to the Southeast Corridor High-Performance Transit Alternative Study Public Forum Overview of MTA presented by Marian Ott, MTA Board Chair, Planning and Marketing Committee SEPTEMBER 2004
Key Statistical Indicator For The International Airports Operator In PPP/BOT/Project Finance Environment
 Key Statistical Indicator For The International Airports Operator In PPP/BOT/Project Finance Environment Introduction Taken over airports in emerging markets and in immature environments (but not always
ESCAMBIA COUNTY AREA TRANSIT MTAC REPORT
 ESCAMBIA COUNTY AREA TRANSIT MTAC REPORT November 8, 2017 Meeting Escambia County Area Transit 1515 W. Fairfield Drive Pensacola, FL 32501 850-595-3228 INTRODUCTION 2 Summary Background MTAC ECAT Benchmarks
Transportation Supporting Dulles Airport
 Transportation Supporting Dulles Airport Committee for Dulles Economic Development and Transportation Committee July 12, 2018 Tom Biesiadny, Director Fairfax County Multiple Transportation Improvements
ANA Holdings Financial Results for FY2013
 ANA HOLDINGS NEWS ANA Holdings Financial Results for FY2013 TOKYO April 30, 2014 - ANA Holdings (hereafter ANA HD ) today reports its consolidated financial for fiscal year 2013 (April, 2013 March, 2014).
1 YORK REGION TRANSIT/ VIVA SYSTEM PERFORMANCE
 Report No. 6 of the Transportation Services Committee Regional Council Meeting of June 23, 2011 1 YORK REGION TRANSIT/ VIVA SYSTEM PERFORMANCE The Transportation Services Committee recommends: 1. Receipt
AGENDA. Alaska Marine Highway System Background Data. Fiscal Year 2015 Look Forward. Dayboat Alaska Class Ferry Reservations & Manifest System
 AGENDA Alaska Marine Highway System Background Data Fiscal Year 2015 Look Forward Dayboat Alaska Class Ferry Reservations & Manifest System 2 MISSION STATEMENT DOT&PF: Keep Alaska moving through service
Rail Budget 2013: Highlights
 Rail Budget 2013: Highlights On the cards: 67 new express trains, 27 passenger trains, 5 memo services, increase in frequencies East west corridor underway, will be taken forward First AC electrical multiple
Service Cost Estimate for Route 10 only
 2009-2011 Service Cost Estimate for Route 10 only The City of Ashland buys down the fare on Route 10 for each passenger riding in Ashland, therefore service cost estimates are based on recent ridership
MONTHLY REPORT SEPTEMBER 2017
 MONTHLY REPORT 2017 SUN SHUTTLE RIDERSHIP ROUTE PASSENGERS: CURRENT YEAR PRIOR YEAR AMOUNT PERCENTAGE BUDGET AMOUNT PERCENTAGE TOTAL PASSENGERS 17,250 20,318 (3,068) -15.1% 18,231 (981) -5.4% CALENDAR
RIDERSHIP TRENDS. October 2017
 RIDERSHIP TRENDS October 2017 Prepared by the Division of Strategic Capital Planning December 2017 Table of Contents Executive Summary...1 Ridership...3 Estimated Passenger Trips by Line...3 Estimated
Multi-Aero Inc. d/b/a Air Choice One
 Multi-Aero Inc. d/b/a Air Choice One Proposal to Provide Essential Air Service at Owensboro, Kentucky Docket DOT-OST-2000-7855 Direct Inquiries Regarding this Proposal to: Shane Storz, CEO Air Choice One
MERRIMACK VALLEY REGIONAL TRANSIT AUTHORITY (MVRTA) PERFORMANCE MEASURES: FIXED ROUTE
 PERFORMANCE MEASURES: FIXED ROUTE") PERFORMANCE MEASURES: FIXED ROUTE IT IS OUR GOAL TO IMPROVE FIXED ROUTE SERVICE ON ALL LEVELS, ON A CONTINUOUS BASIS. IN ORDER TO DO THIS, WE HAVE ESTABLISHED BENCHMARKS TO MEASURE PERFORMANCE. THIS INFORMATION
PERFORMANCE MEASURES: FIXED ROUTE IT IS OUR GOAL TO IMPROVE FIXED ROUTE SERVICE ON ALL LEVELS, ON A CONTINUOUS BASIS. IN ORDER TO DO THIS, WE HAVE ESTABLISHED BENCHMARKS TO MEASURE PERFORMANCE. THIS INFORMATION
Miami Orlando Passenger Rail Project Overview
 Miami Orlando Passenger Rail Project Overview 1 The Historical Significance of Florida East Coast Industries Henry Flagler transformed Florida when he built his railroad FEC Railway connected cities along
DISTRICT EXPRESS LANES ANNUAL REPORT FISCAL YEAR 2017 JULY 1, 2016 JUNE 30, FloridaExpressLanes.com
 DISTRICT EXPRESS LANES ANNUAL REPORT FISCAL YEAR 2017 JULY 1, 2016 JUNE 30, 2017 FloridaExpressLanes.com This page intentionally left blank. TABLE OF CONTENTS List of Figures... ii List of Tables.... ii
March 4, Mr. H. Dale Hemmerdinger Chairman Metropolitan Transportation Authority 347 Madison Avenue New York, NY Re: Report 2007-F-31
 THOMAS P. DiNAPOLI STATE COMPTROLLER 110 STATE STREET ALBANY, NEW YORK 12236 STATE OF NEW YORK OFFICE OF THE STATE COMPTROLLER March 4, 2008 Mr. H. Dale Hemmerdinger Chairman Metropolitan Transportation
Reno-Tahoe Airport Authority U.S. DOMESTIC INDUSTRY OVERVIEW FOR FEBRUARY
 Inter-Office Memo Reno-Tahoe Airport Authority Date: March 30, 2009 To: Statistics Recipients From: Krys T. Bart, A.A.E., President/CEO Subject: RENO-TAHOE INTERNATIONAL AIRPORT PASSENGER STATISTICS U.S.
FISCAL YEAR Board of Directors Briefing Materials January 28, 2019 NNEPRA OFFICE 75 W. COMMERCIAL ST, STE 104 PORTLAND, ME 12:15PM
 FISCAL YEAR 2019 Board of Directors Briefing Materials January 28, 2019 NNEPRA OFFICE 75 W. COMMERCIAL ST, STE 104 PORTLAND, ME 12:15PM 2 NNEPRA FY2019 Action Plan (draft) Core Objectives: Support and
Honorable Members of the Mobility Solutions, Infrastructure and Sustainability Committee
 Memorandum DATE November 21, 2018 CITY OF DALLAS TO Honorable Members of the Committee SUBJECT D-Link Interlocal Funding Agreement On Monday, November 26, 2018, Michael Rogers, Director of the Department
Horizon 1 Implementation Update
 Horizon 1 Implementation Update March 9, 2016 Claudia Bilotto Consultant Project Manager GRTA launched Direct Xpress to make the service more attractive to current and potential customers Improve on-time
Various Counties MINUTE ORDER Page 1 of I
 TEXAS TRANSPORTATION COMMISSION Various Counties MINUTE ORDER Page 1 of I Various Districts Texas Government Code, Chapter 2056, requires that each state agency prepare a five-year strategic plan every
CURRENT SHORT-RANGE TRANSIT PLANNING PRACTICE. 1. SRTP -- Definition & Introduction 2. Measures and Standards
 CURRENT SHORT-RANGE TRANSIT PLANNING PRACTICE Outline 1. SRTP -- Definition & Introduction 2. Measures and Standards 3. Current Practice in SRTP & Critique 1 Public Transport Planning A. Long Range (>
VCTC Transit Ridership and Performance Measures Quarterly Report
 VCTC Transit Ridership and Performance Measures Quarterly Report Overview Quarter 2 Fiscal Year 2018-2019 This report provides performance measures for VCTC Intercity Bus Service covering the FY 2018-19
January 2019 Monthly Performance Report
 Date: February 19, 2019 To: From: Subject: General Manager Board of Directors Timothy Kea Budget & Grants Department January 2019 Monthly Performance Report The monthly systemwide ridership decreased 0.5%
December 2018 Monthly Performance Report
 Date: January 16, 2019 To: From: Subject: General Manager Board of Directors Timothy Kea Budget & Grants Department December 2018 Monthly Performance Report The monthly systemwide ridership decreased 1.4%
Presentation to the DRCOG Board August 16, 2017
 Presentation to the DRCOG Board August 16, 2017 Systemwide FY 2015-2016 July June FY 2016-2017 July June Riders 102,577 155,864 Revenue $1,014,781 $1,551,435 Fare Recovery FY = State Fiscal Year. 38% 53%
Call for Public Hearing August 2019 Service Changes
 Call for Public Hearing August 2019 Service Changes Operations, Safety & Security Committee January 8, 2019 Rob Smith, AVP Service Planning & Scheduling 1 Recommendation To call a Public Hearing on March
ANA HOLDINGS Financial Results for the Three Months ended June 30, 2015
 ANA HOLDINGS NEWS ANA HOLDINGS Financial Results for the Three Months ended June 30, 2015 TOKYO, July 29, 2015 ANA HOLDINGS (hereinafter ANA HD ) today reports its financial results for the three months
PLEASE READ Proposal for Sustainable Service
 IMPORTANT PLEASE READ 019 Proposal for Sustainable Service 019 Service Change Proposal IMPLEMENT A SUSTAINABLE NETWORK Everett Transit completed its Long Range Plan in May, and the plan was adopted by
IMPLEMENTATION OF COMPREHENSIVE DEVELOPMENT AGREEMENT (CDA) PROJECTS:
 PROJECTS:") IMPLEMENTATION OF COMPREHENSIVE DEVELOPMENT AGREEMENT (CDA) PROJECTS: SH 130 Project, Segments 5 & 6, Travis, Caldwell and Guadalupe counties; DFW Connector, Tarrant County; North Tarrant Express (NTE),
IMPLEMENTATION OF COMPREHENSIVE DEVELOPMENT AGREEMENT (CDA) PROJECTS: SH 130 Project, Segments 5 & 6, Travis, Caldwell and Guadalupe counties; DFW Connector, Tarrant County; North Tarrant Express (NTE),
Western Placer County Transit Operators Short Range Transit Plan Updates FY to FY Project Update and Alternatives Discussion
 Western Placer County Transit Operators Short Range Transit Plan Updates FY 2018-19 to FY 2024-25 Project Update and Alternatives Discussion Public Workshop Purpose Present various transit service, capital
AGENDA. 09/15/2015 Integrity Excellence Respect
 AGENDA Fiscal Year 2015 Accomplishments & Events Traffic Report Revenue Report & Historical Comparisons Fleet Update Terminal Update Budgetary Constraints Fiscal Year 2016 Operating Plan Fiscal Year 2017
Coal Network Update. Jason Plett MANAGER, COAL MARKETING MARCH 14, 2018
 Coal Network Update Jason Plett MANAGER, COAL MARKETING MARCH 14, 2018 BNSF is a Leading U.S. Railroad Berkshire Hathaway company 41,000 employees 32,500 route miles in 28 states and three Canadian provinces
Management Presentation. November 2018
 Management Presentation November 2018 Forward looking statements This presentation as well as oral statements made by officers or directors of Allegiant Travel Company, its advisors and affiliates (collectively
Call for Public Hearing August 2019 Service Changes
 Call for Public Hearing August 2019 Service Changes Committee-of-the-Whole January 22, 2019 Rob Smith, AVP Service Planning & Scheduling 1 Recommendation To call a Public Hearing on March 12, 2019 for
U.S. DOMESTIC INDUSTRY OVERVIEW FOR MARCH
 Inter-Office Memo Reno-Tahoe Airport Authority Date: April 30, 2009 To: Statistics Recipients From: Krys T. Bart, A.A.E., President/CEO Subject: RENO-TAHOE INTERNATIONAL AIRPORT PASSENGER STATISTICS U.S.
DRT Performance Measurement: the U.S. Experience
 DRT Performance Measurement: the U.S. Experience FOR ANYBODY GOING ANYWHER IN LA HABRA International Conference on Demand Responsive Transportation Breckenridge, Colorado September 2016 DRT Performance
January 2018 Air Traffic Activity Summary
 January 2018 Air Traffic Activity Summary Jan-2018 Jan-2017 CY-2018 CY-2017 Passengers 528,947 505,421 4.7% 528,947 505,421 4.7% Passengers 537,332 515,787 4.2% 537,332 515,787 4.2% Passengers 1,066,279
ANA HOLDINGS Financial Results for FY2014
 ANA HOLDINGS NEWS ANA HOLDINGS Financial Results for FY2014 TOKYO, April 30, 2015 ANA HOLDINGS (hereafter ANA HD ) today reports its consolidated financial results for fiscal year 2014 (April-March). Highlights
MONTHLY REPORT JUNE 2017
 & MONTHLY REPORT JUNE 2017 SECTION Sun Tran & Sun Van Monthly Operations Report Table of Contents June 2017 PAGE I.System Highlights and Accomplishments 3-10 II.Sun Tran a.ridership 11 b.revenue 12 c.pass
ORANGE COUNTY TRANSPORTATION AUTHORITY. Go Local Fixed-Guideway Program History and Project Update. PowerPoint 3
 ORANGE COUNTY TRANSPORTATION AUTHORITY Go Local Fixed-Guideway Program History and Project Update PowerPoint 3 Santa Ana-Garden Grove Fixed Guideway Project OCTA Board of Directors September 26, 2011 Project
Attachment C: 2017/2018 Halifax Transit Year End Performance Report. 2017/2018 Year End Performance Measures Report
 Attachment C: 2017/2018 Halifax Transit Year End Performance Report 2017/2018 Year End Performance Measures Report Contents Annual Key Performance Indicators (KPIs)... 1 Weekday Cost per Passenger... 1
MONTHLY REPORT SEPTEMBER 2017
 & MONTHLY REPORT SEPTEMBER 2017 SECTION Sun Tran & Sun Van Monthly Operations Report Table of Contents September 2017 PAGE I.System Highlights and Accomplishments 3-10 II.Sun Tran a.ridership 11 b.revenue
ANA Holdings Financial Results for the Third Quarter of FY2013
 ANA HOLDINGS NEWS ANA Holdings Financial Results for the Third Quarter of FY2013 TOKYO January 31, 2014 - ANA Holdings (hereafter ANA HD ) today reports its consolidated financial for the third quarter
ANA Reports Record Profits for FY2012
 ANA HOLDINGS NEWS ANA Reports Record Profits for FY2012 TOKYO April 30, 2013 - ANA Holdings today reports consolidated financial for the fiscal year ended March, 2013. Financial and Operational Highlights
Proposed Dulles Toll Road Rate Adjustments
 Proposed Dulles Toll Road Rate Adjustments Dulles Corridor Advisory Committee Meeting October 5, 2012 Discussion Outline Regulatory Process for Changing Toll Rates Information Provided at Public Hearings
PLU Airport Master Plan. Master Plan Advisory Committee (MPAC) Meeting #2 October 16, 2016
 Meeting #2 October 16, 2016") PLU Airport Master Plan Master Plan Advisory Committee (MPAC) Meeting #2 October 16, 2016 Meeting Agenda 1. Introductions and Contacts [10 Minutes] 2. Plan Overview and MPAC Role [20 Minutes] 3. MPAC Visioning
PLU Airport Master Plan Master Plan Advisory Committee (MPAC) Meeting #2 October 16, 2016 Meeting Agenda 1. Introductions and Contacts [10 Minutes] 2. Plan Overview and MPAC Role [20 Minutes] 3. MPAC Visioning
DTTAS Quarterly Aviation Statistics Snapshot Quarter Report
 Contents DTTAS Quarterly Aviation Statistics Snapshot Quarter 4 2015 Report 1.1 Dublin Airport Key Statistics... 1 1.2 Cork Airport Key Statistics... 3 1.3 Shannon Airport Key Statistics... 5 1.4 Total
Business Item Transportation Committee SW Item:
 T Business Item Transportation Committee SW Item: 2008-167 Meeting date: June 23, 2008 For Metropolitan Council: June 25, 2008 ADVISORY INFORMATION Date: June 13, 2008 Subject: Approval of Public Hearing
DTTAS Quarterly Aviation Statistics Snapshot Quarter Report
 Contents DTTAS Quarterly Aviation Statistics Snapshot Quarter 3 2018 Report 1.1 Dublin Airport Key Statistics... 1 1.2 Cork Airport Key Statistics... 3 1.3 Shannon Airport Key Statistics... 5 1.4 Total
Thank you for participating in the financial results for fiscal 2014.
 Thank you for participating in the financial results for fiscal 2014. ANA HOLDINGS strongly believes that safety is the most important principle of our air transportation business. The expansion of slots
Management Presentation. May 2013
 Management Presentation May 2013 Forward looking statements This presentation as well as oral statements made by officers or directors of Allegiant Travel Company, its advisors and affiliates (collectively
Transit Financial Summary Abilene MPO FY TIP
 Transit Financial Summary Abilene MPO FY 2006-2008 TIP Transit Programs FY 2006 FY 2007 FY 2008 Totals Description Federal Total Federal Total Federal Total Federal Total 1 Section 5307 - Urb >200K $0
CAPITOL CORRIDOR SERVICE PERFORMANCE
 In July 2016, the Capitol Corridor had one of its best months in the history of the service. Ridership was the highest ever, with a total of 128,655 passengers, a 1.7% year over year (YOY) increase. Revenue
MONTHLY REPORT MAY 2017
 & MONTHLY REPORT MAY 2017 SECTION Sun Tran & Sun Van Monthly Operations Report Table of Contents May 2017 PAGE I.System Highlights and Accomplishments 3-10 II.Sun Tran a.ridership 11 b.revenue 12 c.pass