Study 7 (Part 1): Demonstration of Factors that Govern Osoyoos Lake Levels During High Water Periods
|
|
|
- Sandra Holland
- 5 years ago
- Views:
Transcription
:")
1 Study 7 (Part 1): Demonstration of Factors that Govern Osoyoos Lake Levels During High Water Periods International Joint Commission March 2010
2
3 EXECUTIVE SUMMARY Introduction The operation of Zozel Dam at the outlet of Osoyoos Lake is governed by the International Osoyoos Lake Board of Control (IOLBC), under Orders of Approval prescribed by the International Joint Commission (IJC). These Orders specify that the lake must be maintained within certain ranges of elevations in winter (November 1 March 31) and summer (April 1 October 31) (the elevations are given with respect to the United States Coast and Geodetic Survey Datum (USCGS)). The Dam has a limited ability to manage high inflows, particularly when downstream backwater conditions exist, and the lake frequently exceeds the upper limit of the acceptable range in the summer period. The Orders will be renewed in The IJC has initiated this study to review the operation of Zozel Dam in order to help determine whether the Dam can be operated any differently to mitigate high water conditions, and to determine whether any changes to the Orders are required prior to Summit Environmental Consultants Inc. and Sequoia Mediation were retained by the IJC to complete Study 7. Study 7 was divided into Part One: an investigation of the factors controlling Osoyoos Lake level, and Part Two: development of an outreach program to communicate the results of Part One to local stakeholders. Part One was completed by Summit Environmental Consultants Inc., and Part Two was completed by Sequoia Mediation. The overall objectives of Part One of Study 7 are to: 1. Review the circumstances and factors responsible for Osoyoos Lake levels exceeding feet (277.8 m) USCGS between 1988 and 2008; 2. Review the capabilities of Zosel Dam to regulate water levels, and demonstrate how water levels (especially high levels) would compare in the absence of the dam; 3. Provide an assessment of how Zosel Dam could have been operated differently between 1988 and 2008 to control high water levels on Osoyoos Lake, and how much difference this would have made in terms of the magnitude and duration of the high water levels; 4. Provide a review of the effects on lake levels and Okanogan River flows of operating Zosel Dam with the principal goal of minimizing lake levels that have a negative impact on stakeholders and property owners; and 5. Provide recommendations on how to optimize the storage potential in Osoyoos Lake in the future in order to minimize high water events, while accounting for other stakeholders and the aquatic environment. This report covers Part One of Study 7; Part Two is reported separately by Sequoia Mediation. ii
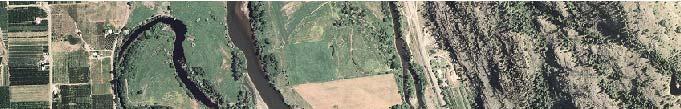
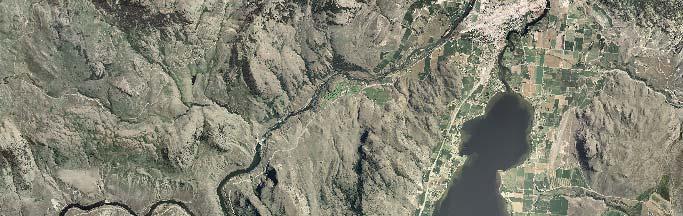
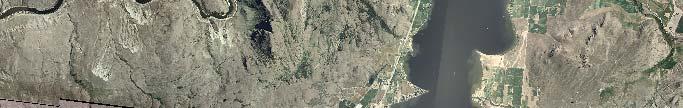
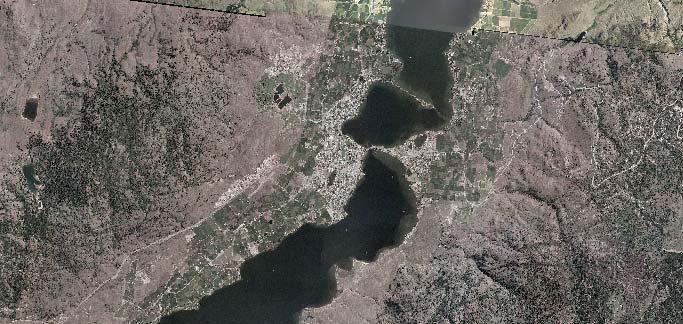
4 Background Osoyoos Lake is located in the southern Okanagan Valley and straddles the border between British Columbia and Washington State. Approximately two-thirds of Osoyoos Lake lies in British Columbia, while one-third is located in Washington State. The Okanagan River flows into Osoyoos Lake at the north end of the lake (Figure 2.1) and represents the largest inflow of water to the lake. Additional inflows to Osoyoos Lake are provided primarily by groundwater, precipitation, and tributary streams (e.g. Inkaneep Creek, Ninemile Creek). The outlet of Osoyoos Lake is located at the southern end of the lake. The river flowing out of the lake is referred to as the Okanogan River (Figure 2.1). Aside from Okanogan River outflows, Osoyoos Lake loses water to evaporation, groundwater, and water extractions for human use. Zosel Dam, which regulates the lake levels, is located approximately 2.5 miles (4 km) downstream from the Osoyoos Lake outlet. The operation of Zosel Dam varies annually based on summer (April 1 to October 31) and winter (November 1 to March 31) operating ranges (Condition 7, Table 2.1). For the winter range, Zosel Dam is operated to maintain Osoyoos Lake water levels between ft (276.1 m) and ft (277.8 m) USCGS. However, for the summer range, the identification of normal and drought conditions, as defined through the Orders of Approval, is required before the operational range of Osoyoos Lake water levels is specified. During summer, Zosel Dam is operated to maintain Osoyoos Lake water levels between ft (277.7 m) and ft (277.8 m) USCGS under normal conditions and between ft (277.5 m) and ft (278.3 m) USCGS under drought conditions. The higher operating range during drought conditions is intended to provide additional storage and flexibility in meeting water demands from Osoyoos Lake and downstream. High water levels within the Similkameen River can restrict the flow within the Okanogan River and outflow of Osoyoos Lake. As a result, the Orders of Approval (Condition 9) state that during appreciable backwater conditions, Zosel Dam shall be operated as to maintain Osoyoos Lake water levels as near as possible to the elevations prescribed in Conditions 7 and 8 (Table 2.1) (IJC 1982). This backwater makes lake level management extremely difficult, especially since it is a natural phenomenon that would occur whether or not Zosel Dam was present (IJC 2000). Additionally, backwater conditions generally occur during the spring freshet when the Okanagan River inflows are large; therefore, management options are limited. In an attempt to reduce Osoyoos Lake levels during high flows in the Similkameen River, the Okanagan River is managed so as to reduce inflows into Osoyoos Lake. However, if high Similkameen River flows occur for an extended period, the management options for the Okanagan River are very limited. iii
5 The IOLBC indicated that the public voices concerns when Osoyoos Lake levels rise above ft (278.2 m) USCGS. Additionally, the public has continued to question the IOLBC about ways to prevent Osoyoos Lake water levels from rising above the target maximum levels (Sequoia Mediation 2010). Consequently, during drought conditions the WSDOE and B.C. Ministry of Environment (MOE) typically make an informal agreement to keep maximum water levels at or below ft (278.2 m) USCGS to limit high water levels. Osoyoos Lake Water Levels, A review of the historic water levels indicates that from 1988 to 2008, Osoyoos Lake has been above its operating range in ten of those years (for variable lengths of time). The highest water levels occurred in 1990, 1991, 1996, and 1997, when peak water levels were above ft (278.3 m) USCGS, under normal operating conditions. During these peak years, actual inflows into Okanagan Lake and flows within the Similkameen River were some of the highest on record (Table 2.2). From 1988 to 2008, Osoyoos Lake has only exceeded its operating range under normal conditions. Under normal operating conditions (in the summer period) Osoyoos Lake water levels have exceeded the top end of the operating range [911.5 ft (277.8 m) USCGS] approximately 21% of the time over the period of record. Additionally, Osoyoos Lake has exceeded ft (278.2 m) USCGS approximately 7% of the time, while it has exceeded ft (278.3 m) USCGS approximately 4% of the time. Osoyoos Lake Storage Capacity Osoyoos Lake has a total storage volume of approximately 24,400 acre-feet (30,100 dam 3 ) over the entire range of Osoyoos Lake s specified operating range (909.0 ft (277.1 m) to ft (278.3 m) USCGS). One acre-foot is a volume of water covering an area of an acre to a depth of one foot, and one dam 3 is a volume measuring 10 m by 10 m by 10 m, and is equivalent to one ML (one million litres). However, during normal and drought operating conditions in the summer period, the total volume of storage is only approximately 3,200 acre-feet (4,000 dam 3 ), and 15,300 acre-feet (18,900 dam 3 ), respectively. Under high water conditions, outflows are often restricted by backwater caused by the Similkameen River. As a result, with the small storage capacity under normal conditions, high inflows, and restricted outflows, lake levels will rise, which has frequently been observed in Osoyoos Lake. However, under drought conditions, the available storage capacity of the lake is almost five times greater than it is under normal conditions. Accordingly, the lake is able to store more water within the iv
6 specified operating range. Therefore, even under backwater conditions when outflows are restricted, there is generally enough storage capacity within the lake to allow for the management of water levels, as evidenced by the fact that water levels have not been observed outside the drought condition operating range from (Table 2.2). Osoyoos Lake Water Balance The water balance of Osoyoos Lake was reviewed to investigate the management options for Zosel Dam, particularly those options to reduce high water levels during normal conditions. In particular, the water balance investigation focused on the years where the water levels were above ft (278.2 m) USCGS. Although the upper limit of the normal operating range is ft (277.8 m) USCGS, the assessment at ft (278.2 m) USCGS allowed for the highest inflow years to be assessed, which have caused the greatest concern regarding the shoreline environment and structures. A water balance spreadsheet model was developed to investigate the management of Zosel Dam. The model was constructed on a daily time step. The role of Zosel Dam and its operation and management strategy were assessed by allowing the model to manipulate streamflow at the USGS station on the Okanogan River (Station No ), located just downstream of Zozel Dam. The water balance spreadsheet model was developed using Microsoft Excel. It requires the following: 1) inputs from inflows into Osoyoos Lake by the Okanagan River (Q in ), 2) outflows out of Osoyoos Lake (and through Zosel Dam) (Q out ), 3) change in Osoyoos Lake volume (ΔS Osoyoos Lake ), and 4) water withdrawals by the Oroville Tonasket Irrigation District (OTID) (WD OTID ). Modeling constraints included the maximum and minimum flow releases during open flow and backwater conditions, which followed those outlined by WSDOE (1990), while a multiple regression equation was developed for maximum flow releases during backwater conditions using Okanogan River discharges, Similkameen River discharges, and Osoyoos Lake water levels. The water balance investigation focused on years where the water levels were above ft (278.2 m) USCGS (i.e. 1990, 1991, 1996, 1997, and 1999). Scenarios were selected to identify what would have happened to the Osoyoos Lake water level if the dam had operated differently during each of these years. The scenarios used for this investigation were the modeling of the adoption of lake level guidelines whereby once normal conditions have been declared by the IOLBC, water levels of Osoyoos Lake are to be kept as close as possible to ft (277.7 m) (Scenario 1); ft ( m) (Scenario 2); and ft ( m) (Scenario 3) USCGS prior to and during spring freshet. v
7 The results indicated that by maximizing the storage potential of Osoyoos Lake prior to spring freshet, some additional storage could be obtained to keep water levels within the specified ranges for a few more days in spring; however, the peak water levels could not be reduced. This was largely a result of backwater conditions within the Okanogan River channel restricting outflow from Zosel Dam. As a result, alternate management of Zosel Dam during the years in question would still have resulted in the high water levels observed. Recommendations The only other feasible way to control Osoyoos Lake levels in normal years is to manage storage upstream on the Okanagan River, or to develop new storage on the Similkameen River. If additional water level control is desired, these two options should be evaluated further. Additionally, Summit recommends that the IJC continue the practice of maintaining the water level at or below ft (278.2 m) USCGS during drought conditions, which will limit the amount of shoreline impacts. Lastly, under normal conditions, and with a low risk of future drought conditions, operators should maintain water levels near the lower limit of the specified operating range (911.0 ft (277.7 m) USCGS) prior to and throughout the spring freshet. This will minimize the period of time for which the lake is at risk of exceeding its target operating range in the summer period. However, if there is a risk that a drought will subsequently be declared, operators should balance the desire to maintain an acceptable lake level for a longer period against the risk that sufficient storage might not be available in a subsequent drought condition. In this case, a higher level within the to foot operating range should be targeted. vi
8 ACKNOWLEDGEMENTS Part One of the study (this report) was completed by Summit Environmental Consultants Inc., with the assistance of Polar Geoscience Ltd. Part Two (under separate cover) was completed by Sequoia Mediation. The study team for Part One would like to thank the members of the Osoyoos Lake Board of Control, staff of the International Joint Commission, Oroville Tonasket Irrigation District, and Washington State Department of Ecology who provided information and guidance throughout this investigation. We would also like to thank the Okanagan Basin Water Board, which provided Osoyoos Lake bathymetry data and water balance information compiled during Phase 2 of the Okanagan Water Supply and Demand Project. vii
9 TABLE OF CONTENTS LETTER OF TRANSMITTAL... i EXECUTIVE SUMMARY... ii ACKNOWLEDGEMENTS... vii TABLE OF CONTENTS... viii LIST OF TABLES... ix LIST OF FIGURES... ix 1.0 INTRODUCTION Project Background Project Objectives Study Methods OSOYOOS LAKE General Characteristics General Hydrology Review Osoyoos Lake Water Level Management Zosel Dam Structure Zosel Dam Operation Backwater Osoyoos Lake Water Levels, Public Concerns OSOYOOS LAKE STORAGE CAPACITY Bathymetric Mapping Operating Range Storage Capacity Storage Capacity Review OSOYOOS LAKE WATER BALANCE INVESTIGATION General Water Balance Water Balance Spreadsheet Model Model Development Input Parameters Osoyoos Lake Inflows, Outflows, and Change in Storage Oroville Tonasket Irrigation District Water Withdrawals Modeling Constraints Maximum Flow Release with No Backwater Maximum Flow Release with Backwater Minimum Flow Release viii
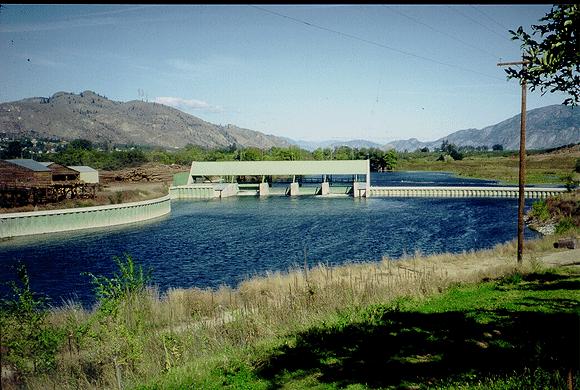
10 4.3 Modeling Scenarios Modeling Results High Water Modeling High Water Modeling High Water Modeling High Water Modeling High Water Modeling Modeling Results Summary SUMMARY AND RECOMMENDATIONS Summary Recommendations REFERENCES Attachment 1 Osoyoos Lake Spreadsheet Model. LIST OF TABLES Table 2.1 Zosel Dam operational procedures Table 2.2 Osoyoos Lake water level summary statistics, Table 2.3 Summary of public comments related to Osoyoos Lake levels (adapted from Sequoia Mediation (2010)) Table 3.1 Osoyoos Lake storage volumes across the IJC s specified operating range Table 4.1 Water Withdrawals by the OTID from the Okanogan River, LIST OF FIGURES Figure 2.1 Osoyoos Lake and selected hydrometric stations Figure 2.2 Mean daily water level of Osoyoos Lake near Oroville, WA (USGS Station No ), Figure 2.3 Aerial view of Zosel Dam indicating the control structure and overflow weir Figure 2.4 Osoyoos Lake winter and summer operating ranges as specified within the IJC s Orders of Approval (adapted from IJC (2000)) Figure 2.5 Zosel Dam and the Okanogan River channel ix
11 Figure 2.6 Osoyoos Lake water level exceedance probabilities under normal conditions, and for the examined period of record, Figure 3.1 Osoyoos Lake bathymetry Figure 3.2 Osoyoos Lake volume capacity storage curve...21 Figure 3.3 Mean daily volumes of Okanagan River near Oliver (WSC Station No. 08NM085), Figure 3.4 Osoyoos Lake water levels, Okanagan River inflows, and Okanogan River outflows in 1993 (a drought year) Figure 4.1 Zosel Dam open flow rating curve (from WSDOE (1990)) Figure 4.2 Figure 4.3 Okanogan River discharge and Osoyoos Lake water level (>911.5 ft (277.8 m) USCGS ) relationship under backwater conditions and normal operations, Okanogan River and Similkameen River discharge relationship under backwater conditions and normal operations, Figure 4.4 The relationship between observed and predicted (using multiple regression) Okanogan River discharges under backwater conditions. 33 Figure 4.5 Modeling results of select scenarios for 1990, 1991, 1996, and Figure 4.6 Modeling results of select scenarios for x
12 1.0 INTRODUCTION 1.1 PROJECT BACKGROUND Zozel Dam is situated on the Okanogan River downstream of the outlet of Osoyoos Lake. Most of the time the dam controls the level of Osoyoos Lake, however under some conditions the dam is unable to prevent the level of the lake from rising beyond its usual range. This study focuses on the operation of the dam, and on whether it could be managed any differently to prevent or reduce the impacts of the exceedances of the usual operating range of lake levels. Osoyoos Lake is operated under Orders of Approval prescribed by the International Joint Commission (IJC) to maintain certain lake levels, which allows for a normal summer period (April 1 October 31) water elevation range of between and feet (277.7 and m) USCGS. When drought conditions are considered to have occurred, this level is allowed to be increased to feet (278.3 m) USCGS within the summer period, through regulation of the outflow through Zosel Dam. However, natural flows during the spring and early summer may result in water levels exceeding the normal upper limit of feet (278.8 m) USCGS. In 2013, the Orders terminate and at that time the IJC will need to know whether to renew or modify them (Glenfir Resources 2006). As a result, Glenfir Resources was commissioned by the IJC to explore issues associated with the present Orders and to recommend studies accordingly. This investigation represents Study 7 recommended by Glenfir Resources (2006). Study 7 is split into two parts: Part 1 includes an independent review of the ability of Zosel Dam to be used for high water control; while Part 2 is the development of an outreach program designed to increase public awareness of the factors that control water levels in Osoyoos Lake during high water events (as outlined in Part 1). This report covers Part 1 of Study 7; Part 2 was completed by Sequoia Mediation (2010), and has been submitted under separate cover. 1.2 PROJECT OBJECTIVES The objectives of this study were outlined in the proposal Plan of Study for Renewal of the International Joint Commission s Osoyoos Lake Orders Studies 7 & 8 submitted by Summit Environmental Consultants (Summit) to the IJC on May 6, 2009: Provide a review of the circumstances and factors responsible for Osoyoos Lake levels exceeding feet (277.8 m) USCGS between 1988 and 2008; 1
13 Provide a review of the capabilities of Zosel Dam to regulate water levels, and demonstrate how water levels (especially high levels) would compare in the absence of the dam; Provide an assessment of how Zosel Dam could have been operated differently between 1988 and 2008 to control high water levels on Osoyoos Lake, and how much difference this would have made in terms of the magnitude and duration of the high water levels; Provide a review of the effects on lake levels and Okanogan River flows of operating Zosel Dam with the principal goal of minimizing lake levels that have a negative impact on stakeholders and property owners; and Provide recommendations on how to optimize the storage potential in Osoyoos Lake in the future in order to minimize high water events, while accounting for other stakeholders and the aquatic environment. 1.3 STUDY METHODS The review and assessment included the following tasks: Project initiation meeting (June 25, 2009) in Oroville, WA with members of the IJC (including members from Environment Canada, United States Geological Survey (USGS), State of Washington Department of Ecology (WSDOE), and the Oroville -Tonasket Irrigation District) to obtain background information and review the scope of work; A field tour between Osoyoos Lake and the Similkameen River on June 25, 2009, with a specific focus on the outlet of Osoyoos Lake, Zosel Dam, and the confluence between the Okanogan and Similkameen Rivers; Review of relevant geologic and topographic information relevant to the identified area of study; Review, compilation, and summarizing of relevant hydrologic information to Osoyoos Lake including USGS streamflow records, Water Survey of Canada (WSC) streamflow records, water use records (actual and modeled), precipitation (modeled), evaporation (modeled), groundwater inflow estimates, lake storage capacity estimates, and naturalized inflow estimates; Development and calibration of a detailed spreadsheet model based on the water balance of Osoyoos Lake to assess flood events since 1988; Analysis and reporting of select scenarios run through the spreadsheet model to identify the results of hypothetical changes to Zosel Dam operation; and Preparation of this report. 2
14 2.0 OSOYOOS LAKE 2.1 GENERAL CHARACTERISTICS Osoyoos Lake lies within the rain shadow of the Okanagan sub-range, which leads to the lowest annual precipitation in Canada. Total precipitation at Osoyoos (Environment Canada Climate Station: Osoyoos West; No ; Elevation m (975.4 ft); normals) averages 12.5 inches (317.6 mm), of which 1.95 inches (49.6 mm) (water equivalent) falls as snow (between the months of October and March). Mean daily temperatures at Osoyoos range from a high of 71.1 F (21.7 C) in July to a low of 28.2 F (-2.1 C) in January. Osoyoos Lake is located in the southern Okanagan Valley and straddles the border between British Columbia and Washington State, east of the Cascade Mountains (Okanagan sub-range) (Figure 2.1). Approximately two-thirds of Osoyoos Lake lies in British Columbia, while one-third is located in Washington State. Osoyoos Lake covers approximately 5,729 acres (23.2 km 2 ) and can store up to 14,323 acre-feet (17,700 dam 3 ) of water (Glenfir Resources 2006). Osoyoos Lake is located at the southern end of the Canadian portion of the Okanagan River watershed. The Okanagan River is a tributary of the Columbia River. In the United States, the river is named Okanogan River. The Okanagan Basin lies in the Thompson Plateau and Okanagan Highland physiographic regions (Holland 1976) and is bounded on the east by the Kettle River Basin, on the west by the Similkameen River Basin, and on the north by the Shuswap River Basin. There are six biogeoclimatic zones in the Okanagan Basin upstream of Osoyoos Lake: Ponderosa Pine (PPxh1), Interior Douglas-fir (IDFxh1), Montane Spruce (MSdm2), Englemann Spruce-Subalpine Fir (ESSFxc1), Interior Cedar Hemlock (ICFmk1), and Bunchgrass (BGxh1). The drainage area of the Okanagan River at Osoyoos Lake is approximately 7,550 km 2 (1,866,000 acres). The Okanagan River flows into Osoyoos Lake at the north end of the lake (Figure 2.1) and is the largest inflow of water to the lake. Additional inflows to Osoyoos Lake are provided by groundwater, precipitation, and tributary streams (e.g. Inkaneep Creek, and Ninemile Creek). The outlet of Osoyoos Lake is located at the southern end of the lake. Aside from Okanogan River outflows, Osoyoos Lake loses water to evaporation, groundwater, and water extractions for human use. Zosel Dam, which regulates the lake levels, is located approximately 2.5 miles (4 km) downstream of Osoyoos Lake outlet. The operation of Zosel Dam is governed by Orders of Approval from the IJC, which are monitored by the International Osoyoos Lake Board of Control (IOLBC), and implemented by the WSDOE. 3
15
16 2.2 GENERAL HYDROLOGY REVIEW According to Obedkoff (2003), the Okanagan Basin is located in the Southern Thompson Plateau and Fraser Plateau Hydrologic Zones (#24 and #15). Snowmelt between April and June is the primary source of runoff in the Okanagan Basin (and Osoyoos Lake). In addition, high intensity thunderstorms and late fall rainstorms are common, recharging soil moisture and producing shortduration peak flows. Low flows generally occur from the end of November to March, and in the hot summer months, with the lowest flows commonly occurring in January or February. Osoyoos Lake water levels follow the Okanagan Basin runoff regime; however, they are also governed by the Okanagan River Regulation System (ORRS), in which flows are partially controlled via dams on Okanagan, Skaha, and Vaseux Lakes and by the operation of Zosel Dam. Additionally, the Similkameen River joins the Okanogan River just below Zosel Dam. Because the peak flow of the Similkameen can be up to 10 times greater than that of the Okanogan River and because the land at the confluence is relatively flat, high water levels in the Similkameen River actually slow or block the flow out of the Okanogan River and Osoyoos Lake. With extreme high water in the Similkameen River (greater than 10,000 ft 3 /s (283 m 3 /s)) 1, flow in the Okanogan River may reverse and flow upstream into Osoyoos Lake, although this reversal is a rare occurrence (last seen in 1976). A more common scenario is for flows into Osoyoos Lake to exceed its outflow capacity. When either of these conditions occur, Osoyoos Lake water levels rise. A more detailed description of the role the Similkameen River plays on Osoyoos Lake water levels is provided in Section of this report. Osoyoos Lake water levels and Okanogan River discharges are also influenced by water extractions from Osoyoos Lake and the Okanogan River, by the Town of Osoyoos and the OTID. The Town of Osoyoos extracts water directly from Osoyoos Lake for domestic and irrigation purposes; with an average annual extraction of approximately 9,000 acre-feet (11,100 dam 3 ). The OTID extracts water from the Okanogan River between Osoyoos Lake outlet and Zosel Dam; with an average annual extraction of approximately 12,900 acre-feet (16,000 dam 3 ) between April and October. The WSC operates a hydrometric station on the Okanagan River near Oliver (WSC Station No. 08NM085); while the USGS operates hydrometric stations on Osoyoos Lake at Oroville (USGS 1 Measured at Similkameen River near Nighthawk, WA (USGS Station No ) (Figure 2.1). 5
17 Station No ) and the Okanogan River at Oroville (USGS Station No ) (Figure 2.1). The records for the hydrometric station on Osoyoos Lake extend from (Figure 2.2) 2. Mean Daily Water Level (ft USCGS) Dark line indicates mean daily water level at "Osoyoos Lake near Oroville, WA", based on data from Gray shading indicates range of daily water level at "Osoyoos Lake near Oroville, WA", based on data from Jan Feb Mar Apr May Jun Jul Aug Sep Oct Nov Dec Figure 2.2 Mean daily water level of Osoyoos Lake near Oroville, WA (USGS Station No ), OSOYOOS LAKE WATER LEVEL MANAGEMENT This study focuses on the regulation of Osoyoos Lake via Zosel Dam. The regulation of the Okanagan River upstream of Osoyoos Lake (via other dams) is not considered further in this study. The timing and magnitude of the Okanagan River inflows to Osoyoos Lake is largely controlled by the B.C. Ministry of Environment (MOE) to meet domestic and irrigation requirements, fisheries needs, and acceptable water levels for recreation, navigation, and tourism. As a result, the Okanagan River impacts Osoyoos Lake water levels, but very few additional management opportunities (upstream of Osoyoos Lake) are available to be used in association with the operation of Zosel Dam to control water levels in Osoyoos Lake. According to Glenfir Resources (2006), the operational plan for 2 Water levels recorded by the hydrometric station Osoyoos Lake at Oroville (USGS Station No ) are reported using the United States Coast and Geodetic Survey Datum (USCGS). 6

18 Okanagan Lake (and subsequently the Okanagan River) reduces flood peaks to Osoyoos Lake, but prolongs the period of high water Zosel Dam Structure Osoyoos Lake water levels are managed through Zosel Dam. Zosel Dam was initially constructed in 1927 as a millpond dam to provide logs to Zosel Mill. As a result of complaints of high lake levels, the IJC held hearings to investigate the hydraulics of the outlet of Osoyoos Lake. Subsequently, the IJC released an Order in 1946 for an increase in the capacity of the dam to pass 2,500 ft 3 /s (70.8 m 3 /s) at a millpond elevation of ft (277.7 m) USCGS (IJC 2001). In 1982, due to the deterioration of Zosel Dam, the IJC issued an Order of Approval for the reconstruction of the dam. As outlined in the Orders (IJC 1982) and Supplementary Orders (IJC 1985), Zosel Dam was to be relocated to its current location, downstream of Tonasket Creek (Figure 2.1). The reconstructed Zosel Dam was completed in 1987 and included a control structure, manual controls, and overflow weir (Figure 2.3). Okanogan River Figure 2.3 Aerial view of Zosel Dam indicating the control structure and overflow weir. 7
19 The overflow weir is 198 ft (60.4 m) long and has a concrete top elevation of ft (278.3 m) USCGS (WSDOE 1990). The control structure is 171 ft (52.1 m) long and consists of four spillways (each with a gate), two fishways, and other associated infrastructure (eg. a control room, a stoplog storage vault, a dewatering pump vault, a gear actuator gallery, and an emergency generator room) (WSDOE 1990). The spillways are 25 ft (7.6 m) wide and have an upstream floor elevation of ft (276.1 m) USCGS and a downstream floor elevation of ft (274.6 m) USCGS; the spillways are designed to pass 2,500 ft 3 /s (70.8 m 3 /s) at an Osoyoos Lake elevation of ft (278.3 m) USCGS (WSDOE 1990). The gates are each 25 ft (7.6 m) wide, 7.5 ft (2.3 m) tall, and can travel 13.5 ft (4.1 m) from fully open to closed; the fishways are located on either side of the spillway section and are 8 ft (2.4 m) wide, 73 ft (22.3 m) long, and each are designed to pass 45 ft 3 /s (1.27 m 3 /s) (WSDOE 1990). The Supplementary Orders (IJC 1985) indicate that all necessary measures are required to ensure that the flow capacity of the Okanogan River, upstream and downstream from Zosel Dam is maintained. The WSDOE currently monitors the channel capacity of the Okanogan River, which is outlined within Study 8 (Summit 2010). Zosel Dam is owned by the WSDOE and operated under contract by the OTID Zosel Dam Operation Osoyoos Lake water levels are managed by the closing and opening of the gates of Zosel Dam. The dam is operated following the procedures outlined within the Orders of Approval (IJC 1982) and WSDOE (1990) included in Table 2.1. The operation of Zosel Dam varies annually based on summer (April 1 to October 31) and winter (November 1 to March 31) operating ranges (Condition 7, Table 2.1). For the winter range, Zosel Dam is operated to maintain Osoyoos Lake water levels between ft (276.1 m) and ft (277.8 m) USCGS. However, for the summer range, the identification of normal and drought conditions, as defined through the Orders of Approval, is required before the operational range of Osoyoos Lake water levels is specified. 8
20 Table 2.1 Zosel Dam operational procedures. Criteria Zosel Dam Operation Reference Upon completion of construction the Applicant, in consultation with the Board of Control appointed under Condition 14, shall operate the works so as to maintain the levels of Osoyoos Lake between elevation and feet (277.7 and m) Condition 7 USCGS to the extent possible from 1 April to 31 October each year except under Order of Approval drought conditions in the Okanogan Valley (in Canada Okanagan Valley), as defined in (IJC 1982; 1985) Condition 8 and also during the appreciable backwater conditions and excessive inflows described in Condition 9. Furthermore, the Applicant shall operate the works so as to maintain the levels of Osoyoos Lake between elevation and feet (277.1 and m) USCGS from 1 November to 31 March each year. During a year of drought as determined by the Board of Control in accordance with the criteria set forth below, the levels of Osoyoos Lake may be raised to feet (278.3 m) USCGS and may be drawn down to feet (277.5 m) USCGS during the period 1 April to 31 October. The criteria are: Condition 8 Condition 9 (a) the volume of flow in the Similkameen River at Nighthawk, Washington for the period April through July as calculated or forecasted by United States authorities is less than 1.0 million acre-feet or (b) the net inflow to Okanagan Lake for the period April through July as calculated or forecasted by Canadian authorities is less than 195,000 acre-feet or (c) the level of Okanagan Lake fails to or is forecasted by Canadian authorities to fail to reach during June or July elevation feet (342.2 m) Canadian Geodetic Survey Datum. Drought year operations shall be terminated when in the opinion of the Board of Control none of the three criteria defining a drought year exist. The level of Osoyoos Lake shall then be maintained in accordance with Condition 7. During appreciable backwater conditions caused by flows in the Similkameen River, particularly during the freshet period, and during abnormal excessive flows in the Okanagan River, the works shall be operated so as to maintain the level of Osoyoos Lake as near as possible to the elevations prescribed in Conditions 7 and 8 herein. In such an event every effort shall be made to lower the level of Osoyoos Lake in the shortest practicable time Order of Approval (IJC 1982; 1985) Order of Approval (IJC 1982; 1985) 9
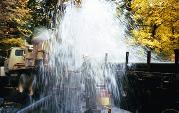
21 Table 2.1 Cont d. Operational Requirement Zosel Dam Operation Reference Condition 9 WSDOE The structure shall be operated to maintain the level of Osoyoos Lake within the prescribed elevations. When appreciable backwater conditions cause the Osoyoos Lake level to exceed feet USCGS, all four gates shall be lifted clear of the water and remain open until the lake level returns to feet (277.8 m) USCGS. Historical runoff patterns of the upper Okanogan River basin and the Similkameen River basin are similar and backwater occurs only during the spring freshet (May June) when high flows are present in both rivers. The operation of Zosel Dam includes the passage of migrating fish. To the extent possible, the following fish consideration should be met when discharging water from Zosel Dam: 1. Discharge 80% of the October average flow during the period between 1 October and 15 April in order to maintain egg/fry survival of Chinook salmon. Chinook spawning, incubation, and emergence occurs between mid-october and mid-april. 2. Discharge 80% of the March average flow during the period between March and 15 June in order to maintain egg/fry survival of steelhead salmon. Steelhead spawning, incubation, and emergence occurs between mid-march and mid-june. Zosel Dam Operating Procedures Plan (WSDOE 1990) Fisheries 3. Stream flows should remain at or above 300 ft 3 /s (8.50 m 3 /s) for full utilization of winter rearing habitats during the months of October to March. 4. Juvenile sockeye salmon outmigration from the Osoyoos Lake nursery area extends from 20 April through 10 June. During this period, sufficient flow at the surface is needed to successfully pass fish through Zosel Dam and subsequently allow them to move downstream out of the Okanagan River. In the absence of any means to provide downstream fish migration at Zosel Dam, the stoplogs are used to form a waterfall to help the sockeye and steelhead pass through the dam. A few stoplogs are placed in the spillway and the gate is opened, allowing water to spill over the stoplogs. 5. A stream flow of 200 ft 3 /s (5.66 m 3 /s) from 15 June to 1 August should be maintained if possible, for the protection of resident fisheries. Zosel Dam Operating Procedures Plan (WSDOE 1990) 10
22 The identification of normal or drought conditions is based on three separate criteria outlined by Condition 8 of the Orders (Table 2.1). These criteria are based on: 1) forecast inflows to the Similkameen River, 2) forecast inflows to Okanagan Lake, and 3) Okanagan Lake levels. For the Similkameen River, water supply forecasts are produced by the National Weather Service, Northwest River Forecast Center, while for Okanagan Lake, water supply and lake level forecasts are produced by the River Forecast Center of the B.C. MOE. Beginning April 1 st the IOLBC reviews each forecast; if any forecast is below the criteria as outlined in Condition 8 (Table 2.1), a drought is declared. Drought declaration is generally based on the April 1 st forecast; however, forecasts are updated every two weeks and the declaration is re-assessed until July 31 st. A drought declaration can be rescinded on the basis of subsequent forecasts, although once a drought has been rescinded, the IOLBC will not re-instate a drought declaration. Accordingly, during the summer operating range, Zosel Dam is operated to maintain Osoyoos Lake water levels between ft (277.7 m) and ft (277.8 m) USCGS under normal conditions and between ft (277.5 m) and ft (278.3 m) 3 USCGS under drought conditions. Annual Osoyoos Lake operating ranges are presented graphically in Figure The WSDOE and MOE agree on trans-border Osoyoos Lake water levels every year and have recently developed an informal agreement for a maximum Osoyoos Lake water level of ft (278.1 m) USCGS during drought conditions, which is consistent with the Orders. 11
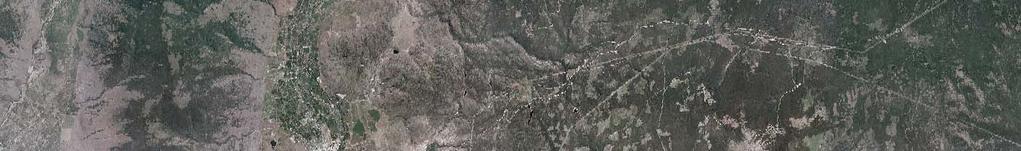
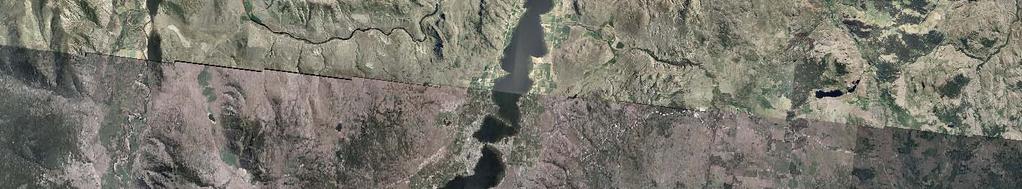
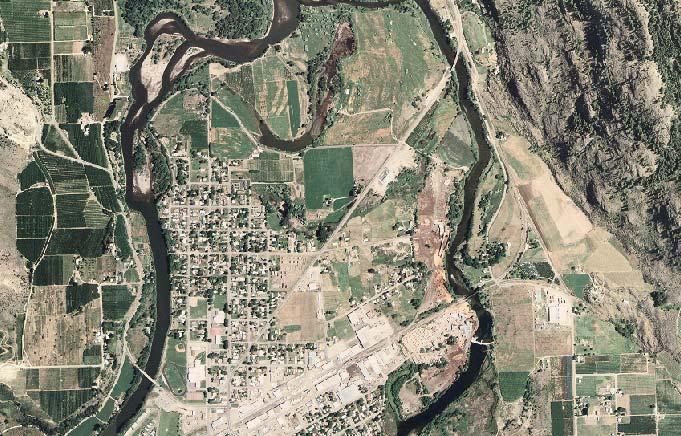
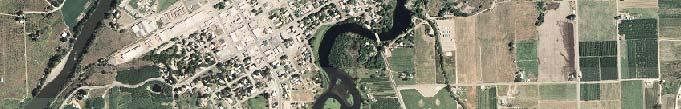
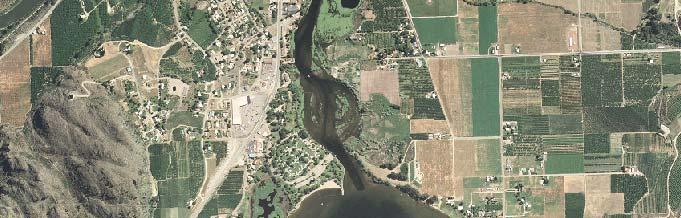
 indicates that because the land surrounding the confluence of the Similkameen and Okanogan Rivers is relatively flat (Figure 2.")
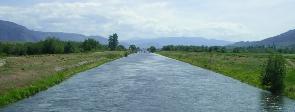
23 Figure 2.4 Osoyoos Lake winter and summer operating ranges as specified within the IJC s Orders of Approval (adapted from IJC (2000)) Backwater The IJC (2000) indicates that because the land surrounding the confluence of the Similkameen and Okanogan Rivers is relatively flat (Figure 2.5), high water levels within the Similkameen River can restrict the flow within the Okanogan River and out of Osoyoos Lake. This restriction has been estimated to occur when the discharge of the Similkameen River exceeds 10,000 ft 3 /s (283 m 3 /s) (as measured at Similkameen River near Nighthawk; USGS Station No ). As a result of this restriction, backwater occurs within the Okanogan River, and if the backwater reduces the outflows from Osoyoos Lake to less than the inflows, the level of Osoyoos Lake will rise. Under extreme high flows in the Similkameen River, a flow reversal of the Okanogan River at Zosel Dam has been observed, but this is rare (the last documented occurrence was 1976) (IJC 2000). Backwater events generally occur during the spring freshet in May and/or June. During the field reconnaissance of the Similkameen and Okanogan River confluence, conducted during the project initiation meeting, the study team identified a point of flow restriction on the Okanogan River at high flows approximately 1.5 miles (2.5 km) downstream of Zosel Dam (Figure 12
24 2.5). At this location, a side channel from the Similkameen River flows into the Okanogan River. A discussion with a resident in the area supported these observations by indicating that a flow restriction does indeed occur at this point during high Similkameen River flows. From an Osoyoos Lake management standpoint, this backwater process makes lake level management difficult, especially since a natural phenomenon is controlling the process (IJC 2000). Additionally, backwater conditions generally occur during the spring freshet when Okanagan River inflows are large. In an attempt to reduce Osoyoos Lake levels during high flows in the Similkameen River, the Okanagan River is managed so as to reduce inflows into Osoyoos Lake. However, if high Similkameen River flows occur for an extended period, the management options for the Okanagan River become very limited (IJC 2000). As a result, the Orders of Approval (Condition 9) state that during appreciable backwater conditions Zosel Dam shall be operated to maintain Osoyoos Lake water levels as near as possible to the elevations prescribed in Conditions 7 and 8 (Table 2.1) (IJC 1982). However, if water levels rise above ft (277.8 m) USCGS under backwater conditions, the WSDOE has directed that all four gates should be lifted clear of the water and remain that way until water levels return to ft (277.8 m) USCGS (WSDOE 1990). The USGS monitors backwater development within the Okanogan River channel downstream of Zosel Dam by using two complementary hydrometric stations: Okanogan River at Oroville, WA (Primary Gauge) (USGS Station No ) and Okanogan River at Oroville, WA (Auxiliary Gauge) (USGS Station No ) (Figure 2.5). Periods of backwater within the Okanogan River are noted by the USGS in their annual water data reports and included within the IOLBC s annual reports to the IJC. Backwater has been reported within the Okanogan River every year from
25
26 2.4 OSOYOOS LAKE WATER LEVELS, A summary of Osoyoos Lake water levels from is provided in Table 2.2. A review of the water levels indicates that from 1988 to 2008, Osoyoos Lake has been outside of its operating range in ten of those years (for variable lengths of time). The highest water levels occurred in 1990, 1991, 1996, and 1997, when peak water levels were above ft (278.3 m) USCGS, under normal operating conditions. During these peak years, actual inflows into Okanagan Lake and flows within the Similkameen River were some of the highest in the 21-year record examined for this study (Table 2.2). From 1988 to 2008, Osoyoos Lake has only exceeded its operating range under normal conditions. The exceedance probability of water levels in Osoyoos Lake (for the summer period April 1 to October 31) from 1988 to 2008 is presented in Figure 2.6. Under normal operating conditions, the Osoyoos Lake water level has exceeded the top end of the operating range (911.5 ft (277.8 m) USCGS) approximately 21% of the time over the period of record. Additionally, Osoyoos Lake has exceeded ft (278.2 m) USCGS approximately 7% of the time, while it exceeded ft (278.3 m) USCGS approximately 4% of the time. The influence of summer period drought condition operations can also be seen on Figure
27 Table 2.2 Osoyoos Lake water level summary statistics, Year Drought Criteria 2 Max Daily WL (ft Min Daily WL (ft Mean Daily WL (ft # Days 1 # Days 1 # Days 1 USCGS) USCGS) USCGS) >911.5 ft >912.5 ft >913.0 ft Similkameen River Okanagan Lake Okanagan Lake Level Volume (acre-feet) Inflows (acre-feet) (ft GSC) Condition , , Drought ,060, , Normal ,565, , Normal ,299, , Normal , , Drought , Drought , , Drought ,305, Normal ,661, , Normal ,946, , Normal ,230, , Drought / Rescinded ,706, , Normal ,070, , Normal , , Drought ,546, , Normal , , Drought ,143, , Drought / Rescinded , , Drought ,065, , Normal ,372, , Normal ,221, , Normal Note: 1. Coloured boxes represent periods when the water level of Osoyoos Lake is outside the operating ranges specified in the Orders of Approval (IJC 1982). 2. The values reported for the drought criteria are actual values, not forecasted. In order for the IOLBC to make a drought declaration (Section 2.3.2), at least one of the following criteria must be met: a. The volume of flow in the Similkameen River at Nighthawk, WA, for the period April through July as calculated or forecasted by United States authorities is less than 1.0 million acre-feet; or b. The net inflow to Okanagan Lake for the period April through July as calculated or forecasted by Canadian authorities is less than 195,000 acre-feet; or c. The level of Okanagan Lake fails to or is forecasted by Canadian authorities to fail to reach during June or July an elevation of ft Canadian Geodetic Survey Datum (GSC). 16
28 916.0 Normal and Drought Conditions Normal Conditions Mean Daily Water Level (ft USCGS) Exceedance Probability (%) Figure 2.6 Osoyoos Lake water level exceedance probabilities for the summer operating period, both under normal conditions, and for normal and drought conditions combined ( data). 2.5 PUBLIC CONCERNS A review of public comments related to Osoyoos Lake level management and the operation of Zosel Dam was completed by Sequoia Mediation (2010). A summary of public comments is provided in Table 2.3; all comments are from IOLBC board meeting minutes,
29 Table 2.3 Summary of public comments related to Osoyoos Lake levels (adapted from Sequoia Mediation (2010)). Key themes or issues raised Total times recorded Development regulations and encroaching lake levels 4 Property damage and erosion 2 Irrigation & agriculture: timing of drought declaration and change in water levels 4 Compensation for loss of land 3 Sewage leakage during spring freshet 1 Lake level management including timing of lake level adjustments 3 Effect of lake level on milfoil control 3 Climate change and potential for change in timing of freshet and amount of water flowing 3 Dams and reservoir installation and/or removal 3 Recreation requirements and hazards of higher lake levels 3 Drought declaration timing and notification 4 Fisheries seasonal requirements 2 For Osoyoos Lake, the IOLBC indicated that public concerns generally begin when lake levels rise above ft (278.2 m) USCGS, as this is the upper limit before beaches are lost, campsites get wet, and basements get flooded (Kirk Johnstone, pers. comm., 2009). These concerns generally come from the Canadian side of Osoyoos Lake, as this side has the largest population of permanent and seasonal residents. Additionally, the public continues to present questions to the IOLBC about ways to prevent Osoyoos Lake water levels from rising above the maximum levels specified (Sequoia Mediation 2010). These inquiries focus on the possibility of operating Zosel Dam or other dams upstream in such a way as to prevent lake levels from exceeding those specified in the Orders of Approval. With the placement of a man-made structure (i.e. Zosel Dam) on the Okanogan River, there are expectations by the public that the dam ought to be able to manage high water levels. 18
30 3.0 OSOYOOS LAKE STORAGE CAPACITY In order to begin to address the public s concerns about high water level management and the IJC s questions regarding the 2013 renewal of the Orders of Approval, an assessment of Osoyoos Lake s storage capacity was completed to provide an initial investigation into the operation of Zosel Dam as a management tool. In a subsequent section (Section 4.0), the storage capacity of Osoyoos Lake is a variable used within a water balance model. 3.1 BATHYMETRIC MAPPING Original bathymetric mapping of Osoyoos Lake was completed by MOE (1971) and MOE (1981a); full Osoyoos Lake bathymetry is provided by MOE (1971), while MOE (1981a) only includes lake bathymetry from the north end of Osoyoos Lake to the international border. Digitization of available hardcopy bathymetries of the Okanagan Basin s mainstem lakes was completed as part of the Okanagan Basin Water Board s (OBWB) Okanagan Basin Water Supply and Demand Project. The digital bathmetries were included in the development of a comprehensive, spatially-distributed deterministic hydrologic model of the Okanagan Basin using the MIKE SHE platform. This project combines a water demand model and the hydrology model into a water balance model that can be used to examine future scenarios driven by changing climate, population, land use, and other key factors. For the present investigation, the study team received approval from the OBWB to use the digitized Osoyoos Lake bathymetry (Figure 3.1) and surface water, groundwater, and water supply and demand study results relevant to this investigation for analysis purposes (Anna Warwick Sears, pers. comm., 2009). 19
31
32 3.2 OPERATING RANGE STORAGE CAPACITY A deliverable from the lake bathymetry digitization work completed for the OBWB was the development of storage capacity rating curves for each of the mainstem lakes in the Okanagan Basin. MOE (1981b) had previously produced a storage capacity curve for Osoyoos Lake; however, the storage curve did not include the lake volume south of the international border. Therefore, the storage capacity rating curve developed by the OBWB for Osoyoos Lake is used to address storage capacity in this investigation; the rating curve is presented in Figure Water Level Elevation (ft USCGS) Water Level Elevation (m USCGS) Storage Volume (acre-feet) 198 Figure 3.2 Osoyoos Lake storage volume capacity rating curve. The rating curve indicates that under the specified operating water level range outlined within the Orders of Approval, Osoyoos Lake s volume ranges from approximately 247,700 acre-feet (305,500 dam 3 ) at an elevation of ft (277.1 m) USCGS to approximately 272,100 acre-feet (335,600 dam 3 ) at an elevation of ft (278.3 m) USCGS (Table 3.1). This results in a total volume of approximately 24,400 acre-feet (30,100 dam 3 ) of storage over the entire range of Osoyoos Lake s specified operating range. However, during normal operating conditions in the summer period (911.0 ft (277.7 m) to ft (277.8 m) USCGS), the total volume of storage is only 3,200 acre-feet (4,000 dam 3 ). During drought conditions (910.5 ft (277.5 m) to ft (278.3 m) USCGS) the storage volume is 15,300 acre-feet (18,900 dam 3 ). 21
International Osoyoos Lake Board of Control Annual Report to the International Joint Commission
 International Osoyoos Lake Board of Control 2013 Annual Report to the International Joint Commission TABLE OF CONTENTS ACTIVITIES OF THE BOARD... 1 HYDROLOGIC CONDITIONS IN 2013... 2 Drought Criteria...
International Osoyoos Lake Board of Control Annual Report to the International Joint Commission
 International Osoyoos Lake Board of Control 2010 Annual Report to the International Joint Commission TABLE OF CONTENTS ACTIVITIES OF THE BOARD... 1 HYDROLOGIC CONDITIONS IN 2010... 2 Drought Criteria...
Natural Factors Affecting the Level of Osoyoos Lake
 Natural Factors Affecting the Level of Osoyoos Lake Background Osoyoos Lake is operated under conditions prescribed by the International Joint Commission (IJC) and Figure 1 shows the ranges within which
Annual Report to the. International Joint Commission. from the. International Osoyoos Lake Board of Control for
 Annual Report to the International Joint Commission from the International Osoyoos Lake Board of Control for Calendar Year 2005 INTERNATIONAL JOINT COMMISSION International Osoyoos Lake Board of Control
Recommendations for Renewal of the International Joint Commission s Osoyoos Lake Order
 Recommendations for Renewal of the International Joint Commission s Osoyoos Lake Order Prepared by the International Osoyoos Lake Board of Control June 21, 2012 1 Contents Executive Summary... 1 Introduction...
International Osoyoos Lake Board of Control Annual Report to the International Joint Commission
 International Osoyoos Lake Board of Control 2015 Annual Report to the International Joint Commission Cover: Northern extent of Osoyoos Lake, where the Okanagan River enters the lake, 2015. View is to the
MINUTES International Osoyoos Lake Board of Control Public Meeting. The Oroville Depot 1210 Ironwood Street, Oroville, Washington
 MINUTES International Osoyoos Lake Board of Control Public Meeting The Oroville Depot 1210 Ironwood Street, Oroville, Washington Monday September 24, 2012 7:30 PM Attendance United States Canada Chairs
LESOTHO HIGHLANDS DEVELOPMENT AUTHORITY
 LESOTHO HIGHLANDS DEVELOPMENT AUTHORITY ANNUAL FLOW RELEASES INSTREAM FLOW REQUIREMENT (IFR) IMPLEMENTATION AND MONITORING (October 2004 to September 2005) TOWER ON MALIBAMATŠO RIVER @ KAO REPORT N0.6
Hydrology Input for West Souris River IWMP
 Hydrology Input for West Souris River IWMP Prepared by: Mark Lee Manitoba Water Stewardship 1 1 1 Overall view of: drainage area watershed characteristics gauging stations meteorological stations Runoff
Lake Chelan Operations
 Lake Chelan Operations IPMA Executive Seminar September 17, 2013 Presented by: Janet Jaspers Chelan County PUD Lake Chelan Hydroelectric Project Today s Discussion Chelan PUD Overview Interesting Facts
PERFORMANCE MEASURE INFORMATION SHEET #16
 PERFORMANCE MEASURE INFORMATION SHEET #16 ARROW LAKES RESERVOIR: RECREATION Objective / Location Recreation/Arrow Lakes Reservoir Performance Measure Access Days Units Description MSIC 1) # Access Days
LESOTHO HIGHLANDS DEVELOPMENT AUTHORITY
 LESOTHO HIGHLANDS DEVELOPMENT AUTHORITY ANNUAL FLOW RELEASES INSTREAM FLOW REQUIREMENT (IFR) IMPLEMENTATION AND MONITORING (October 2005 to September 2006) REPORT N0.7 OCTOBER 2007 STRATEGIC AND CORPORATE
HYDRAULIC DESIGN OF THE TOURISTIC BERTHING IN ASWAN CITY
 HYDRAULIC DESIGN OF THE TOURISTIC BERTHING IN ASWAN CITY Dr. Hossam El-Sersawy Researcher, Nile Research Institute (NRI), National Water Research Center (NWRC), Egypt E-mail: h_sersawy@hotmail.com Dr.
Hydrological study for the operation of Aposelemis reservoir Extended abstract
 Hydrological study for the operation of Aposelemis Extended abstract Scope and contents of the study The scope of the study was the analytic and systematic approach of the Aposelemis operation, based on
CITY OF LYNDEN STORMWATER MANAGEMENT PROGRAM REPORT MARCH 1, 2016
 CITY OF LYNDEN STORMWATER MANAGEMENT PROGRAM 2015 WATER QUALITY MONITORING REPORT CITY OF LYNDEN 300 4 TH STREET LYNDEN, WASHINGTON 98264 PHONE (360) 354-3446 MARCH 1, 2016 This document serves as an attachment
Finn Creek Park. Management Direction Statement Amendment
 Finn Creek Park Management Direction Statement Amendment November 2013 Management Direction Statement Amendment Approved by: Jeff Leahy Regional Director, Thompson Cariboo BC Parks November 12, 2013 Date
Common Ground Drainage Channel Diversion. Design Report
 Common Ground Drainage Channel Diversion Design Report Resource Management International Inc Consulting Engineers May 2017 COMMON GROUND DRAINAGE CHANNEL DIVERSION PREPARED FOR: QUILL LAKES WATERSHED NO.
Yard Creek Provincial Park. Management Plan
 Yard Creek Provincial Park Management Plan Draft January 2010 Yard Creek Provincial Park Management Plan Approved by: telàlsemkin/siyam/chief Scott Benton Bill Williams Squamish Executive Director ation
Pillar Park. Management Plan
 Pillar Park Management Plan January 2014 Pillar Park Management Plan Approved by: Jeff Leahy Regional Director Thompson Cariboo Region BC Parks January 9, 2014 Date Brian Bawtinheimer Executive Director
MANAGING FRESHWATER INFLOWS TO ESTUARIES
 MANAGING FRESHWATER INFLOWS TO ESTUARIES Yuna River Hydrologic Characterization A. Warner Warner, A. (2005). Yuna River Hydrologic Characterization. University Park, Pennsylvania: The Nature Conservancy.
SECTION 3 GENERAL DESCRIPTION OF THE RIVER BASIN
 SECTION 3 GENERAL DESCRIPTION OF THE RIVER BASIN SECTION 3 GENERAL DESCRIPTION OF THE RIVER BASIN River basin description. A general description of the river basin or subbasin, as appropriate, in which
Rule Governing the Designation and Establishment of All-Terrain Vehicle Use Trails on State Land
 Rule Governing the Designation and Establishment of All-Terrain Vehicle Use Trails on State Land 1.0 Authority 1.1 This rule is promulgated pursuant to 23 V.S.A. 3506. Section 3506 (b)(4) states that an
IRRIGATION IN AGRICULTURE AND CLIMATE CHANGE. Agrotech, 2017
 IRRIGATION IN AGRICULTURE AND CLIMATE CHANGE Agrotech, 217 Legislation Current situation Needs, possibilities, existing and potential problems Irrigation is regulated with the Water Law, and when it comes
Annual Weather Book RECORDED BY NW RESEARCH & OUTREACH CTR. By: Michael Leiseth
 Annual Weather Book RECORDED BY NW RESEARCH & OUTREACH CTR. By: Michael Leiseth Table I II 1 2 3 4 5 6 7 8 9, 10 11, 12 13, 14 15, 16 17 18 An average year in Crookston, MN. Seasonal extremes in Crookston,
Policy PL Date Issued February 10, 2014
 Subject RENEWABLE ENERGY ON CROWN LAND Compiled by Renewable Energy Program, Biodiversity Branch Replaces Policy Directives Waterpower Site Release Crown Land Onshore Windpower Development - Crown Land
Appalachian Power Company Smith Mountain Hydroelectric Project FERC No Debris Management Plan
 Appalachian Power Company Smith Mountain Hydroelectric Project FERC No. 2210 Debris Management Plan Final July2008 TABLE OF CONTENTS Description Page SUMMARY 1 1.0 Introduction.. 2 1.1 Project Lands and
City of Fort Lauderdale. Frequently Asked Questions. Proposed Sea Wall Ordinance
 City of Fort Lauderdale Frequently Asked Questions Proposed Sea Wall Ordinance The City of Fort Lauderdale is considering amending the Unified Land Development Regulations of the City of Fort Lauderdale
COMMISSION OF THE EUROPEAN COMMUNITIES. Draft. COMMISSION REGULATION (EU) No /2010
 No /2010") COMMISSION OF THE EUROPEAN COMMUNITIES Brussels, XXX Draft COMMISSION REGULATION (EU) No /2010 of [ ] on safety oversight in air traffic management and air navigation services (Text with EEA relevance)
COMMISSION OF THE EUROPEAN COMMUNITIES Brussels, XXX Draft COMMISSION REGULATION (EU) No /2010 of [ ] on safety oversight in air traffic management and air navigation services (Text with EEA relevance)
M.J. Milne & Associates Ltd.
 M.J. Milne & Associates Ltd. March, 29 Tolko Industries Ltd. 6 Yellowhead Highway RR#, Site, C Kamloops, BC V2C K Attention: Mr. Michael Bragg, R.P.F. Dear Sir: Re: Risk Rating Evaluation Non-status Roads
BOULDER CREEK CATTLE FENCING FOR KOKANEE HABITAT ENHANCEMENT 2010
 BOULDER CREEK CATTLE FENCING FOR KOKANEE HABITAT ENHANCEMENT 2010 Prepared for the: FISH & WILDLIFE COMPENSATION PROGRAM, NELSON, B.C. Prepared by: Marc André Beaucher CRESTON VALLEY WILDLIFE MANAGEMENT
Hydraulic Report. Trail 5 Snowmobile Trail Over Mulligan Creek. Prepared By: COLEMAN ENGINEERING COMPANY Karisa V. Falls, P.E.
 Prepared for: Prepared by: Marquette County Road Commission Coleman Engineering Company Marquette, Michigan Iron Mountain, MI December 2011 Hydraulic Report Trail 5 Snowmobile Trail Over Mulligan Creek
ATM Network Performance Report
 ATM Network Performance Report 2018. Page 1 of 16 Table of contents Summary... 3 Network Wide Performance... 4 Airborne delay... 4 Sydney... 6 Airborne delay... 6 Notable events... 6 Melbourne... 9 Airborne
Terms of Reference (ToR) for a Short-Term assignment
 for a Short-Term assignment") Terms of Reference (ToR) for a Short-Term assignment Technical assistance requested Expert for climate change mitigation and adaptation Project Title Outline of the Climate Adaptation Strategy and basin-wide
Terms of Reference (ToR) for a Short-Term assignment Technical assistance requested Expert for climate change mitigation and adaptation Project Title Outline of the Climate Adaptation Strategy and basin-wide
Mark West Creek Flow Study Report
 Mark West Creek Flow Study Report Biology and Geology of Mark West Creek The headwaters of Mark West Creek are located in the Mayacamas Mountain range, which border Napa and Sonoma County, where it then
Jeneberang River. Serial No. : Indonesia-10 Location: South Sulawesi Area: 727 km 2 Origin: Mt. Bawakaraeng (2,833 MSL) Outlet: Makassar Strait
 Outlet: Makassar Strait") Jeneberang River Map of River Table of Basic Data Name: Jeneberang River Serial No. : Indonesia-10 Location: South Sulawesi S 5 10' 00" - 5 26' 00" E 119 23' 50" - 119 56' 10" Area: 727 km 2 Origin: Mt.
Jeneberang River Map of River Table of Basic Data Name: Jeneberang River Serial No. : Indonesia-10 Location: South Sulawesi S 5 10' 00" - 5 26' 00" E 119 23' 50" - 119 56' 10" Area: 727 km 2 Origin: Mt.
Welcome KROSNO CREEK DIVERSION PROJECT CLASS ENVIRONMENTAL ASSESSMENT
 Welcome KROSNO CREEK DIVERSION PROJECT PUBLIC INFORMATION CENTRE # 1 Tonight s Presentation Study Overview Background Existing Conditions Alternative Solutions Preliminary Preferred Solution Next Steps
COMMISSION IMPLEMENTING REGULATION (EU)
") 18.10.2011 Official Journal of the European Union L 271/15 COMMISSION IMPLEMENTING REGULATION (EU) No 1034/2011 of 17 October 2011 on safety oversight in air traffic management and air navigation services
18.10.2011 Official Journal of the European Union L 271/15 COMMISSION IMPLEMENTING REGULATION (EU) No 1034/2011 of 17 October 2011 on safety oversight in air traffic management and air navigation services
Chapter 2: El Dorado County Characteristics and Demographics
 Chapter 2: El Dorado County Characteristics and Demographics 2.1 Geographic Area and Demographics El Dorado County comprises 1,805 square miles with over half of the area in the Eldorado National Forest
April 10, Mark Stiles San Juan Public Lands Center Manager 15 Burnett Court Durango, CO Dear Mark,
 Mark Stiles San Juan Public Lands Center Manager 15 Burnett Court Durango, CO 81301 Dear Mark, We are pleased to offer the following comments on the draft San Juan Public Lands Center management plans
Agenda Report. Spruce Street Outlet Drainage Improvements Tower Road Relief Sewer
 Agenda Report Subject: Prepared By: Spruce Street Outlet Drainage Improvements Tower Road Relief Sewer Steven M. Saunders, Director of Public Works/Village Engineer Date: August 12, 2012 On March 8, 2012
"Transboundary coordination according to the FD Directive in the shared river basins of Greece
 Workshop on Transboundary Issues Budapest March 31st April 1st "Transboundary coordination according to the FD Directive in the shared river basins of Greece Katerina Triantafyllou, ECOS Consulting S.A.
Snow, Glacier and GLOF
 Snow, Glacier and GLOF & Report on Demonstration River Basin Activities Upper Indus Basin The 5th International Coordination Group (ICG) Meeting GEOSS Asian Water Cycle Initiative (AWCI) Tokyo, Japan,
Port of Friday Harbor
 REQUEST FOR STATEMENTS OF QUALIFICATIONS (RFQ) TO PROVIDE ENGINEERING / CONSULTANT SERVICES AT FRIDAY HARBOR AIRPORT Dated: February 15, 2018 Pursuant to RCW, Chapter 39.80 and FAA AC 150/5100-14E, the
Cau River. Map of River. Table of Basic Data. Vietnam 5
 Cau River Map of River Table of Basic Data Name: Cau River Location: Thai Nguyen, Province, Viet Nam Area: 6,030 km 2 Origin: Mt. Phia Deng 1,527 m Outlet: Pha Lai Note: * Indicates missing data in some
WORKING TOGETHER TO ENHANCE AIRPORT OPERATIONAL SAFETY. Ermenando Silva APEX, in Safety Manager ACI, World
 WORKING TOGETHER TO ENHANCE AIRPORT OPERATIONAL SAFETY Ermenando Silva APEX, in Safety Manager ACI, World Aerodrome Manual The aim and objectives of the aerodrome manual and how it is to be used by operating
ASSESSMENT OF FECAL COLIFORM IN LITTLE RABBIT CREEK AND LITTLE SURVIVAL CREEK
 ASSESSMENT OF FECAL COLIFORM IN LITTLE RABBIT CREEK AND LITTLE SURVIVAL CREEK FINAL REPORT Prepared for: Alaska Department of Environmental Conservation 555 Cordova Street Anchorage, Alaska 99501 Prepared
SUMMER VILLAGE OF SILVER SANDS. Municipal Development Plan
 SUMMER VILLAGE OF SILVER SANDS Municipal Development Plan Bylaw 253-2014 Adopted August 22, 2014 Summer Village of Silver Sands Municipal Development Plan Bylaw No. 253-2014 Page 2 1 INTRODUCTION 1.1 SETTING
Insights in the water-energy-food nexus in the Nile Basin with the new Eastern Nile Water Simulation Model
 Insights in the water-energy-food nexus in the Nile Basin with the new Eastern Nile Water Simulation Model Wil N.M. van der Krogt, Henk J.M. Ogink For International Conference Sustainability in the WaterEnergy-Food
Performance monitoring report for 2014/15
 Performance monitoring report for 20/15 Date of issue: August 2015 Gatwick Airport Limited Summary Gatwick Airport is performing well for passengers and airlines, and in many aspects is ahead of the performance
Chapter 4.0 Alternatives Analysis
 Chapter 4.0 Alternatives Analysis Chapter 1 accumulated the baseline of existing airport data, Chapter 2 presented the outlook for the future in terms of operational activity, Chapter 3 defined the facilities
ACTION PLAN FOR THE PERIOD concerning the STRATEGY ON IMPLEMENTATION OF THE FRAMEWORK AGREEMENT ON THE SAVA RIVER BASIN
 Doc. 1S-26-O-11-5/1-2 ACTION PLAN FOR THE PERIOD 2011-2015 concerning the STRATEGY ON IMPLEMENTATION OF THE FRAMEWORK AGREEMENT ON THE SAVA RIVER BASIN April 2011 Table of Contents INTRODUCTION... 5 1.
Juvenile coho salmon use of constructed off-channel habitats in two Lower Klamath River tributaries: McGarvey Creek & Terwer Creek
 Juvenile coho salmon use of constructed off-channel habitats in two Lower Klamath River tributaries: McGarvey Creek & Terwer Creek Prepared by: Yurok Tribal Fisheries Program PO Box 1027, Klamath, CA Spring
Update on FLOODS in Nigeria
 EUROPEAN COMMISSION JOINT RESEARCH CENTRE Update on FLOODS in Nigeria JRC Emergency Report #021 Nigeria, 19th of September 2018 Executive Summary The National Emergency Management Agency (NEMA) informs
GOOSENECK SWAMP INFORMATION DAY - Saturday 14 th December 2013
 GOOSENECK SWAMP INFORMATION DAY - Saturday 14 th December 2013 Progress of a restoration trial at Gooseneck Swamp - Grampians National Park, Victoria Gooseneck Swamp is situated at the far south-eastern
Stephanie Sinnott, Executive Director, Finance, Office of the City Manager
 Public Report To: From: Finance Committee Stephanie Sinnott, Executive Director, Finance, Office of the City Manager Paul D. Ralph, BES, RPP, MCIP, Commissioner, Development Services Department Report
FLOW REDUCTION IMPACTS ALONG RIVER NILE IN EGYPT
 FLOW REDUCTION IMPACTS ALONG RIVER NILE IN EGYPT Sherine S. Ismail Prof., Head of Lake Nasser studies department, Nile Research Institute, E-mail:sherine_shawky@yahoo.com ABSTRACT Nile water discharges
Datum Issues in the Red River of the North Basin ----
 Datum Issues in the Red River of the North Basin ---- Scoping Document May 1999 Russell E. Harkness, Hydrologist United States Geological Survey Water Resources Division 2 EXECUTIVE SUMMARY Two datum issues
Watershed Runoff Analysis
 CREATING SOLUTIONS FOR A CHANGING WORLD Watershed Runoff Analysis April 18, 2017 John Melack, UCSB Ed Beighley & Dongmei Feng, Northeastern University Study Workflow Civil and Environmental Engineering
4. Hydrology of the Olentangy River Watershed
 4. Hydrology of the Olentangy River Watershed The Hydrologic Cycle Water on Planet Earth is dynamic constantly being recycled from the land to the atmosphere to the ocean. Rivers and streams are just a
PBN ROUTE SPACING AND CNS REQUIREMENTS (Presented by Secretariat)
") International Civil Aviation Organization The First Meeting of South China Sea Major Traffic Flow Review Group (SCS-MTFRG/1) Kuala Lumpur, Malaysia, 19-20 January 2015 Agenda Item 5: Discuss strategy for
International Civil Aviation Organization The First Meeting of South China Sea Major Traffic Flow Review Group (SCS-MTFRG/1) Kuala Lumpur, Malaysia, 19-20 January 2015 Agenda Item 5: Discuss strategy for
Environmental Impact Assessment in Chile, its application in the case of glaciers. Carlos Salazar Hydro21 Consultores Ltda.
 Environmental Impact Assessment in Chile, its application in the case of glaciers Carlos Salazar Hydro21 Consultores Ltda. carlos.salazar@hydro21.cl Introduction Changes in the environmental law in Chile
Proposal to Redevelop Lower Kananaskis River-Barrier Lake. Bow Valley Provincial Park. Frequently Asked Questions
 Proposal to Redevelop Lower Kananaskis River-Barrier Lake Bow Valley Provincial Park Frequently Asked Questions What is being proposed? What are the details of the proposal? Where is the project area located?
Evaluation of Alternative Aircraft Types Dr. Peter Belobaba
 Evaluation of Alternative Aircraft Types Dr. Peter Belobaba Istanbul Technical University Air Transportation Management M.Sc. Program Network, Fleet and Schedule Strategic Planning Module 5: 10 March 2014
Waukegan & Calumet Rivers. All Hands Meeting
 Waukegan & Calumet Rivers 516(e) Update All Hands Meeting David F. Bucaro, P.E. Chief, Economic Formulation & Analysis Section, Planning Branch May 18 th, 2011 Kensington Court Ann Arbor, MI 1 2 Waukegan
INTRODUCTION 250,000
 INTRODUCTION The United States of America has over 250,000 rivers, with a total of about 3,500,000 miles of rivers. The main stems of 38 rivers in the United States are at least 500 miles (800 km) long.
Enhancing hydrological data management and exchange procedures
 Enhancing hydrological data management and exchange procedures The Sava River Hydraulic Model Dr Mark R Jourdan, PE Research Hydraulic Engineer U.S. Army Engineer Research and Development Center Vicksburg,
Thailand 12. Pasak River. Map of River
 Pasak River Map of River 232 Table of Basic Data Name: Pasak river Serial No. : Thailand-12 Location: Central part of Thailand N 14 21' 44" ~ 17 06' 02" E 100 34' 40" ~ 101 32' 56" Area: 15,779 km 2 Length
ES Aircraft Deicing Document Identification Number Date: March 15, ) Activity Description:
 Activity Description:") ES-301-1.06 Aircraft Deicing Document Identification Number ES-301-1.06 Date: March 15, 2018 Document Owner: Keith Pass 1) Activity Description: Aircraft deicing is the application of aircraft deicing
ES-301-1.06 Aircraft Deicing Document Identification Number ES-301-1.06 Date: March 15, 2018 Document Owner: Keith Pass 1) Activity Description: Aircraft deicing is the application of aircraft deicing
Noise Oversight Committee
 Noise Oversight Committee May 8, 2014 Audio/Video recordings are made of this meeting 1 Item 1 Review and Approve Draft Meeting Minutes Minutes from March 19, 2014 2 Item 2 Review of Operations Report
Bayview Escarpment. Interim Management Statement
 Bayview Escarpment Interim Management Statement Bayview Escarpment Provincial Nature Reserve Interim Management Statement January 15, 1995 REGIONAL DIRECTOR'S APPROVAL STATEMENT This Interim Management
Dallas Executive Airport
 648 DECLARED DISTANCE OPTION 1a DISPLACE 31 THRESHOLD BY 97 Considers RSA Limiting Factor No runway extensions 13 31 TORA 6,451 6,451 TODA 6,451 6,451 ASDA 5,958 6,451 LDA 5,958 6,354 Runway 17-35 (3,8
International Sava River Basin Commission
 International Sava River Basin Commission Pilot project on climate change: Building the link between the Flood Risk Management planning and climate change assessment in the Sava River Basin climate change
II. THE BOULDER CREEK DRAINAGE BASIN
 II. THE BOULDER CREEK DRAINAGE BASIN This section provides an overview of the watersheds and flood hazards associated with Boulder Creek and South Boulder Creek including descriptions of the drainage basins,
Fred Antoine Park. Management Plan. Final Public Review Draft
 Fred Antoine Park Management Plan Final Public Review Draft March 2016 Fred Antoine Park Management Plan Approved by: Jeff Leahy Regional Director Thompson Cariboo Region BC Parks Date Brian Bawtinheimer
PERFORMANCE REPORT NOVEMBER 2017
 PERFORMANCE REPORT NOVEMBER 2017 Note: New FY2018 Goal/Target/Min or Max incorporated in the Fixed Route and Connection Dashboards. Keith A. Clinkscale Performance Manager INTRODUCTION/BACKGROUND In June
WALKER SWAMP INFORMATION DAY Saturday 23 rd June 2018
 WALKER SWAMP INFORMATION DAY Saturday 23 rd June 2018 Introduction to the Upper Wannon River Floodplain wetlands and the new Walker Swamp Restoration Reserve Mark Bachmann and Greg Kerr, Nature Glenelg
STRATEGY/ACTION PLAN FOR IMPLEMENTATION OF REDUCED VERTICAL SEPARATION MINIMA IN THE AFRICA-INDIAN OCEAN REGION 22 NOVEMBER 2003
 STRATEGY/ACTION PLAN FOR IMPLEMENTATION OF REDUCED VERTICAL SEPARATION MINIMA IN THE AFRICA-INDIAN OCEAN REGION 22 NOVEMBER 2003 Prepared by the APIRG RVSM Implementation Task Force AFI STRATEGY/ACTION
HYDROELECTRIC POWER PLANTS ON THE LOWER SAVA RIVER
 HYDROELECTRIC POWER PLANTS ON THE LOWER SAVA RIVER The construction of a chain of hydroelectric power plants on the lower course of the Sava River is a multi-purpose project that makes a significant contribution
AGENDA ITEM D4. T:\Board Folders\Board Agenda\Science and Technology\D4 Big Fish Lake Augmentation Agreement
 AGENDA ITEM D4 DATE: December 1, 2015 TO: Matt Jordan, General Manager FROM: Alison Adams, Chief Technical Officer SUBJECT: Lake Augmentation Agreement with the Barthle Brothers Ranch, LLC Approve SUMMARY:
January 2018 Air Traffic Activity Summary
 January 2018 Air Traffic Activity Summary Jan-2018 Jan-2017 CY-2018 CY-2017 Passengers 528,947 505,421 4.7% 528,947 505,421 4.7% Passengers 537,332 515,787 4.2% 537,332 515,787 4.2% Passengers 1,066,279
Emily to Blind Lake Trail PROPOSED TRAIL DEVELOPMENT APPLICATION SUMMARY
 Emily to Blind Lake Trail PROPOSED TRAIL DEVELOPMENT APPLICATION SUMMARY Township 137 Range 26 (Fairfield Township) sections 2 & 3 Township 138 Range 26 (City of Emily) sections 27, 34, 35, & 36 Township
EAST DON TRAIL ENVIRONMENTAL ASSESSMENT. Community Liaison Committee Meeting #3 July 15, :30 to 8:30 pm Flemingdon Park Library
 EAST DON TRAIL ENVIRONMENTAL ASSESSMENT Community Liaison Committee Meeting #3 July 15, 2013 6:30 to 8:30 pm Flemingdon Park Library Agenda 1. Welcome 2. Housekeeping and Updates a) Housekeeping b) CLC
Decision Memo for Desolation Trail: Mill D to Desolation Lake Trail Relocation
 for Salt Lake County, Utah Uinta-Wasatch-Cache National Forest Salt Lake Ranger District 1. Background The present location of the Desolation Trail (#1159) between Mill D and Desolation Lake follows old
Introduction. The System. Model Limitations, Assumptions, and Parameters. Optional Services Tech Memo
 Optional Services Tech Memo Introduction This technical memo evaluates the impact of a tide gate to be installed at the confluence of the Left Bank Tributary of Thalia Creek and Lake Windsor. Specifically,
(Also known as the Den-Ice Agreements Program) Evaluation & Advisory Services. Transport Canada
 Evaluation & Advisory Services. Transport Canada") Evaluation of Transport Canada s Program of Payments to Other Government or International Agencies for the Operation and Maintenance of Airports, Air Navigation, and Airways Facilities (Also known as the
Evaluation of Transport Canada s Program of Payments to Other Government or International Agencies for the Operation and Maintenance of Airports, Air Navigation, and Airways Facilities (Also known as the
Observing Subtleties: Traditional Knowledge and Optimal Water Management of Lake St. Martin
 Observing Subtleties: Traditional Knowledge and Optimal Water Management of Lake St. Martin Myrle Traverse and Richard Baydack Abstract Lake St. Martin First Nation is an Anishinaabe community situated
Victor Lake Park. Management Plan
 Victor Lake Park Management Plan November 2012 Victor Lake Park Management Plan Approved by: Jeff Leahy, Regional Director Thompson Cariboo Region BC Parks March 28, 2012 Date Brian Bawtinheimer, Executive
CIVIL AVIATION AUTHORITY, PAKISTAN OPERATIONAL CONTROL SYSTEMS CONTENTS
 CIVIL AVIATION AUTHORITY, PAKISTAN Air Navigation Order No. : 91-0004 Date : 7 th April, 2010 Issue : Two OPERATIONAL CONTROL SYSTEMS CONTENTS SECTIONS 1. Authority 2. Purpose 3. Scope 4. Operational Control
EXHIBIT K TERMINAL PROJECT PROCEDURES PHASE I - DEVELOPMENT OF TERMINAL PROGRAM & ALTERNATIVES
 EXHIBIT K TERMINAL PROJECT PROCEDURES PHASE I - DEVELOPMENT OF TERMINAL PROGRAM & ALTERNATIVES Over the term of the Master Amendment to the Airline Use and Lease Agreement, the Kansas City Aviation Department
JOSLIN FIELD, MAGIC VALLEY REGIONAL AIRPORT DECEMBER 2012
 1. Introduction The Federal Aviation Administration (FAA) recommends that airport master plans be updated every 5 years or as necessary to keep them current. The Master Plan for Joslin Field, Magic Valley
Frizzell Creek Ranch Summerville, OR $1,400, ± Acres
 Frizzell Creek Ranch Summerville, OR $1,400,000 165± Acres 1 Introduction The Frizzell Creek Ranch is a beautiful 165± acre ranch located in northeast Oregon at the base of the Wallowa Whitman National
Gold Coast Airport Aircraft Noise Information Report
 Gold Coast Airport Aircraft Noise Information Report Quarter 3 2012 (July to September) 1 Version Control Version Number Detail Prepared by Date 1 - Environment 2 November 2012 2 Updated Figure 10 Environment
WORKSHOP 1 ICAO RPAS Panel Working Group 1 Airworthiness
 REMOTELY PILOTED AIRCRAFT SYSTEMS SYMPOSIUM 23-25 March 2015 WORKSHOP 1 ICAO RPAS Panel Working Group 1 Airworthiness Stephen George Bruno Moitre Rapporteurs WG1 Remotely Piloted Aircraft Systems (RPAS)
Recommendations for Northbound Aircraft Departure Concerns over South Minneapolis
 Recommendations for Northbound Aircraft Departure Concerns over South Minneapolis March 21, 2012 Noise Oversight Committee Agenda Item #4 Minneapolis Council Member John Quincy Background Summer of 2011
Rainfall Appendix. Summary Statistics of Rainfall Data for Sites in the West-Central Florida. A Simple Conceptualized Rainfall/Discharge Relationship
 Rainfall Appendix Summary Statistics of Rainfall Data for Sites in the West-Central Florida A Simple Conceptualized Rainfall/Discharge Relationship Stream or river flows are, of course, integrally associated
Runway Roughness Evaluation- Boeing Bump Methodology
 FLIGHT SERVICES Runway Roughness Evaluation- Boeing Bump Methodology Michael Roginski, PE, Principal Engineer Boeing Airport Compatibility Engineering ALACPA XI Seminar, Santiago, Chile September 1-5,
Duncan Hastie, P.E. Dewberry
 FEMA s Riverine High Water Marks for Atlanta s September 2009 Flood Event Duncan Hastie, P.E. Dewberry Background High Water Mark Recovery Performed Through FEMA s Hazard Mitigation Technical Assistance
NORTH CASCADE SLACIER CLIMATE PROJECT Director: Dr. Mauri S. Pelto Department of Environmental Science Nichols College, Dudley MA 01571
 NORTH CASCADE SLACIER CLIMATE PROJECT Director: Dr. Mauri S. Pelto Department of Environmental Science Nichols College, Dudley MA 01571 INTRODUCTION The North Cascade Glacier-Climate Project was founded
Community Forum 17 August Resort Management Update
 Community Forum 17 August 2013 Resort Management Update Topics Board Appointments Snowmaking and Water Supply Update Strategy Planning & Operational Direction 5 Year Strategic Management Plan Update 2013/14
FECAL COLIFORM MONITORING IN GRAYS HARBOR COUNTY: SUMMARY REPORT OF MONITORING RESULTS FOR
 Chehalis Basin Partnership Fecal Coliform Monitoring in Grays Harbor County: Summary Report of Monitoring Results for 2000-2003 Draft June 30, 2003 Prepared by Tetra Tech/KCM, Inc. 1917 First Avenue, Seattle,