2011 Full Year Results
|
|
|
- Jody Glenn
- 5 years ago
- Views:
Transcription

1 2011 Full Year Results John Borghetti, CEO Sankar Narayan, CFO 25 August 2011
2 Introduction Full year results in line with guidance provided in March Results influenced by unprecedented number of natural disasters and fuel price Market conditions reinforce rationale for Game Change Program Game Change Program ahead of schedule - Project milestones ahead of schedule product, fleet, network, brand and Velocity - Positive feedback driving corporate market share wins Game Change Program transformation to continue in FY12 and to begin to deliver significant benefits Re-positioning will ensure business can operate in a high fuel cost environment and withstand unanticipated events 2
3 Financial highlights Results within guidance Strong closing cash position of $731 million despite challenging operating environment EBIT loss of $18.4* million impacted by one-off events Year on year revenue growth in excess of 9% Group Yield and RASK is stable notwithstanding one off events affecting revenues Underlying CASK growth (excluding fuel) below inflation International network is EBIT positive at $22.4 million Statutory loss after tax $67.8 million Note: * Excludes ineffective cash flow hedges and non-designated derivatives 3
4 Group Profit and Loss summary Year ended 30 June $m 2010 $m Revenue 3, ,981.8 Operating costs 3, ,874.7 Loss on sale PP&E Unrealised foreign exchange losses EBIT * (18.4) 77.9 Net interest costs Underlying Profit / (Loss) before Tax * (66.6) 21.7 Ineffective cashflow hedges and non designated derivatives (28.2) 12.6 Income tax (expense) / benefit 27.0 (13.0) Statutory Profit / (Loss) after Tax (67.8) 21.3 Note: * Excludes Ineffective cashflow hedges and non designated derivatives 4
5 One off events Event 2011** $m Comment Queensland natural disasters* 50.0 Floods and Cyclone Yasi Ash plume 7.0 Impacted both Domestic and International network Christchurch earthquakes 15.0 Impact on trans-tasman network Restructuring and Navitaire costs 20.0 Full settlement on Navitaire but timing difference on P&L recognition Network restructure and market exit costs Total 92.0 Note: * Excludes leisure softening following Queensland natural disasters; ** Based on internal estimates 5
6 Segment results Year ended 30 June $m Segment EBIT* 2010 $m Domestic (40.8) International 22.4 (25.2) Group EBIT* (18.4) 77.9 Note: * Excludes ineffective cashflow hedges and non-designated derivatives 6
7 Domestic Profit and Loss summary Year ended 30 June $m 2010 $m Variance % Revenue 2, ,341.6 Operating Costs 2, ,238.5 Segment EBIT* (40.8) % +9.1% - ASKs (m) 22, ,148.6 RASK (c) % -0.9% RASK significantly impacted by one-off events Note: * Excludes ineffective cashflow hedges and non-designated derivatives 7
8 International Profit and Loss summary Year ended 30 June $m 2010* $m Variance % Revenue Operating Costs Segment EBIT* 22.4 (25.2) +24.8% +18.0% - ASKs (m) 14, ,862.9 RASK (c) % +6.4% Note: * Excludes ineffective cashflow hedges and non-designated derivatives 8
9 Cashflow summary AUD millions 2011 $m 2010 $m Operating Investing (285.4) (271.1) Financing Net cash inflow/(outflow) (68.9) Exchange rate changes (14.5) (1.2) Cash at 30 June* Note: * A $70 million sale and leaseback of engineering spares was entered into post 30-June
10 Balance sheet Year ended 30 June $m 2010 $m Cash and cash equivalents Trade and other receivables Property plant and equipment 2, ,753.9 Other assets Total Assets 3, ,871.9 Trade and other payables Interest bearing liabilities 1, ,787.8 Unearned revenue Other liabilities Total Liabilities 2, ,938.6 Net Assets NTA per share* $0.39 $ Note: * Net tangible asset backing per ordinary share
11 Fleet flexible and low fleet age (average 4.1 years in FY12) June 2010 June 2011 Deliveries Retirement / lease return June 2013 B737NG (17) 71 B ER E-170/ (6) 18 A ATR (2) 8 Total (25) 108 Exit of Embraer E170 fleet by Jan 2012 Note: Figures up to end of FY12 firm deliveries only and excludes additional options of rights to purchase 11
12 Capital and risk management No final dividend Committed financing for all fleet deliveries through to end of 2012 Sale and leaseback program to further strengthen balance sheet Hedging policy and positions AUD Jet Fuel FY12 Operating requirements hedged 70% Participation in favourable rate / price movements 76% Effective rate AUD 104 per barrel 12

13 Review of Game Change strategic goals Diversify revenue line Create global network Access growth markets Maintain cost advantage Upgrade product & services Invest our people No desire to be the biggest but want to be the domestic airline of choice 13
14 Target lower revenue volatility Domestic airfares index (Mar 2002 Aug 2011) Index High yield* Business class Low yield* 60 Best discount 0 0 Jan 02 Jan 04 Jan 06 Jan 08 Jan 10 Jan 02 Jan 04 Jan 06 Jan 08 Jan 10 Corporate and government segment is more resilient Note: Real 13 month moving average, indexed to March 2002; * High yield comprises business class and full economy, low yield comprises restricted economy and best discount Source: Bureau of Infrastructure, Transport and Regional Economics (BITRE) 14
15 Progress to date: diversify revenue line Corporate and government customers make up 13% of our total revenue, up from 10% in FY10 - Represents 29% year-on-year growth - High yield fare* revenue increased by 13% year-on-year Early benefits realised in H2 FY11 - High yield fare* revenue increased by over 25% pcp - Corporate and government revenue increased by ~47% pcp Benefits flowing despite Game Change Program not fully implemented Corporate & government revenue growth (FY10-FY11) FY10 +29% FY11 High yield* fares revenue growth (FY10-FY11) FY10 +13% FY11 Reduced revenue volatility with higher yield and improving revenue mix Note: * High yield fares include flexi and premium fares 15
16 Corporate accounts update Signed 39 new corporate accounts in FY11 with minimum contract value of over $60m (annualised) Corporate account wins (FY11) - New accounts include Accenture, Broadcast Australia, Google*, Parmalat, Reed Group, AFL and NBN Co - Contracted 4 additional ASX50 companies, now total of 19 ASX50 companies have a travel account with Virgin Australia Of 50 managed corporate accounts renewed this year, all were at the same or higher share than previous contract More new accounts signed post 30 June 2011 including Leighton and Spotless 18 Q1 to Q3 FY11 21 Q4 FY11 Growing momentum in corporate and government revenue share Note: * Account from the US 16
17 Progress to date: create global network Completed global network ahead of schedule - Implemented alliance with Etihad - Implemented alliance with Air New Zealand, in July Gained approval for alliance with Delta, implementation by end of Agreed codeshare with Hawaiian Airlines - Agreed alliance with Singapore Airlines (awaiting regulatory approval) - Agreed codeshare with Virgin Atlantic to Hong Kong Increased participation in outbound and inbound international traffic Global network to over 400* destinations Note: * Unique codeshare and interline destinations 17
18 Virgin Australia network: as at 30 June 2010 Virgin Australia Virgin Atlantic Virgin America Emirates Delta* Alaska* Bangkok Airways South African Airways To / from US London Chiang Mai Bangkok Utapao Phuket Lampang Koh Samui Krabi Indianapolis Columbus Cincinnati Baltimore Philadelphia To / from LON Calgary Vancouver Seattle Minneapolis Portland Toronto Ottawa Eugene Detroit Redding Medford Boston Chicago Santa Rosa Reno New York San Francisco Salt Lake City Washington Los Angeles Las Vegas Raleigh Memphis Atlanta Phoenix Orlando Dallas Tampa New Orleans Fort Lauderdale Mexico City Houston Miami Denpasar Port Moresby Honiara Port Vila Nadi Apia Johannesburg Cape Town Port Elizabeth Durban East London Cairns Nuku alofa Rarotonga Brisbane Perth Adelaide Melbourne Sydney Auckland Hamilton Note: * Does not include all destinations Queenstown Dunedin Wellington Christchurch 18

19 Virgin Australia network Virgin Australia Virgin Atlantic Virgin America Hawaiian Etihad Air NZ** Delta* Singapore / Silk^ To / from US To / from US Manchester Dublin Damascus Beirut Amman Jeddah London Erbil Paris Baghdad Kuwait Damman Bahrain Doha Riyadh Brussels Frankfurt Geneva Tehran Milan Abu Dhabi Munich Muscat Minsk Athens Peshawar Islamabad Lahore Delhi Karachi Ahmedabad Mumbai Hyderabad Bengaluru Coimbatore Kochi Thiruvananthapuram Male Chennai Casablanca Istanbul Moscow Larnaca Alexandria Cairo Abu Dhabi Johannesburg Kolkata Cape Town Khartoum Note: * Does not include all Delta destinations; ** Does not include all New Zealand domestic destinations ^ Awaiting regulatory approval Perth Adelaide Melbourne Brisbane Gold Coast Sydney Queenstown Dunedin Auckland Hamilton Rotorua Wellington Christchurch Indianapolis Detroit Columbus Philadelphia Cincinnati Baltimore To / from LON To / from AUH Seattle Minneapolis Toronto Ottawa Astana Boston Sacramento Chicago New York Almaty Beijing Tokyo San Francisco Salt Lake City Seoul Nagoya Washington Chongqing Los Angeles Las Vegas Osaka Memphis Raleigh Chengdu Shanghai Fukuoka San Diego Phoenix Atlanta Kathmandu Kunming Guangzhou Xiamen Orlando Dhaka Shenzen Taipei Cancun Lihue Kahului Tampa Yangon Dallas Chiang Mai Hanoi Hong Kong Honolulu Houston Guadalajara Fort Lauderdale Phuket Da Nang New Orleans Bangkok Siem Reap Ho Chi Minh City Miami Penang Manila Kona Puerto Vallarta Langkawi Cebu Phnom Penh Colombo Davao Brunei Kuala Lumpur Kuching Kota Kinabalu Singapore Manado Medan Balikpapan Honiara Port Pekanbaru Lombok Port Moresby Vila Denpasar Apia Palembang Jakarta Nadi Solo City Surabaya Nuku alofa Cairns Rarotonga 19
20 Growing international capacity share Virgin Australia network* Oneworld** International capacity market share^ (Jul 2004 Apr 2011) Forecast 40% JAL Malaysia 30% 20% Air NZ Singapore***; Virgin Atlantic; Hawaiian 10% Delta Etihad 0% Jul 04 Jul 05 Jul 06 Jul 07 Jul 08 Jul 09 Jul 10 Jul 11 Jul 12 Virgin Australia global network capacity share in and out of Australia: ~26% by July 2012* Note: * Includes V Australia, Pacific Blue, Polynesian Blue, Etihad, Air New Zealand, Delta Airlines, Singapore Airlines, Virgin Atlantic, and Hawaiian Airlines; ** Includes Qantas, British Airways, Cathay Pacific, Japan Airlines, LAN Airlines, and Malaysia Airlines other Oneworld carriers do not have capacity in or out of Australia; *** Awaiting regulatory approval; ^ Market share based on seat capacity, and forecast based on latest April 2011 data Source: Bureau of Infrastructure, Transport and Regional Economics 20
21 Progress to date: access growth markets Launched new services on important high yield domestic markets, with more services to follow - Trans-continental: Coast to Coast services - Canberra: Capital Connect services (from July 2011) Expanded regional network - Implemented expanded Skywest codeshare in Western Australia - Introducing ATR fleet to increase regional network reach: destinations include Canberra, Port Macquarie and Gladstone Aligned our network to access growth markets with minimal capital expenditure 21
22 Progress to date: maintain cost advantage Rationalised unprofitable routes (Johannesburg and domestic New Zealand) Built global network through alliances with minimal capital expenditure Optimised fleet operations and mix Integrated operations into one Introducing more fuel efficient ATRs Prudent capacity management domestic capacity growth of ~5% in FY11, expected 4-6% in H1 FY12 Continued focus on cost and improved efficiency and productivity 22
23 Progress to date: upgrade product and service Launched new uniforms Launched Airbus A330 product, including business class Introduced premium direct Lounge entry Sydney domestic airport Unveiled new Boeing B737 business class and interior Re-launched Virgin Australia Lounge Melbourne and Brisbane (July 2011) Upgraded Brisbane terminal Introduced priority boarding Introduced priority screening Melbourne and Brisbane Product and service enhancements are ahead of schedule 23

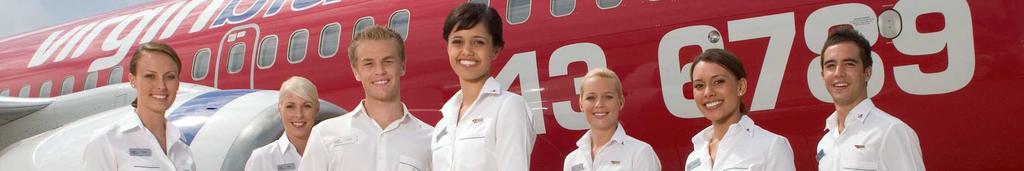


24 Uniforms Virgin Blue 24

25 Uniforms Virgin Australia 25


26 Boeing 737 interior Virgin Blue 26


27 Boeing 737 interior Virgin Australia 27

28 Lounges Virgin Blue 28


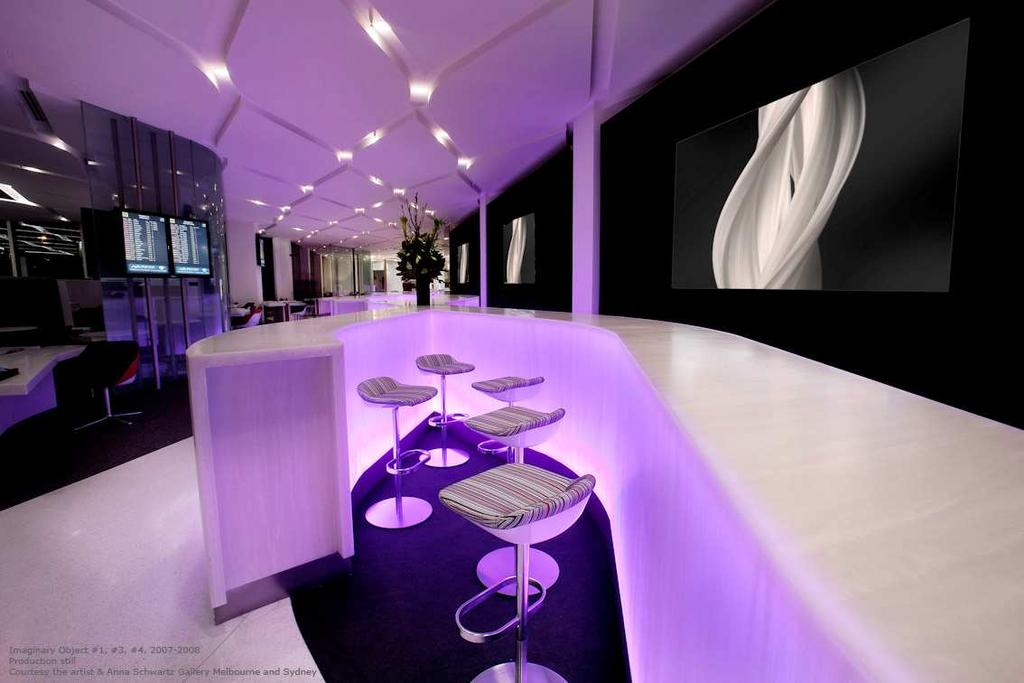
29 Lounges Virgin Australia 29


30 Premium direct Lounge entry Sydney 30
31 Today launch of new Virgin Australia Velocity Frequent Flyer Program Membership exceeds 2.5 million members up 20% year on year We have re-built the program from the ground up - Improved tier recognition and benefits, including new Platinum tier - Significantly enlarged global program (600+ services*, 150+ lounges) - Multiple retail, credit card, and everyday partners (over 380 partners) - Improved Call Centre service Unique features that make a real difference - Easier to get the flight that you want - Fairer status earning - Benefits that reward the whole family Note: * Flight services on which Velocity members can earn and burn frequent flyer points with airline partners, including Singapore Airlines alliance currently awaiting regulatory approval 31

32 Status match limited time 32
33 Continued investment in our most important asset our people Stable industrial relations platform collaborative approach to industrial relations Agreement with long haul international pilots and cabin crew Committed to creating jobs in Australia Continued investment and improvement in staff engagement and talent development Virgin Australia was named Australia s most attractive employer* Virgin Australia staff underpin the success of Virgin Australia and the Game Change Program Note: * 2011 Randstad Awards 33
34 Game Change Program scorecard % completed Invest in our team Enhance in-flight and on-the-ground guest experience Develop comprehensive global virtual network* Ahead of schedule Integrate and align the airline operations and brands Ahead of schedule Maintain cost advantage and efficiencies Continuous Early benefits being realised Achieve a more balanced revenue mix, and improved yields and return FY11 FY12 FY13 Note: * Singapore Airlines alliance awaiting regulatory approval 34
35 Still to come Activity Turbo-prop fleet entry into service Full trans-continental J class launch Hawaiian Airlines codeshare Delta alliance implemented Mackay Lounge open Network-wide J class launch International operations re-branding Coolangatta Lounge open Singapore Airlines alliance implemented Virgin Atlantic codeshare to Hong Kong Timeline Prior to 31 October 2011 Prior to 31 October 2011 Prior to 31 December 2011 Prior to 31 December 2011 Prior to 31 December 2011 Prior to 31 January 2012 Prior to 31 January 2012 Early 2012 Early 2012 Early
36 Game Change Program a three year journey Reposition Lead & leverage Plan & implement Formulate Game Change strategic plan and commence implementation Conclude roll out of Game Change strategic plan and begin benefits realisation from 2H FY12 Build upon strategic positioning in the global airline market from strengthened position in domestic market FY11 FY12 FY13 36
37 Outlook Expect an improvement in underlying financial performance in FY12 despite uncertain economic environment Unable to provide clear guidance for coming year Early indications of improving earnings in FY12 - Positive trading results in July and continued strengthening in the corporate and government markets Confident we have the right strategy to manage our response to changes in future market conditions and to ensure a stable and successful future for Virgin Australia 37


38 38
Virgin Australia Holdings HY13 half year results 26 February 2013
 Virgin Australia Holdings HY13 half year results 26 February 2013 Introduction Delivered solid result despite market dynamics and economic environment Economic uncertainty Strong competitive capacity growth
Cathay Pacific Vantage Pass 2019
 Cathay Pacific Vantage Pass 2019 1. Select the destination for your first round-trip ticket. Note the distance zone, preferred class and fare. 2. Select the destination for your second round-trip ticket.
ETIHAD AVIATION GROUP FAST FACTS & FIGURES JANUARY 2018
 ETIHAD AVIATION GROUP FAST FACTS & FIGURES JANUARY 2018 OUR PEOPLE Etihad Aviation Group is a diversified global aviation and travel group comprising five business divisions Etihad Airways, the national
Analyst Presentation. 9 th June 2006
 Analyst Presentation 9 th June 2006 1 Existing Principal Shareholding Structure CITIC Pacific 46.30% 25.40% 10.00% 68.36% CNAC(HK) 43.29% 7.71% 17.79% 28.50% Dragonair Source: Announcement on 9 th June
Carriers Serving New Zealand. New Zealand Aviation Outlook In partnership with 4th Dimension Business Travel Consulting. fcmtravel.
 Carriers Serving New Zealand New Zealand Aviation Outlook 2018 In partnership with 4th Dimension Business Travel Consulting fcmtravel.nz Carriers Serving New Zealand 400 DAILY FLIGHTS TO 21 NEW ZEALAND
5 REASONS WHY OUR CORPORATE TRAVEL PROGRAMME IS PERFECT FOR YOU
 5 REASONS WHY OUR CORPORATE TRAVEL PROGRAMME IS PERFECT FOR YOU REASON #1 WE RE FLUENT IN BUSINESS AND WE RE INVESTED IN YOU Take your company s cost savings to higher altitudes with a Corporate Travel
TURKISH CARGO NETWORK: YOUR KEY HUB TO GLOBAL SUPPLY CHAIN November 2017
 TURKISH CARGO NETWORK: YOUR KEY HUB TO GLOBAL SUPPLY CHAIN November 2017 01 Turkish Cargo Network TURKISH CARGO TIMELINE Turkish Airlines was founded in 1933. In the meantime, Turkish Airlines carried
Rethinking Global City Competitiveness. Jeremy Kelly, Global Research, JLL 7 th June 2018
 Rethinking Global City Competitiveness Jeremy Kelly, Global Research, JLL 7 th June 2018 A new language of city competitiveness Source: JLL!3 A new language of city competitiveness technology diversity
2014 Half Year Results Virgin Australia Holdings Limited 28 February 2014
 2014 Half Year Results Virgin Australia Holdings Limited 28 February 2014 Half year in review Australian aviation market continues to face challenging conditions, ongoing subdued consumer sentiment and
MAHB (MALAYSIA AIRPORTS HOLDINGS BHD) TRAFFIC 2012
 TRAFFIC 2012") MAHB (MALAYSIA AIRPORTS HOLDINGS BHD) TRAFFIC 2012 PASSENGER MOVEMENTS 20112012 2011 % +/ Terminal passengers (international) 32,379,493 30,441,067 6.4% Terminal passengers (domestic) 34,275,100 32,922,125
MAHB (MALAYSIA AIRPORTS HOLDINGS BHD) TRAFFIC 2012 PASSENGER MOVEMENTS 20112012 2011 % +/ Terminal passengers (international) 32,379,493 30,441,067 6.4% Terminal passengers (domestic) 34,275,100 32,922,125
Cargo Market & Turkish Cargo. Network & Fleet. Products Development and Future Plans
 Turkish Airlines & Turkish Cargo in Brief Cargo Market & Turkish Cargo Network & Fleet Products Development and Future Plans Turkish Airlines & Turkish Cargo in Brief Cargo Market & Turkish Cargo Network
12.3million. passengers and 851,000 tonnes of cargo carried by Cathay Pacific in 2002.
 12.3million passengers and 851, tonnes of cargo carried by Cathay Pacific in 22. The three airlines are based in Hong Kong. Cathay Pacific Airways provides international passenger and cargo services. Dragon
Cargo Market & Turkish Cargo. Network & Fleet. Fleet. Africa Routes. America Routes. Asia Pacific Routes. Central & Southern Europe Routes
 AGENDA 01 02 03 04 05 Turkish Cargo & Turkish Airlines in Brief Cargo Market & Turkish Cargo Network & Fleet Products Development & Future Plans Turkish Cargo Timeline Tonnage Shares Of Regions Fleet Special
Virgin Australia Holdings FY13 full year results 30 August 2013
 Virgin Australia Holdings FY13 full year results 30 August 2013 Year in review Fast tracked major restructuring and transformation program Difficult economic and competitive environment, significant one-off
Overview. > Normalised earnings* before taxation of, up 30% > Statutory earnings before taxation of, up 40% > Statutory net profit after taxation of
 1 Overview > Normalised earnings* before taxation of, up 30% > Statutory earnings before taxation of, up 40% > Statutory net profit after taxation of > Operating revenue of > Strong operating cash flow
SIA ANALYST/MEDIA BRIEFING FY Results 13 May 2016 THE PARENT AIRLINE FY2015/16 RESULTS
 SIA ANALYST/MEDIA BRIEFING FY2015-16 Results 13 May 2016 THE PARENT AIRLINE FY2015/16 RESULTS 1 THE PARENT AIRLINE COMPANY OPERATING PERFORMANCE FY2015/16 4Q/15 % Change 15/16 % Change Available Seat-KM
ANDREW WATTERSON Vice President Planning and Revenue Management
 ANDREW WATTERSON Vice President Planning and Revenue Management Safe Harbor Statement The following information contains certain forward looking statements that reflect the Company s current views with
Malaysia Airports Statistics
 CONTENTS Malaysia Airports Traffic 2003 242 Passenger Movements 2003 243 Passenger Movements (1994-2003) 244 International Passenger Movements by Sectors at KL International Airport 245 Top International
What this meant to British travellers
 Strength in the pound leads to decreased hotel room rates for UK travellers in first half 2015 September 2, 2015 Global hotel prices paid by travellers worldwide rose by just 1% during first half 2015,
Media Release. Qantas Group Full Year 2017 Financial Result 1. Sydney, 25 August 2017
 Media Release Qantas Group Full Year 2017 Financial Result 1 Sydney, 25 August 2017 Underlying Profit Before Tax: $1,401 million (second highest in Qantas history) Statutory Profit Before Tax: $1,181 million
Cathay Pacific Airways Interim Results for the six months ended 30 June 2012
 Cathay Pacific Airways Interim Results for the six months ended 30 June 2012 8 August 2012 1 Interim Result 1H2012 1H2011 Change Group attributable (loss) / profit HK$ million (935) 2,808-133.3% Group
AIR NEW ZEALAND ANNUAL RESULTS ANNUAL RESULTS
 AIR NEW ZEALAND ANNUAL RESULTS 2008 1 HIGHLIGHTS Record operating revenue, up 9% Normalised earnings* $197m Net cash position of $1.3bn Launched direct service to Vancouver and Beijing Award winning product
Forward looking statements
 Forward looking statements This presentation contains forward-looking statements. Forward-looking statements often include words such as anticipate", "expect", "intend", "plan", "believe, continue or similar
Singapore Airlines Group Analyst/Media Briefing HALF YEAR FY RESULTS. 13 November 2013 THE PARENT AIRLINE 1H FY2013/14 RESULTS
 Singapore Airlines Group Analyst/Media Briefing HALF YEAR FY2013-14 14 RESULTS 13 November 2013 THE PARENT AIRLINE 1H FY2013/14 RESULTS THE PARENT AIRLINE COMPANY RESULTS 2Q & 1H FY13/14 2Q/13 $million
United Group Global Strategy. Richard Leupen, Managing Director and CEO 1 April 2008
 United Group Global Strategy Richard Leupen, Managing Director and CEO 1 April 2008 Agenda About United Group Operations excluding Australia/New Zealand Key Drivers Global Strategy Conclusion 2 About United
MALAYSIA AIRPORTS TRAFFIC 2014
 Malaysia Airports Holdings Berhad Annual Report 2014 329 MALAYSIA AIRPORTS TRAFFIC 2014 PASSENGER MOVEMENTS 2014 2013 % + / - Terminal passengers [international] 39,780,623 37,894,553 5.0% Terminal passengers
Air Berlin PLC AGM 06 June 2013 London
 Air Berlin PLC AGM 06 June 2013 London airberlin a strong European carrier Market position as of 31 December 2012 No. 2 in core market: Germany / Austria / Switzerland No. 7 in Europe with 33.3 m guests
Cathay Pacific Airways 2012 Analyst Briefing 28 June 2012
 Cathay Pacific Airways 2012 Analyst Briefing 28 June 2012 1 Airline Strategy Grow our international network, expand frequencies and further develop Hong Kong as one of the world s leading aviation hubs
For personal use only
 ASX and Media Release QANTAS DELIVERS RECORD FIRST HALF PROFIT, INVESTS IN AIRCRAFT AND TRAINING Sydney, 22 February 2018 Underlying Profit Before Tax: $976 million (up 15%) Record results for Qantas Domestic,
Virgin Australia Holdings Limited (ASX: VAH) H1 FY18 Results 1
 H1 FY18 Results 1") Virgin Australia Holdings Limited (ASX: VAH) H1 FY18 Results 1 Summary of H1 FY18 Group Outcomes 2 Group Underlying Profit Before Tax of $102.5 million up 142.3% Group Statutory Profit After Tax of $4.4
Virgin Australia Holdings Limited (ASX: VAH) H1 FY18 Results 1 Summary of H1 FY18 Group Outcomes 2 Group Underlying Profit Before Tax of $102.5 million up 142.3% Group Statutory Profit After Tax of $4.4
Annual Results Air New Zealand
 Annual Results 2011 Air New Zealand Highlights Normalised earnings* $75m Net cash position of $860m Operating cash flow down 5% Gearingat467% at 46.7% Final dividend 2.5 cents per share (unimputed) New
5. Qualified customers may purchase discounted flights to Singapore Airlines (SQ) and SilkAir (MI) destinations, as detailed in Annex A.
 and SilkAir (MI) destinations, as detailed in Annex A.") The Great Singapore Airlines Getaway with Mastercard Promotion Mechanics 1. The Promotion is exclusive to all cardholders of Philippine-issued Mastercard credit, debit and prepaid cards ( Mastercard cardholders
The Great Singapore Airlines Getaway with Mastercard Promotion Mechanics 1. The Promotion is exclusive to all cardholders of Philippine-issued Mastercard credit, debit and prepaid cards ( Mastercard cardholders
Cathay Pacific Airways Analyst Briefing 27 November 2012
 Cathay Pacific Airways Analyst Briefing 27 November 2012 1 Trading Statement 2012 A very challenging year High fuel prices Soft premium demand High competition in Economy Class putting pressure on yield
Cathay Pacific Airways 2011 Analyst Briefing 23 June 2011
 Cathay Pacific Airways 2011 Analyst Briefing 23 June 2011 1 Airline Strategy Grow our international network, expand frequencies and further develop Hong Kong as one of the world s leading aviation hubs
QANTAS HALF YEAR 2015 FINANCIAL RESULTS 1
 QANTAS HALF YEAR 2015 FINANCIAL RESULTS 1 Key points: Underlying Profit Before Tax: $367 million Statutory Profit After Tax: $206 million Transformation benefits: $374 million Comparable unit cost reduction:
2016 HALF YEAR RESULTS. Mandarin Oriental Hotel Group
 2016 HALF YEAR RESULTS Mandarin Oriental Hotel Group 2016 Half Year Results Highlights US $ m June 2016 June 2015 Combined Total Revenue * 644 641 Underlying EBITDA 71 82 * Includes revenue from the Group
QANTAS DELIVERS STRONG FIRST HALF RESULT DESPITE HIGHER FUEL BILL
 ASX and Media Release Sydney, 21 February 2019 QANTAS DELIVERS STRONG FIRST HALF RESULT DESPITE HIGHER FUEL BILL Underlying Profit Before Tax: $780 million (down $179 million) Statutory Profit Before Tax:
4 th Dimension Focus. Global Hotel Trends Q3 2017
 4 th Dimension Focus Global Hotel Trends Q3 2017 2 About the Report This 4D Focus quarterly report uses global data sourced from FCM corporate bookings made offline, online (via OBT), GDS and non- GDS
Japan Airlines and American Airlines Joint Business Benefits from April 1, January 11, 2011
 Japan Airlines and American Airlines Joint Business Benefits from April 1, 2011 January 11, 2011 October 25, 2010: Signing of Japan-USA Open Skies Agreement Antitrust immunity was granted to airlines operating
Cathay Pacific Airways
 Cathay Pacific Airways Interim Results for the six months ended 30 th June 2014 13th August 2014 1 Interim Results 1H2014 1H2013 Change Profit attributable to the shareholders of Cathay Pacific HK$ million
Net Debt, $m 1, ,733.7
 Virgin Australia Holdings Limited (ASX: VAH) FY17 Results: Stronger Cash and Balance Sheet, Statutory and Underlying Loss, Outlook Improving 1 Summary of FY17 Financial Outcomes Group Underlying Loss Before
Analysts Briefing. 18 March Cathay Pacific Airways Limited
 Analysts Briefing 18 March 2015 Cathay Pacific Airways Limited Annual Results 2014 2013 Change Group attributable profit HK$m 3,150 2,620 +20.2% Group turnover HK$m 105,991 100,484 +5.5% Profit margin
Air Berlin PLC AGM 18 June 2014 London
 Air Berlin PLC AGM 18 June 2014 London Executive summary (1) Key Highlights 2013 2013: a challenging year for airberlin Operational loss of 231.9 million euros Group revenue down in line with capacity
Airport forecasting is used in master planning to guide future development of the Airport.
 Airport Forecasts Airport forecasting is used in master planning to guide future development of the Airport. 4.1 INTRODUCTION Airport forecasting ensures development is appropriate for passengers, ground
 AA.com CONTACTS: American Airlines Japan Airlines Yuko Kato, Weber Shandwick Sze Hunn Yap, Public Relations Tokyo, Japan Tokyo, Japan 03-5427-7378 03-5460-3109 ykato@webershandwick.com sze_hunn.yap@jal.com
Mahb (Malaysia Airports Holdings Bhd) Traffic 2007
 Traffic 2007") Mahb (Malaysia Airports Holdings Bhd) Traffic 27 PASSENGER MOVEMENTS 27 26 +/ Terminal passengers [international] 19,67,834 17,651,866 11.4% Terminal passengers [domestic] 24,878,6 23,955,547 3.9% Transit
Mahb (Malaysia Airports Holdings Bhd) Traffic 27 PASSENGER MOVEMENTS 27 26 +/ Terminal passengers [international] 19,67,834 17,651,866 11.4% Terminal passengers [domestic] 24,878,6 23,955,547 3.9% Transit
26 August Christopher Luxon Chief Executive Officer. Rob McDonald Chief Financial Officer
 26 August 2016 Christopher Luxon Chief Executive Officer Rob McDonald Chief Financial Officer Forward looking statements This presentation contains forward-looking statements. Forward-looking statements
PART 1: EXISTING AND EVOLVING GLOBAL FARE COLLECTION INDUSTRY Introduction Transit ticketing industry 6
 Contents PART 1: EXISTING AND EVOLVING GLOBAL FARE COLLECTION INDUSTRY 1 1.1 Introduction 2 1.2 Transit ticketing industry 6 1.2.1 Overview 6 1.2.2 System components and value chain 7 1.2.3 Market size
Cathay Pacific Airways Analyst Briefing. 21 November 2014
 Cathay Pacific Airways Analyst Briefing 21 November 2014 Operating Performance Passenger demand remains strong, although growth in North America is significantly short of increase in capacity. Demand for
2012 Result. Mika Vehviläinen CEO
 2012 Result Mika Vehviläinen CEO 1 Agenda Market environment in Q4 Business performance and strategy execution Outlook Financials 2 Market Environment According to IATA, Global air travel continues to
Air Berlin PLC 15 th June, 2016 Annual General Meeting 2016 London
 Air Berlin PLC 15 th June, 2016 Annual General Meeting 2016 London Despite headwind, airberlin made good progress in 2015 RASK +3.7% Yield +2.0% Load Factor +0.7%pt Ancillary Revenues* +9.2% ASKs -5.4%
Enrich Double Elite Miles Malaysia Airlines Grand Travel Deal Campaign (April 2018) Terms and Conditions
 Terms and Conditions") Enrich Double Elite Miles Malaysia Airlines Grand Travel Deal Campaign (April 2018) Terms and Conditions 1. This Double Elite Miles Malaysia Airlines Grand Travel Deal Promotion ( Promotion ) is open to
Enrich Double Elite Miles Malaysia Airlines Grand Travel Deal Campaign (April 2018) Terms and Conditions 1. This Double Elite Miles Malaysia Airlines Grand Travel Deal Promotion ( Promotion ) is open to
TABLE 4. CITYPAIRWISE INTERNATIONAL PASSENGER AND FREIGHT (SCHEDULED) STATISTICS TO AND FROM THE INDIAN TERRITORY DURING THE QUARTER APR-JUN 2016 (P)
 STATISTICS TO AND FROM THE INDIAN TERRITORY DURING THE QUARTER APR-JUN 2016 (P)") TABLE 4. CITYPAIRWISE INTERNATIONAL PASSENGER AND (SCHEDULED) STATISTICS TO ( IN NUMBER AND IN TONNES) 1 ABUDHABI AHMEDABAD 18792 24983 75.1 98.9 2 ABUDHABI BENGALURU 36376 34271 125.3 342.0 3 ABUDHABI
TABLE 4. CITYPAIRWISE INTERNATIONAL PASSENGER AND (SCHEDULED) STATISTICS TO ( IN NUMBER AND IN TONNES) 1 ABUDHABI AHMEDABAD 18792 24983 75.1 98.9 2 ABUDHABI BENGALURU 36376 34271 125.3 342.0 3 ABUDHABI
2007/08 Full Year Results Investor Briefing
 2007/08 Full Year Results Investor Briefing Highlights of Result Profit before tax up 46% to $1,408 million Up 36% on the reported result Margin improvement $3 billion of Sustainable Future Benefits achieved
For personal use only
 QANTAS GROUP MARKET UPDATE SYDNEY, 5 December 2013: The Qantas Group today announced a market update, accelerated cost reductions and a capital expenditure and structural review, in response to fundamentally
Travelling to Liverpool
 Travelling to Liverpool 1 2 International Airports within 45 minutes of Liverpool City Centre 226 Destinations Domestic Non EU EU 25 50 100 150 250 27.4 million passengers per year = 4 million 77 airlines
Thank you for participating in the financial results for fiscal 2014.
 Thank you for participating in the financial results for fiscal 2014. ANA HOLDINGS strongly believes that safety is the most important principle of our air transportation business. The expansion of slots
2003/04 Full Year Results Presentation to Investors
 2003/04 Full Year Results Presentation to Investors 19 August 2004 Geoff Dixon Chief Executive Officer Highlights 12 months to June 2004 12 months to June 2003 Increase/ (decrease) % Sales and operating
Airport Lounges. Relax and get fresh before your onward flight found under Sightseeing. Middle East, Africa LOUNGE
 Middle East, Africa Airport Lounges Relax and get fresh before your onward flight found under Sightseeing non- Internet / WiFi Free local Calls newspaper Abu Dhabi from $77.00pp Al Dhabi Airport Lounge
Cathay Pacific Airways 2013 Analyst Briefing 25 June Cathay Pacific Airways Analyst Briefing 27 November 2013
 Cathay Pacific Airways 2013 Analyst Briefing 25 June 2013 Cathay Pacific Airways Analyst Briefing 27 November 2013 2013 Operating Performance to date: Passenger yield and load factor growth on lower ASKs.
The Qantas Group A Strong, Sustainable Future Alan Joyce, CEO Qantas Airways. Macquarie Australia Conference 4 May 2012
 The Qantas Group A Strong, Sustainable Future Alan Joyce, CEO Qantas Airways Macquarie Australia Conference 4 May 2012 Overview Fleet renewal now substantially complete FY13 capital expenditure reduced
2004/05 Full Year Results Presentation to Investors
 Geoff Dixon Chief Executive Officer 2004/05 Full Year Results Presentation to Investors 18 August 2005 Group Highlights 12 months to June 2005 12 months to June 2004 Increase/ (decrease) % Sales and operating
Building procurement capability through transformation. Jane Harley, Chief Procurement Officer Qantas Group
 Building procurement capability through transformation Jane Harley, Chief Procurement Officer Qantas Group SECTION TITLE HERE Heading here Group multi-brand structure Australia & New Zealand Singapore
Cathay Pacific Airways Cathay Pacific Airways 2008 Annual Results Investor Relations Meeting 11 March June 2009
 Cathay Pacific Airways Cathay Pacific Airways 2008 Annual Results Investor Relations Meeting 11 March 2009 22 June 2009 Airline Strategy Continue to grow our extensive international network, expand frequencies
Results for the Year Ended 30 th June Brett Godfrey Chief Executive Officer 21 August 2007
 Results for the Year Ended 30 th June 2007 Brett Godfrey Chief Eecutive Officer 21 August 2007 New World Strategy Delivering RASK up 13.0% 10.02 CASK (underlying) up 2.6% 8.24 Net Profit up 92.9% $216M
Significant strategic developments announced today
 Qantas Airways Limited Building a Stronger Qantas August 2011 Executive Summary Significant strategic developments announced today Initial Phase of comprehensive plan to turnaround the Qantas International
Chief Executive Officer
 Chief Executive Officer Moving from Good to Great Customer Experience Commercial Results Engaged Culture Strong foundations > Passionate, engaged workforce > Customer centric culture > Optimised network
An Overview of SATS. Cho Wee Peng, CFO SIAS Corporate Profile & Investment Seminar 30 November 2013
 An Overview of SATS Cho Wee Peng, CFO SIAS Corporate Profile & Investment Seminar 30 November 2013 Forward Looking Statements This presentation may contain forward-looking statements regarding, among other
Asia-Pacific Aviation: Growth and Challenges
 Asia-Pacific Aviation: Growth and Challenges A presentation to the ACI-NA International Aviation Issues Seminar Steve Martin Page 1 Page 2 Defining the Asia Pacific We ll call it GMT +5 GMT +12, minus
Finnair Group Interim Report 1 January 30 June 2008
 Finnair Group Interim Report 1 January 30 June 2008 1 08/08/2008 Presentation name / Author Airline industry at a historical turning point Fuel price has a stranglehold on the business Average ticket prices
THIRD QUARTER NET PROFIT OF $397 MILLION ON RECORD REVENUE
 THIRD QUARTER NET PROFIT OF $397 MILLION ON RECORD REVENUE HIGHLIGHTS OF THE GROUP S PERFORMANCE 3rd Quarter 2005-06 9 Months 2005-06 Year-on-Year Apr-Dec % Change 2005 Oct-Dec 2005 Year-on-Year % Change
QANTAS ANNOUNCES PROFIT RESULT HALF-YEAR ENDED 31 DECEMBER 2009
 QANTAS ANNOUNCES PROFIT RESULT HALF-YEAR ENDED 31 DECEMBER 2009 HIGHLIGHTS TWO BRAND STRATEGY DELIVERS RESILIENCE AND CONTAINS COSTS Statutory Net Profit Before Tax of $90 million Underlying Profit Before
PRIDE OF OWNERSHIP.
 CONSORTIUM OF LOCALLY OWNED PARTNERSHIPS We understand the fundamental role that pride of ownership plays in inspiring the highest work ethic, quality and professionalism. Each icore office is a locally
CORPORATE STEVE BOOKING SMITH CHANNELS
 JAPAN AIRLINES: NAVIGATING THE FUTURE Steve Myer, Tokyo September 30, 2016 CORPORATE STEVE BOOKING SMITH CHANNELS VICE PRESIDENT, GLOBAL & STRATEGIC SALES, THE AMERICAS SEPTEMBER 20, 2016 RENO, NEVADA
STAYING TRUE. BofAML Global Transportation Conference. May
 STAYING TRUE BofAML Global Transportation Conference May 19 2011 FORWARD-LOOKING STATEMENT Certain information in this presentation and statements made during this presentation, including any question
QANTAS ANNOUNCES PROFIT RESULT YEAR ENDED 30 JUNE 2009
 QANTAS ANNOUNCES PROFIT RESULT YEAR ENDED 30 JUNE 2009 HIGHLIGHTS Profit before tax of $181 million, in a year when the International Air Transport Association forecast US$9 billion in losses for global
For personal use only
 Half Year Results Press Conference Remarks by Qantas CEO Alan Joyce 21 February 2013 Good morning. Thanks for joining us for the Qantas Group result for the six months ended 31 December 2012. The Group
TOTAL MAHB GROUP TRAFFIC 2015
 Annual Report 2015 309 TOTAL MAHB GROUP TRAFFIC 2015 PASSENGER MOVEMENTS 2015 2014 +/- MY passengers [international] 40,044,823 40,149,537-0.3% [domestic] 43,784,946 43,198,466 1.4% [Total] 83,829,769
Information meeting. 1 st September 2011
 Information meeting 1 st September 2011 Full Year 2010-11 key data April 2010-March 2011 Revenues in billions Operating result in millions 77% Passenger 18.10 +11.3% -44 +874 13% Cargo 3.16 +29.5% +69
HAWAIIAN AIRLINES UPDATE. Peter Ingram, Chief Commercial Officer
 HAWAIIAN AIRLINES UPDATE Peter Ingram, Chief Commercial Officer 1 Hawai i s destination carrier CHINA Beijing Seoul/Incheon SOUTH KOREA Osaka/Kansai Sapporo/Chitose Tokyo/Haneda JAPAN NI IHAU KAUA I Līhu
Record Result. 2006/07 Full Year Results Investor Presentation. Moved on successfully following bid. Profit before tax % to $1,032 million
 2006/07 Full Year Results Investor Presentation August 16 2007 Record Result Moved on successfully following bid Profit before tax + 53.8% to $1,032 million Group returning above Cost of Capital 2 Key
Recovery on track, continued strengthening in most segments. Record Jetstar and Frequent Flyer earnings highlight value of portfolio
 Qantas Full Year 2010 Results Presentation Overview Underlying PBT 1 more than tripled to $377m in line with guidance Delivering against strategic priorities Recovery on track, continued strengthening
$168 MILLION PROFIT FOR FIRST HALF
 2 November 2012 Page 1 of 4 No. 05/12 02 November 2012 $168 MILLION PROFIT FOR FIRST HALF GROUP FINANCIAL PERFORMANCE First Half 2012-13 The SIA Group registered a net profit of $168 million in the first
CONSOLIDATED PROFIT AND LOSS ACCOUNT
 CONSOLIDATED PROFIT AND LOSS ACCOUNT for the year ended 31st December Turnover Note Passenger services 26,407 18,663 Cargo services 11,395 9,913 Catering and other services 1,263 1,002 Total turnover 1
ORIGIN / DESTINATION FLIGHT NO FREQ * DEP ARR AIRCRAFT STOPS
 All timings are shown in local times. Every effort has been made to ensure the accuracy of the timetable. However, the schedules are subject to change without prior notice.the company reserves the right,
ANA Group Announces Its Fiscal Year 2019 Flight Schedule
 ANA NEWS ANA Group Announces Its Fiscal Year Flight Schedule ANA plans to accelerate growth by expanding its international network. New state-of-the-art aircraft will be introduced to further improve passenger
Cathay Pacific Airways Annual Results 10 March Cathay Pacific Airways Interim Results 6 August 2008
 Cathay Pacific Airways 2009 Annual Results 10 March 2010 Cathay Pacific Airways 2008 Interim Results 6 August 2008 Annual Result 2009 2008 (restated) Group Profit/(Loss) HK$4,694m (HK$8,696m) Group Turnover
Media Release QANTAS RESULTS FOR THE HALF YEAR ENDED 31 DECEMBER 2004 HIGHLIGHTS. Fully franked interim dividend of 10 cents per share
 Media Release QANTAS RESULTS FOR THE HALF YEAR ENDED 31 DECEMBER 2004 HIGHLIGHTS Profit before tax of $601.3 million Net profit after tax of $458.4 million Revenue of $6.4 billion Fully franked interim
Finnair Group Annual Report 1 January 31 December 2006
 Finnair Group Annual Report 1 January 31 December 2006 2006: A year for restructuring Scheduled Passenger Traffic transforming to meet Asian traffic demands Labour negotiations to cut 670 jobs 80 million
QUT BlueShift Business Case Competition 2018 Business Case
 QUT BlueShift Business Case Competition 2018 Business Case Table of Contents Confidentiality... 2 1.0 Airlines in Australia... 3 2.0 Loyalty Programs... 4 3.0 Virgin Australia Group... 5 4.0 Velocity Frequent
Preliminary Operating Statistics For the 4 th Quarter and Full Financial Year Ended 2014
 FOR IMMEDIATE RELEASE AirAsia Berhad ( AirAsia or the company ) is pleased to announce the operating statistics for the 4 th Quarter 2014 ( 4Q14 ) and the Full Financial Year ended 31 December 2014 ( FY2014
air traffic statistics
 October 213 air traffic statistics Prepared by the Office of Finance Department of Internal Controls, Compliance and Financial Strategy Metropolitan Washington Airports Authority Air Traffic Statistics
SIA ANALYST/MEDIA BRIEFING Q2 and 1H FY17/18 Results 8 November 2017
 SIA ANALYST/MEDIA BRIEFING Q2 and 1H FY17/18 Results 8 November 2017 THE PARENT AIRLINE Q2 AND 1H FY17/18 RESULTS THE PARENT AIRLINE COMPANY OPERATING PERFORMANCE Q2 % 1H % FY17/18 Change FY17/18 Change
Information meeting. 12 September 2011
 Information meeting 12 September 2011 Full Year 2010-11 key data April 2010-March 2011 Revenues in billions Operating result in millions 77% Passenger 18.10 +11.3% -44 +874 13% Cargo 3.16 +29.5% +69 +505
Contents Introduction...3 Main Headlines...4 The Overall Rankings...7 Most Significant Centres Areas of Competitiveness
 Global Financial Centres Index 19 Contents Introduction... 3 Main Headlines... 4 The Overall ings... 7 Most Significant Centres... 12 19 Areas of Competitiveness... 13 Western Europe... 15 Eastern Europe
OUTLOOK FOR BOEING AND CIVIL AVIATION
 OUTLOOK FOR BOEING AND CIVIL AVIATION Randy Tinseth Dr. Fariba Alamdari Vice President, Vice Marketing President, Boeing Market Commercial and Value Airplanes Analysis Boeing Commercial June Airplanes
October 2018 October 2017 Change
 AIR TRAFFIC REPORT SUMMARY: OCTOBER PASSENGERS October October Change Domestic Passengers 1,969,141 1,861,225 5.8% International Passengers 89,328 74,157 20.5% Total Passengers 2,058,469 1,935,382 6.4%
INVESTOR PRESENTATION. May 2015
 INVESTOR PRESENTATION May 2015 Forward-looking Statements This presentation contains forward-looking statements within the meaning of the Private Securities Litigation Reform Act of 1995 that reflect the
Goldman Sachs Asia-Pacific Airline Conference November 2001
 Goldman Sachs Asia-Pacific Airline Conference November 2001 Peter Gregg Chief Financial Officer Qantas Airways Limited Good morning, welcome everyone and thanks for coming along. 1 Overview International
Queensland Tourism Aviation Blueprint to 2016
 Queensland Tourism Aviation Blueprint to 2016 tq.com.au Blueprint outline The purpose of the Queensland Tourism Aviation Blueprint to 2016 is to develop the strategic framework that will guide aviation