Cathay Pacific Airways Annual Results 10 March Cathay Pacific Airways Interim Results 6 August 2008
|
|
|
- Tabitha Bailey
- 5 years ago
- Views:
Transcription

1 Cathay Pacific Airways 2009 Annual Results 10 March 2010 Cathay Pacific Airways 2008 Interim Results 6 August 2008
2 Annual Result (restated) Group Profit/(Loss) HK$4,694m (HK$8,696m) Group Turnover HK$66,978m HK$86,563m Profit/(Loss) Margin 7.0% (10.0%) Return on Capital Employed 8.7% (11.8%) Earnings per share HK (HK 221.0) Dividends per share HK 10 HK 3 Available tonne kilometres 22,249m 24,410m Cost per ATK HK$2.76 HK$3.80 Cost per ATK (w/o fuel) HK$2.00 HK$1.89 Revenue Load Factor 77.7% 75.1% Breakeven Load Factor 72.8% 87.2%


3 One-off items Implementation of HK (IFRIC) 13 Customer Loyalty Program A reduction of HK$1.4B in the opening retained profit of 2009 Profit for 2009 increased by HK$74m Profit on disposal of HAECO shares of HK$1,254m Aircraft impairment Aircraft held for sale NBV compared to their market values Provision of HK$219m Operating lease charges Aircraft parked and unlikely to return to service Accrued the outstanding lease payments Provision for antitrust investigations of HK$80m
4 Airlines operating profit / (loss) (restated) HK$M HK$M Airlines opening profit/(loss) before fuel hedging, 285 (1,440) non-recurring items and tax Profit on disposal of HAECO shares 1,254 - Realised and unrealised fuel hedging gains/(losses) 2,758 (7,970) Settlement of the US DOJ cargo investigations - (468) Tax (charge)/credit (170) 1,476 Airlines profit/(loss) after tax 4,127 (8,402) Share of profit/loss from subsidiaries & associates 567 (294) Consolidated profit/(loss) 4,694 (8,696)


5 HK$m Reconciliation of airlines operating profit/(loss) before fuel hedging, non-recurring items and tax : 2008 to 2009 Pax -12,044m Cgo -7,083m 2008 Traffic Staff Pax & Acft Mtce Fuel Depreciation 2009 turnover cost route and others cost
6 Passenger Service - Key Numbers 2009 vs 2008 Turnover HK$45,920m % Seat Capacity (ASK) 111,167m -3.7% Passenger Number 24.6m -1.6% Yield per Revenue Pax Km HK % Load Factor 80.5% +1.7% pts
7 Passenger Service - by Region ASK (m) vs 2008 Load Factor vs 2008 Yield Change SW Pacific & S. Africa 17, % 80.8% +3.8% pts % Europe 20, % 85.3% +0.9% pts -22.5% North Asia 23, % 72.2% -0.8% pts -21.9% SE Asia & Middle East 24, % 77.7% +0.3% pts -18.4% North America 25, % 86.7% +5.0% pts -14.3% Systemwide 111, % 80.5% +1.7% pts -19.5%

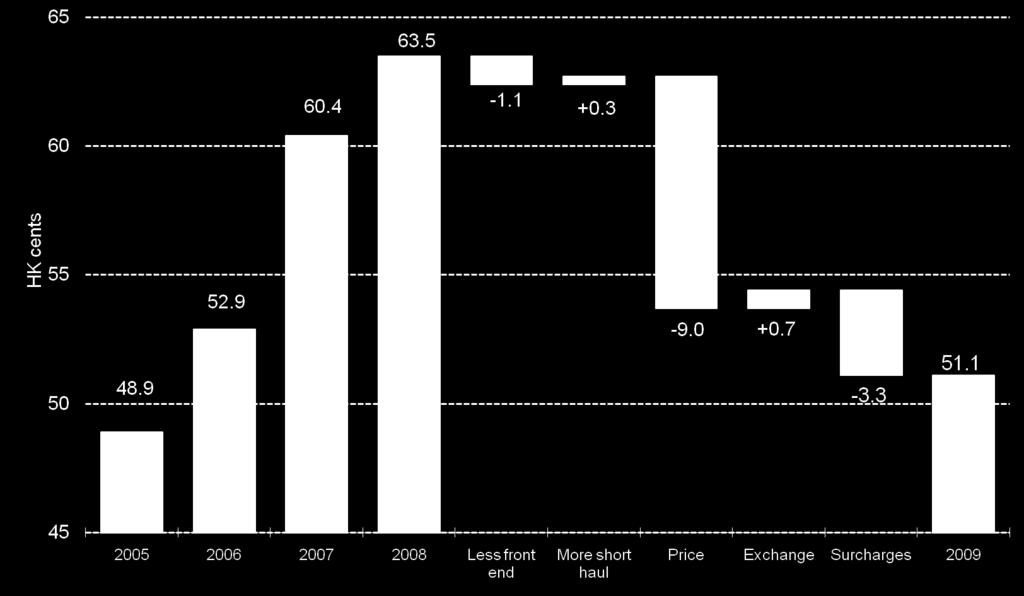
8 Passenger Yield
9 Product and Services Rollout of new three-class cabins for our medium- and long-haul fleet was completed in November. Cabin refresh programme for our regional business and economy class product (for both CX and KA) is under way New aircraft continued to arrive and retiring older, fuel inefficient Boeing F Classics Airline of the Year 2009 by Skytrax
10 Passenger Services Development in 2010 Planned to add flights to Jeddah, reinstating services to Los Angeles, Seoul and Toronto New passenger services to Milan and Moscow KA to increase frequencies to Hanoi, Nanjing, Chengdu, Changsha and Chongqing; and to upgrade aircraft to Phnom Penh and Fuzhou
11 Cargo Service - Key Numbers 2009 vs 2008 Group Turnover HK$17,255m % Cathay Pacific and Dragonair Cargo Capacity (ACTK) 11,666m % - on passenger aircraft 4,296m % - on freighters 7,370m % Cargo Carried 1,528k tons - 7.1% Yield per tonne km HK$ % Load factor 70.8% +4.9%pts

12 Cargo & Mail Yield
13 Cargo Operating Performance 2009 Difficult 1H, 15% reduction in capacity 5 parked freighters Demand picked up 2H 2009 Strong Peak Rapid yield improvement High Load factors More extra sectors 2010 Demand firm, regional routes recovering, better balance of capacity to demand on long haul trade lanes Fuel price rising 13
14 Cathay Pacific Cargo Strategy Continue to grow our hub at HKIA, already the largest International Cargo Hub in the world Stay at leading edge of technology curve - Young efficient fleet - New Terminal - Promote E freight Differentiate Product Segmentation - Expert lift - Priority lift Invest in Air China Cargo so that CX is a major player in the two hub airports for Pearl River Delta & Yangtze River Delta originating export traffic 14


15 Cathay Pacific Cargo Hub Development Strategy New Cargo Terminal at HKIA HKD 5.5bm investment operational in m tonne phase 1 capacity 20 year franchise Key Features Platform for growth Product & service improvements - Transhipment - E-freight environment Cost reduction potential 15
16 Air China / Cathay Pacific Cargo Joint Venture CX to acquire 49% economic interest in Air China Cargo (ACC) Active investor both shareholders to second management to J.V. ACC an existing airline - operations in Beijing and Shanghai - 7 x 747 Freighters - sells Belly space in Air China s passenger fleet CX investment by injecting assets into ACC - 4 x 747 Freighters - 2 spare engines Strategic Objective: Grow Air China Cargo to become preeminent cargo carrier in Beijing & Shanghai 16
17 Cargo Fleet Plan 2010 Current fleet composition 25 x 747 Freighters : 6 x F, 6 x ERF and 13 x BCF Future development Out of service 4 x BCF to joint venture New delivery 747-8F 6 in 2011 and 4 in
18 Group Operating Cost 2009 vs 2008 Staff 12, % Inflight service & passenger 2, % Landing, parking & route 10, % Fuel 17, % Aircraft maintenance 6, % Depreciation & leases 9, % Net finance charges % Others 3, % Total Operating Cost HK$m 63, %

19 HK$ Airlines Cost per ATK without Fuel
20 Airlines Cost per ATK Cost per ATK Cost per ATK w/o fuel

21 Productivity - Staff Staff no. ATK Note: Includes KA from Oct06
22 Fleet composition changes (CX/KA) 31Dec Deliveries (4x ERF, 5x ER, 1x BCF) 10 Returned (2xA , 1xA ) 3 Retired (6x F) 6 31Dec Parked (5x BCF, 4x A , 1x ) 10 Leased out (1x BCF to AHK) 1 Operating 144 Passenger aircraft 125 Freighter 19
23 Percentage consumption subject to hedging contracts Maximum fuel hedging exposure 70% 60% 50% 40% 30% 20% 10% 0% Brent (US$/barrel)
24 US$M 400 Sensitivity analysis of cash and profit and loss impact of fuel price movements on fuel hedging contracts (200) (400) (600) (800) Brent (US$/barrel) Cash impact in 2010 of contracts maturing in 2010 Overall P&L sensitivity for contracts maturing in 2010 Cash impact in 2011 of contracts maturing in 2011 Overall P&L sensitivity for contracts maturing in 2011
25 Balance Sheet 31 Dec Dec 08 vs Dec 08 (restated) Shareholders' Funds HK$42,238m HK$36,709m 15.1% up Gross Borrowings HK$42,642m HK$40,280m 5.9% up Less: Liquid Funds HK$(16,511m) HK$(15,082m) 9.5% up Net Borrowings HK$26,131m HK$25,198m 3.7% up Capital Employed (incl. MI) HK$68,516m HK$62,027m 10.5% up Net Debt/Equity Ratio times Investment in Air China HK$7,885m HK$7,854m 0.4% up
26 Liquid Fund Flow Inflow HK$'M HK$'M New financing 6,169 6,665 Operating activities 2,035 1,816 Disposals & others 4,623 1,246 Outflow Capital expenditure (6,776) (9,667) Loan repayment (4,479) (3,919) Dividend paid (143) (2,696) Net inflow/(outflow) 1,429 (6,555)


27 Profit & Net Debt/Equity Ratio Profit / (loss) - HK$ m D/E ratio - times SARS

28 Major subsidiaries AHK Air Hong Kong 60% owned by Cathay Pacific Load factor increased marginally with a capacity increase of 16% but yield under pressure Lower profits due to substantial yield reduction Cathay Pacific Catering Services Produced 20.9 million meals, down 4.6% but market share increased by 1.3% pt to 63.4% Lower profits as decline in business volume and cost saving initiatives of customer airlines reduced profit margin Asia Miles More than 3 million members, net growth of 10% in airline partners and 465 non-airline partners
29 Air China CA made a significant operating loss in 4Q 08 and a profit of RMB3,811m (under PRC GAAP) for Jan-Sep 09 Positive profit alert for the 2009 annual results Air China Cargo (ACC) joint venture Joint venture operations on Beijing, Shanghai, Chengdu and Chongqing Looking at other initiatives

30 Summary Operating profitably bolstered by one-off gains Passenger revenue improves but from a low base front end demand still below levels prior to the downturn yields remain low but loads are high Cargo revenue started to pick up Fuel price remains stubbornly high

31 Q & A For more information, please visit our website


32 oneworld
Cathay Pacific Airways 2010 Annual Results 9 March 2011
 Cathay Pacific Airways 2010 Annual Results 9 March 2011 1 Annual Result 2010 2009 Change Group Profit/(Loss) HK$14,048m HK$4,694m +199.3% Group Turnover HK$89,524m HK$66,978m +33.7% Profit Margin 15.7%
Cathay Pacific Airways Interim Results 04 August Cathay Pacific Airways Interim Results 6 August 2008
 Cathay Pacific Airways 2010 Interim Results 04 August 2010 Cathay Pacific Airways 2008 Interim Results 6 August 2008 Interim Result 1H 2010 1H 2009 Group Profit/(Loss) HK$6,840m HK$812m Group Turnover
Cathay Pacific Airways 2011 Interim Results 10 August 2011
 Cathay Pacific Airways 2011 Interim Results 10 August 2011 1 Interim Result 1H 2011 1H 2010 Group profit HK$2,808m HK$6,840m Group turnover HK$46,791 HK$41,337m Profit margin 6.0% 16.5% Return on capital
Cathay Pacific Airways
 Cathay Pacific Airways Annual Results for the year ended 31 st December 2011 14 March 2012 1 Annual Result 2011 2010 Change Group attributable profit HK$5,501m HK$14,048m -60.8% Group Turnover HK$98,406m
Cathay Pacific Airways Interim Results for the six months ended 30 June 2012
 Cathay Pacific Airways Interim Results for the six months ended 30 June 2012 8 August 2012 1 Interim Result 1H2012 1H2011 Change Group attributable (loss) / profit HK$ million (935) 2,808-133.3% Group
Cathay Pacific Airways
 Cathay Pacific Airways Interim Results for the six months ended 30 th June 2014 13th August 2014 1 Interim Results 1H2014 1H2013 Change Profit attributable to the shareholders of Cathay Pacific HK$ million
Analysts Briefing. 18 March Cathay Pacific Airways Limited
 Analysts Briefing 18 March 2015 Cathay Pacific Airways Limited Annual Results 2014 2013 Change Group attributable profit HK$m 3,150 2,620 +20.2% Group turnover HK$m 105,991 100,484 +5.5% Profit margin
Cathay Pacific Airways 2011 Analyst Briefing 23 June 2011
 Cathay Pacific Airways 2011 Analyst Briefing 23 June 2011 1 Airline Strategy Grow our international network, expand frequencies and further develop Hong Kong as one of the world s leading aviation hubs
Cathay Pacific Airways 2013 Analyst Briefing 25 June Cathay Pacific Airways Analyst Briefing 27 November 2013
 Cathay Pacific Airways 2013 Analyst Briefing 25 June 2013 Cathay Pacific Airways Analyst Briefing 27 November 2013 2013 Operating Performance to date: Passenger yield and load factor growth on lower ASKs.
Credit Suisse. 19 th Annual AIC 8 th April Cathay Pacific Airways Limited
 Credit Suisse 19 th Annual AIC 8 th April 2016 Cathay Pacific Airways Limited Annual Results - 2015 Group Financial Statistics 2015 2014 % Var Group Revenue HK$m 102,342 105,991-3.4% Group attributable
Cathay Pacific Airways Cathay Pacific Airways 2008 Annual Results Investor Relations Meeting 11 March June 2009
 Cathay Pacific Airways Cathay Pacific Airways 2008 Annual Results Investor Relations Meeting 11 March 2009 22 June 2009 Airline Strategy Continue to grow our extensive international network, expand frequencies
Cathay Pacific Airways Analyst Briefing. 21 November 2014
 Cathay Pacific Airways Analyst Briefing 21 November 2014 Operating Performance Passenger demand remains strong, although growth in North America is significantly short of increase in capacity. Demand for
Cathay Pacific Airways Analyst & Investor Briefing June Cathay Pacific Airways Interim Results 6 August 2008
 Cathay Pacific Airways 2010 Analyst & Investor Briefing June 2010 Cathay Pacific Airways 2008 Interim Results 6 August 2008 Airline Strategy Remains largely unchanged Grow our international network, expand
Cathay Pacific Airways 2012 Analyst Briefing 28 June 2012
 Cathay Pacific Airways 2012 Analyst Briefing 28 June 2012 1 Airline Strategy Grow our international network, expand frequencies and further develop Hong Kong as one of the world s leading aviation hubs
Cathay Pacific Airways Analyst Briefing 27 November 2012
 Cathay Pacific Airways Analyst Briefing 27 November 2012 1 Trading Statement 2012 A very challenging year High fuel prices Soft premium demand High competition in Economy Class putting pressure on yield
Cathay Pacific is committed to building its network and connectivity and so to strengthen Hong Kong s position as a major aviation hub.
 Connecting Worlds together 26 Swire Pacific Annual Report 2010 Cathay Pacific is committed to building its network and connectivity and so to strengthen Hong Kong s position as a major aviation hub. Swire
Analysts Briefing. 27 November Cathay Pacific Airways Limited
 Analysts Briefing 27 November 2015 Cathay Pacific Airways Limited Operating performance - overview Passenger load factors are high, driven by strong back-end demand. Passenger front-end yield and load
Analysts Briefing. 15 March Cathay Pacific Airways Limited
 Analysts Briefing 15 March 2017 Cathay Pacific Airways Limited Annual Results - 2016 Group Financial Statistics 2016 2015 % Var Group Revenue HK$m 92,751 102,342-9.4% Group attributable profit/(loss) Million
Passenger services 7,438 10,550 Cargo services 4,405 4,225 Catering and other services Turnover 1 12,275 15,511
 Cathay Pacific Airways Limited - 2003 Interim Results Consolidated Profit and Loss Account - Unaudited Six months ended 30th June 2003 2002 Note Passenger services 7,438 10,550 Cargo services 4,405 4,225
The Accounting Case Competition for Secondary Schools and Tertiary Institutes. Tertiary Institutes Group
 The Accounting Case Competition for Secondary Schools and Tertiary Institutes 2004 Time allowed 2 hours Answer ALL the questions Marks Section A 50 Section B 20 Section C 15 Section D 15 100 DO NOT OPEN
Cathay Pacific Airways 2013 Analyst Briefing 25 June Cathay Pacific Airways 2013 Analyst Briefing 25 June 2013
 Cathay Pacific Airways 2013 Analyst Briefing 25 June 2013 Cathay Pacific Airways 2013 Analyst Briefing 25 June 2013 1 Operating Performance The challenging business environment continues into the first
Analyst Briefing. 12 June Cathay Pacific Airways Limited
 Analyst Briefing 12 June 2015 Cathay Pacific Airways Limited Operating Performance The positive operating environment continues into the first half of 2015. Robust passenger demand and healthy cargo demand.
Analysts Briefing. 24 June Cathay Pacific Airways Limited
 Analysts Briefing 24 June 2016 Cathay Pacific Airways Limited Operating performance - overview Challenging business environment. Load factor lower than expectations on weakening passenger demand. Strong
Air China Limited Interim Results. August Under IFRS
 Air China Limited 21 Interim Results Under IFRS August 21 1 Agenda 21 Interim Results Overview Business Overview Financial Overview Outlook 2 2 2 21 Interim Results 3 21 Interim Results Overview 4 4 4
CONSOLIDATED PROFIT AND LOSS ACCOUNT
 CONSOLIDATED PROFIT AND LOSS ACCOUNT for the year ended 31st December Turnover Note Passenger services 26,407 18,663 Cargo services 11,395 9,913 Catering and other services 1,263 1,002 Total turnover 1
CATHAY PACIFIC AIRWAYS LIMITED (Incorporated in Hong Kong with limited liability)
") Hong Kong Exchanges and Clearing Limited and The Stock Exchange of Hong Kong Limited take no responsibility for the contents of this announcement, make no representation as to its accuracy or completeness
Hong Kong Exchanges and Clearing Limited and The Stock Exchange of Hong Kong Limited take no responsibility for the contents of this announcement, make no representation as to its accuracy or completeness
2014 Annual Results 1
 1 2014 Annual Results Annual Results 2014 2013 Change HK$M HK$M Attributable profit 573 625-8.3% Revenue 11,927 7,387 +61.5% Earnings per share (HK$) 3.45 3.76-8.3% Total dividends per share (HK$) 2.10
Air China Limited Annual Results. March Under IFRS
 Air China Limited 21 Annual Results Under IFRS March 211 Agenda Part 1 Highlights Part 2 Business Overview Part 3 Financial Overview Part 4 Outlook 2 Part 1 Highlights Steady Economic Growth; Asia Pacific
CATHAY PACIFIC AIRWAYS LIMITED (Incorporated in Hong Kong with limited liability) (Stock Code: 293)
 (Stock Code: 293)") CATHAY PACIFIC AIRWAYS LIMITED (Incorporated in Hong Kong with limited liability) (Stock Code: 293) 2006 Interim Results Financial and Operating Highlights Group Financial Statistics 2006 2005 Change Results
CATHAY PACIFIC AIRWAYS LIMITED (Incorporated in Hong Kong with limited liability) (Stock Code: 293) 2006 Interim Results Financial and Operating Highlights Group Financial Statistics 2006 2005 Change Results
CATHAY PACIFIC AIRWAYS LIMITED (Incorporated in Hong Kong with limited liability)
") Annual results announcement Annual Results CATHAY PACIFIC AIRWAYS LIMITED (Incorporated in Hong Kong with limited liability) (Stock Code: 00293) Financial and Operating Highlights Group Financial Statistics
Annual results announcement Annual Results CATHAY PACIFIC AIRWAYS LIMITED (Incorporated in Hong Kong with limited liability) (Stock Code: 00293) Financial and Operating Highlights Group Financial Statistics
FULL YEAR OPERATING PROFIT RISES TO $259 MILLION 25 CENTS SPECIAL DIVIDEND PROPOSED OUTLOOK REMAINS CHALLENGING
 8 May 2014 Page 1 of 5 No. 02/14 8 May 2014 FULL YEAR OPERATING PROFIT RISES TO $259 MILLION 25 CENTS SPECIAL DIVIDEND PROPOSED OUTLOOK REMAINS CHALLENGING GROUP FINANCIAL PERFORMANCE Financial Year 2013-14
Singapore Airlines Group Analyst/Media Briefing HALF YEAR FY RESULTS 5 NOVEMBER 2012 THE PARENT AIRLINE 1H FY2012/13 RESULTS
 Singapore Airlines Group Analyst/Media Briefing HALF YEAR FY2012-13 13 RESULTS 5 NOVEMBER 2012 THE PARENT AIRLINE 1H FY2012/13 RESULTS THE PARENT AIRLINE COMPANY RESULTS 2Q & 1H FY12/13 2Q/12 $million
SIA ANALYST/MEDIA BRIEFING Q2 and 1H FY17/18 Results 8 November 2017
 SIA ANALYST/MEDIA BRIEFING Q2 and 1H FY17/18 Results 8 November 2017 THE PARENT AIRLINE Q2 AND 1H FY17/18 RESULTS THE PARENT AIRLINE COMPANY OPERATING PERFORMANCE Q2 % 1H % FY17/18 Change FY17/18 Change
Advancing World-Class Service
 Aviation Division Advancing World-Class Service We aim to continue to improve our products and services on the ground and in the air, to strengthen our aircraft engineering business and to expand our fleet
Part 1 Performance Highlights. Part 2 Business Overview. Part 3 Financial Review
 August 216 1 Part 1 Performance Highlights Part 2 Business Overview Part 3 Financial Review Part 4 Outlook 2 Under IFRS 3 Part 1 Performance Highlights Performance Highlights - Key Operational Metrics
Cathay Pacific Airways Limited
 Cathay Pacific Airways Limited 2007 Interim Report Stock code: 00293 Hong Kong Cathay Pacific Cathay Pacific Freighter Dragonair Air Hong Kong CONTENTS Financial and 2 Operating Highlights Corporate Information
CATHAY PACIFIC AIRWAYS LIMITED (Incorporated in Hong Kong with limited liability) (Stock Code: 293)
 (Stock Code: 293)") CATHAY PACIFIC AIRWAYS LIMITED (Incorporated in Hong Kong with limited liability) (Stock Code: 293) 2008 Interim Results Financial and Operating Highlights Group Financial Statistics Results 2008 2007
CATHAY PACIFIC AIRWAYS LIMITED (Incorporated in Hong Kong with limited liability) (Stock Code: 293) 2008 Interim Results Financial and Operating Highlights Group Financial Statistics Results 2008 2007
CATHAY PACIFIC AIRWAYS LIMITED (Incorporated in Hong Kong with limited liability) (Stock Code: 00293)
 (Stock Code: 00293)") Hong Kong Exchanges and Clearing Limited and The Stock Exchange of Hong Kong Limited take no responsibility for the contents of this announcement, make no representation as to its accuracy or completeness
Hong Kong Exchanges and Clearing Limited and The Stock Exchange of Hong Kong Limited take no responsibility for the contents of this announcement, make no representation as to its accuracy or completeness
Cathay Pacific Airways Limited 2008 Interim Report
 Cathay Pacific Airways Limited 2008 Interim Report Stock code: 00293 Hong Kong Cathay Pacific Cathay Pacific Freighter Dragonair Air Hong Kong CONTENTS 2 Financial and Operating Highlights Corporate Information
Finnair Group Interim Report 1 January 30 June 2008
 Finnair Group Interim Report 1 January 30 June 2008 1 08/08/2008 Presentation name / Author Airline industry at a historical turning point Fuel price has a stranglehold on the business Average ticket prices
Finnair Group Interim Report 1 January 31 March 2008
 Finnair Group Interim Report 1 January 31 March 2008 1 29/04/2008 Presentation name / Author Outlook for the industry less positive Growth of demand declining due to uncertainty of global economy Growth
CATHAY PACIFIC AIRWAYS LIMITED (Incorporated in Hong Kong with limited liability) (Stock Code: 00293)
 (Stock Code: 00293)") Hong Kong Exchanges and Clearing Limited and The Stock Exchange of Hong Kong Limited take no responsibility for the contents of this announcement, make no representation as to its accuracy or completeness
Hong Kong Exchanges and Clearing Limited and The Stock Exchange of Hong Kong Limited take no responsibility for the contents of this announcement, make no representation as to its accuracy or completeness
CATHAY PACIFIC AIRWAYS LIMITED (Incorporated in Hong Kong with limited liability)
") Hong Kong Exchanges and Clearing Limited and The Stock Exchange of Hong Kong Limited take no responsibility for the contents of this announcement, make no representation as to its accuracy or completeness
Hong Kong Exchanges and Clearing Limited and The Stock Exchange of Hong Kong Limited take no responsibility for the contents of this announcement, make no representation as to its accuracy or completeness
NEWS RELEASE ON FINANCIAL RESULTS FOR THE THREE MONTHS ENDED 31 DECEMBER 2003 CONTINUED RECOVERY IN THIRD FINANCIAL QUARTER
 No. 01/04 5 February 2004 NEWS RELEASE ON FINANCIAL RESULTS FOR THE THREE MONTHS ENDED 31 DECEMBER 2003 CONTINUED RECOVERY IN THIRD FINANCIAL QUARTER MAIN POINTS OF THE GROUP S RESULTS Oct-Dec 03 Oct-Dec
14 Swire Pacific 2012 Annual Report
 We aim to continue to improve our products and services on the ground and in the air, to strengthen our aircraft engineering business and to expand our fleet by acquiring fuel efficient aircraft. 14 Swire
Air China Limited Announces 2010 Interim Results
 Air China Limited Announces 2010 Interim Results Record High First Half Results Leveraging New Opportunities to Drive Growth Hong Kong August 25, 2010 Air China Limited ( Air China or the Company, together
12.3million. passengers and 851,000 tonnes of cargo carried by Cathay Pacific in 2002.
 12.3million passengers and 851, tonnes of cargo carried by Cathay Pacific in 22. The three airlines are based in Hong Kong. Cathay Pacific Airways provides international passenger and cargo services. Dragon
CATHAY PACIFIC AIRWAYS LIMITED (Incorporated in Hong Kong with limited liability)
") Hong Kong Exchanges and Clearing Limited and The Stock Exchange of Hong Kong Limited take no responsibility for the contents of this announcement, make no representation as to its accuracy or completeness
Hong Kong Exchanges and Clearing Limited and The Stock Exchange of Hong Kong Limited take no responsibility for the contents of this announcement, make no representation as to its accuracy or completeness
CATHAY PACIFIC AIRWAYS LIMITED (Incorporated in Hong Kong with limited liability) (Stock Code: 00293)
 (Stock Code: 00293)") Hong Kong Exchanges and Clearing Limited and The Stock Exchange of Hong Kong Limited take no responsibility for the contents of this announcement, make no representation as to its accuracy or completeness
Hong Kong Exchanges and Clearing Limited and The Stock Exchange of Hong Kong Limited take no responsibility for the contents of this announcement, make no representation as to its accuracy or completeness
2012 Result. Mika Vehviläinen CEO
 2012 Result Mika Vehviläinen CEO 1 Agenda Market environment in Q4 Business performance and strategy execution Outlook Financials 2 Market Environment According to IATA, Global air travel continues to
Information meeting. 1 st September 2011
 Information meeting 1 st September 2011 Full Year 2010-11 key data April 2010-March 2011 Revenues in billions Operating result in millions 77% Passenger 18.10 +11.3% -44 +874 13% Cargo 3.16 +29.5% +69
Agenda. Conclusion of Transform Key Perform 2020 initiatives. Perform 2020 financial framework. Information meeting
 Information meeting Agenda Conclusion of Transform 2015 Key Perform 2020 initiatives Perform 2020 financial framework 2 Transform 2015: first phase of group turnaround accomplished Strict capacity discipline
Cathay Pacific Airways Limited
 Cathay Pacific Airways Limited Interim Report Stock Code: 00293 Hong Kong Cathay Pacific Cathay Pacific Freighter Dragonair Air Hong Kong CONTENTS 2 Financial and Operating Highlights Corporate Information
FIRST QUARTER OPERATING PROFIT RISES TO $281 MILLION
 27 July 2017 Page 1 of 5 No. 03/17 27 July 2017 FIRST QUARTER OPERATING PROFIT RISES TO $281 MILLION Revenue improvement seen for all SIA Group airlines, but pressure on yields remains Earnings supported
FIRST QUARTER OPERATING PROFIT IMPROVES TO $274 MILLION
 1 August 2006 Page 1 of 4 No. 03/06 1 August 2006 FIRST QUARTER OPERATING PROFIT IMPROVES TO $274 MILLION HIGHLIGHTS OF THE GROUP S PERFORMANCE 1st Quarter 2006-07 Year-on-Year % Change Operating revenue
THIRD QUARTER OPERATING PROFIT UP 51% TO $675 MILLION
 THIRD QUARTER OPERATING PROFIT UP 51% TO $675 MILLION GROUP FINANCIAL PERFORMANCE Third Quarter 2007-08 The Group made an operating profit of $675 million in the third quarter of financial year 2007-08,
FIRST QUARTER OPERATING PROFIT IMPROVES 69% TO $463 MILLION
 FIRST QUARTER OPERATING PROFIT IMPROVES 69% TO $463 MILLION PARENT AIRLINE OPERATIONS DRIVE GROUP OPERATING PROFIT The Group made an operating profit of $463 million for the first quarter of 2007-08; an
STRONG OPERATING RESULTS LIFT NET PROFIT 7.3% TO $932 MILLION
 STRONG OPERATING RESULTS LIFT NET PROFIT 7.3% TO $932 MILLION GROUP FINANCIAL PERFORMANCE First Half 2007-08 The Group achieved an operating profit of $982 million for the first half of financial year
SECOND QUARTER OPERATING PROFIT IMPROVES TO $87 MILLION
 12 November 2013 Page 1 of 5 No. 05/13 12 November 2013 SECOND QUARTER OPERATING PROFIT IMPROVES TO $87 MILLION GROUP FINANCIAL PERFORMANCE Second Quarter 2013-14 The Group earned an operating profit of
2003/04 Full Year Results Presentation to Investors
 2003/04 Full Year Results Presentation to Investors 19 August 2004 Geoff Dixon Chief Executive Officer Highlights 12 months to June 2004 12 months to June 2003 Increase/ (decrease) % Sales and operating
PROFIT OF $1.24b ON STRONG REVENUE GAINS BUT FUEL COSTS REMAIN GREATEST CHALLENGE
 PROFIT OF $1.24b ON STRONG REVENUE GAINS BUT FUEL COSTS REMAIN GREATEST CHALLENGE HIGHLIGHTS OF THE GROUP S PERFORMANCE Financial Year 2005-06 4th Quarter 2005-06 Apr 2005 Mar 2006 Year-on-Year % Change
Air China Limited Announces 2009 Annual Results
 Air China Limited Announces 2009 Annual Results Record Operating Profit in Complex Market Environment Strengthened Position to Capture Growth Opportunities Hong Kong April 22, 2010 Air China Limited (
Singapore Airlines Group Analyst/Media Briefing HALF YEAR FY RESULTS. 13 November 2013 THE PARENT AIRLINE 1H FY2013/14 RESULTS
 Singapore Airlines Group Analyst/Media Briefing HALF YEAR FY2013-14 14 RESULTS 13 November 2013 THE PARENT AIRLINE 1H FY2013/14 RESULTS THE PARENT AIRLINE COMPANY RESULTS 2Q & 1H FY13/14 2Q/13 $million
QANTAS HALF YEAR 2015 FINANCIAL RESULTS 1
 QANTAS HALF YEAR 2015 FINANCIAL RESULTS 1 Key points: Underlying Profit Before Tax: $367 million Statutory Profit After Tax: $206 million Transformation benefits: $374 million Comparable unit cost reduction:
2005 Interim Report. Cathay Pacific Airways Limited
 2005 Interim Report Cathay Pacific Airways Limited Cathay Pacific Dragonair Air Hong Kong Contents 2 Financial and Operating Highlights 3 Chairman s Letter 4 2005 Interim Review 6 Review of Operations
Information meeting. September 2011
 Information meeting September 2011 Full Year 2010-11 key data April 2010-March 2011 Revenues in billions Operating result in millions 77% Passenger 18.10 +11.3% -44 +874 13% Cargo 3.16 +29.5% +69 +505
THE PARENT AIRLINE FY2010/11 RESULTS
 SINGAPORE AIRLINES GROUP ANALYST / MEDIA BRIEFING FY21-11 11 RESULTS 13 MAY 211 THE PARENT AIRLINE FY21/11 RESULTS THE PARENT AIRLINE COMPANY RESULTS FY21/11 4Q/1 $million Better/ (Worse) $million 21/11
PARENT AIRLINE OPERATIONS LIFT GROUP PROFIT
 PARENT AIRLINE OPERATIONS LIFT GROUP PROFIT HIGHLIGHTS OF THE GROUP S PERFORMANCE Financial Year 2006-07 4th Quarter 2006-07 Apr 2006 Mar 2007 Year-on-Year % Change Jan-Mar 2007 Year-on-Year % Change Operating
HIGH FUEL PRICES DRIVE HALF YEAR PROFIT DOWN 62% AMIDST CHALLENGING ENVIRONMENT
 3 November 2011 Page 1 of 4 No. 06/11 03 November 2011 HIGH FUEL PRICES DRIVE HALF YEAR PROFIT DOWN 62% AMIDST CHALLENGING ENVIRONMENT GROUP FINANCIAL PERFORMANCE First Half 2011-12 The Group made a net
Information meeting. 12 September 2011
 Information meeting 12 September 2011 Full Year 2010-11 key data April 2010-March 2011 Revenues in billions Operating result in millions 77% Passenger 18.10 +11.3% -44 +874 13% Cargo 3.16 +29.5% +69 +505
CATHAY PACIFIC AIRWAYS LIMITED (Incorporated in Hong Kong with limited liability) (Stock Code: 00293)
 (Stock Code: 00293)") Hong Kong Exchanges and Clearing Limited and The Stock Exchange of Hong Kong Limited take no responsibility for the contents of this announcement, make no representation as to its accuracy or completeness
Hong Kong Exchanges and Clearing Limited and The Stock Exchange of Hong Kong Limited take no responsibility for the contents of this announcement, make no representation as to its accuracy or completeness
Finnair 2015 kolmannen vuosineljänneksen tulos
 Finnair 215 kolmannen vuosineljänneksen tulos Q3 Result 215 3 October 215 3.1.215 Toimitusjohtaja Pekka Vauramo Talousjohtaja Pekka Vähähyyppä 1 Highlights of the quarter Excellent Q3 result: Record result
Analyst Presentation. 9 th June 2006
 Analyst Presentation 9 th June 2006 1 Existing Principal Shareholding Structure CITIC Pacific 46.30% 25.40% 10.00% 68.36% CNAC(HK) 43.29% 7.71% 17.79% 28.50% Dragonair Source: Announcement on 9 th June
THIRD QUARTER NET PROFIT OF $397 MILLION ON RECORD REVENUE
 THIRD QUARTER NET PROFIT OF $397 MILLION ON RECORD REVENUE HIGHLIGHTS OF THE GROUP S PERFORMANCE 3rd Quarter 2005-06 9 Months 2005-06 Year-on-Year Apr-Dec % Change 2005 Oct-Dec 2005 Year-on-Year % Change
$168 MILLION PROFIT FOR FIRST HALF
 2 November 2012 Page 1 of 4 No. 05/12 02 November 2012 $168 MILLION PROFIT FOR FIRST HALF GROUP FINANCIAL PERFORMANCE First Half 2012-13 The SIA Group registered a net profit of $168 million in the first
Finnair Q Result
 17 August 2016 CEO Pekka Vauramo CFO Pekka Vähähyyppä Finnair Q2 2016 Result 1 Highlights of the second quarter The seventh consecutive quarter of profit improvement Fukuoka & Guangzhou route openings
CATHAY PACIFIC ANNOUNCES 2014 ANNUAL RESULTS
 Media Information 18 March 2015 FOR IMMEDIATE RELEASE CATHAY PACIFIC ANNOUNCES 2014 ANNUAL RESULTS Results 2014 2013 Change Turnover HK$ million 105,991 100,484 +5.5% Profit attributable to the shareholders
MEDIA/ANALYST PRESENTATION FY RESULTS 11 MAY 2007
 MEDIA/ANALYST PRESENTATION FY2006-07 RESULTS 11 MAY 2007 SIA GROUP FY2006-07 07 RESULTS GROUP REVENUE FY2006/07 ($ million) ($ million) 15,000 14,494 14,000 13,000 12,000 11,000 10,515 12,013 13,341 Record
CATHAY PACIFIC AIRWAYS LIMITED (Incorporated in Hong Kong with limited liability)
") Hong Kong Exchanges and Clearing Limited and The Stock Exchange of Hong Kong Limited take no responsibility for the contents of this announcement, make no representation as to its accuracy or completeness
Hong Kong Exchanges and Clearing Limited and The Stock Exchange of Hong Kong Limited take no responsibility for the contents of this announcement, make no representation as to its accuracy or completeness
Air China Limited Announces 2010 Annual Results
 Air China Limited Announces 2010 Annual Results Profit reaches record high on strong economic growth Hong Kong March 29, 2011 Air China Limited ( Air China or the Company, together with its subsidiaries,
Information meeting. Full Year results. June 2011
 Information meeting Full Year 2010-11 results 1 June 2011 Agenda 2010-11: Recovery in activity and return to profitability 2011: Ongoing actions and reinforced strategic advantages 2 2010-11: Strong improvement
THIRD QUARTER OPERATING PROFIT UP 13% TO $330 MILLION
 13 February 2018 Page 1 of 7 ` No. 01/18 13 February 2018 THIRD QUARTER OPERATING PROFIT UP 13% TO $330 MILLION Higher carriage and load factors for all passenger airlines Strong earnings for SIA Cargo
CATHAY PACIFIC ANNOUNCES 2013 ANNUAL RESULTS
 Media Information 12 March 2014 CATHAY PACIFIC ANNOUNCES 2013 ANNUAL RESULTS Results 2013 2012 (restated) Change Turnover HK$ million 100,484 99,376 +1.1% Profit attributable to the owners of Cathay Pacific
Annual Results Air New Zealand
 Annual Results 2011 Air New Zealand Highlights Normalised earnings* $75m Net cash position of $860m Operating cash flow down 5% Gearingat467% at 46.7% Final dividend 2.5 cents per share (unimputed) New
FIRST HALF NET PROFIT UP 32% TO $425 MILLION
 7 November 2017 Page 1 of 7 No. 05/17 7 November 2017 FIRST HALF NET PROFIT UP 32% TO $425 MILLION Improvement led by higher operating profit All passenger airlines recorded higher flown revenue Interim
Air China Limited 2014 Annual Results Under IFRS
 Air China Limited 2014 Annual Results Under IFRS March 2015 Agenda Part 1 Results Highlights Part 2 Business Overview Part 3 Financial Overview Part 4 Outlook Part 1 Results Highlights Gradual Global Economic
Cathay Pacific Airways Limited. Stock Code: Interim Report
 Cathay Pacific Airways Limited Stock Code: 00293 2013 Interim Report Hong Kong Cathay Pacific Cathay Pacific Freighter Dragonair Air Hong Kong Contents 2 Financial and Operating Highlights 3 Chairman s
Air China Limited 2015 First Quarter Results
 Air China Limited 2015 First Quarter Results April 2015 Under PRC GAAP, unaudited Agenda Part 1 Part 2 Part 3 Results Highlights Business Performance Financial Review Part 1 Results Highlights Results
2007/08 Full Year Results Investor Briefing
 2007/08 Full Year Results Investor Briefing Highlights of Result Profit before tax up 46% to $1,408 million Up 36% on the reported result Margin improvement $3 billion of Sustainable Future Benefits achieved
AIR NEW ZEALAND ANNUAL RESULTS ANNUAL RESULTS
 AIR NEW ZEALAND ANNUAL RESULTS 2008 1 HIGHLIGHTS Record operating revenue, up 9% Normalised earnings* $197m Net cash position of $1.3bn Launched direct service to Vancouver and Beijing Award winning product
SIA GROUP FINANCIAL RESULTS
 FINANCIAL RESULTS For Ended 30 June 2018 197200078R Operating Result Q1 Q1 Better/ FY18/19 FY17/18 R1 (Worse) ($M) ($M) (%) Total Revenue 3,844 3,864 (0.5) Q1 Better/ FY17/18 R2 (Worse) ($M) (%) 3,689
QANTAS RESULTS FOR THE HALF YEAR ENDED 31 DECEMBER 2005 HIGHLIGHTS
 Media Release QANTAS RESULTS FOR THE HALF YEAR ENDED 31 DECEMBER 2005 HIGHLIGHTS Profit before tax of $483.5 million Net profit after tax of $352.6 million Revenue of $6.8 billion Interim dividend of 11
Media Release QANTAS RESULTS FOR THE HALF YEAR ENDED 31 DECEMBER 2004 HIGHLIGHTS. Fully franked interim dividend of 10 cents per share
 Media Release QANTAS RESULTS FOR THE HALF YEAR ENDED 31 DECEMBER 2004 HIGHLIGHTS Profit before tax of $601.3 million Net profit after tax of $458.4 million Revenue of $6.4 billion Fully franked interim
THIRD QUARTER OPERATING PROFIT UP 96%
 4 February 2016 Page 1 of 7 No. 01/16 4 February 2016 THIRD QUARTER OPERATING PROFIT UP 96% Healthy expansion at SilkAir and Scoot Slide in fuel prices provided cost relief to the Group, in a weak yield
Finnair Group Interim Report 1 January 30 September 2008
 Finnair Group Interim Report 1 January 30 September 2008 1 31/10/2008 Presentation name / Author Airline industry at a historical turning point Expensive fuel price in the beginning of 2008 has dramatical
RECORD REVENUE AND EFFICIENCY DRIVE SOFTEN IMPACT OF HIGH FUEL COST, ENABLE HALF YEAR PROFIT OF $578 MILLION
 RECORD REVENUE AND EFFICIENCY DRIVE SOFTEN IMPACT OF HIGH FUEL COST, ENABLE HALF YEAR PROFIT OF $578 MILLION HIGHLIGHTS OF THE GROUP S PERFORMANCE First Half 2005-06 2nd Quarter 2005-06 Apr-Sep 2005 Year-on-Year
Overview. > Normalised earnings* before taxation of, up 30% > Statutory earnings before taxation of, up 40% > Statutory net profit after taxation of
 1 Overview > Normalised earnings* before taxation of, up 30% > Statutory earnings before taxation of, up 40% > Statutory net profit after taxation of > Operating revenue of > Strong operating cash flow
FULL-YEAR OPERATING PROFIT UP $151 MILLION AMID LOWER FUEL COSTS
 14 May 2015 Page 1 of 7 No. 02/15 14 May 2015 FULL-YEAR OPERATING PROFIT UP $151 MILLION AMID LOWER FUEL COSTS Net profit constrained by non-operating items 17-cent final dividend proposed Challenging
Cathay Pacific Airways Limited
 Cathay Pacific Airways Limited Stock Code: 00293 2012 Interim Report Hong Kong Cathay Pacific Cathay Pacific Freighter Dragonair Air Hong Kong CONTENTS 2 Financial and Operating Highlights 3 Chairman s
WEAK FOURTH QUARTER CAPS FULL-YEAR PROFIT AT $1.06 BILLION
 WEAK FOURTH QUARTER CAPS FULL-YEAR PROFIT AT $1.06 BILLION GROUP FINANCIAL PERFORMANCE Financial Year 2008-09 The Group earned a net profit attributable to equity holders of $1,062 million for the financial