Cathay Pacific Airways 2012 Analyst Briefing 28 June 2012
|
|
|
- Avice Jenkins
- 5 years ago
- Views:
Transcription

1 Cathay Pacific Airways 2012 Analyst Briefing 28 June
2 Airline Strategy Grow our international network, expand frequencies and further develop Hong Kong as one of the world s leading aviation hubs Ensure that quality and our brand are not compromised and the service proposition to the customer remains strong Continue to develop the strategic relationship with Air China Maintain a prudent approach to financial risk management 2
3 Operating Performance Issued Trading Statement on 9 th May 2012 Stubbornly high price of jet fuel, despite the recent decline Softening yield in the passenger cabins Persistent weak demand in the air cargo markets Introduction of cost saving measures Gearing and liquidity remain strong 3
4 USD/Bbl - Brent-Daily Closing Price and 250 Day Simple Moving Average The average fuel price has never been higher Brent Daily Close Brent 250 Day SMA 4

5 Operating Performance - Passenger Passenger volume growth exceeds capacity growth Premium traffic is under increasing pressure with yield softening Demand in economy class met expectations but yield continues to decline 5
 54,776,383 7.")
6 Performance to May 12 - Capacity Data CATHAY PACIFIC/ DRAGONAIR COMBINED CAPACITY Cumulative May 2012 % change YTD China 4,440, % North East Asia 6,951, % South East Asia 7,159, % India, Middle East, Pakistan & Sri Lanka 4,717, % Europe 9,019, % South West Pacific & South Africa 8,053, % North America 14,433, % ASK ( 000) 54,776, % Passenger load factor 79.6% 0.8%pt Available cargo and mail tonne km ( 000) 5,611, % Cargo and mail load factor 64.0% -4.7% ATK ( 000) 10,820, % 6
 43,577,139 8.")
7 Performance to May 12 - Traffic Data CATHAY PACIFIC AND DRAGONAIR COMBINED TRAFFIC Cumulative May 2012 % change YTD China 3,216, % North East Asia 4,990, % South East Asia 5,730, % India, Middle East, Pakistan & Sri Lanka 3,596, % Europe 7,478, % South West Pacific & South Africa 6,077, % North America 12,486, % RPK ( 000) 43,577, % Passengers carried 11,898, % Cargo and mail revenue tonne-km ( 000) (RTK) 3,590, % Cargo and mail carried kg ( 000) 626, % Number of flights 27, % 7
8 90% PASSENGER LOAD FACTOR (JAN MAY 2012) 85% 80% 75% 70% 65% 60% JAN FEB MAR APR MAY JUN JUL AUG SEP OCT NOV DEC

9 Operating Performance - Cargo Weak demand in most major markets throughout the first half of 2012 Significant drop in demand out of our key markets, Hong Kong and Mainland China, with temporary boost in March General air cargo market remains weak, especially to Europe Profitability on our freighter flights materially affected by high fuel prices, particularly on long-haul routes Zhengzhou added to our freighter network in March Expands cargo presence in India with new service to Hyderabad and increased frequency to Bengaluru 9
10 Performance to May 12 - Capacity Data CATHAY PACIFIC/ DRAGONAIR COMBINED CAPACITY Cumulative May 2012 % change YTD China 4,440, % North East Asia 6,951, % South East Asia 7,159, % India, Middle East, Pakistan & Sri Lanka 4,717, % Europe 9,019, % South West Pacific & South Africa 8,053, % North America 14,433, % ASK ( 000) 54,776, % Passenger load factor 79.6% 0.8%pt Available cargo and mail tonne km ( 000) 5,611, % Cargo and mail load factor 64.0% -4.7% ATK ( 000) 10,820, % 10
11 Performance to May 12 - Traffic Data CATHAY PACIFIC AND DRAGONAIR COMBINED TRAFFIC Cumulative May 2012 % change YTD China 3,216, % North East Asia 4,990, % South East Asia 5,730, % India, Middle East, Pakistan & Sri Lanka 3,596, % Europe 7,478, % South West Pacific & South Africa 6,077, % North America 12,486, % RPK ( 000) 43,577, % Passengers carried 11,898, % Cargo and mail revenue tonne-km ( 000) (RTK) 3,590, % Cargo and mail carried kg ( 000) 626, % Number of flights 27, % 11
12 85% CARGO AND MAIL LOAD FACTOR (JAN MAY 2012) 80% 75% 70% 65% 60% 55% 50% JAN FEB MAR APR MAY JUN JUL AUG SEP OCT NOV DEC

13 Cost-Saving Measures Reduce passenger and cargo capacity Deploy more fuel-efficient aircraft on long-haul flights Accelerate the retirement of the old Boeing Hiring freeze on new or replacement ground staff except those who are critical to operations Offer voluntary unpaid leave for cabin crew Cancel all non-essential business travel Reduce marketing and IT spend 13
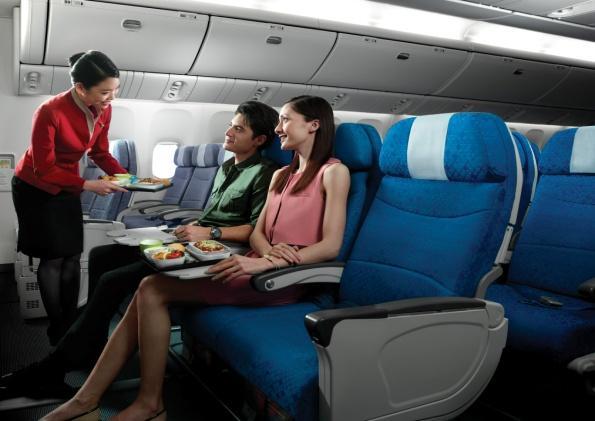
14 Fleet & Scheduling - CX Reduce frequencies on long-haul routes to North America and Europe Added regional flights to Taipei, Kuala Lumpur, Penang, Bangkok, Nagoya and Singapore in March Increase services between Seoul and Hong Kong from five to six flights daily effective from 15 July Increase frequencies between Chennai and Hong Kong from four flights a week to daily effective from 1 September 14


15 Fleet & Scheduling KA Added flights to Ningbo, Qingdao and Okinawa Used larger aircraft for some flights on the Xiamen, Guangzhou and Kunming routes Resumed services to Xi an in April and to Guilin and Taichung in May New services to Jeju and Clark were introduced in May New service to Chiang Mai will run from 1 July to end of September Intends to introduce service to Kolkata later in the year 15
16 Cargo Scheduling New freighter service to Zhengzhou in Henan Province, Central China in March Introduced new service to Hyderabad, India in May Added flights to Bengaluru, India, from two to three flights a week Reduce freighter frequencies to Europe and North America 16
17 CX and KA Fleet Plan 2012 In operation Parked Passenger Freighter Total Passenger Freighter Total 31 Dec New deliveries Return to lessors (2) - (2) Dry leased to Air Hong Kong - (3) (3) Parked aircraft - (2) (2) Deregistered (1) (1) 30 Jun (projected) 17


18 Fleet & Scheduling Retirement Plan As of 28 June 2012 Exit date Number Remaining Sep Mar Jun Sep Nov Jan
19 Cargo Fleet Plan 2012 Forecast fleet composition as at 30 Jun x 747 Freighters : 6 x F, 6 x ERF, 7 x BCF and 5 x 747-8F Latest development Sale 2 x BCF to Air China Cargo in second half of 2012 New delivery 747-8F 4 in 2012 and 2 in F 4 in 2014, 2 in 2015 and 2 in
20 New Aircraft as at June 2012 Orders brought forward at 1 Jan Delivered (9) New Orders in January Total as at 28 Jun
21 Aircraft Delivery Plan as at June B747-8F B F A A A B ER Total
22 Key Cost Savings Aircraft maintenance Navigation and overflying charges Staff costs Potential fuel costs savings derived from the replacement of the old and less fuel-efficient Boeing

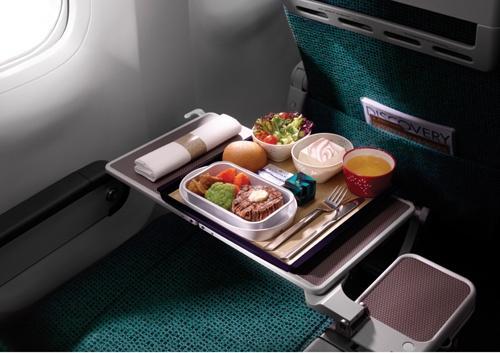
23 Product and Services Introduction of the new Premium Economy Class 23

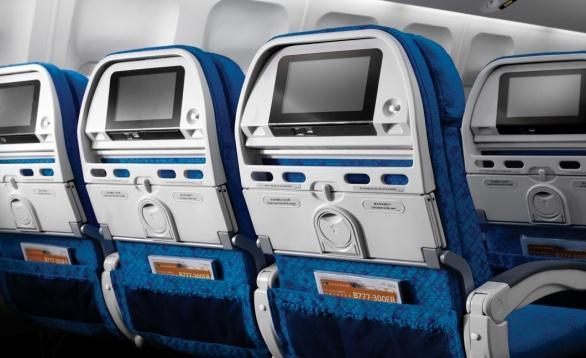

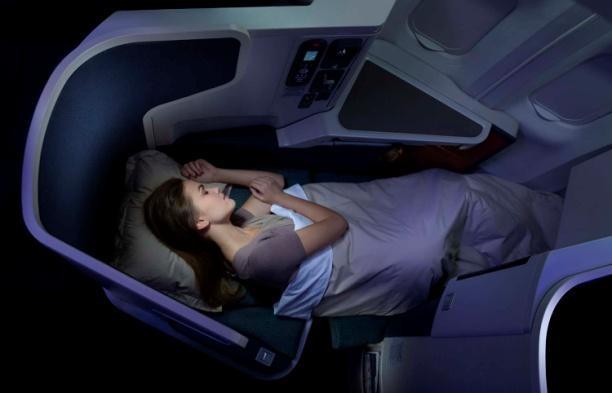
24 Product and Services (Continued) New long-haul Economy Class seats New Business Class seats 24


25 Product and Services (Continued) Reopened Business Class Lounge of The Wing in January 25


26 Product and Services (Continued) Launch of Mobile Boarding Pass service Upgrade of new passenger reservation system 26


27 Cargo Development Cargo Terminal HK$5.9 billion investment, spend to May 2012 HK$4.9 billion Good progress in construction and operation preparation, topping-out ceremony on 17 Nov 2011 On schedule for opening early 2013 It will greatly enhance the competitiveness and efficiency of Hong Kong as an airfreight hub 27

28 Air China Air China publishes its results on a quarterly basis and the loss for the 6 months period from 1 Oct 2011 to 31 March 2012 amounted to RMB 0.6bn, compared to profit RMB 3.8bn for the same period last year Air China Cargo Performance of Air China Cargo has been weak but remains strategically important 28
29 Shanghai Airport Ground Handling Joint Venture Strategic Objective to leverage on the resources & management expertise of each of the shareholders to enhance the hub operations and efficiency of ground handling services at the two Shanghai airports Shanghai International Airport Services Co., Limited is jointly owned and managed by Shanghai Airport Authority, Shanghai International Airport Co., Ltd., Air China Limited and Cathay Pacific Airways CX Group injected RMB90 million for 25% shareholding Expected to commence operations in the fourth quarter of 2012 subject to approval by the relevant Chinese government authorities 29
30 Financial Risk Management Currency All major currencies are hedged in compliance with our policy Liquidity A total of HK$2.7billion with tenors of 5 or 7 years raised through MTN programme since first issue in Oct 2011 Unpledged liquid funds and undrawn committed lines HK$21bn as at 31 May 2012 Interest rates Overall cost of debt remains low. Margins have widened, but yield curve at historically attractive levels Strategic management of fixed / floating ratio taking advantage of low fixed rates to lock in aircraft financing 30
31 Financial Risk Management (Continued) 80% 70% 60% 50% 40% 30% 20% 10% Net exposure (after hedging) of major currencies next 12 months 0% RMB EUR AUD TWD JPY GBP 31
 Projected Composition")

32 Financial Risk Management (Continued) Projected Composition of forex exposure (after hedging) next 12 months RMB EUR AUD TWD JPY GBP Others 32
33 Net debt to equity ratio May 2012 Dec 2011 Dec 2010 Dec 2009 Dec 2008 Dec 2007 Dec 2006 Dec Continue to adopt prudent financial strategy, maintain adequate cash reserves CAPEX on new aircraft, product enhancement and cargo terminal will be over HK$46B in the next 3 years 33
34 Fuel hedging coverage 35% Fuel Hedging As at 14 March 2012 As at 26 June % 30% 30% 25% 25% 20% 20% 15% 15% 10% 10% 5% 5% 0% 0% 2012 Jan-Jun 2013 Brent (US$/barrel) Jun-Dec

35 Outlook Global economic uncertainties continue into the second half, impacting passenger demand Cargo demand remains weak Fuel price remains high, but we benefit from the recent decline Cost cutting measures will be realised in the second half Continued enhancement of products and services to strengthen our competitive edge 35

36 Q & A For more information, please visit our website 36
Cathay Pacific Airways Interim Results for the six months ended 30 June 2012
 Cathay Pacific Airways Interim Results for the six months ended 30 June 2012 8 August 2012 1 Interim Result 1H2012 1H2011 Change Group attributable (loss) / profit HK$ million (935) 2,808-133.3% Group
Cathay Pacific Airways Analyst Briefing 27 November 2012
 Cathay Pacific Airways Analyst Briefing 27 November 2012 1 Trading Statement 2012 A very challenging year High fuel prices Soft premium demand High competition in Economy Class putting pressure on yield
Cathay Pacific Airways 2011 Analyst Briefing 23 June 2011
 Cathay Pacific Airways 2011 Analyst Briefing 23 June 2011 1 Airline Strategy Grow our international network, expand frequencies and further develop Hong Kong as one of the world s leading aviation hubs
Cathay Pacific Airways 2013 Analyst Briefing 25 June Cathay Pacific Airways Analyst Briefing 27 November 2013
 Cathay Pacific Airways 2013 Analyst Briefing 25 June 2013 Cathay Pacific Airways Analyst Briefing 27 November 2013 2013 Operating Performance to date: Passenger yield and load factor growth on lower ASKs.
Cathay Pacific Airways 2013 Analyst Briefing 25 June Cathay Pacific Airways 2013 Analyst Briefing 25 June 2013
 Cathay Pacific Airways 2013 Analyst Briefing 25 June 2013 Cathay Pacific Airways 2013 Analyst Briefing 25 June 2013 1 Operating Performance The challenging business environment continues into the first
Cathay Pacific Airways
 Cathay Pacific Airways Annual Results for the year ended 31 st December 2011 14 March 2012 1 Annual Result 2011 2010 Change Group attributable profit HK$5,501m HK$14,048m -60.8% Group Turnover HK$98,406m
Cathay Pacific Airways Analyst Briefing. 21 November 2014
 Cathay Pacific Airways Analyst Briefing 21 November 2014 Operating Performance Passenger demand remains strong, although growth in North America is significantly short of increase in capacity. Demand for
Analysts Briefing. 24 June Cathay Pacific Airways Limited
 Analysts Briefing 24 June 2016 Cathay Pacific Airways Limited Operating performance - overview Challenging business environment. Load factor lower than expectations on weakening passenger demand. Strong
Analysts Briefing. 27 November Cathay Pacific Airways Limited
 Analysts Briefing 27 November 2015 Cathay Pacific Airways Limited Operating performance - overview Passenger load factors are high, driven by strong back-end demand. Passenger front-end yield and load
Cathay Pacific Airways
 Cathay Pacific Airways Interim Results for the six months ended 30 th June 2014 13th August 2014 1 Interim Results 1H2014 1H2013 Change Profit attributable to the shareholders of Cathay Pacific HK$ million
Analyst Briefing. 12 June Cathay Pacific Airways Limited
 Analyst Briefing 12 June 2015 Cathay Pacific Airways Limited Operating Performance The positive operating environment continues into the first half of 2015. Robust passenger demand and healthy cargo demand.
Analysts Briefing. 18 March Cathay Pacific Airways Limited
 Analysts Briefing 18 March 2015 Cathay Pacific Airways Limited Annual Results 2014 2013 Change Group attributable profit HK$m 3,150 2,620 +20.2% Group turnover HK$m 105,991 100,484 +5.5% Profit margin
Cathay Pacific Airways Analyst & Investor Briefing June Cathay Pacific Airways Interim Results 6 August 2008
 Cathay Pacific Airways 2010 Analyst & Investor Briefing June 2010 Cathay Pacific Airways 2008 Interim Results 6 August 2008 Airline Strategy Remains largely unchanged Grow our international network, expand
Credit Suisse. 19 th Annual AIC 8 th April Cathay Pacific Airways Limited
 Credit Suisse 19 th Annual AIC 8 th April 2016 Cathay Pacific Airways Limited Annual Results - 2015 Group Financial Statistics 2015 2014 % Var Group Revenue HK$m 102,342 105,991-3.4% Group attributable
Cathay Pacific Airways Cathay Pacific Airways 2008 Annual Results Investor Relations Meeting 11 March June 2009
 Cathay Pacific Airways Cathay Pacific Airways 2008 Annual Results Investor Relations Meeting 11 March 2009 22 June 2009 Airline Strategy Continue to grow our extensive international network, expand frequencies
Cathay Pacific Airways 2011 Interim Results 10 August 2011
 Cathay Pacific Airways 2011 Interim Results 10 August 2011 1 Interim Result 1H 2011 1H 2010 Group profit HK$2,808m HK$6,840m Group turnover HK$46,791 HK$41,337m Profit margin 6.0% 16.5% Return on capital
Cathay Pacific Airways Interim Results 04 August Cathay Pacific Airways Interim Results 6 August 2008
 Cathay Pacific Airways 2010 Interim Results 04 August 2010 Cathay Pacific Airways 2008 Interim Results 6 August 2008 Interim Result 1H 2010 1H 2009 Group Profit/(Loss) HK$6,840m HK$812m Group Turnover
Cathay Pacific Airways 2010 Annual Results 9 March 2011
 Cathay Pacific Airways 2010 Annual Results 9 March 2011 1 Annual Result 2010 2009 Change Group Profit/(Loss) HK$14,048m HK$4,694m +199.3% Group Turnover HK$89,524m HK$66,978m +33.7% Profit Margin 15.7%
Analysts Briefing. 15 March Cathay Pacific Airways Limited
 Analysts Briefing 15 March 2017 Cathay Pacific Airways Limited Annual Results - 2016 Group Financial Statistics 2016 2015 % Var Group Revenue HK$m 92,751 102,342-9.4% Group attributable profit/(loss) Million
Air China Limited Annual Results. March Under IFRS
 Air China Limited 21 Annual Results Under IFRS March 211 Agenda Part 1 Highlights Part 2 Business Overview Part 3 Financial Overview Part 4 Outlook 2 Part 1 Highlights Steady Economic Growth; Asia Pacific
Cathay Pacific Airways Annual Results 10 March Cathay Pacific Airways Interim Results 6 August 2008
 Cathay Pacific Airways 2009 Annual Results 10 March 2010 Cathay Pacific Airways 2008 Interim Results 6 August 2008 Annual Result 2009 2008 (restated) Group Profit/(Loss) HK$4,694m (HK$8,696m) Group Turnover
Air China Limited Interim Results. August Under IFRS
 Air China Limited 21 Interim Results Under IFRS August 21 1 Agenda 21 Interim Results Overview Business Overview Financial Overview Outlook 2 2 2 21 Interim Results 3 21 Interim Results Overview 4 4 4
Air China Limited 2014 Annual Results Under IFRS
 Air China Limited 2014 Annual Results Under IFRS March 2015 Agenda Part 1 Results Highlights Part 2 Business Overview Part 3 Financial Overview Part 4 Outlook Part 1 Results Highlights Gradual Global Economic
Information meeting. 1 st September 2011
 Information meeting 1 st September 2011 Full Year 2010-11 key data April 2010-March 2011 Revenues in billions Operating result in millions 77% Passenger 18.10 +11.3% -44 +874 13% Cargo 3.16 +29.5% +69
14 Swire Pacific 2012 Annual Report
 We aim to continue to improve our products and services on the ground and in the air, to strengthen our aircraft engineering business and to expand our fleet by acquiring fuel efficient aircraft. 14 Swire
Information meeting. 12 September 2011
 Information meeting 12 September 2011 Full Year 2010-11 key data April 2010-March 2011 Revenues in billions Operating result in millions 77% Passenger 18.10 +11.3% -44 +874 13% Cargo 3.16 +29.5% +69 +505
Third Quarter 2014 Results. 29 October 2014
 Third Quarter 2014 Results 29 October 2014 Highlights of the Third Quarter Operating environment Air France-KLM Economic environment remains weak Further currency volatility affecting revenues and results
Cathay Pacific Airways Limited
 Cathay Pacific Airways Limited Stock Code: 00293 2012 Interim Report Hong Kong Cathay Pacific Cathay Pacific Freighter Dragonair Air Hong Kong CONTENTS 2 Financial and Operating Highlights 3 Chairman s
Information meeting. September 2011
 Information meeting September 2011 Full Year 2010-11 key data April 2010-March 2011 Revenues in billions Operating result in millions 77% Passenger 18.10 +11.3% -44 +874 13% Cargo 3.16 +29.5% +69 +505
The Accounting Case Competition for Secondary Schools and Tertiary Institutes. Tertiary Institutes Group
 The Accounting Case Competition for Secondary Schools and Tertiary Institutes 2004 Time allowed 2 hours Answer ALL the questions Marks Section A 50 Section B 20 Section C 15 Section D 15 100 DO NOT OPEN
Analyst Presentation. 9 th June 2006
 Analyst Presentation 9 th June 2006 1 Existing Principal Shareholding Structure CITIC Pacific 46.30% 25.40% 10.00% 68.36% CNAC(HK) 43.29% 7.71% 17.79% 28.50% Dragonair Source: Announcement on 9 th June
THAI AIRWAYS INTERNATIONAL PCL
 THAI AIRWAYS INTERNATIONAL PCL 2Q2017 analysts briefing 16-Aug-2017 1 DISCLAIMER The information contained herein is intended to represent the Company s operating and financial position at a given point
Part 1 Performance Highlights. Part 2 Business Overview. Part 3 Financial Review
 August 216 1 Part 1 Performance Highlights Part 2 Business Overview Part 3 Financial Review Part 4 Outlook 2 Under IFRS 3 Part 1 Performance Highlights Performance Highlights - Key Operational Metrics
SAS Group Presentation Carnegie, May 22, 2012 Sture Stölen, Head of IR
 SAS Group Presentation Carnegie, May 22, 2012 Sture Stölen, Head of IR 1 This is the SAS Group 128 destinations 27,2 million passengers 28 new routes to be launched 2012 1,085 daily flights Revenues 2011,
AIR FRANCE-KLM RESULTS PRESENTATION
 AIR FRANCE-KLM RESULTS PRESENTATION Results as at 30 th of June 2018 1 st August 2018 SECOND QUARTER 2018: KEY HIGHLIGHTS Leveraging ongoing solid demand +0.8% +1.7% Stable operating result before strike
Analysts and Investors conference call. Q results. 15 May 2013
 Analysts and Investors conference call Q1 2013 results 15 May 2013 Management summary Key messages of Q1 2013 +6% +9% +3.3%p. Q1 2013 operational KPIs are in line with 109.7 116.2 6.5 7.1 82.3 85.6 expectations,
2007/08 Full Year Results Investor Briefing
 2007/08 Full Year Results Investor Briefing Highlights of Result Profit before tax up 46% to $1,408 million Up 36% on the reported result Margin improvement $3 billion of Sustainable Future Benefits achieved
2012 Result. Mika Vehviläinen CEO
 2012 Result Mika Vehviläinen CEO 1 Agenda Market environment in Q4 Business performance and strategy execution Outlook Financials 2 Market Environment According to IATA, Global air travel continues to
Thank you for participating in the financial results for fiscal 2014.
 Thank you for participating in the financial results for fiscal 2014. ANA HOLDINGS strongly believes that safety is the most important principle of our air transportation business. The expansion of slots
SIA ANALYST/MEDIA BRIEFING Q2 and 1H FY17/18 Results 8 November 2017
 SIA ANALYST/MEDIA BRIEFING Q2 and 1H FY17/18 Results 8 November 2017 THE PARENT AIRLINE Q2 AND 1H FY17/18 RESULTS THE PARENT AIRLINE COMPANY OPERATING PERFORMANCE Q2 % 1H % FY17/18 Change FY17/18 Change
CATHAY PACIFIC AIRWAYS LIMITED (Incorporated in Hong Kong with limited liability)
") Hong Kong Exchanges and Clearing Limited and The Stock Exchange of Hong Kong Limited take no responsibility for the contents of this announcement, make no representation as to its accuracy or completeness
Hong Kong Exchanges and Clearing Limited and The Stock Exchange of Hong Kong Limited take no responsibility for the contents of this announcement, make no representation as to its accuracy or completeness
Air China Limited Announces 2010 Annual Results
 Air China Limited Announces 2010 Annual Results Profit reaches record high on strong economic growth Hong Kong March 29, 2011 Air China Limited ( Air China or the Company, together with its subsidiaries,
First Half 2013 Results. 16 mai 2013
 First Half 2013 Results 16 mai 2013 26 July 2013 Results Increasing effects of Transform 2015 Highlights of the First Half A difficult global economic environment Transform 2015 plan roll-out on track
Singapore Airlines Group Analyst/Media Briefing HALF YEAR FY RESULTS 5 NOVEMBER 2012 THE PARENT AIRLINE 1H FY2012/13 RESULTS
 Singapore Airlines Group Analyst/Media Briefing HALF YEAR FY2012-13 13 RESULTS 5 NOVEMBER 2012 THE PARENT AIRLINE 1H FY2012/13 RESULTS THE PARENT AIRLINE COMPANY RESULTS 2Q & 1H FY12/13 2Q/12 $million
Navigating through Turbulence. Andrew Herdman AAPA Director General IFSA ITCA WAEA Asia Pacific Conference Kuala Lumpur Malaysia, 29 April 2009
 Asia Pacific Aviation Navigating through Turbulence Andrew Herdman AAPA Director General IFSA ITCA WAEA Asia Pacific Conference Kuala Lumpur Malaysia, 29 April 2009 Presentation Outline Asia Pacific Aviation
AIR NEW ZEALAND ANNUAL RESULTS ANNUAL RESULTS
 AIR NEW ZEALAND ANNUAL RESULTS 2008 1 HIGHLIGHTS Record operating revenue, up 9% Normalised earnings* $197m Net cash position of $1.3bn Launched direct service to Vancouver and Beijing Award winning product
THIRD QUARTER NET PROFIT OF $397 MILLION ON RECORD REVENUE
 THIRD QUARTER NET PROFIT OF $397 MILLION ON RECORD REVENUE HIGHLIGHTS OF THE GROUP S PERFORMANCE 3rd Quarter 2005-06 9 Months 2005-06 Year-on-Year Apr-Dec % Change 2005 Oct-Dec 2005 Year-on-Year % Change
Overview. > Normalised earnings* before taxation of, up 30% > Statutory earnings before taxation of, up 40% > Statutory net profit after taxation of
 1 Overview > Normalised earnings* before taxation of, up 30% > Statutory earnings before taxation of, up 40% > Statutory net profit after taxation of > Operating revenue of > Strong operating cash flow
Singapore Airlines Group Analyst/Media Briefing HALF YEAR FY RESULTS. 13 November 2013 THE PARENT AIRLINE 1H FY2013/14 RESULTS
 Singapore Airlines Group Analyst/Media Briefing HALF YEAR FY2013-14 14 RESULTS 13 November 2013 THE PARENT AIRLINE 1H FY2013/14 RESULTS THE PARENT AIRLINE COMPANY RESULTS 2Q & 1H FY13/14 2Q/13 $million
Information meeting. Third quarter results. March 2011
 Information meeting Third quarter 2010-11 results 1 March 2011 Agenda 2010-11: recovery in activity and return to profitability Current issues Air France-KLM ambitions for the next three years 2 All businesses
Bank of America Merrill Lynch 2018 Emerging Markets Corporate Credit Conference. Miami, May 2018
 Bank of America Merrill Lynch 2018 Emerging Markets Corporate Credit Conference Miami, May 2018 This presentation may include forward-looking comments regarding the Company s business outlook and anticipated
FY key data Passenger. Cargo. Maintenance. Other. Operating result in m. Revenues in bn -10.4% 78% 11%
 Information meeting FY 2009-10 key data Revenues in bn Operating result in m 78% Passenger 16.3-13.6% -918 11% Cargo 2.4-27.8% -436 5% Maintenance 1.0-4.0% +81 6% Other 1.3-12 -10.4% 2 Our industry is
Finnair 2015 kolmannen vuosineljänneksen tulos
 Finnair 215 kolmannen vuosineljänneksen tulos Q3 Result 215 3 October 215 3.1.215 Toimitusjohtaja Pekka Vauramo Talousjohtaja Pekka Vähähyyppä 1 Highlights of the quarter Excellent Q3 result: Record result
Cathay Pacific Vantage Pass 2019
 Cathay Pacific Vantage Pass 2019 1. Select the destination for your first round-trip ticket. Note the distance zone, preferred class and fare. 2. Select the destination for your second round-trip ticket.
Air China Limited Announces 2009 Annual Results
 Air China Limited Announces 2009 Annual Results Record Operating Profit in Complex Market Environment Strengthened Position to Capture Growth Opportunities Hong Kong April 22, 2010 Air China Limited (
FIRST QUARTER OPERATING PROFIT IMPROVES TO $274 MILLION
 1 August 2006 Page 1 of 4 No. 03/06 1 August 2006 FIRST QUARTER OPERATING PROFIT IMPROVES TO $274 MILLION HIGHLIGHTS OF THE GROUP S PERFORMANCE 1st Quarter 2006-07 Year-on-Year % Change Operating revenue
Financial Results 3 rd Quarter MAR/2016 (FY2015)
") Financial Results MAR/2016 (FY2015) January 29 th, 2016 CONTENTS P.1 P.2 P.3 P.4~ Overview of FY MAR/16 Results Operating Revenue Operating Profit 1,030 1,020 1,010 +1.0Bn 1,022.3 1,023.4 (+0.1%) 180 160
Financial Results MAR/2016 (FY2015) January 29 th, 2016 CONTENTS P.1 P.2 P.3 P.4~ Overview of FY MAR/16 Results Operating Revenue Operating Profit 1,030 1,020 1,010 +1.0Bn 1,022.3 1,023.4 (+0.1%) 180 160
Finnair Group Interim Report 1 January 31 March 2008
 Finnair Group Interim Report 1 January 31 March 2008 1 29/04/2008 Presentation name / Author Outlook for the industry less positive Growth of demand declining due to uncertainty of global economy Growth
Finnair Group Interim Report 1 January 30 June 2008
 Finnair Group Interim Report 1 January 30 June 2008 1 08/08/2008 Presentation name / Author Airline industry at a historical turning point Fuel price has a stranglehold on the business Average ticket prices
CORPORATE STEVE BOOKING SMITH CHANNELS
 JAPAN AIRLINES: NAVIGATING THE FUTURE Steve Myer, Tokyo September 30, 2016 CORPORATE STEVE BOOKING SMITH CHANNELS VICE PRESIDENT, GLOBAL & STRATEGIC SALES, THE AMERICAS SEPTEMBER 20, 2016 RENO, NEVADA
ANA Group Announces Its Fiscal Year 2019 Flight Schedule
 ANA NEWS ANA Group Announces Its Fiscal Year Flight Schedule ANA plans to accelerate growth by expanding its international network. New state-of-the-art aircraft will be introduced to further improve passenger
RECORD REVENUE AND EFFICIENCY DRIVE SOFTEN IMPACT OF HIGH FUEL COST, ENABLE HALF YEAR PROFIT OF $578 MILLION
 RECORD REVENUE AND EFFICIENCY DRIVE SOFTEN IMPACT OF HIGH FUEL COST, ENABLE HALF YEAR PROFIT OF $578 MILLION HIGHLIGHTS OF THE GROUP S PERFORMANCE First Half 2005-06 2nd Quarter 2005-06 Apr-Sep 2005 Year-on-Year
Air China Limited Announces 2010 Interim Results
 Air China Limited Announces 2010 Interim Results Record High First Half Results Leveraging New Opportunities to Drive Growth Hong Kong August 25, 2010 Air China Limited ( Air China or the Company, together
CATHAY PACIFIC AIRWAYS LIMITED (Incorporated in Hong Kong with limited liability) (Stock Code: 00293)
 (Stock Code: 00293)") Hong Kong Exchanges and Clearing Limited and The Stock Exchange of Hong Kong Limited take no responsibility for the contents of this announcement, make no representation as to its accuracy or completeness
Hong Kong Exchanges and Clearing Limited and The Stock Exchange of Hong Kong Limited take no responsibility for the contents of this announcement, make no representation as to its accuracy or completeness
JAPAN AIRLINES Financial Results 2 nd Quarter Mar / 2014 (FY2013)
") JAPAN AIRLINES Financial Results 2 nd Quarter Mar / 2014 (FY2013) Yoshiharu Ueki, President Norikazu Saito, Managing Executive Officer 31 October, 2013 Contents P.2 P.3 P.4 P.6 1 Overview of 2 nd Quarter
JAPAN AIRLINES Financial Results 2 nd Quarter Mar / 2014 (FY2013) Yoshiharu Ueki, President Norikazu Saito, Managing Executive Officer 31 October, 2013 Contents P.2 P.3 P.4 P.6 1 Overview of 2 nd Quarter
JET AIRWAYS (I) LTD. Presentation on Financial Results Q July 24, 2009
 LTD. Presentation on Financial Results Q July 24, 2009") JET AIRWAYS (I) LTD Presentation on Financial Results Q1 2010 July 24, 2009 1 1 1 Agenda Domestic operating environment Jet Airways performance highlights JetLite performance highlights Outlook 2 2 2 Domestic
JET AIRWAYS (I) LTD Presentation on Financial Results Q1 2010 July 24, 2009 1 1 1 Agenda Domestic operating environment Jet Airways performance highlights JetLite performance highlights Outlook 2 2 2 Domestic
JAPAN AIRLINES Co., Ltd. Financial Results 1 st Quarter Mar/2017(FY2016) July 29, 2016
 July 29, 2016") JAPAN AIRLINES Co., Ltd. Financial Results Mar/2017(FY2016) July 29, 2016 Today s Topics P.1 P.2 P.13 From the first quarter of this fiscal year, figures for Revenue Passengers Carried, ASK, RPK and Load
JAPAN AIRLINES Co., Ltd. Financial Results Mar/2017(FY2016) July 29, 2016 Today s Topics P.1 P.2 P.13 From the first quarter of this fiscal year, figures for Revenue Passengers Carried, ASK, RPK and Load
Information meeting. Full Year results. June 2011
 Information meeting Full Year 2010-11 results 1 June 2011 Agenda 2010-11: Recovery in activity and return to profitability 2011: Ongoing actions and reinforced strategic advantages 2 2010-11: Strong improvement
Cathay Pacific is committed to building its network and connectivity and so to strengthen Hong Kong s position as a major aviation hub.
 Connecting Worlds together 26 Swire Pacific Annual Report 2010 Cathay Pacific is committed to building its network and connectivity and so to strengthen Hong Kong s position as a major aviation hub. Swire
Third Quarter Results
 1 Third Quarter 2010-11 Results Highlights of the Third Quarter Passenger business affected by significant disruptions Dynamic cargo activity Strong improvement in results Decline in ex-fuel unit costs
Air China Limited 2015 First Quarter Results
 Air China Limited 2015 First Quarter Results April 2015 Under PRC GAAP, unaudited Agenda Part 1 Part 2 Part 3 Results Highlights Business Performance Financial Review Part 1 Results Highlights Results
Financial Results 1 st Quarter Mar/2016 (FY2015) 30 July, 2015
 30 July, 2015") Financial Results Mar/2016 (FY2015) 30 July, 2015 Today s Topics P.2 P.3 P.15 1 Overview of FY Mar/2016 Financial Results Operating Revenue Operating Profit 320 307.0 +4.9Bn (+1.6%) 312.0 50 +17.6Bn (+94.6%)
Financial Results Mar/2016 (FY2015) 30 July, 2015 Today s Topics P.2 P.3 P.15 1 Overview of FY Mar/2016 Financial Results Operating Revenue Operating Profit 320 307.0 +4.9Bn (+1.6%) 312.0 50 +17.6Bn (+94.6%)
Full Year 2009 Results
 Full Year 2009 Results 1 Antonio Vázquez Chairman & Chief Executive Officer 2 Highlights 2009 Strong decrease in revenues: weak demand and yield deterioration. High competition and drop of business traffic.
JAPAN AIRLINES Co., Ltd. Financial Results 1 st Quarter Mar/2018(FY2017)
") JAPAN AIRLINES Co., Ltd. Financial Results Mar/2018(FY2017) July 31, 2017 Today s Topics P.1 P.2 P.3 P.4 P.6 P.15 Overview of Financial Results for (FY2017) 1 st quarter resulted in an increase in both
JAPAN AIRLINES Co., Ltd. Financial Results Mar/2018(FY2017) July 31, 2017 Today s Topics P.1 P.2 P.3 P.4 P.6 P.15 Overview of Financial Results for (FY2017) 1 st quarter resulted in an increase in both
SIA GROUP FINANCIAL RESULTS
 FINANCIAL RESULTS For Ended 30 June 2018 197200078R Operating Result Q1 Q1 Better/ FY18/19 FY17/18 R1 (Worse) ($M) ($M) (%) Total Revenue 3,844 3,864 (0.5) Q1 Better/ FY17/18 R2 (Worse) ($M) (%) 3,689
First Quarter Results August 31 st, 2006
 First Quarter Results 2006-07 August 31 st, 2006 Key features of the First Quarter Market context Sustained global economic growth, and a recovery in Europe Average jet fuel price of 691 $/t, up 25% year-on-year
Passenger services 7,438 10,550 Cargo services 4,405 4,225 Catering and other services Turnover 1 12,275 15,511
 Cathay Pacific Airways Limited - 2003 Interim Results Consolidated Profit and Loss Account - Unaudited Six months ended 30th June 2003 2002 Note Passenger services 7,438 10,550 Cargo services 4,405 4,225
Finnair Q Result
 17 August 2016 CEO Pekka Vauramo CFO Pekka Vähähyyppä Finnair Q2 2016 Result 1 Highlights of the second quarter The seventh consecutive quarter of profit improvement Fukuoka & Guangzhou route openings
Airline industry outlook remains fragile
 Airline industry outlook remains fragile June 2009 www.iata.org/economics To represent, lead and serve the airline industry Airline industry outlook remains fragile Green shoots starting to appear Recovery
FIRST QUARTER 2017 RESULTS. 4 May 2017
 FIRST QUARTER 2017 RESULTS 4 May 2017 A resilient start of the year, traffic up 4.2% 20.9 million passengers carried, up 5.2%, traffic (RPK) up 4.2%, capacity (ASK) up 3.3% and load factor up 0.7pts Confirmation
Forward looking statements
 Forward looking statements This presentation contains forward-looking statements. Forward-looking statements often include words such as anticipate", "expect", "intend", "plan", "believe, continue or similar
Air Berlin PLC AGM 06 June 2013 London
 Air Berlin PLC AGM 06 June 2013 London airberlin a strong European carrier Market position as of 31 December 2012 No. 2 in core market: Germany / Austria / Switzerland No. 7 in Europe with 33.3 m guests
2014 Annual Results 1
 1 2014 Annual Results Annual Results 2014 2013 Change HK$M HK$M Attributable profit 573 625-8.3% Revenue 11,927 7,387 +61.5% Earnings per share (HK$) 3.45 3.76-8.3% Total dividends per share (HK$) 2.10
Leaving the Competition Behind. Second Quarter (Apr-Jun) 2009 Results
 2009 Results") Leaving the Competition Behind Second Quarter (Apr-Jun) 2009 Results 12 Aug 2009 1 Disclaimer Information contained in our presentation is intended solely for your reference. Such information is subject
Leaving the Competition Behind Second Quarter (Apr-Jun) 2009 Results 12 Aug 2009 1 Disclaimer Information contained in our presentation is intended solely for your reference. Such information is subject
Fourth Quarter and Full Year 2011 Results Presentation. February 1, 2012
 Fourth Quarter and Full Year 2011 Results Presentation February 1, 2012 This presentation may include forward-looking comments regarding the Company s business outlook and anticipated financial and operating
SAS Group Asia Tour Financial Hearing Presentation May 14, 2012
 SAS Group Asia Tour Financial Hearing Presentation May 14, 2012 1 This is the SAS Group 128 destinations 27,2 million passengers 28 new routes to be launched 2012 1,085 daily flights Revenues 2011, MSEK
INVESTOR PRESENTATION. Imperial Capital Global Opportunities Conference September 2015
 INVESTOR PRESENTATION Imperial Capital Global Opportunities Conference September 2015 Forward-looking Statements This presentation contains forward-looking statements within the meaning of the Private
Cathay Pacific Airways Limited Stock Code: Annual Report 2012
 Cathay Pacific Airways Limited Stock Code: 00293 Annual Report Hong Kong Contents 2 Financial and Operating Highlights 3 Chairman s Letter 5 in Review 16 Review of Operations 24 Financial Review 32 Directors
CONSOLIDATED PROFIT AND LOSS ACCOUNT
 CONSOLIDATED PROFIT AND LOSS ACCOUNT for the year ended 31st December Turnover Note Passenger services 26,407 18,663 Cargo services 11,395 9,913 Catering and other services 1,263 1,002 Total turnover 1
Advancing World-Class Service
 Aviation Division Advancing World-Class Service We aim to continue to improve our products and services on the ground and in the air, to strengthen our aircraft engineering business and to expand our fleet
Finnair Group Annual Report 1 January 31 December 2006
 Finnair Group Annual Report 1 January 31 December 2006 2006: A year for restructuring Scheduled Passenger Traffic transforming to meet Asian traffic demands Labour negotiations to cut 670 jobs 80 million
PROFIT OF $1.24b ON STRONG REVENUE GAINS BUT FUEL COSTS REMAIN GREATEST CHALLENGE
 PROFIT OF $1.24b ON STRONG REVENUE GAINS BUT FUEL COSTS REMAIN GREATEST CHALLENGE HIGHLIGHTS OF THE GROUP S PERFORMANCE Financial Year 2005-06 4th Quarter 2005-06 Apr 2005 Mar 2006 Year-on-Year % Change
SAS AB Analyst meeting
 SAS AB Analyst meeting London, August 9, 2001 2 2nd Quarter a tough Quarter The Marketplace Continued weak world economy Weaker Swedish economy SAS Weaker traffic growth and reduced passenger load factors
THAI AIRWAYS INTERNATIONAL PCL
 THAI AIRWAYS INTERNATIONAL PCL 1-March-2016 1 DISCLAIMER The information contained herein is intended to represent the Company s operating and financial position at a given point in time and may also contain
FIRST QUARTER OPERATING PROFIT IMPROVES 69% TO $463 MILLION
 FIRST QUARTER OPERATING PROFIT IMPROVES 69% TO $463 MILLION PARENT AIRLINE OPERATIONS DRIVE GROUP OPERATING PROFIT The Group made an operating profit of $463 million for the first quarter of 2007-08; an
Media Release. Qantas Group Full Year 2017 Financial Result 1. Sydney, 25 August 2017
 Media Release Qantas Group Full Year 2017 Financial Result 1 Sydney, 25 August 2017 Underlying Profit Before Tax: $1,401 million (second highest in Qantas history) Statutory Profit Before Tax: $1,181 million
September 2010 Brian Pearce To represent, lead and serve the airline industry
 Cycle turns up but risks and structural challenges remain September 2010 Brian Pearce www.iata.org/economics To represent, lead and serve the airline industry Confidence was still high in July survey Airline
Cebu Air, Inc. 4 th Quarter and Full Year 2017 Results of Operations. cebupacificair.com
 Cebu Air, Inc. 4 th Quarter and Full Year 2017 Results of Operations cebupacificair.com Disclaimer The information provided in this presentation is provided only for your reference. Such information has
FY 2013 and Q results. Increasing effects of Transform 2015
 FY 2013 and Q1 2014 results Increasing effects of Transform 2015 Key data FY 13 Change (1) Q1-14 Change (2) Revenue ( bn) 25.52 +2,3% (3) 5.55 +0.0% (4) EBITDA (5) ( m) 1,855 +461m -50 +66m Operating result
Analyst Briefing Quarter 3/2012
 http://www.thaiairways.com/about-thai/investor-relations/en/investor.html THAI AIRWAYS INTERNATIONAL PCL Analyst Briefing Quarter 3/2012 1 Investor Relations Department DISCLAIMER The information contained