Analysts Briefing. 27 November Cathay Pacific Airways Limited
|
|
|
- Collin McCarthy
- 5 years ago
- Views:
Transcription


1 Analysts Briefing 27 November 2015 Cathay Pacific Airways Limited

2 Operating performance - overview Passenger load factors are high, driven by strong back-end demand. Passenger front-end yield and load factor is lower than expectations. The cargo market remains weak. We continue to benefit from lower net fuel costs. Strong performance from our share in associate companies. Increasing air traffic control and congestion issues in our home hub.

3 Passenger Services
 Introduction of new routes. Increased frequency on some existing routes.")
4 Operating performance - Passenger High passenger load factors Strong back-end demand. Front-end lower than expectations. Yields remain under pressure Significant reduction in fuel surcharges. Strong competition. Negative impact on currency movements. Increased capacity (ASK) Introduction of new routes. Increased frequency on some existing routes. Year to Q Year to Q % Var ASK Million 106, , % Passengers carried ,509 23, % Passenger load factor % %
5 Passenger Load Factors 90.0% 88.0% 86.0% 84.0% 82.0% 80.0% 78.0% 76.0% 74.0% 72.0% 70.0% JAN FEB MAR APR MAY JUN JUL AUG SEP OCT NOV DEC

6 Operating performance Regions Sept YTD performance vs 2014 Europe ASK: +10.9% LF: +0.6%pt North Asia ASK: +2.3% LF: +2.8%pt North America ASK: +6.0% LF: +0.9%pt India, Middle East, Pakistan & Sri Lanka ASK: -7.4% LF: +4.0%pt Southeast Asia ASK: +13.3% LF: +2.7%pt Southwest Pacific & South Africa ASK: +7.2% LF: +3.5%pt

7 Network Development Cathay Pacific 2015 March May June Sept Oct Nov Introduced a daily service to Zurich. Introduced a 4-times-weekly service to Boston. Increased services to San Francisco to 17 flights per week. Introduced a 4-times-weekly service to Dusseldorf. Announcement of a 4-times-weekly service to Madrid to commence from June Increased to a daily direct service to Colombo. Increased services to Ho Chi Minh City to 18 flights per week.

8 Network Development - Dragonair 2015 March May August Nov Launched a daily service to Haneda in Tokyo. Increased service to Kolkata to six flights per week. Launched a twice weekly service to Hiroshima. Increased service to Shanghai Hongqiao to nine flights per week.

9 Cargo Services
 Million 22,302 20,904 +6.")
10 Operating performance Cargo Increased capacity Load factor remains flat. Yields remain under pressure Strong competition. Significant reduction in fuel surcharge collection. Unfavourable currency movements. Over-capacity in the air cargo market. Traditional Q4 peak expected Year to Q Year to Q % Var Cargo capacity (ATK) Million 22,302 20, % Cargo & mail carried Cargo & mail load factor 000 tonnes 1,315 1, % %
11 Operating performance Cargo Load Factors 70.0% 68.0% 66.0% 64.0% 62.0% 60.0% 58.0% 56.0% 54.0% Jan Feb Mar Apr May Jun Jul Aug Sep Oct Nov Dec

12 Network Development - Cargo 2015 March Introduced a twice-weekly freighter service to Kolkata. April Added two additional services to North America to become 37 weekly flights.
13 Fuel
14 Fuel Hedging - Fuel prices 150 USD/Bbl - Brent- Daily Closing Price and 250 Day Simple Moving Average Brent Daily Close Brent 250 Day SMA
15 Fuel Hedging Fuel hedging coverage (as at 31 Oct 2015) 70% 60% 50% 40% 30% 20% 10% 0% $50 $60 $70 $80 $90 $100 $110 $120 $130 Brent (US$/barrel) Nov-Dec H 2019
16 Fuel Hedging - Fuel prices USD/BBL CX Jet Cost and Calculated CX Brent Price Jet Actual Cost Calculated CX Brent Price Brent Daily Spot Note: Jet Actual Cost is net of 3 rd party handling charges Calculated CX Brent Price = Jet Actual Cost minus Crack, where Crack is assumed based on prior-month Sing Jet- Brent Crack
17 Revenue mix by currency 90,000 Total foreign currency revenue in 2014: 51% 80,000 70,000 60,000 50,000 40,000 30,000 20,000 10, YTD Jun Others IDR SGD THB PHP MYR 2015 NZD AED KRW INR CAD GBP JPY TWD AUD EUR RMB USD & HKD 17
18 Revenue mix by currency YTD June 2015 FY % CAD GBP 2% 4% EUR 4% JPY INR 2% Others 10% HKD 33% GBP 4% JPY 4% TWD 4% INR 2% CAD 3% Others 9% HKD 33% TWD 5% EUR 5% AUD 6% AUD 6% RMB 14% USD 17% RMB 14% USD 16% 18
19 Foreign Currency Movements 8 Biggest From 1 st Jan to 30 th Oct 2015 From 1 st Jan to 31 st Dec 2014 RMB -1.74% -2.42% AUD % -8.00% EUR -9.07% % TWD -2.95% -5.77% JPY -0.73% % GBP -1.01% -5.97% CAD % -8.41% INR -2.93% -1.81% 16

20 Fleet Profile
21 CX and KA Fleet Profile In operations Parked Passenger Freighter Total Passenger Freighter Total 1 Jan New deliveries Return to lessors Parked aircraft (1) (1) Deregistered (8) - (8) - (1) (1) 31 October
22 CX Fleet Profile as at 31 Oct 2015 Aircraft type (includes parked aircraft) Owned Finance Leased Operating Leased Total A A F BCF ERF F ER Total
 3 747-400ERF 6-6 747-400BCF 1-1 747-8F 13-13 Total")
23 CX Cargo Fleet Profile as at 31 Oct 2015 Aircraft type Number Parked In operations F 4 (1) ERF BCF F Total 24 (1) 23
24 KA Fleet Profile as at 31 Oct 2015 Aircraft type Owned Finance Leased Operating Leased Total A A A Total
25 Aircraft Delivery & Retirement Plans Deliveries Aircraft type >2021 Total B747-8F 1 1 A A B ER 0 B777-9X Total Retirements B744 - As at 31 October 2015 Exit date Number Remaining A340 - As at 31 October 2015 Exit date Number Remaining By end of

26 Subsidiaries & Associates
27 Associates Air China Cathay Pacific has a 20.13% interest in Air China. Profits from Air China have increased significantly in 2015 compared to the same period in 2014 due to: Significant decrease in fuel prices. increase in revenue from an increase in demand. Positive profit alert of the results for the first three quarters of 2015 was issued in October. Air China Cargo Improved results in a weak market. We account for Air China s results three months in arrears, but Air China Cargo on actual. The impact of the devaluation of the RMB in August on Air China will be recognised in our November accounts. As disclosed in the Air China 2014 Annual Report, a 1% movement in RMB will lead to a RMB466m impact on the P&L. An unfavourable movement in RMB will have an unfavourable impact on the P&L, and vice versa on both companies.


28 Major Subsidiaries AHK Air Hong Kong Capacity and load factor increased marginally compared with the same period in Revenue tonne kilometres increased by 2%. Higher profit in the first half of 2015 compared to first half of Cathay Pacific Catering Services Growth in the number of meals produced. Lower turnover and profit in the first half of 2015 compared to first half of Asia Miles Membership has hit 8 million worldwide. 11% increase in redemptions by Asia Miles members in the first half of 2015 compared to the same period last year. More than 90% of Cathay Pacific and Dragonair flights carry passengers who have redeemed frequent flyer miles through the Asia Miles programme. Cathay Pacific Services Limited (Cargo Terminal) Improved results in the first half of 2015 compared to first half of This reflects some additional customers and tighter management of operating costs.

29 Our Products / Services Cathay Pacific Airways Limited

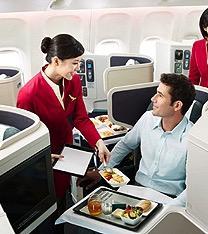
30 The Pier First Class Lounge Reopened June 2015

31 Manila, Bangkok and Taipei Lounges Opened from May - November 2015

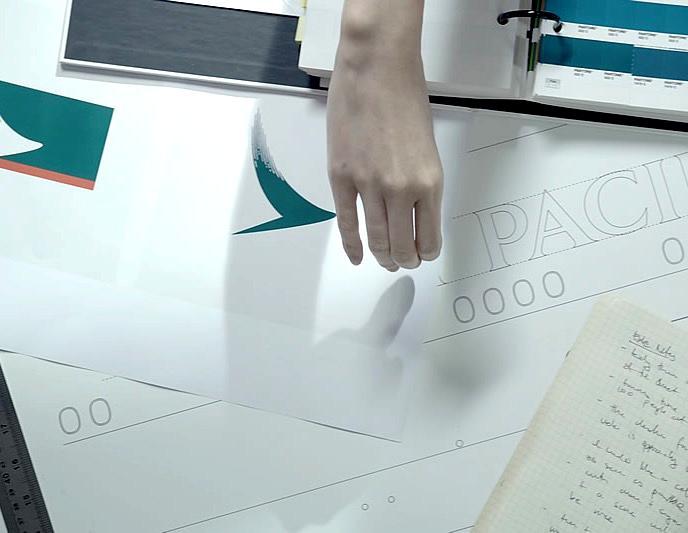
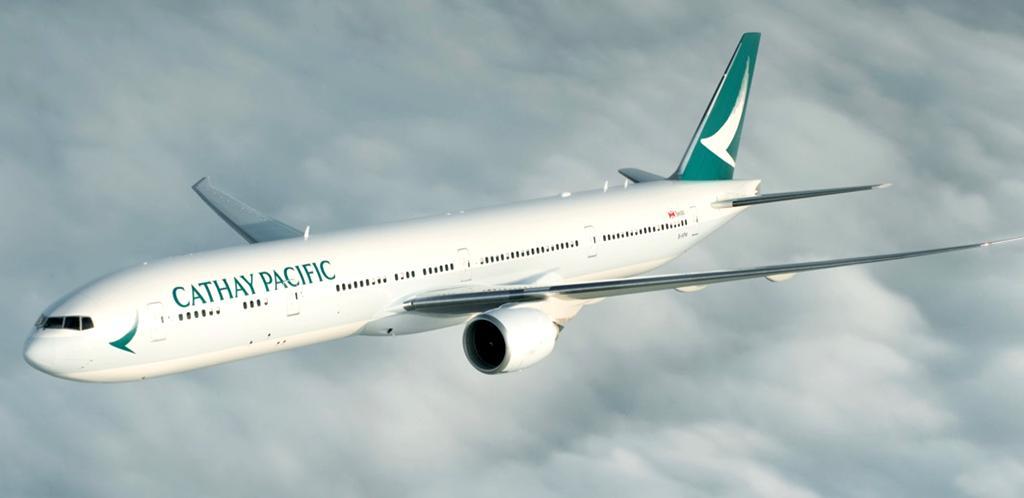
32 New livery

33


34 Life Well Travelled

35 Technology


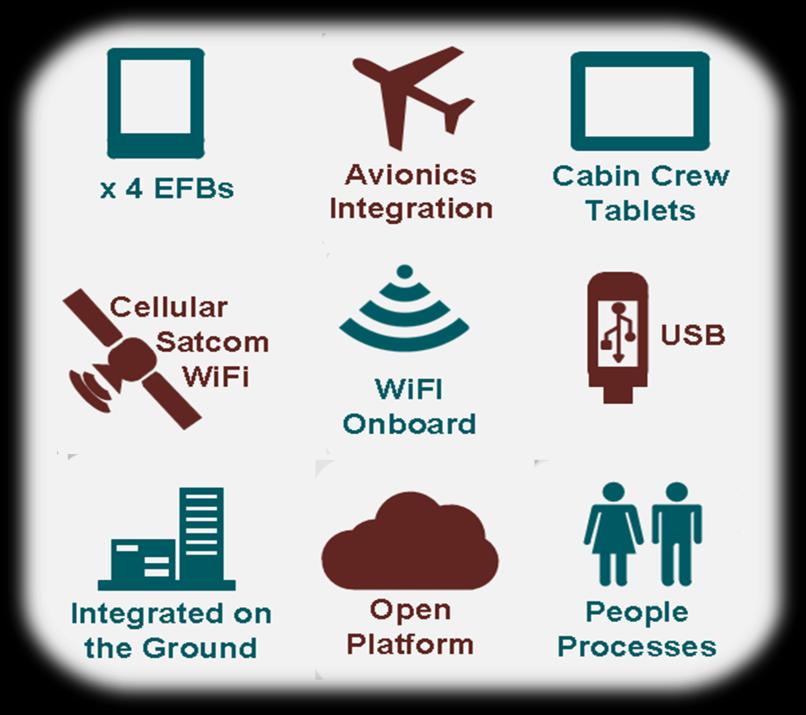
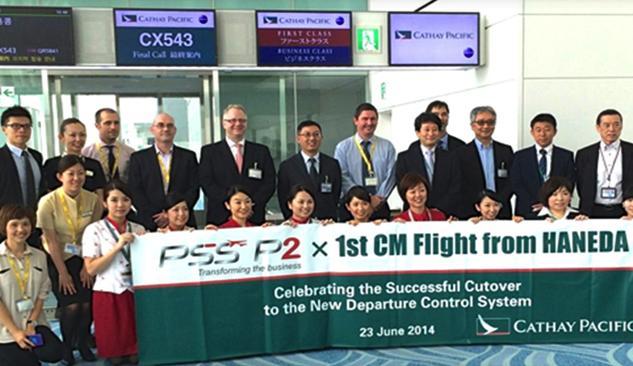
36 Mobile boarding pass Cargo mobile applications E-enabled aircraft Passenger reservation system


37 Information Technology systems Mobile Apps Cargo Services System Integrated Catering Solutions (ICATS) Integrated Channel Experience E-enabled aircraft


38 Cathay Best Transpacific Airline Skytrax World Airline Awards 2015 Dragonair World s Best Regional Airline Best Regional Airline in Asia Skytrax World Airline Awards 2015 Best Frequent flyer programme. Business Traveller Asia- Pacific Awards 2015 Cathay Pacific Cargo Best Airline - Asia-Pacific Cargo of the Year Awards 2015 Best airline lounge Asia Pacific. Business Traveller Asia- Pacific Awards 2015

39 2015 Outlook Remain positive about the overall improvement in our business in Demand in the back-end continues to remain strong. Front-end demand and yield under pressure. The cargo business remains weak. We continue to benefit from lower net fuel prices, partially offset by adverse currency movements. Air China continues to perform well. Congestion and operational issues in our home hub remains a challenge.
40 Q&A For more information, please visit our website


41
Analysts Briefing. 24 June Cathay Pacific Airways Limited
 Analysts Briefing 24 June 2016 Cathay Pacific Airways Limited Operating performance - overview Challenging business environment. Load factor lower than expectations on weakening passenger demand. Strong
Credit Suisse. 19 th Annual AIC 8 th April Cathay Pacific Airways Limited
 Credit Suisse 19 th Annual AIC 8 th April 2016 Cathay Pacific Airways Limited Annual Results - 2015 Group Financial Statistics 2015 2014 % Var Group Revenue HK$m 102,342 105,991-3.4% Group attributable
Analyst Briefing. 12 June Cathay Pacific Airways Limited
 Analyst Briefing 12 June 2015 Cathay Pacific Airways Limited Operating Performance The positive operating environment continues into the first half of 2015. Robust passenger demand and healthy cargo demand.
Cathay Pacific Airways Analyst Briefing. 21 November 2014
 Cathay Pacific Airways Analyst Briefing 21 November 2014 Operating Performance Passenger demand remains strong, although growth in North America is significantly short of increase in capacity. Demand for
Analysts Briefing. 18 March Cathay Pacific Airways Limited
 Analysts Briefing 18 March 2015 Cathay Pacific Airways Limited Annual Results 2014 2013 Change Group attributable profit HK$m 3,150 2,620 +20.2% Group turnover HK$m 105,991 100,484 +5.5% Profit margin
Cathay Pacific Airways 2013 Analyst Briefing 25 June Cathay Pacific Airways Analyst Briefing 27 November 2013
 Cathay Pacific Airways 2013 Analyst Briefing 25 June 2013 Cathay Pacific Airways Analyst Briefing 27 November 2013 2013 Operating Performance to date: Passenger yield and load factor growth on lower ASKs.
Cathay Pacific Airways 2012 Analyst Briefing 28 June 2012
 Cathay Pacific Airways 2012 Analyst Briefing 28 June 2012 1 Airline Strategy Grow our international network, expand frequencies and further develop Hong Kong as one of the world s leading aviation hubs
Cathay Pacific Airways Analyst Briefing 27 November 2012
 Cathay Pacific Airways Analyst Briefing 27 November 2012 1 Trading Statement 2012 A very challenging year High fuel prices Soft premium demand High competition in Economy Class putting pressure on yield
Cathay Pacific Airways
 Cathay Pacific Airways Interim Results for the six months ended 30 th June 2014 13th August 2014 1 Interim Results 1H2014 1H2013 Change Profit attributable to the shareholders of Cathay Pacific HK$ million
Cathay Pacific Airways Interim Results for the six months ended 30 June 2012
 Cathay Pacific Airways Interim Results for the six months ended 30 June 2012 8 August 2012 1 Interim Result 1H2012 1H2011 Change Group attributable (loss) / profit HK$ million (935) 2,808-133.3% Group
Cathay Pacific Airways 2011 Analyst Briefing 23 June 2011
 Cathay Pacific Airways 2011 Analyst Briefing 23 June 2011 1 Airline Strategy Grow our international network, expand frequencies and further develop Hong Kong as one of the world s leading aviation hubs
Cathay Pacific Airways 2013 Analyst Briefing 25 June Cathay Pacific Airways 2013 Analyst Briefing 25 June 2013
 Cathay Pacific Airways 2013 Analyst Briefing 25 June 2013 Cathay Pacific Airways 2013 Analyst Briefing 25 June 2013 1 Operating Performance The challenging business environment continues into the first
Analysts Briefing. 15 March Cathay Pacific Airways Limited
 Analysts Briefing 15 March 2017 Cathay Pacific Airways Limited Annual Results - 2016 Group Financial Statistics 2016 2015 % Var Group Revenue HK$m 92,751 102,342-9.4% Group attributable profit/(loss) Million
Cathay Pacific Airways Analyst & Investor Briefing June Cathay Pacific Airways Interim Results 6 August 2008
 Cathay Pacific Airways 2010 Analyst & Investor Briefing June 2010 Cathay Pacific Airways 2008 Interim Results 6 August 2008 Airline Strategy Remains largely unchanged Grow our international network, expand
Cathay Pacific Airways 2010 Annual Results 9 March 2011
 Cathay Pacific Airways 2010 Annual Results 9 March 2011 1 Annual Result 2010 2009 Change Group Profit/(Loss) HK$14,048m HK$4,694m +199.3% Group Turnover HK$89,524m HK$66,978m +33.7% Profit Margin 15.7%
Cathay Pacific Airways
 Cathay Pacific Airways Annual Results for the year ended 31 st December 2011 14 March 2012 1 Annual Result 2011 2010 Change Group attributable profit HK$5,501m HK$14,048m -60.8% Group Turnover HK$98,406m
Cathay Pacific Airways Cathay Pacific Airways 2008 Annual Results Investor Relations Meeting 11 March June 2009
 Cathay Pacific Airways Cathay Pacific Airways 2008 Annual Results Investor Relations Meeting 11 March 2009 22 June 2009 Airline Strategy Continue to grow our extensive international network, expand frequencies
Cathay Pacific Airways Interim Results 04 August Cathay Pacific Airways Interim Results 6 August 2008
 Cathay Pacific Airways 2010 Interim Results 04 August 2010 Cathay Pacific Airways 2008 Interim Results 6 August 2008 Interim Result 1H 2010 1H 2009 Group Profit/(Loss) HK$6,840m HK$812m Group Turnover
Cathay Pacific Airways Annual Results 10 March Cathay Pacific Airways Interim Results 6 August 2008
 Cathay Pacific Airways 2009 Annual Results 10 March 2010 Cathay Pacific Airways 2008 Interim Results 6 August 2008 Annual Result 2009 2008 (restated) Group Profit/(Loss) HK$4,694m (HK$8,696m) Group Turnover
Cathay Pacific Airways 2011 Interim Results 10 August 2011
 Cathay Pacific Airways 2011 Interim Results 10 August 2011 1 Interim Result 1H 2011 1H 2010 Group profit HK$2,808m HK$6,840m Group turnover HK$46,791 HK$41,337m Profit margin 6.0% 16.5% Return on capital
Air China Limited Annual Results. March Under IFRS
 Air China Limited 21 Annual Results Under IFRS March 211 Agenda Part 1 Highlights Part 2 Business Overview Part 3 Financial Overview Part 4 Outlook 2 Part 1 Highlights Steady Economic Growth; Asia Pacific
Air China Limited Interim Results. August Under IFRS
 Air China Limited 21 Interim Results Under IFRS August 21 1 Agenda 21 Interim Results Overview Business Overview Financial Overview Outlook 2 2 2 21 Interim Results 3 21 Interim Results Overview 4 4 4
CONSOLIDATED PROFIT AND LOSS ACCOUNT
 CONSOLIDATED PROFIT AND LOSS ACCOUNT for the year ended 31st December Turnover Note Passenger services 26,407 18,663 Cargo services 11,395 9,913 Catering and other services 1,263 1,002 Total turnover 1
Cathay Pacific is committed to building its network and connectivity and so to strengthen Hong Kong s position as a major aviation hub.
 Connecting Worlds together 26 Swire Pacific Annual Report 2010 Cathay Pacific is committed to building its network and connectivity and so to strengthen Hong Kong s position as a major aviation hub. Swire
SIA GROUP FINANCIAL RESULTS
 FINANCIAL RESULTS For Ended 30 June 2018 197200078R Operating Result Q1 Q1 Better/ FY18/19 FY17/18 R1 (Worse) ($M) ($M) (%) Total Revenue 3,844 3,864 (0.5) Q1 Better/ FY17/18 R2 (Worse) ($M) (%) 3,689
Cathay Pacific Airways Limited Annual Report Stock Code: 293
 Cathay Pacific Airways Limited Annual Report Stock Code: 293 Contents 6 Financial and Operating Highlights 8 Chairman s Letter 10 in Review 18 Review of Operations 23 Sustainable Development Review 28
CATHAY PACIFIC AIRWAYS LIMITED ANNOUNCES 2015 INTERIM RESULTS
 Media Information 19th August 2015 FOR IMMEDIATE RELEASE CATHAY PACIFIC AIRWAYS LIMITED ANNOUNCES 2015 INTERIM RESULTS 1H2015 1H2014 Change Revenue HK$ million 50,388 50,840-0.9% Profit attributable to
Air China Limited 2014 Annual Results Under IFRS
 Air China Limited 2014 Annual Results Under IFRS March 2015 Agenda Part 1 Results Highlights Part 2 Business Overview Part 3 Financial Overview Part 4 Outlook Part 1 Results Highlights Gradual Global Economic
SIA ANALYST/MEDIA BRIEFING Q2 and 1H FY17/18 Results 8 November 2017
 SIA ANALYST/MEDIA BRIEFING Q2 and 1H FY17/18 Results 8 November 2017 THE PARENT AIRLINE Q2 AND 1H FY17/18 RESULTS THE PARENT AIRLINE COMPANY OPERATING PERFORMANCE Q2 % 1H % FY17/18 Change FY17/18 Change
Part 1 Performance Highlights. Part 2 Business Overview. Part 3 Financial Review
 August 216 1 Part 1 Performance Highlights Part 2 Business Overview Part 3 Financial Review Part 4 Outlook 2 Under IFRS 3 Part 1 Performance Highlights Performance Highlights - Key Operational Metrics
Finnair 2015 kolmannen vuosineljänneksen tulos
 Finnair 215 kolmannen vuosineljänneksen tulos Q3 Result 215 3 October 215 3.1.215 Toimitusjohtaja Pekka Vauramo Talousjohtaja Pekka Vähähyyppä 1 Highlights of the quarter Excellent Q3 result: Record result
THAI AIRWAYS INTERNATIONAL PCL
 THAI AIRWAYS INTERNATIONAL PCL 2Q2017 analysts briefing 16-Aug-2017 1 DISCLAIMER The information contained herein is intended to represent the Company s operating and financial position at a given point
JET AIRWAYS (I) LTD. Presentation on Financial Results Q2 FY10
 LTD. Presentation on Financial Results Q2 FY10") JET AIRWAYS (I) LTD Presentation on Financial Results Q2 FY10 October 27, 2009 1 1 1 Agenda Domestic operating environment Jet Airways performance highlights JetLite performance highlights Outlook 2 2
JET AIRWAYS (I) LTD Presentation on Financial Results Q2 FY10 October 27, 2009 1 1 1 Agenda Domestic operating environment Jet Airways performance highlights JetLite performance highlights Outlook 2 2
CORPORATE STEVE BOOKING SMITH CHANNELS
 JAPAN AIRLINES: NAVIGATING THE FUTURE Steve Myer, Tokyo September 30, 2016 CORPORATE STEVE BOOKING SMITH CHANNELS VICE PRESIDENT, GLOBAL & STRATEGIC SALES, THE AMERICAS SEPTEMBER 20, 2016 RENO, NEVADA
Singapore Airlines Group Analyst/Media Briefing HALF YEAR FY RESULTS 5 NOVEMBER 2012 THE PARENT AIRLINE 1H FY2012/13 RESULTS
 Singapore Airlines Group Analyst/Media Briefing HALF YEAR FY2012-13 13 RESULTS 5 NOVEMBER 2012 THE PARENT AIRLINE 1H FY2012/13 RESULTS THE PARENT AIRLINE COMPANY RESULTS 2Q & 1H FY12/13 2Q/12 $million
JET AIRWAYS (I) LTD. Presentation on Financial Results Q July 24, 2009
 LTD. Presentation on Financial Results Q July 24, 2009") JET AIRWAYS (I) LTD Presentation on Financial Results Q1 2010 July 24, 2009 1 1 1 Agenda Domestic operating environment Jet Airways performance highlights JetLite performance highlights Outlook 2 2 2 Domestic
JET AIRWAYS (I) LTD Presentation on Financial Results Q1 2010 July 24, 2009 1 1 1 Agenda Domestic operating environment Jet Airways performance highlights JetLite performance highlights Outlook 2 2 2 Domestic
Singapore Airlines Group Analyst/Media Briefing HALF YEAR FY RESULTS. 13 November 2013 THE PARENT AIRLINE 1H FY2013/14 RESULTS
 Singapore Airlines Group Analyst/Media Briefing HALF YEAR FY2013-14 14 RESULTS 13 November 2013 THE PARENT AIRLINE 1H FY2013/14 RESULTS THE PARENT AIRLINE COMPANY RESULTS 2Q & 1H FY13/14 2Q/13 $million
14 Swire Pacific 2012 Annual Report
 We aim to continue to improve our products and services on the ground and in the air, to strengthen our aircraft engineering business and to expand our fleet by acquiring fuel efficient aircraft. 14 Swire
The Accounting Case Competition for Secondary Schools and Tertiary Institutes. Tertiary Institutes Group
 The Accounting Case Competition for Secondary Schools and Tertiary Institutes 2004 Time allowed 2 hours Answer ALL the questions Marks Section A 50 Section B 20 Section C 15 Section D 15 100 DO NOT OPEN
THE PARENT AIRLINE FY2010/11 RESULTS
 SINGAPORE AIRLINES GROUP ANALYST / MEDIA BRIEFING FY21-11 11 RESULTS 13 MAY 211 THE PARENT AIRLINE FY21/11 RESULTS THE PARENT AIRLINE COMPANY RESULTS FY21/11 4Q/1 $million Better/ (Worse) $million 21/11
12.3million. passengers and 851,000 tonnes of cargo carried by Cathay Pacific in 2002.
 12.3million passengers and 851, tonnes of cargo carried by Cathay Pacific in 22. The three airlines are based in Hong Kong. Cathay Pacific Airways provides international passenger and cargo services. Dragon
AIR NEW ZEALAND ANNUAL RESULTS ANNUAL RESULTS
 AIR NEW ZEALAND ANNUAL RESULTS 2008 1 HIGHLIGHTS Record operating revenue, up 9% Normalised earnings* $197m Net cash position of $1.3bn Launched direct service to Vancouver and Beijing Award winning product
2012 Result. Mika Vehviläinen CEO
 2012 Result Mika Vehviläinen CEO 1 Agenda Market environment in Q4 Business performance and strategy execution Outlook Financials 2 Market Environment According to IATA, Global air travel continues to
Analyst Presentation. 9 th June 2006
 Analyst Presentation 9 th June 2006 1 Existing Principal Shareholding Structure CITIC Pacific 46.30% 25.40% 10.00% 68.36% CNAC(HK) 43.29% 7.71% 17.79% 28.50% Dragonair Source: Announcement on 9 th June
Cathay Pacific Airways Limited
 Cathay Pacific Airways Limited Stock Code: 00293 2012 Interim Report Hong Kong Cathay Pacific Cathay Pacific Freighter Dragonair Air Hong Kong CONTENTS 2 Financial and Operating Highlights 3 Chairman s
FIRST QUARTER OPERATING PROFIT RISES TO $281 MILLION
 27 July 2017 Page 1 of 5 No. 03/17 27 July 2017 FIRST QUARTER OPERATING PROFIT RISES TO $281 MILLION Revenue improvement seen for all SIA Group airlines, but pressure on yields remains Earnings supported
CATHAY PACIFIC AIRWAYS LIMITED (Incorporated in Hong Kong with limited liability) (Stock Code: 00293)
 (Stock Code: 00293)") Hong Kong Exchanges and Clearing Limited and The Stock Exchange of Hong Kong Limited take no responsibility for the contents of this announcement, make no representation as to its accuracy or completeness
Hong Kong Exchanges and Clearing Limited and The Stock Exchange of Hong Kong Limited take no responsibility for the contents of this announcement, make no representation as to its accuracy or completeness
FIRST QUARTER OPERATING PROFIT IMPROVES TO $274 MILLION
 1 August 2006 Page 1 of 4 No. 03/06 1 August 2006 FIRST QUARTER OPERATING PROFIT IMPROVES TO $274 MILLION HIGHLIGHTS OF THE GROUP S PERFORMANCE 1st Quarter 2006-07 Year-on-Year % Change Operating revenue
THIRD QUARTER NET PROFIT OF $397 MILLION ON RECORD REVENUE
 THIRD QUARTER NET PROFIT OF $397 MILLION ON RECORD REVENUE HIGHLIGHTS OF THE GROUP S PERFORMANCE 3rd Quarter 2005-06 9 Months 2005-06 Year-on-Year Apr-Dec % Change 2005 Oct-Dec 2005 Year-on-Year % Change
DTTAS Quarterly Aviation Statistics Snapshot Quarter Report
 Contents DTTAS Quarterly Aviation Statistics Snapshot Quarter 4 2015 Report 1.1 Dublin Airport Key Statistics... 1 1.2 Cork Airport Key Statistics... 3 1.3 Shannon Airport Key Statistics... 5 1.4 Total
CATHAY PACIFIC ANNOUNCES 2014 ANNUAL RESULTS
 Media Information 18 March 2015 FOR IMMEDIATE RELEASE CATHAY PACIFIC ANNOUNCES 2014 ANNUAL RESULTS Results 2014 2013 Change Turnover HK$ million 105,991 100,484 +5.5% Profit attributable to the shareholders
Cathay Pacific Airways Limited. Annual Report Stock Code: 293
 Cathay Pacific Airways Limited Annual Report Stock Code: 293 Contents Management Discussion and Analysis 6 Financial and Operational Highlights 8 Chairman s Letter 10 in Review 18 Review of Operations
Interim Management Report First Half Results 2010/11. October 29, 2010
 Interim Management Report First Half Results 2010/11 October 29, 2010 Disclaimer Certain information included in these statements is forward-looking and involves risks and uncertainties that could cause
CATHAY PACIFIC AIRWAYS LIMITED (Incorporated in Hong Kong with limited liability)
") Hong Kong Exchanges and Clearing Limited and The Stock Exchange of Hong Kong Limited take no responsibility for the contents of this announcement, make no representation as to its accuracy or completeness
Hong Kong Exchanges and Clearing Limited and The Stock Exchange of Hong Kong Limited take no responsibility for the contents of this announcement, make no representation as to its accuracy or completeness
January 2018 Air Traffic Activity Summary
 January 2018 Air Traffic Activity Summary Jan-2018 Jan-2017 CY-2018 CY-2017 Passengers 528,947 505,421 4.7% 528,947 505,421 4.7% Passengers 537,332 515,787 4.2% 537,332 515,787 4.2% Passengers 1,066,279
Industry Update. ACI-NA Winter Board of Directors Meeting February 3, 2016 Orlando, FL
 Industry Update ACI-NA Winter Board of Directors Meeting February 3, 2016 Orlando, FL U.S. & Canadian GDP 8% 6% 4% U.S.* Canada** Estimate by BEA as of 02/11/16 2% 0% -2% -4% -6% -8% -10% The U.S. economy
CATHAY PACIFIC AIRWAYS LIMITED (Incorporated in Hong Kong with limited liability) (Stock Code: 293)
 (Stock Code: 293)") CATHAY PACIFIC AIRWAYS LIMITED (Incorporated in Hong Kong with limited liability) (Stock Code: 293) 2006 Interim Results Financial and Operating Highlights Group Financial Statistics 2006 2005 Change Results
CATHAY PACIFIC AIRWAYS LIMITED (Incorporated in Hong Kong with limited liability) (Stock Code: 293) 2006 Interim Results Financial and Operating Highlights Group Financial Statistics 2006 2005 Change Results
Q Trading update
 Q3 2018 Trading update Q3 performance Overview 1. Strong revenue trend Positive demand across Europe Benign competitor environment Strong ancillary revenue performance 2. Solid underlying cost performance
CATHAY PACIFIC ANNOUNCES 2013 ANNUAL RESULTS
 Media Information 12 March 2014 CATHAY PACIFIC ANNOUNCES 2013 ANNUAL RESULTS Results 2013 2012 (restated) Change Turnover HK$ million 100,484 99,376 +1.1% Profit attributable to the owners of Cathay Pacific
THIRD QUARTER OPERATING PROFIT UP 96%
 4 February 2016 Page 1 of 7 No. 01/16 4 February 2016 THIRD QUARTER OPERATING PROFIT UP 96% Healthy expansion at SilkAir and Scoot Slide in fuel prices provided cost relief to the Group, in a weak yield
Overview. > Normalised earnings* before taxation of, up 30% > Statutory earnings before taxation of, up 40% > Statutory net profit after taxation of
 1 Overview > Normalised earnings* before taxation of, up 30% > Statutory earnings before taxation of, up 40% > Statutory net profit after taxation of > Operating revenue of > Strong operating cash flow
THIRD QUARTER OPERATING PROFIT MARGINALLY UP AT $293 MILLION
 7 February 2017 Page 1 of 6 No. 01/17 7 February 2017 THIRD QUARTER OPERATING PROFIT MARGINALLY UP AT $293 MILLION Fuel cost savings more than offset lower passenger flown revenue stemming from yield erosion
SAS Group Presentation Carnegie, May 22, 2012 Sture Stölen, Head of IR
 SAS Group Presentation Carnegie, May 22, 2012 Sture Stölen, Head of IR 1 This is the SAS Group 128 destinations 27,2 million passengers 28 new routes to be launched 2012 1,085 daily flights Revenues 2011,
Passenger services 7,438 10,550 Cargo services 4,405 4,225 Catering and other services Turnover 1 12,275 15,511
 Cathay Pacific Airways Limited - 2003 Interim Results Consolidated Profit and Loss Account - Unaudited Six months ended 30th June 2003 2002 Note Passenger services 7,438 10,550 Cargo services 4,405 4,225
THAI AIRWAYS INTERNATIONAL PCL
 THAI AIRWAYS INTERNATIONAL PCL 1-March-2016 1 DISCLAIMER The information contained herein is intended to represent the Company s operating and financial position at a given point in time and may also contain
CATHAY PACIFIC AIRWAYS LIMITED (Incorporated in Hong Kong with limited liability) (Stock Code: 00293)
 (Stock Code: 00293)") Hong Kong Exchanges and Clearing Limited and The Stock Exchange of Hong Kong Limited take no responsibility for the contents of this announcement, make no representation as to its accuracy or completeness
Hong Kong Exchanges and Clearing Limited and The Stock Exchange of Hong Kong Limited take no responsibility for the contents of this announcement, make no representation as to its accuracy or completeness
FIRST QUARTER 2017 RESULTS. 4 May 2017
 FIRST QUARTER 2017 RESULTS 4 May 2017 A resilient start of the year, traffic up 4.2% 20.9 million passengers carried, up 5.2%, traffic (RPK) up 4.2%, capacity (ASK) up 3.3% and load factor up 0.7pts Confirmation
Air China Limited 2015 First Quarter Results
 Air China Limited 2015 First Quarter Results April 2015 Under PRC GAAP, unaudited Agenda Part 1 Part 2 Part 3 Results Highlights Business Performance Financial Review Part 1 Results Highlights Results
2007/08 Full Year Results Investor Briefing
 2007/08 Full Year Results Investor Briefing Highlights of Result Profit before tax up 46% to $1,408 million Up 36% on the reported result Margin improvement $3 billion of Sustainable Future Benefits achieved
FULL YEAR OPERATING PROFIT RISES TO $259 MILLION 25 CENTS SPECIAL DIVIDEND PROPOSED OUTLOOK REMAINS CHALLENGING
 8 May 2014 Page 1 of 5 No. 02/14 8 May 2014 FULL YEAR OPERATING PROFIT RISES TO $259 MILLION 25 CENTS SPECIAL DIVIDEND PROPOSED OUTLOOK REMAINS CHALLENGING GROUP FINANCIAL PERFORMANCE Financial Year 2013-14
Finnair Group Interim Report 1 January 30 June 2008
 Finnair Group Interim Report 1 January 30 June 2008 1 08/08/2008 Presentation name / Author Airline industry at a historical turning point Fuel price has a stranglehold on the business Average ticket prices
CATHAY PACIFIC AIRWAYS LIMITED (Incorporated in Hong Kong with limited liability) (Stock Code: 00293)
 (Stock Code: 00293)") Hong Kong Exchanges and Clearing Limited and The Stock Exchange of Hong Kong Limited take no responsibility for the contents of this announcement, make no representation as to its accuracy or completeness
Hong Kong Exchanges and Clearing Limited and The Stock Exchange of Hong Kong Limited take no responsibility for the contents of this announcement, make no representation as to its accuracy or completeness
Group First Half Account Settlement For FY2007
 JAL GroupFirst Half Account Settlement For FY2007 Nov 7 th 2007 Japan Airlines JAL 2007 1 Disclaimer Unless specifically dealing with matters of historical fact, the plans, forecasts and strategies described
Half Year and 2nd Quarter FY Financial Results 27 October 2005
 Half Year and 2nd Quarter FY2005-06 Financial Results 27 October 2005 Singapore Airlines Limited Company Registration No.: 197200078R Further information and media releases can be found at the Singapore
Cathay Pacific Airways Limited
 Cathay Pacific Airways Limited 2011 Interim Report Stock Code: 00293 Hong Kong Cathay Pacific Cathay Pacific Freighter Dragonair Air Hong Kong CONTENTS 2 Financial and Operating Highlights 3 Chairman s
ANA Group Announces Its Fiscal Year 2019 Flight Schedule
 ANA NEWS ANA Group Announces Its Fiscal Year Flight Schedule ANA plans to accelerate growth by expanding its international network. New state-of-the-art aircraft will be introduced to further improve passenger
JET AIRWAYS (I) LTD. Presentation on Financial Results Q3 2012
 LTD. Presentation on Financial Results Q3 2012") JET AIRWAYS (I) LTD Presentation on Financial Results Q3 2012 20.01.2012 1 1 1 Domestic operating environment 2 2 2 Domestic industry. 8.00 7.00 6.00 5.00 4.00 3.00 Q3 12 vs Q3 11 Industry capacity 17%
JET AIRWAYS (I) LTD Presentation on Financial Results Q3 2012 20.01.2012 1 1 1 Domestic operating environment 2 2 2 Domestic industry. 8.00 7.00 6.00 5.00 4.00 3.00 Q3 12 vs Q3 11 Industry capacity 17%
SECOND QUARTER OPERATING PROFIT IMPROVES TO $87 MILLION
 12 November 2013 Page 1 of 5 No. 05/13 12 November 2013 SECOND QUARTER OPERATING PROFIT IMPROVES TO $87 MILLION GROUP FINANCIAL PERFORMANCE Second Quarter 2013-14 The Group earned an operating profit of
July 2012 Passenger and Cargo Traffic Statistics Reno-Tahoe International Airport
 July 2012 Passenger and Cargo Traffic Statistics Reno-Tahoe International Airport August 31, 2012 U.S. DOMESTIC INDUSTRY OVERVIEW FOR JULY 2012 All RNO Carriers Systemwide year over year comparison Average
SAS Group Asia Tour Financial Hearing Presentation May 14, 2012
 SAS Group Asia Tour Financial Hearing Presentation May 14, 2012 1 This is the SAS Group 128 destinations 27,2 million passengers 28 new routes to be launched 2012 1,085 daily flights Revenues 2011, MSEK
CATHAY PACIFIC AIRWAYS LIMITED (Incorporated in Hong Kong with limited liability)
") Annual results announcement Annual Results CATHAY PACIFIC AIRWAYS LIMITED (Incorporated in Hong Kong with limited liability) (Stock Code: 00293) Financial and Operating Highlights Group Financial Statistics
Annual results announcement Annual Results CATHAY PACIFIC AIRWAYS LIMITED (Incorporated in Hong Kong with limited liability) (Stock Code: 00293) Financial and Operating Highlights Group Financial Statistics
THIRD QUARTER OPERATING PROFIT UP 13% TO $330 MILLION
 13 February 2018 Page 1 of 7 ` No. 01/18 13 February 2018 THIRD QUARTER OPERATING PROFIT UP 13% TO $330 MILLION Higher carriage and load factors for all passenger airlines Strong earnings for SIA Cargo
Cathay Pacific Airways Limited. Stock Code: Interim Report
 Cathay Pacific Airways Limited Stock Code: 00293 2013 Interim Report Hong Kong Cathay Pacific Cathay Pacific Freighter Dragonair Air Hong Kong Contents 2 Financial and Operating Highlights 3 Chairman s
Cebu Air, Inc. 4 th Quarter and Full Year 2017 Results of Operations. cebupacificair.com
 Cebu Air, Inc. 4 th Quarter and Full Year 2017 Results of Operations cebupacificair.com Disclaimer The information provided in this presentation is provided only for your reference. Such information has
Cathay Pacific Vantage Pass 2019
 Cathay Pacific Vantage Pass 2019 1. Select the destination for your first round-trip ticket. Note the distance zone, preferred class and fare. 2. Select the destination for your second round-trip ticket.
Advancing World-Class Service
 Aviation Division Advancing World-Class Service We aim to continue to improve our products and services on the ground and in the air, to strengthen our aircraft engineering business and to expand our fleet
Air China Limited Announces 2010 Annual Results
 Air China Limited Announces 2010 Annual Results Profit reaches record high on strong economic growth Hong Kong March 29, 2011 Air China Limited ( Air China or the Company, together with its subsidiaries,
Forward looking statements
 Forward looking statements This presentation contains forward-looking statements. Forward-looking statements often include words such as anticipate", "expect", "intend", "plan", "believe, continue or similar
Q Analyst & investor presentation. 22 January 2019
 Q1 2019 Analyst & investor presentation 22 January 2019 Q1 performance Overview 1. Positive underlying revenue trend Robust demand across Europe Strong ancillary revenue performance Moderate competitor
SAS AB Analyst meeting
 SAS AB Analyst meeting London, August 9, 2001 2 2nd Quarter a tough Quarter The Marketplace Continued weak world economy Weaker Swedish economy SAS Weaker traffic growth and reduced passenger load factors
Cathay Pacific Airways Limited
 Cathay Pacific Airways Limited Interim Report Stock Code: 00293 Hong Kong Cathay Pacific Cathay Pacific Freighter Dragonair Air Hong Kong CONTENTS 2 Financial and Operating Highlights Corporate Information
CATHAY PACIFIC AIRWAYS LIMITED (Incorporated in Hong Kong with limited liability) (Stock Code: 00293)
 (Stock Code: 00293)") Hong Kong Exchanges and Clearing Limited and The Stock Exchange of Hong Kong Limited take no responsibility for the contents of this announcement, make no representation as to its accuracy or completeness
Hong Kong Exchanges and Clearing Limited and The Stock Exchange of Hong Kong Limited take no responsibility for the contents of this announcement, make no representation as to its accuracy or completeness
September 2013 Passenger and Cargo Traffic Statistics Reno-Tahoe International Airport
 September 2013 Passenger and Cargo Traffic Statistics Reno-Tahoe International Airport October 31, 2013 U.S. DOMESTIC INDUSTRY OVERVIEW FOR SEPTEMBER 2013 All RNO Carriers Systemwide year over year comparison
THIRD QUARTER 2017 RESULTS 3 rd of November 2017
 THIRD QUARTER 2017 RESULTS 3 rd of November 2017 2017 THIRD QUARTER 2017: STRONG OPERATING RESULT DRIVEN BY SOLID TRAFFIC AND INCREASE IN UNIT REVENUE Robust Group traffic statistics +5.1% +4.1% Strong
SAS Group Q Teleconference
 SAS Group Q4 2012 Teleconference December 12, 2012 1 Break-even result in 2012 despite 1.6 bn SEK higher fuel cost 23 MSEK EBT (before non-recurring items) despite 1.6 bn SEK higher fuel cost Positive
Third Quarter 2014 Results. 29 October 2014
 Third Quarter 2014 Results 29 October 2014 Highlights of the Third Quarter Operating environment Air France-KLM Economic environment remains weak Further currency volatility affecting revenues and results
December 2011 Passenger and Cargo Traffic Statistics Reno-Tahoe International Airport
 December 2011 Passenger and Cargo Traffic Statistics Reno-Tahoe International Airport January 27, 2012 U.S. DOMESTIC INDUSTRY OVERVIEW FOR DECEMBER 2011 All RNO Carriers Systemwide year over year comparison
JAL Group s Q3 Account Settlement for FY2003
 JAL Group s Q3 Account Settlement for FY2003 - Analyst Briefing - February 9, 2004 Japan Airlines System Corporation 0 JAL 2004 Contents Contents Defects of Engines for MD81/87 Aircraft Topics Outline
State of the Aviation Industry
 State of the Aviation Industry Presentation to the ACI Airport Economics & Finance 10 th 11 th February London, United Kingdom Laurie N. Price Director of Aviation Strategy Mott MacDonald Aviation Current
Cebu Air, Inc. Annual Stockholders Briefing. 24 June cebupacificair.com
 Cebu Air, Inc. Annual Stockholders Briefing 24 June 2015 cebupacificair.com Business Updates Passengers (M) Operating Statistics 2014: Passenger traffic grew 17.5% to 16.9M. Seat capacity grew 14.8% to